Article

Improving Texture and Microstructure Homogeneity in High-Purity Ta Sheets by Warm Cross Rolling and Annealing

1
College of Materials Science and Engineering, Chongqing University, No. 174 Shazheng Street, Shapingba District, Chongqing 400044, China
2
Electron Microscopy Center of Chongqing University, Chongqing University, Chongqing 400044, China
3
School of Metallurgy and Material Engineering, Chongqing University of Science and Technology, Chongqing 401331, China
4
Division of Materials Engineering LTH, Lund University, 22363 Lund, Sweden
*
Authors to whom correspondence should be addressed.
Metals 2021, 11(11), 1665; https://doi.org/10.3390/met11111665
Submission received: 6 September 2021 / Revised: 14 October 2021 / Accepted: 15 October 2021 / Published: 20 October 2021

Abstract

:
The evolution of texture and microstructure uniformity in high-purity tantalum (Ta) sheets during 135° warm cross rolling (WCR) was analyzed in detail. X-ray diffraction suggested that relatively uniform ‘ideal’ deformation texture distribution across the thickness could be obtained from WCR, since more potential slip systems could be activated. Electron backscatter diffraction (EBSD) results indicated that the change in strain path in warm rolling could enhance dislocations mobility and increase the probability of dislocations rearrangement and annihilation. Thus, the proportion of low-angle grain boundaries was significantly reduced, and more sub-grain boundaries or sub-grains were formed via WCR. The calculation of geometrically necessary dislocation density based on the strain gradient model supports this result. The analysis of relative Schmid factor combined with the strain contouring map indicated that inhomogeneous orientation-dependent grain subdivision could be effectively weakened, and relatively uniform strain distribution could be formed in the WCR sample. Upon annealing, uniform fine grain size and more randomly oriented grains were obtained in the WCR sample after the completion of recrystallization because of relatively uniform grain subdivision and stored energy distribution.

1. Introduction

High-purity Ta with a body-centered cubic (bcc) structure has attracted more and more attention in the field of sputtering targets owing to its high conductivity, thermal stability, high melting point and excellent corrosion resistance [1]. With the prosperity of the chip market and chip manufacturing industry, higher requirements have emerged for the sputtering targets used in semiconductor-metal interconnects. The distribution of grain size and crystal orientation within high-purity Ta target directly affects the sputtering performance and the service life of the target. In other words, homogeneous microstructure, i.e., fine uniform grain size and random crystal orientation, of a high-purity Ta target can significantly improve the uniformity of sputtering film [2,3,4].
Electron beam melting (EBM) is the preferred method for manufacturing high-purity Ta ingots because of excellent density and purification advantages compared to powder metallurgy [5,6]. Unfortunately, Ta ingots prepared by EBM have significant weaknesses including coarse grain size and extremely strong texture [6,7,8]. After subsequent processing, such as traditional rolling and annealing, texture bands, residual deformation bands and uneven grain size distribution are typical features in Ta plates [9,10,11].
Recent studies by our team [9,10,11,12] revealed that a change in strain path during rolling, i.e., 135° cross rolling, can efficiently refine grain size, weaken texture intensity and even eliminate residual deformation bands in high-purity Ta plates. On the other hand, numerous studies [13,14,15] have shown that warm rolling also has an important effect on regulating and controlling the evolution of microstructure and texture. Jiao et al. [13] found that the nucleation of cubic grains ({100}<001>) was weakened, and the Gaussian plane ({110}<001>) was enhanced in silicon steel after warm rolling, which helped in refining grains and obtaining the required texture distribution. Li et al. [14] reported that warm cross rolling combined with annealing could improve the conductivity of AA7075 alloy and reduce the anisotropy of tensile strength because of effective weakening of deformation texture intensity in brass, Dillamore and Gaussian. Hao et al. [15] adopted combined processing technology, i.e., warm forging and warm rolling, to refine grains in a titanium alloy. Their results showed that uniform microstructure could be obtained by a warm rolling process, including the precipitation of phases with grain sizes less than 200 nm and even nano-sized.
It should also be mentioned that Ta is a metal with high stacking fault energy, and dislocations are prone to climbing and cross-slip [16,17]. Therefore, most of the stored energy, up to 70%, is released in the recovery stage [18]. Clearly, recovery plays a great influence in the recrystallization behavior of Ta. The DSC experiment [18] showed that the recovery temperature of Ta is approximately 800 °C. Note that recrystallization is not initiated, and recovery only occurs during warm rolling rather than hot rolling. Thus, by combining 135° cross rolling and warm rolling, we expect to improve the uniformity of stored energy distribution in the deformed matrix, and to obtain a better combination of microstructure and texture in Ta sheets.
In the present work, a new rolling technique for Ta-foils, i.e., warm rolling combined with 135° cross rolling, is designed. The purpose of this paper is to investigate the effect of warm cross rolling on the homogeneity of the texture and microstructure.

2. Experimental Method

2.1. Materials and Rolling Procedure

A Ta ingot prepared via EBM was processed with multi-directional forging to break coarse columnar crystals, and the chemical composition was as displayed in Ref. [10]. Two round Ta plates with a thickness of 12 mm were cut from the Ta ingot and then annealed at 1050 °C for 3 h in vacuum to obtain a fully recrystallized microstructure. Before rolling, the sample was reheated to 800 °C and isothermally held for 30 min. The first group of samples was processed by 135° warm cross rolling (WCR). During the WCR process, the rolling direction (RD) was rotated 135° counterclockwise in the horizontal plane relative to each previous pass. More details on 135° cross rolling are described in Ref. [11]. After rolling for eight passes, the plate was re-heated in the furnace for 10 min and then rolled for another four passes, so that the total rolling strain was ultimately maintained at 70%. The detailed rolling parameters are summarized in Table 1. The other group of samples was rolled unidirectionally at 800 °C. During the warm unidirectional rolling (WUR) process, the rolling direction remained unchanged, and the other parameters were kept the same as the first group. The schematic diagram of the metal working process can be found in Figure 1.
The rolled Ta sheets were annealed at 1100 °C for 5 and 30 min to observe the evolution of the microstructure during recrystallization. Argon gas was used as a protective atmosphere during annealing, and the samples were water-quenched rapidly after the completion of the annealing.

2.2. Characterization Methods

The macrotexture of the rolled sample was determined using an X-ray diffractometer (XRD, Rigaku D/max 2500PC, Tokyo, Japan). Cu Kα radiation was used in the test, and the accelerating voltage and current were 40 kV and 150 mA, respectively. Four incomplete pole Figures {110}, {200}, {211} and {222} were recorded using the Schulz reflection method, and the orientation distribution function (ODF) was calculated using arbitrarily defined cells (ACD) method [19]. The detection regions were near-surface, quarter-thickness, and center layers on the ND plane of all specimens tested. To minimize the effect of mechanical grinding during specimen preparation on measurements, samples were electropolished in a solution of 10 vol% hydrofluoric acid and 90 vol% sulfuric acid. The XRD data was processed and analyzed using Labo Tex 3.0 software.
The microstructure of the deformed and recrystallized samples was characterized with a Tescan Mira 3 field-emission scanning electron microscope equipped with an electron backscatter diffraction (EBSD) detector (TESCAN, Oxford, UK). EBSD studies were carried out at an accelerating voltage of 20 kV and a working distance of 14 mm. The specimen preparation procedure was the same as that for XRD, and the analysis region was kept near the center layer in the transverse direction (TD) plane of the specimen. The experimental data from EBSD was processed and analyzed using HKL Channel 5 software (5.0.9.0, Oxford Instrument, Oxford, UK).

3. Results

3.1. Initial Texture and Grain Size Distribution

The texture of the as-received Ta plate along the thickness processed by multi-directional forging and annealing is presented according to ODFs in Figure 2. It can be found from Figure 2a–c that the distribution and intensity of the texture along the plate thickness was extremely uneven. The maximum texture density, Fmax, of the surface and center layers was 11.8 and 12.1, respectively, while the maximum texture intensity of the center layer reached 25.7. Note that the initial Ta ingot used in this experiment was prepared using EBM technology, which usually contains coarse columnar grains that can reach centimeter-scale level because of the gradient distribution of heat along the ingot height during smelting [6,7,8]. Although multi-directional forging was used to break the initial as-cast columnar structure of the Ta ingot, the texture distribution was still relatively concentrated. Orientation clusters easily occurred in the different thickness layers of the Ta plate, which suggests a relatively small number of grains within the X-ray beam during scanning.
Figure 3 shows the distribution of grain sizes in the as-received Ta plate. The grain structure in the Ta plate treated by forging followed by annealing was also relatively uneven, which is consistent with the observations from X-ray texture measurements. The average grain size was 91.5 μm, and the maximum grain size reached 455.9 μm. The coarse grain and inhomogeneous size distribution could significantly destroy the sputtering performance of a Ta target [2].

3.2. Deformation Texture

The deformation texture of Ta sheets along the thickness as processed by warm unidirectional rolling i.e., WUR and 135° warm cross rolling i.e., WCR is presented according to ODFs in Figure 4. The typical rolling texture of BCC metals can be summarized as follows: α-fiber texture, i.e., <110> parallel to RD, θ-fiber texture, i.e., <100> parallel to ND, γ-fiber texture, i.e., <111> parallel to ND and ζ-fiber texture, i.e., <110> parallel to ND [20]. It can be observed that a strong ζ-fiber texture, focused around {011}<100> Goss orientation, formed in the surface layers of both WUR and WCR samples, while Fmax reached the intensities of 16.0 and 13.6, respectively. These indicate strong shear strain in the surface of warm-rolled samples, which can be associated with contact friction. The shear strain in the center of rolled sample was relatively weak, i.e., grains in the center layer were more likely to be subjected to plane-strain compression [21,22]. The number of active slip systems in WUR sample could be less than that in WCR sample, and a typical γ-fiber and α-fiber texture was gradually formed with the increase of strain level [10]. Due to the continuous change in the strain path in WCR, more potential slip systems can be activated [23,24]. The crystal orientation of grains with different orientation constantly changed owing to the rotation of the sample, and relatively stable γ-fiber and θ-fiber textures could be developed. In the quarter-thickness layer of rolled Ta sheet, the shear strain was greater than that in the center, and the grains were not in a strict plane-strain state. A random texture could be easily formed in the rolling process, and Fmax was low. Overall, a relatively uniform and ideal deformation texture was formed in the WCR sample along its thickness.

3.3. Deformation Microstructure

Figure 5 shows the ND inverse pole Figure (IPF) maps of WUR and WCR samples. Maps shown in Figure 5a,b are dominated by crystal orientations {111} and {100}. However, volume fractions and spatial distributions of {111} and {100} oriented grains were very different in WUR and WCR samples. The deformed {111} and {100} grains were distributed alternately in the WCR sample, while the WUR sample was dominated by {111} grains. These observations are very consistent with the XRD results. Further analysis suggests that in the WUR sample the grain boundaries were relatively straight and parallel to RD, while the spacing between them in ND was rather coarse at the scale of several tens of micrometers. The deformed grains in the WCR sample were much more slender, and the grain boundaries were relatively curved. Numerous high angle grain boundaries occurred in deformed {111} grains in the WUR sample (see black lines in Figure 5a) indicating very heterogeneous grain fragmentation. By contrast, grains deformed relatively evenly with no particularly severe subdivision and a more homogeneous orientation color in the interiors of deformed grains in the WCR sample; see ND IPF map in Figure 5.
Figure 6 displays the statistical grouped distribution of the misorientation angle in the WUR and WCR samples. The proportion of low-angle grain boundaries (1.5–5°) in the WUR sample was higher than that in the WCR. This can be explained by the type of slip system changing significantly between sequential rolling paths during the WCR process. This processing route introduces partial reversal of strain, which can increase the probability of dislocation re-arrangement and annihilation [25,26,27,28,29]. Note that in warm rolling, the Peierls stress to be overcome by dislocation movement is reduced due to the increase in rolling temperature and the enhancement in thermal activation contributing to an increase in dislocation movement rate [30]. The synergistic action of these two factors, i.e., the change in strain path and the increase in rolling temperature, could further accelerate the movement of dislocations, improve the probability of dislocations rearrangement and annihilation, and thus significantly reduce the proportion of low-angle grain boundaries in the WCR sample. The decrease in low-angle grain boundary fraction suggests more sub-grain boundaries (5–10°) or sub-grains were formed in the WCR sample. It should also be mentioned that a strong {111} deformation texture was formed at the center of the WUR sample, and deformed grains were relatively coarse. Previous experiments [10,31,32] revealed that the degree of grain subdivision within the deformed {111} grains in Ta sheets after unidirectional cold-rolling was high. Heterogeneous plastic deformation in deformed {111} grains can result in a large number of low-angle boundaries and high dislocation density in the WUR sample.

3.4. Recrystallization Microstructure

Figure 7 displays the microstructures of WUR and WCR samples after annealing at 1100 °C for 30 min. It can be clearly seen that both samples were in a fully recrystallized state. The average size of grains in the WCR sample was relatively uniform and virtually independent on orientation; see Figure 7c. In the WUR sample, the average size of grains significantly depended on orientation with the highest variation found between {111} and {100}. The volume fraction of randomly oriented grains was higher in the WCR sample, while the difference between the fractions of {111} and {100} texture components is relatively low. By contrast, a strong {111} texture component formed in the WUR sample after the completion of recrystallization.

4. Discussion

4.1. GNDs Distribution

To quantitatively analyze deformation behavior and subdivision within {111} and {100} grains in the deformed samples, local orientation differences obtained from EBSD data were used. The densities of geometrically necessary dislocations (GNDs, ρ G N D ) were computed in this paper. The quantitative analysis of GNDs mainly depends on the calculation of the dislocation density tensor proposed by Nye. The estimate of GNDs density is based on the misorientation angle between measured points with known distance x [33,34]. Kröner [35] showed that GNDs are intimately related to the elastic strain field and lattice curvature. Wilkinson and Randman [36] demonstrated that the contribution from the elastic strain part is substantially smaller than from the lattice rotation. Based on the strain gradient model, the method proposed by Kubin and Mortensen was introduced to relate the misorientation angle θ to the density of GNDs according to the following equation [37]:
ρ G N D = αθ bx
where α is a constant equal to 2, i.e., the pure tilt boundary in this study; θ is the value of the misorientation angle; b is the Burgers vector, i.e., 0.286 nm for Ta; x is the unit length (100 nm). Figure 7 displays estimated distribution of GNDs density within deformed {111} and {100} grains according to local misorientation from the EBSD data. Note that the calculation of GNDs density was performed using MATLAB software. As shown in Figure 8, the average GNDs densities in deformed {111} and {100} grains were 16.1 × 10¹⁴ m−2 and 5.7 × 10¹⁴ m−2, respectively, in the WUR sample, and 13.0 × 10¹⁴ m−2 and 5.4 × 10¹⁴ m−2 in the WCR one. Clearly, the density of GNDs in the deformed grains of the WCR sample was effectively reduced compared to the WUR sample, especially in deformed {111} grains. Note that dynamic recovery (DRV) can occur in warm rolling. DRV of dislocations mainly refers to the gradual evolution of cell structures generated in deformation into sub-grains by dislocation rearrangement and annihilation. The change in strain path in warm rolling seems to increase the rate of dislocations movement and to improve the probability of dislocations rearrangement and annihilation. This could effectively reduce the fraction of GNDs density in the WCR samples. In other words, the increase in dislocation rearrangement and annihilation probability is beneficial for the formation of sub-grains.

4.2. Analysis of Schmid Factor and Strain Distribution

The Schmid factor can be used to qualitatively determine the activation of a slip system during the analysis of micro-plastic deformation mechanism in metallic materials. The stress state in the deformation of Ta sheet during rolling can be simplified to bi-axial load, i.e., compressive stress along ND direction and tensile along RD. In our calculations, the Schmid factor was used to analyze the number of operating {110}<111> and {112}<111> slip systems (24 possible slip systems in bcc metals) in the WUR and WCR samples. In general, the calculation of the Schmid factor under complex stress states obtained by the combination of the two stresses is as follows [38]:
SFrolling = (cosϕ × cosγ − cosφ × cosλ)/2
where ϕ or γ are the angles between the direction of friction force and the normal direction or slip direction in the slip plane; and φ or λ are the angles between the direction of compression force and the normal direction or slip direction in the slip plane. Note that a relative Schmid factor, i.e., (Sm − Ss) × Ss−1 × 100, namely the relative variation between the maximum Schmid factor (Sm) and the secondary Schmid factor (Ss), was introduced to further evaluate the activation of different slip systems [10,11,31]. A higher relative Schmid factor indicates that only a few slip systems can be activated in rolling deformation, while multiple slip systems can operate if the relative Schmid factor is low. In the WUR sample (Figure 9a,b) the relative Schmid factor was higher in the deformed {111} grains (could even reach 26), but was mainly distributed between 2 and 4 in {100} grains. By contrast, the difference in the relative Schmid factor between the deformed {111} and {100} grains was significantly lower in the WCR sample. Specifically, the relative Schmid factor was mainly between 6 and 18 in {111} grains, and in the range of 2 to 14 in {100} ones. The larger difference in relative Schmid factor between {111} and {100} grains suggests more heterogeneous orientation-dependent subdivision of grains in the WUR sample. Since multiple slip systems can operate in grains simultaneously, the alteration of plastic deformation directions (e.g., WCR route in this study) makes the generation of dislocations more discrete and uniform. Such considerations agree well with the intensity and uniformity of texture in this study. Gurao et al. [39] also reported that the average number of activated slip systems in cross rolling is higher than that in unidirectional rolling, which intensifies the interaction of different slip systems. Since critical resolved shear stress (CRSS) is temperature dependent, its variation between different slip systems can also be reduced in warm rolling. Therefore, a large number of possible slip systems can operate during WCR due to the changes in load direction with the change in strain path.
Macroscopic deformation of metallic materials is typically assumed to be homogeneous, but inhomogeneity of microstructure usually makes local strains in the material significantly heterogeneous. As can be seen in Figure 10, in the WUR sample local strains concentrated mainly in {111} grains, while strain contouring in {100} grains was negligibly small, which indicates uneven strain distribution. This was most likely caused by just a few slip systems operating in {111} grains, which resulted in strong strain concentration, while many slip systems were active in {100} grains leading to uniform deformation. Ultimately, this resulted in orientation-dependent uneven strain distribution. However, the effect of orientation-dependent inhomogeneity in the microstructure can be reduced by multi-directional strain, which can be obtained in WCR processing. Namely, local strains can be efficiently homogenized by activating a relatively uniform number of slip systems in {111} and {100} grains. In WCR processing, the strain field can be homogenized by changing the direction of applied load in the Ta sheet with each rolling pass, which is reflected in reduced heterogeneity of micro-strain distribution.

4.3. Homogeneity of the Recrystallization Microstructure

To reveal the onset of recrystallization, both WUR and WCR samples were annealed at 1100 °C for 5 min. The respective microstructures are shown in Figure 11. It can be seen that partial recrystallization occurred in both samples. However, the degree of recrystallization in the WCR sample was lower, and the size of recrystallized grains was finer, as can be found from comparing the EBSD maps in Figure 11a,b. Further observations suggest that in the WCR sample the recrystallized grains had relatively random orientations and more even spatial distribution in the deformed matrix. By contrast, recrystallized {111} grains in the WUR sample formed significant clusters, as indicated by yellow elliptic regions in Figure 11a.
As mentioned above, in warm rolling sub-grains can be formed in a deformed matrix through the thermal activation of vacancy diffusion, dislocation motion (slip, climb) and rearrangement accompanied by the release of stored energy. Grains deformed unevenly in WUR with {111} grains subdividing significantly faster than their {100} counterparts. The inhomogeneous orientation-dependent subdivision of grains can also be reflected in the uneven distribution of stored energy. In the WUR process, dynamic recovery appeared preferentially in deformed {111} grains, ultimately leading to heterogeneous grain size distribution and clusters of {111} orientations. However, the inhomogeneity of orientation-dependent subdivision of grains could be efficiently reduced to obtain a relatively uniform strain distribution in WCR processing. As a result of rather uniform fragmentation of microstructure and distribution of stored energy, recrystallized sub-grains also distributed more evenly in the deformed matrix without segregation or orientation clustering. More randomly oriented grains formed and the difference in grain sizes depending on orientation was minimized in WCR after recrystallization.

5. Conclusions

The purpose in this work was to investigate the effect of warm cross rolling on the homogeneity of texture and microstructure after deformation and recrystallization. The main conclusions can be summarized as follows:
1)
A strong texture gradient existed across different thickness layers in the initial Ta plates prepared by forging and annealing. After 135o warm cross rolling, relatively uniform and ideal deformation texture distribution along sheet thickness could be obtained.
2)
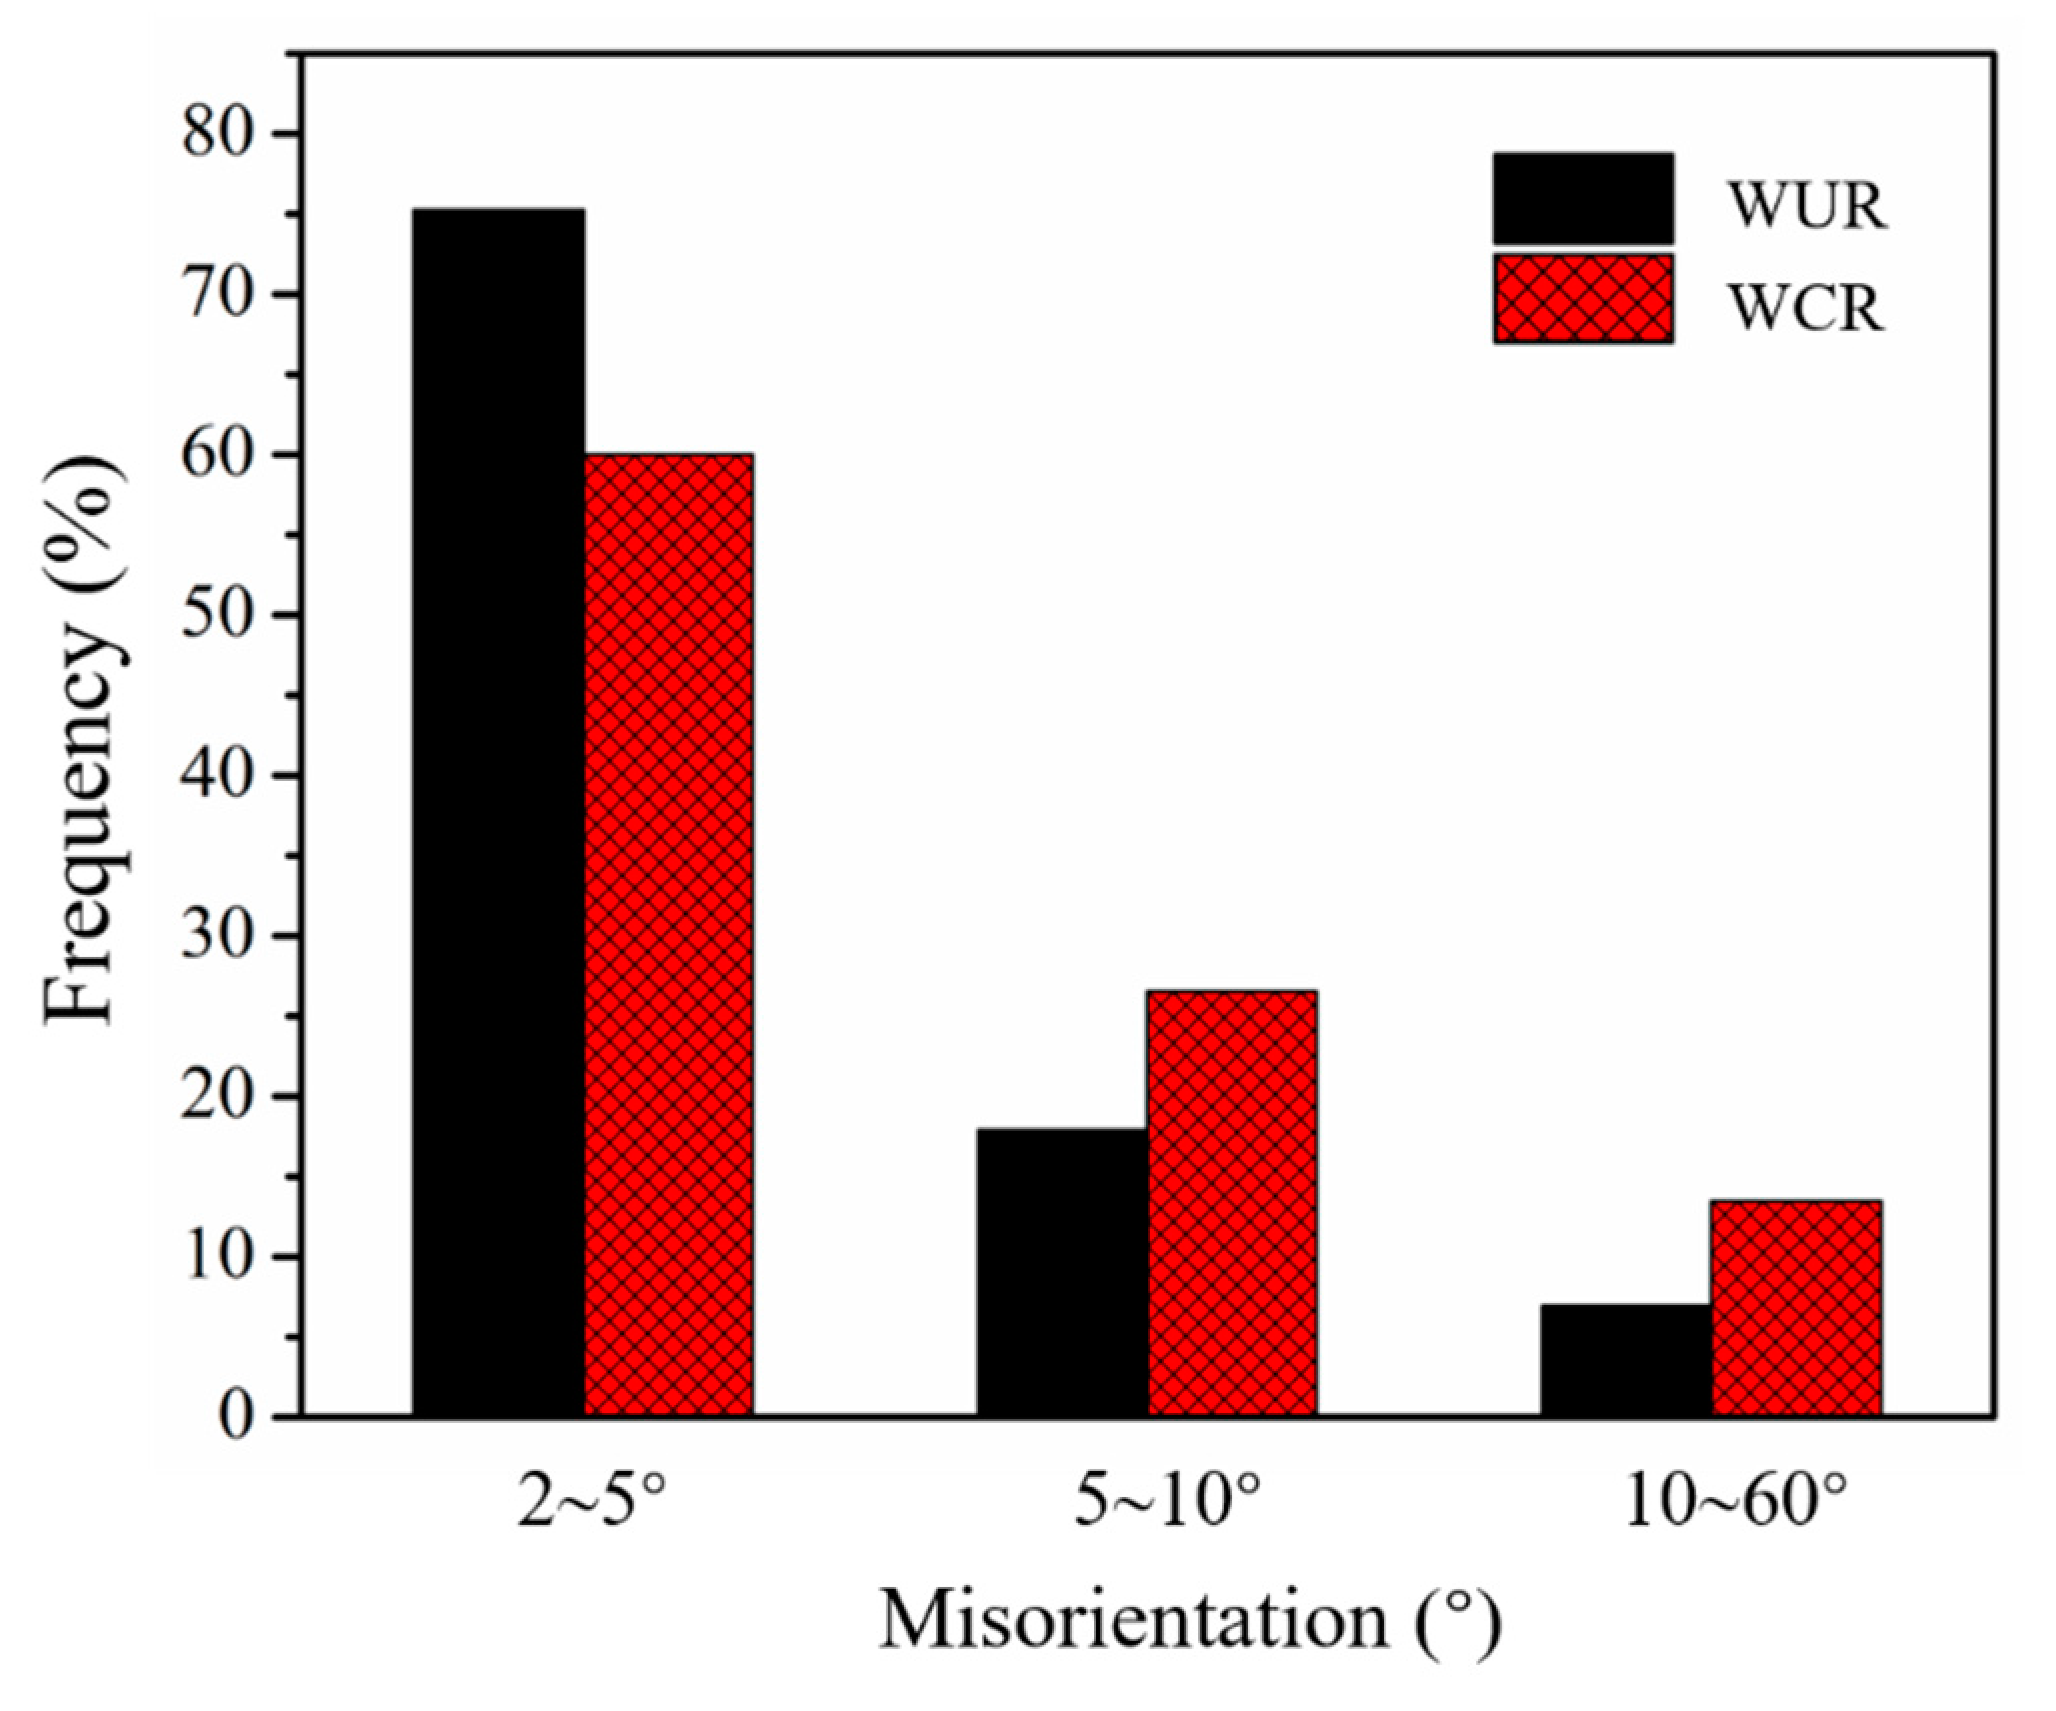
The change in strain path combined with warm rolling could accelerate the rate of dislocation movement, increase the probability of dislocations rearrangement and annihilation, and thus significantly reduce the fraction of low-angle grain boundaries in WCR processing. Corresponding distribution of geometrically necessary dislocations (GNDs) further confirmed this result.
3)
Analysis of the Schmid factor and comparison with strain contouring maps suggested that the localization of strains could be efficiently reduced by the operation of a relatively uniform number of slip systems within deformed {111} and {100} grains in WCR.
4)
Grains with more uniform in size and more randomly oriented were formed during recrystallization after WCR due to reasonably uniform fragmentation in the microstructure and distribution of stored energy.

Author Contributions

Data curation, D.L. and J.Z.; Supervision, Y.L., S.Z. and X.Y.; Writing—original draft, D.L.; Writing—review & editing, S.L., J.Z. and D.O. All authors have read and agreed to the published version of the manuscript.

Funding

The present work was co-supported by the National Natural Science Foundation of China (grants 51421001 and 51701032), the Venture & Innovation Support Program for Chongqing Overseas Returnees(cx2020088), the Chongqing Science and Technology Commission in China (Grant No.cstc2019jcyj-msxmX0132), and the Major “Scientific and Technological Innovation 2025” Project of Ningbo (No. 2018B10066).

Data Availability Statement

The raw processed data required to reproduce these findings cannot be shared at this time as the data also forms part of an ongoing study.

Acknowledgments

This research was funded by National Natural Science Foundation of China, grant number 51421001, Venture and Innovation Support Program for Chongqing Overseas Returnees, grant number 2020088, Chongqing Science and Technology Commission in China, grant number cstc2019jcyjmsxmX0132 and Major “Scientific and Technological Innovation 2025” Project of Ningbo, grant number 2018B10066.

Conflicts of Interest

The authors declare no conflict of interest.

References

  1. Cardonne, S.M.; Kumar, P.; Michaluk, C.A.; Schwartz, H.D. Tantalum and its Alloys. Int. J. Refract. Met. Hard. Mater. 1993, 13, 187–194. [Google Scholar] [CrossRef]
  2. Michaluk, C.A. Correlating discrete orientation and grain size to the sputter deposition properties of tantalum. J. Electron. Mater. 2002, 31, 2–9. [Google Scholar] [CrossRef]
  3. Wickersham, C.E. Crystallographic target effects in magnetron sputtering. J. Vac. Sci. Technol. A 1987, 5, 1755–1758. [Google Scholar] [CrossRef]
  4. Dunlop, J.A.; Yuan, J.; Kardokus, J.K.; Emigh, R.A. Sputtering Target with Ultra-Fine, Oriented Grains and Method of Making Same. U.S. Patent 5780755A, 14 July 1998. [Google Scholar]
  5. Choi, G.S.; Lim, J.W.; Munirathnam, N.R.; Kim, I.H.; Kim, J.S. Preparation of 5N grade tantalum by electron beam melting. J. Alloys Compd. 2009, 469, 298–303. [Google Scholar] [CrossRef]
  6. Sandim, H.; Martins, J.P.; Pinto, A.L.; Padilha, A.F. Recrystallization of oligocrystalline tantalum deformed by cold rolling. Mater. Sci. Eng. A 2005, 392, 209–221. [Google Scholar] [CrossRef]
  7. Briant, C.L.; Macdonald, E.; Balliett, R.W.; Luong, T. Recrystallization textures in tantalum sheet and wire. Int. J. Refract. Met. Hard Mater. 2000, 18, 1–8. [Google Scholar] [CrossRef]
  8. Sandim, H.R.Z.; Martins, J.P.; Padilha, A.F. Orientation effects during grain subdivision and subsequent annealing in coarse-grained tantalum. Scripta Mater. 2001, 45, 733–738. [Google Scholar] [CrossRef]
  9. Deng, C.; Liu, S.F.; Fan, H.Y.; Hao, X.B.; Ji, J.L.; Zhang, Z.Q.; Liu, Q. Elimination of Elongated Bands by Clock Rolling in High-Purity Tantalum. Metall. Mater. Trans. A 2015, 46, 5477–5481. [Google Scholar] [CrossRef]
  10. Zhu, J.L.; Liu, S.F.; Yuan, X.L.; Liu, Q. Comparing the Through-Thickness Gradient of the Deformed and Recrystallized Microstructure in Tantalum with Unidirectional and Clock Rolling. Materials 2019, 12, 169. [Google Scholar] [CrossRef] [PubMed] [Green Version]
  11. Zhu, J.L.; Liu, S.F.; Long, D.D.; Orlov, D.; Liu, Q. Pass number dependence of through-thickness microstructure homogeneity in tantalum sheets under the change of strain path. Mater. Charact. 2020, 160, 110076. [Google Scholar] [CrossRef]
  12. Zhu, J.; Liu, S.; Yang, S.; Long, D.; Liu, Y.; Yuan, X.; Orlov, D. Strain dependence of deformation and recrystallization microstructure homogeneity in clock-rolled tantalum sheets. Mater. Charact. 2020, 161, 110165. [Google Scholar] [CrossRef]
  13. Jiao, H.T.; Xu, Y.B.; Zhao, L.Z.; Misra, R.D.; Tang, Y.C.; Zhao, M.J.; Liu, D.J.; Hu, Y.; Shen, M.X. Microstructural evolution and magnetic properties in strip cast non-oriented silicon steel produced by warm rolling. Mater. Charact. 2019, 156, 109876. [Google Scholar] [CrossRef]
  14. Li, Z.G.; Liang, C.; Tang, J.W.; Sun, W.C.; Zhao, G.Q.; Zhang, G.S. Improving mechanical anisotropy and corrosion resistance of extruded AA7075 alloy by warm cross rolling and annealing. J. Alloys Compd. 2021, 863, 158725. [Google Scholar] [CrossRef]
  15. Hao, Y.L.; Zhang, Z.B.; Li, S.J.; Yang, R. Microstructure and mechanical behavior of a Ti–24Nb–4Zr–8Sn alloy processed by warm swaging and warm rolling. Acta Mater. 2012, 60, 2169–2177. [Google Scholar] [CrossRef]
  16. Ebrahimi, F.; Ahmed, Z.; Li, H.Q. Effect of stacking fault energy on plastic deformation of nanocrystalline face-centered cubic metals. Appl. Phys. Lett. 2004, 85, 3749–3751. [Google Scholar] [CrossRef]
  17. Pegel, B. Stacking Faults on {110} Planes in the B.C.C. Lattice. Phys. Status Solidi B 1968, 28, 603–609. [Google Scholar] [CrossRef]
  18. Deng, C.; Liu, S.F.; Hao, X.B.; Ji, J.L.; Zhang, Z.Q.; Liu, Q. Orientation dependence of stored energy release and microstructure evolution in cold rolled tantalum. Int. J. Refract. Met. Hard Mater. 2014, 46, 24–29. [Google Scholar] [CrossRef]
  19. Pawlik, K. Determination of the orientation distribution function from pole figures in arbitrarily defined cells. Phys. Stat. Sol. (b) 1986, 134, 477–483. [Google Scholar] [CrossRef]
  20. Zhu, J.L.; Liu, S.F.; Long, D.D.; Zhou, S.Y.; Zhu, Y.L.; Orlov, D. The evolution of texture and microstructure uniformity in tantalum sheets during asymmetric cross rolling. Mater. Charact. 2020, 168, 110586. [Google Scholar] [CrossRef]
  21. Choi, C.H.; Kwon, J.W.; Oh, E.H. Analysis of deformation texture inhomogeneity and stability condition of shear components in f.c.c. metals. Acta Mater. 1997, 45, 5119–5128. [Google Scholar] [CrossRef]
  22. Engler, O.; Tomé, C.; Huh, M.Y. A study of through-thickness texture gradients in rolled sheets. Metall. Mater. Trans. A 2000, 31, 2299–2315. [Google Scholar] [CrossRef]
  23. Madhavan, R.; Nagaraju, S.; Suwas, S. Texture Evolution in Nanocrystalline Nickel: Critical Role of Strain Path. Metall. Mater. Trans. A 2015, 46, 915–925. [Google Scholar] [CrossRef]
  24. Mishra, S.; Kulkarni, K.; Gurao, N.P. Effect of crystallographic texture on precipitation induced anisotropy in an aluminium magnesium silicon alloy. Mater. Des. 2015, 87, 507–519. [Google Scholar] [CrossRef]
  25. Fan, H.Y.; Liu, S.F.; Li, L.J.; Deng, C.; Liu, Q. Largely alleviating the orientation dependence by sequentially changing strain paths. Mater. Des. 2016, 97, 464–472. [Google Scholar] [CrossRef]
  26. Deng, C.; Liu, S.F.; Ji, J.L.; Hao, X.B.; Zhang, Z.Q.; Liu, Q. Texture evolution of high purity tantalum under different rolling paths. J. Mater. Process Technol. 2014, 214, 462–469. [Google Scholar] [CrossRef]
  27. Orlov, D.; Todaka, Y.; Umemoto, M.; Tsuji, N. Formation of bimodal grain structures in high purity Al by reversal high pressure torsion. Scripta Mater. 2011, 64, 498–501. [Google Scholar] [CrossRef]
  28. Orlov, D.; Todaka, Y.; Umemoto, M.; Tsuji, N. Role of strain reversal in grain refinement by severe plastic deformation. Mater. Sci. Eng. A 2009, 499, 427–433. [Google Scholar] [CrossRef]
  29. Orlov, D.; Bhattacharjee, P.P.; Todaka, Y.; Umemoto, M.; Tsuji, N. Texture evolution in pure aluminum subjected to monotonous and reversal straining in high-pressure torsion. Scripta Mater. 2009, 60, 893–896. [Google Scholar] [CrossRef]
  30. Po, G.; Cui, Y.; Rivera, D.; Cereceda, D.; Swinburne, T.D.; Marian, J.; Ghoniem, N. A phenomenological dislocation mobility law for bcc metals. Acta Mater. 2016, 119, 123–135. [Google Scholar] [CrossRef] [Green Version]
  31. Liu, Y.H.; Liu, S.F.; Zhu, J.L.; Deng, C.; Fan, H.Y.; Cao, L.F.; Liu, Q. Strain path dependence of microstructure and annealing behavior in high purity tantalum. Mater. Sci. Eng. A 2017, 707, 518–530. [Google Scholar] [CrossRef]
  32. Zhu, J.L.; Liu, S.F.; Liu, Y.H.; Lin, N.; Yang, S.; Deng, C.; Liu, Q. Deformation and annealing behavior in the ‘interaction zone’ of cold-rolled tantalum sheets. Vacuum 2019, 164, 105–113. [Google Scholar] [CrossRef]
  33. Nye, J.F. Some geometrical relations in dislocated crystals. Acta Metall. 1953, 1, 153–162. [Google Scholar] [CrossRef]
  34. Zhu, J.L.; Liu, S.F.; Long, D.D.; Liu, Y.H.; Lin, N.; Yuan, X.L.; Orlov, D. Asymmetric cross rolling: A new technique for alleviating orientation-dependent microstructure inhomogeneity in tantalum sheets. J. Mater. Res. Technol. 2020, 9, 4566–4577. [Google Scholar] [CrossRef]
  35. Kröner, E. Continuum Theory of Dislocations and Self-Stresses; Springer: Berlin, Germany, 1958. [Google Scholar]
  36. Wilkinson, A.J.; Randman, D. Determination of elastic strain fields and geometrically necessary dislocation distributions near nanoindents using electron back scatter diffraction. Philos. Mag. 2010, 90, 1159–1177. [Google Scholar] [CrossRef] [Green Version]
  37. Kubin, L.P.; Mortensen, A. Geometrically necessary dislocations and strain-gradient plasticity: A few critical issues. Scripta Mater. 2003, 48, 119–125. [Google Scholar] [CrossRef] [Green Version]
  38. Luo, J.R.; Godfrey, A.; Liu, W.; Liu, Q. Twinning behavior of a strongly basal textured AZ31 Mg alloy during warm rolling. Acta Mater. 2012, 60, 1986–1998. [Google Scholar] [CrossRef]
  39. Gurao, N.P.; Sethuraman, S.; Suwas, S. Effect of strain path change on the evolution of texture and microstructure during rolling of copper and nickel. Mater. Sci. Eng. A 2011, 528, 7739–7750. [Google Scholar] [CrossRef]
Figure 1. Schematic diagram of the metal working process.
Metals 11 01665 g001
Figure 2. The distribution of texture in the as-received Ta plate along thickness: (a) near-surface, (b) quarter-thickness, and (c) center layers.
Metals 11 01665 g002
Figure 3. The grain size distribution of as-received Ta plate.
Metals 11 01665 g003
Figure 4. ODFs representing deformation textures in samples processed by warm unidirectional rolling (ac) and 135° warm cross rolling (df): (a,d) near-surface, (b,e) quarter-thickness, and (c,f) center layers.
Metals 11 01665 g004
Figure 5. The ND IPF maps of samples processed by WUR (a) and WCR (b).
Metals 11 01665 g005
Figure 6. Statistically grouped distribution of the misorientation angle in WUR and WCR samples.
Metals 11 01665 g006
Figure 7. IPF maps of the fully recrystallized microstructure of WUR (a) and WCR (b) samples after annealing at 1100 °C for 30 min; (c) the average grain size in different orientations and (d) the volume fractions of {111}, {110}, {100} and otherwise oriented grains in WUR and WCR samples.
Metals 11 01665 g007
Figure 8. The distribution of geometrical necessary dislocations within deformed {111} (a,c) and {100} (b,d) grains in WUR (a,b) and WCR (c,d) samples.
Metals 11 01665 g008
Figure 9. The distribution of relative Schmid factor for deformed {111} and {100} grains in WUR and WCR samples. WUR sample (a) {111} grains (b) {100} grains; WCR sample (c) {111} grains (d) {100} grains.
Metals 11 01665 g009
Figure 10. Deformed microstructures in WUR (a) and WCR (d) samples along with are corresponding strain contouring maps (b,e) and strain contouring distributions (c,f).
Metals 11 01665 g010
Figure 11. The microstructure of WUR (a) and WCR (b) samples revealing the onset of recrystallization after annealing at 1100 °C for 5 min.
Metals 11 01665 g011
Table 1. The rolling parameters for 135° warm cross and unidirectional rolling.
Rolling PassEntrance Thickness/mmExit Thickness/mmRolling Gap Geometry (l/h)Total Rolling Reduction/%
11210.52.4312.5
210.59.22.5823.3
39.28.22.5731.6
48.27.42.5638.3
57.46.72.6544.1
66.762.9450
76.05.43.0355
85.44.83.3960
94.84.33.4764.2
104.34.02.9566.6
114.03.82.5668.3
123.83.62.7070
Note: l / h = 2 r ( d 0 d ) / ( d 0 + d ) , where r is the radius of rolling mill, l is the length of contact between the rolls and the specimen, and h is the average thickness of the sample for each rolling pass.
Publisher’s Note: MDPI stays neutral with regard to jurisdictional claims in published maps and institutional affiliations.

