Article

The High-Temperature Deformation Behavior of As-Cast Ti90 Titanium Alloy

1
School of Materials Science and Engineering, Northeastern University, Shenyang 110006, China
2
Northwest Institute for Nonferrous Metal Research, Xi’an 710016, China
*
Authors to whom correspondence should be addressed.
Metals 2021, 11(10), 1630; https://doi.org/10.3390/met11101630
Submission received: 31 August 2021 / Revised: 7 October 2021 / Accepted: 7 October 2021 / Published: 14 October 2021

Abstract

:
Isothermal compressions of as-cast near-α Ti90 titanium alloy were carried out on a Gleeble-3800 simulator in the temperature range of 860–1040 °C and strain rates of 0.001–10 s−1. The deformation behavior of the alloy was characterized based on the analyses of flow curves, the constructions of Arrhenius constitutive equations and the processing map. The microstructure evolution of the alloy was analyzed using the optical microscopic (OM), transmission electron microscope (TEM), and electron backscatter diffraction (EBSD) techniques. The results show that the kinking and dynamic globularization of α lamellae is the dominant mechanism of flow softening in the α + β two-phase region, while the dynamic recovery (DRV) of β phase is the main softening mechanism in the β single-phase region. The dynamic globularization of α lamellae is mainly caused by the wedging of β phase into α laths and the shearing of α laths due to imposed shear strain. The activation of prismatic and pyramidal slip is found to be easier than that of basic slip during the deformation in the α + β two-phase region. In addition, the Schmid factor of equiaxial α is different from that of lamellar α, which also varies with the angle between its geometric orientation and compression direction (CD). Based on the processing map, the low η region within the temperature range of 860–918 °C with a strain rate range of 0.318–10 s−1 should be avoided to prevent the occurrence of deformation instability.

1. Introduction

Titanium and titanium alloys are widely used in ocean applications, such as ships and submarines, offshore oil and gas exploration, sea water desalination devices, and coastal power stations because of their excellent properties, such as high specific strength, non-magnetic, and good corrosion resistance [1,2]. In particular, the near-α titanium alloy is the optimal choice due to its outstanding weldability. Ti80 alloy is the typical near-α titanium alloy widely used in the marine engineering in China, which has good corrosion resistance [3,4]. However, the strength of the alloy is not enough for the current requirement. The newly developed Ti90 alloy is a Ti-Al-Zr-Sn-Nb-Mo-V near-α titanium alloy designed by the Northwest Institute for Non-ferrous Metal Research (NIN). Compared with Ti80 alloy, Ti90 alloy has a higher strength while still maintains good toughness and corrosion resistance, which has a broad prospect in the field of marine engineering [5].
Microstructure is one of the decisive factors to determine the properties of titanium alloys. The optimization of a hot working process is an important way to obtain the desired microstructure, which depends largely on the understanding of the behavior and mechanism of hot deformation. Many studies have focused on the effects of deformation parameters on the flow behavior and microstructure evolution. Jia et al. [6] studied the high-temperature deformation behavior of Ti60 alloy based on the analysis of the stress–strain behavior, kinetics and processing map. Rezaee et al. [7] characterized the dominant softening mechanism of Ti6242 alloy by utilizing the strain-compensated constitutive equation and 3D activation energy and processing map. Based on the cellular automaton (CA) technique, Wu et al. [8] studied the discontinuous dynamic recrystallization (DDRX) behavior of TA15 in the β single phase field. The great effects of strain rate and temperature on the nucleation and growth behavior of the recrystallized grain were revealed. Balasundar et al. [9] investigated the geometric dynamic recrystallization (GDRX) of α lamellae of TITAN 29A alloy. The results showed that the fraction increased and the critical strain of globularization decreased with the increasing temperature or the decreasing strain rate, and the rate controlling step is the diffusion of β phase. The above studies indicate that dynamic recrystallization (DRX) is prone to occur during hot deformation of near-α titanium alloy, and its deformation behavior is highly sensitive to deformation temperature and strain rate.
The crystallographic orientation and texture evolution of titanium alloys during hot deformation was also researched using the electron backscatter diffraction (EBSD) technique in recent years. The orientation relationship between the α and β phases in the hot working of TA15 alloy was systematically investigated by Gao et al. [10]. Zhang et al. [11] set up the microstructure/texture evolution maps (MTE) of the Ti65 alloy. It is found that the texture component with [0001] or [02–23] parallel to radial directions (RDs) generated in the α + β phase field, while two texture components with [0001] parallel to RDs and [2-1–10] parallel to compression direction (CD) formed in the β phase field. Furthermore, the effects of slip mode and strain state on the texture evolution of TA15 alloy were studied by Zhao et al. [12]. The basal and the prismatic slip system were the dominant slip modes, and the deformation texture was determined by the ratio of the compressive effect to the tensile effect of the second principal strain. From the above, orientation evolution of near-α titanium alloys was characterized and analyzed from various aspects. All of the researches indicated that the orientation evolution is another key factor that affect the flow behavior of the alloy. Therefore, the characteristic of crystallographic orientation of Ti90 alloy is another research focus of this study.
The final component microstructure is dependent on the various structural features inherited from the primary stages (cogging or ingot breakdown) and the following treatments. Furthermore, the cogging quality of the alloy essentially relies on its microstructure, which is highly associated with the hot processing parameters. In the previous papers, most studies centered on the forged titanium alloys, while using the as-cast titanium alloy is undoubtedly more valuable for guiding the cogging process of the ingot. However, the corresponding researches are limited. Therefore, the deformation behavior of the as-cast Ti90 alloy was researched to optimize the processing parameters and control the microstructure.
To achieve the above objective, the flow behavior and the deformation mechanism of Ti90 alloy were analyzed based on the stress–strain curves. Constitutive models and processing map were established, the microstructure evolution of Ti90 alloy was thoroughly characterized by the optical microscopic (OM), transmission electron microscope (TEM), and electron backscatter diffraction (EBSD) techniques.

2. Materials and Methods

2.1. Materials

The newly developed near-α titanium alloy Ti90 was investigated in this work. The casting ingot was obtained by (three times) vacuum arc melting. As shown in Figure 1, the initial microstructure is composed of coarse primary β grains, which are consist of α lamellae and residual β phases. Meanwhile, the grain boundary α phase are precipitated at the β grain boundaries. The average thickness of the α lamella is about 2.35 μm. The β transus temperature measured by the metallographic technique is approximately 970 °C.

2.2. Hot Compression

Hot compression tests were performed on the Gleeble 3800 Thermal Mechanical System (Date Sciences International, Saint Paul, MN, USA) to simulate the cogging process and research the deformation behavior of Ti90 alloy. Cylindrical samples with 15 mm in height and 10 mm in diameter were used in the test. The strain rates were 10 s 1 , 1 s 1 , 0.1 s 1 , 0.01 s 1 , and 0.001 s 1 . The temperatures were 860 °C, 900 °C, 940 °C, 970 °C, 1000 °C, and 1040 °C. The height reduction was 70%. Tantalum foil and graphite sheet were placed between the sample and the anvil to reduce friction, and two thermocouples were welded on the center of the sample surface to measure and control the temperature. During the experiment, specimens were heated to the deformation temperatures at a rate of 5 °C/s and held for 5 min before the compression to ensure a homogeneous temperature field. After compression, the deformed sample was water quenched immediately to retain the high-temperature microstructure.

2.3. Microstructure Characterization

Optical microscopic (OM, Leica Microsystems, Wetzlar, Germany) LEICA DM4000M was used to observe the deformed microstructure. The specimens used were first sectioned parallel to the compression direction from one side of the deformed specimens, then the cut surface of half specimen was ground and polished according to ASTM E3-11 standard, and finally etched in a mixture of hydrofluoric acid, nitric acid and water with a volume ratio of 1:3:7.
Besides, JEM-200 CX transmission electron microscopy (TEM, JEOL, Tokyo, Japan) was used to further characterize the substructure evolution and the globularization of the lamellar α. The TEM specimens were taken from the center of the section of the other half of the compressed specimens, which are symmetric with OM specimens. The specimens were first ground down to approximately 50 μm, then the thin area required for TEM observation was prepared by twin-jet electropolishing.
Finally, a Gemini300 thermal field emission scanning electron microscope (SEM, Zeiss, Oberkochen, Germany) equipped with an OXFORD SYMMETRY electron back scattering diffraction (EBSD, Oxford Instruments, Oxford, England) detector and an HKL-Channel 5 data analysis system were used to investigate the DRX behavior of Ti90 alloy in the α + β two-phase field deformation. The applied high-resolution scan step size was 0.08 μm. The EBSD samples were taken under the TEM specimens, and the observation plane was parallel to the compression axis. The sample was first mechanically ground with grit papers. Then, the strain layer on the surface of the sample was removed by electropolishing using a mixture solution with perchloric acid to glacial acetic acid ratio of 6 to 94.

3. Results and Discussion

3.1. Flow Strain–Stress Curves

The strain–stress curve of Ti90 is shown in Figure 2. With the increase in strain, the obvious difference between the flow softening characteristics of the β phase and α + β phase region can be observed:
In the α + β two-phase region, the stress increases linearly with the increase of strain, and then the growth rate slows down gradually. After reaching the peak, the stress begins to decrease continuously until it reaches a stable state under a certain strain. This type of curve is considered to be dynamic recrystallization curve or near steady state curve, indicating that the main softening mechanism during deformation may be dynamic recrystallization [13]. As can be seen from Figure 2a–b, the flow stress increases significantly with the increase of strain rate or the decrease of temperature, indicating that the deformation behavior of Ti90 alloy is highly sensitive to both strain rate and temperature.
As shown in Figure 2c–d, the shape of the strain–stress curve in the β single-phase region is greatly different from that of the α + β two-phase region. With the increase of strain, the flow stress soon reaches a stable value after reaching the peak, showing a typical dynamic recovery curve, which indicates that the dynamic recovery (DRV) is the main softening mechanism in the process of compression [14,15,16]. A short slow increasing stage can be observed between the peak and the steady state stage at the strain rates of 0.01–10 s−1, which becomes more obvious with the increase of the strain rate, indicating a larger critical strain is needed to reach the balance between the softening effect of DRV and the work hardening effect for the deformation at high strain rate. The increase of the strain rate and the decrease of temperature both lead to the increase of flow stress, and the effect of the former seems to be more significant.
In addition, when the strain rate increases to 10 s−1 in the α + β two-phase region or 1 s−1 in the β single-phase region, the flow curve shows obvious fluctuation after reaching the peak stress. This kind of fluctuation is not consistent with that of the oscillation behavior [6,13] and discontinuous yield phenomenon [6,17,18], which have been addressed in other titanium alloys at high strain rates. Thus, it is speculated that the electrical instabilities in electricity or localized flow during hot compression at a high strain rate should be the main reason for the fluctuation.
It can be seen that the strain–stress curve can only give clues to the deformation mechanism by showing the hardening and softening of the alloy during the deformation process. Because different mechanisms may lead to similar flow behavior, it is difficult to determine the deformation mechanism directly from the shape of the stress–strain curve. In order to identify which mechanisms are involved in deformation and determine the dominant mechanisms, further theoretical calculations and microstructure analysis are necessary.

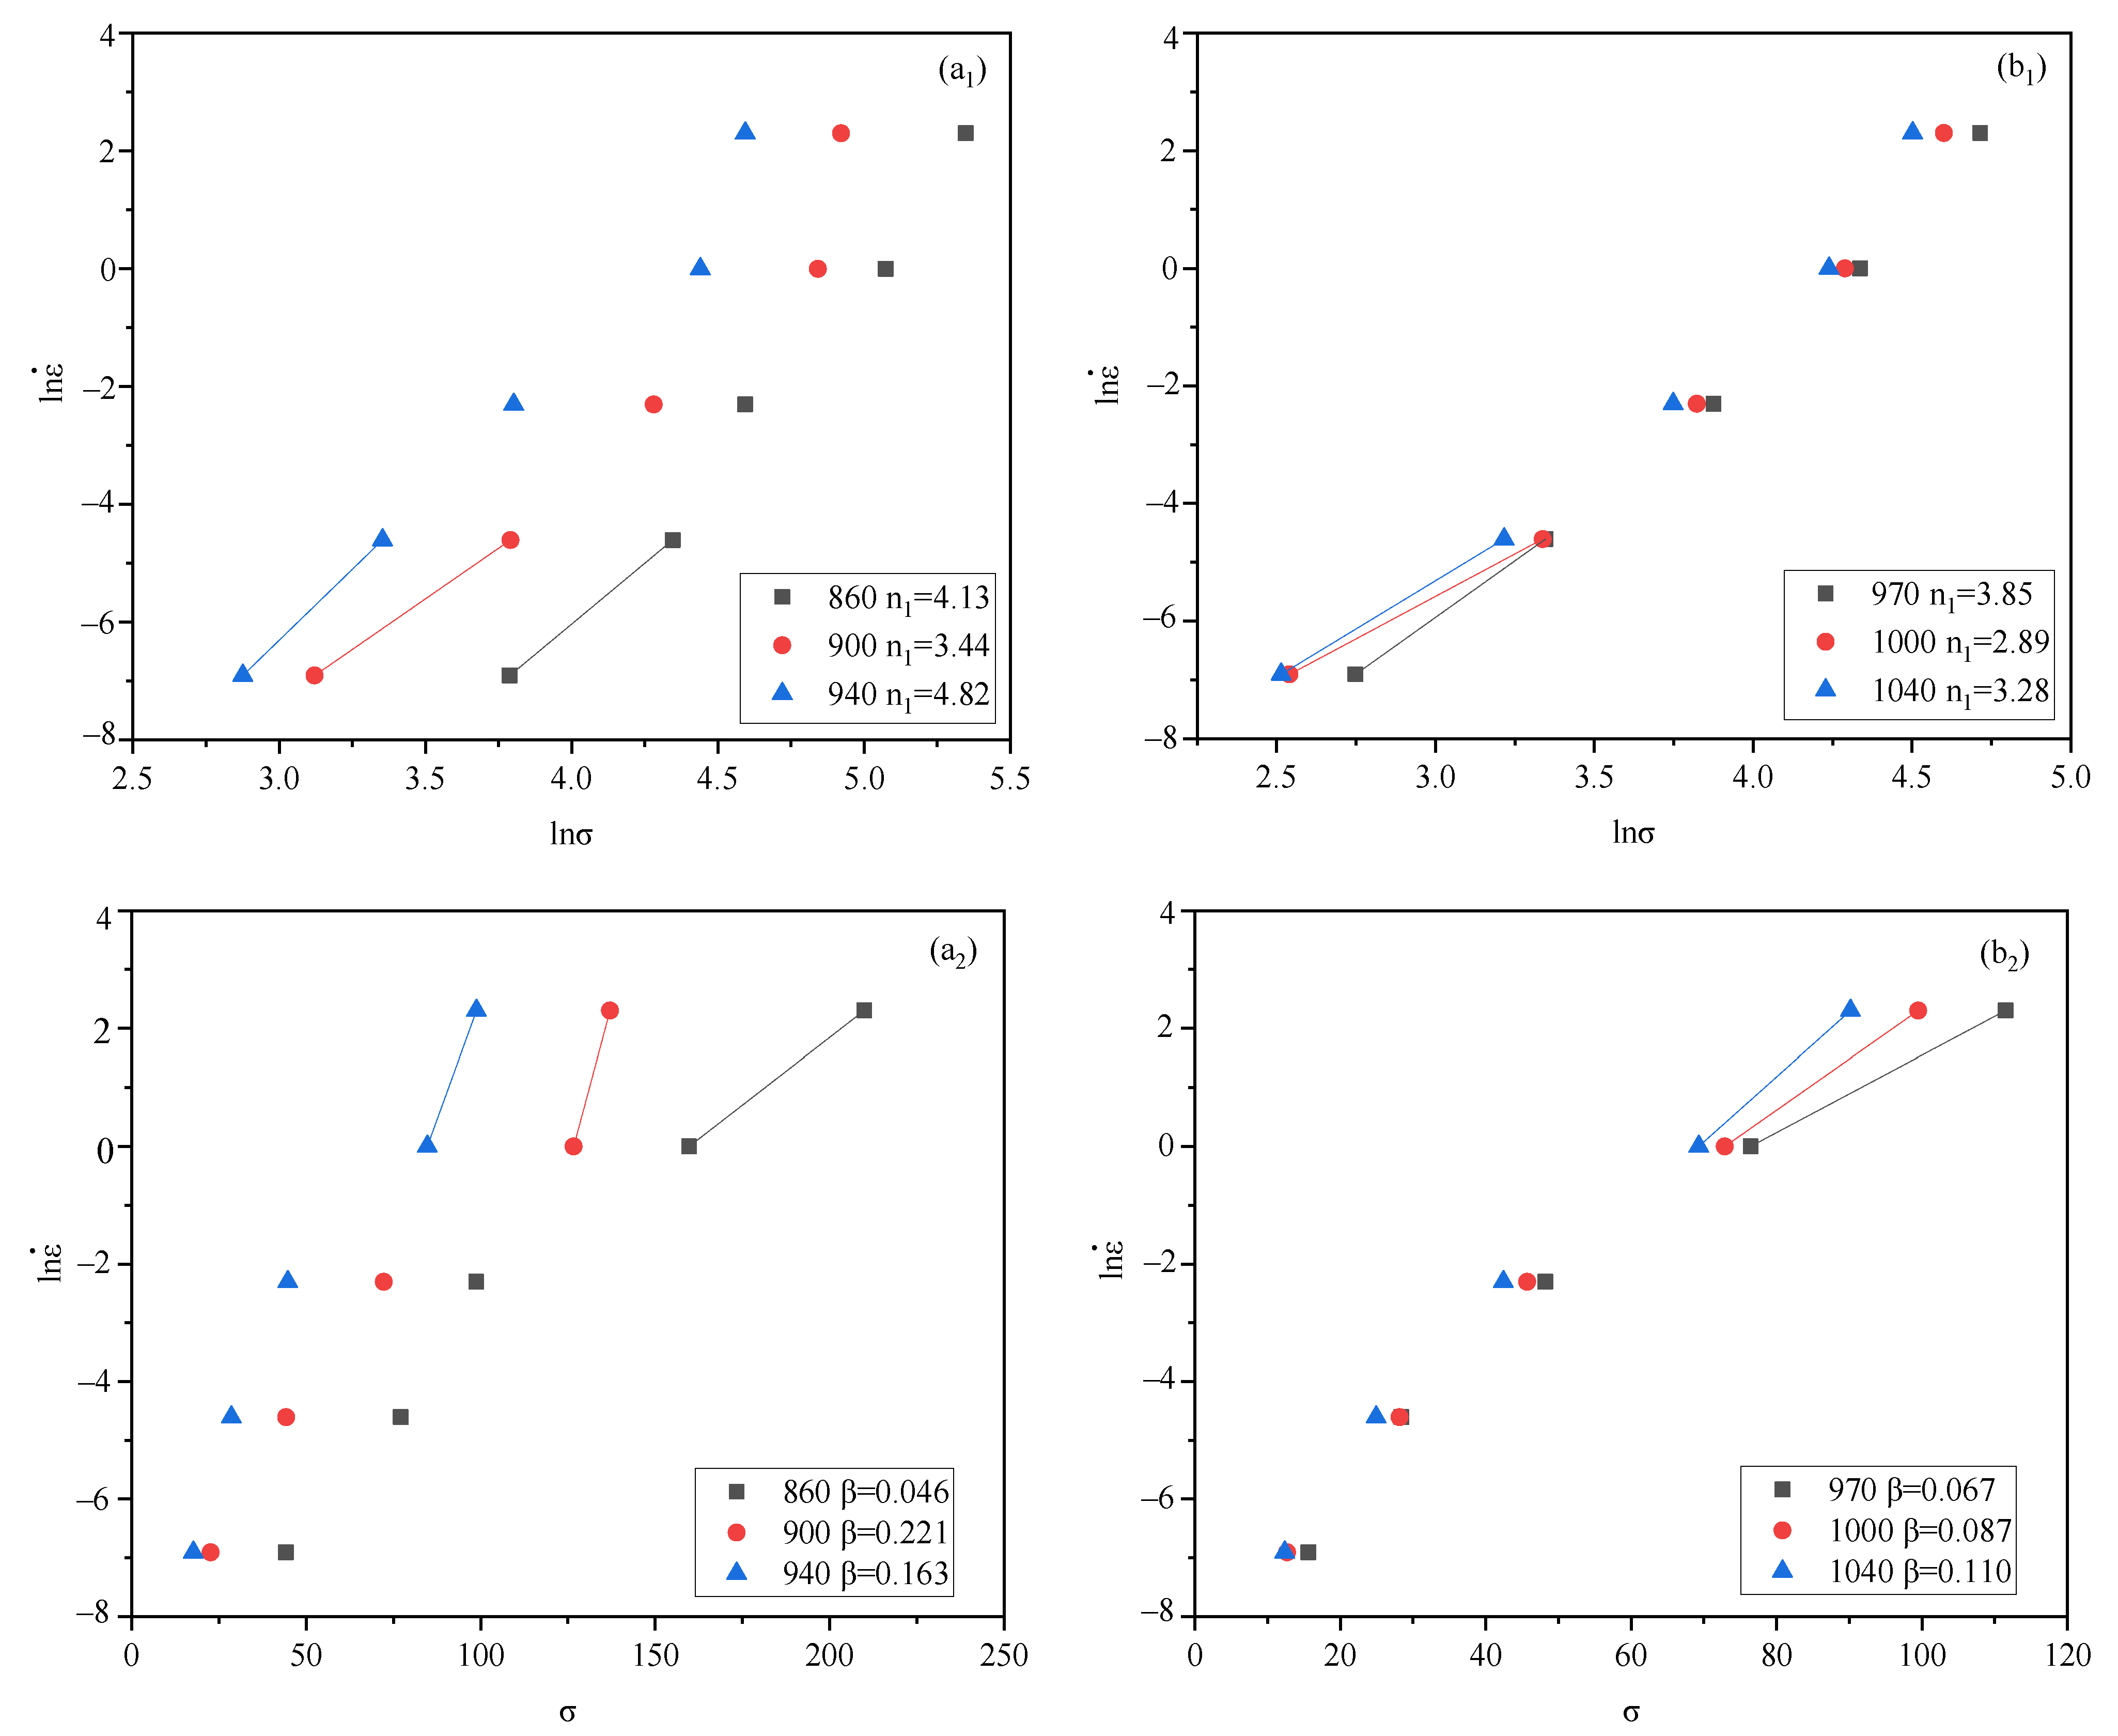
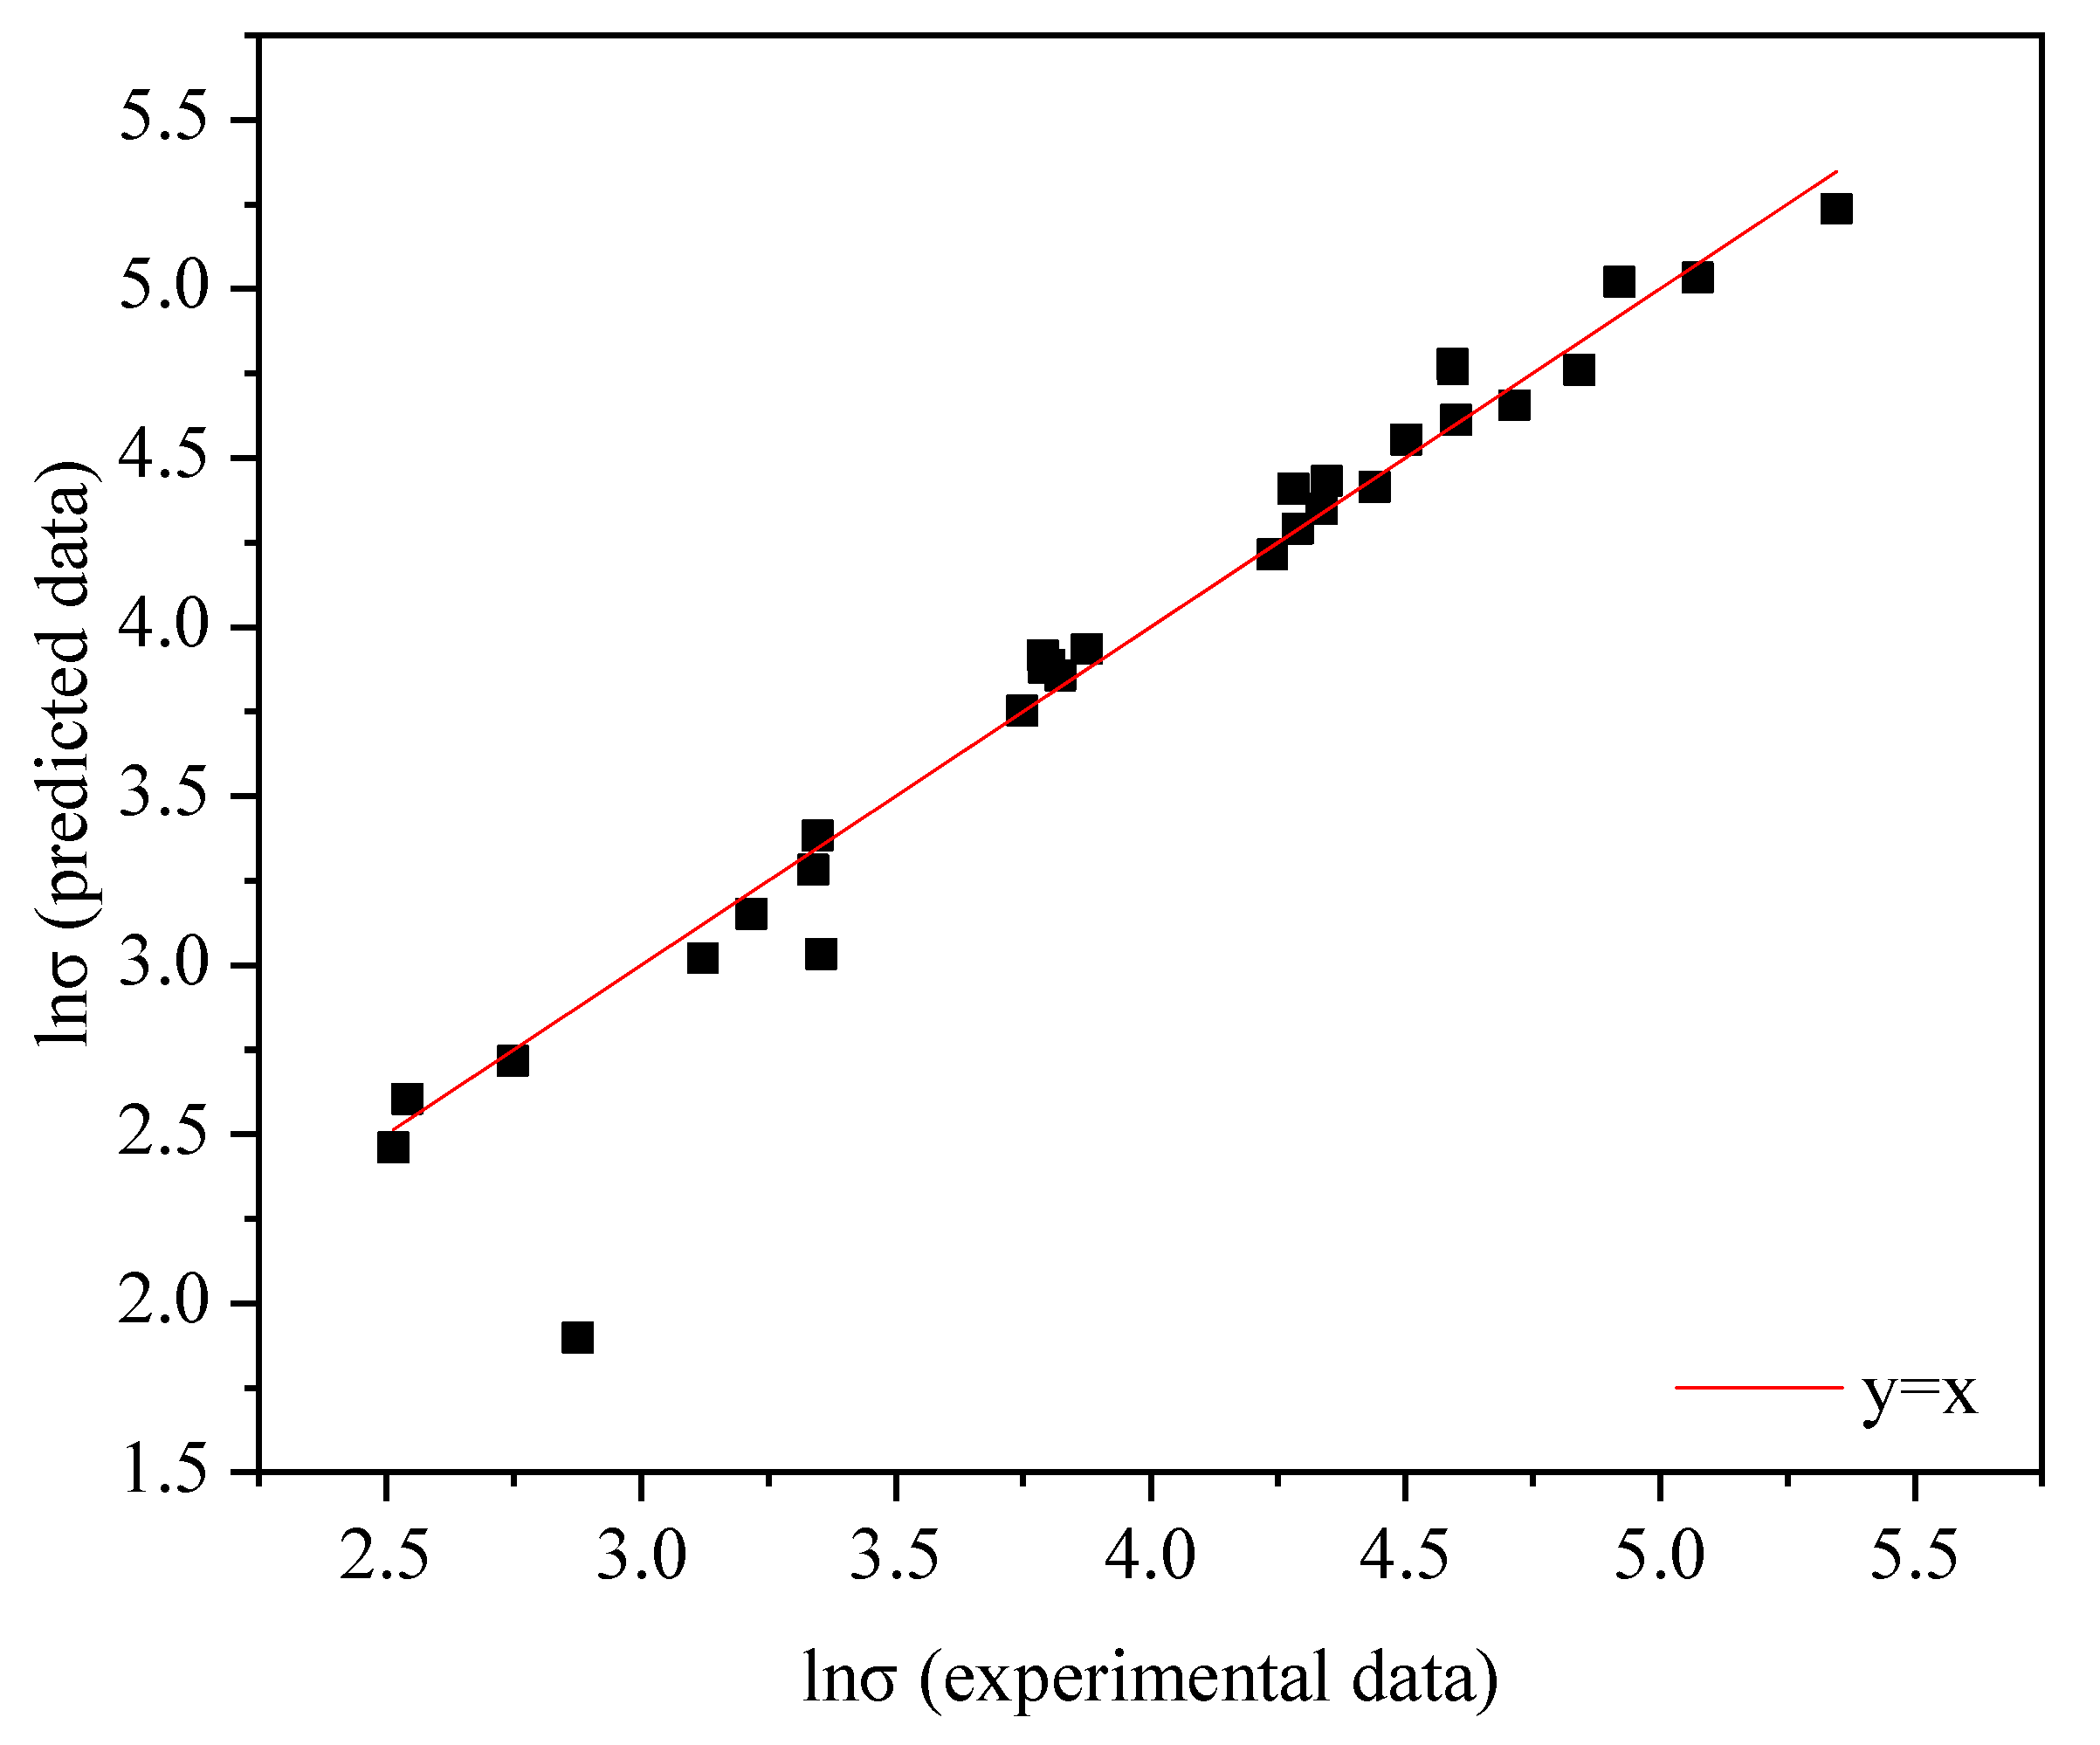
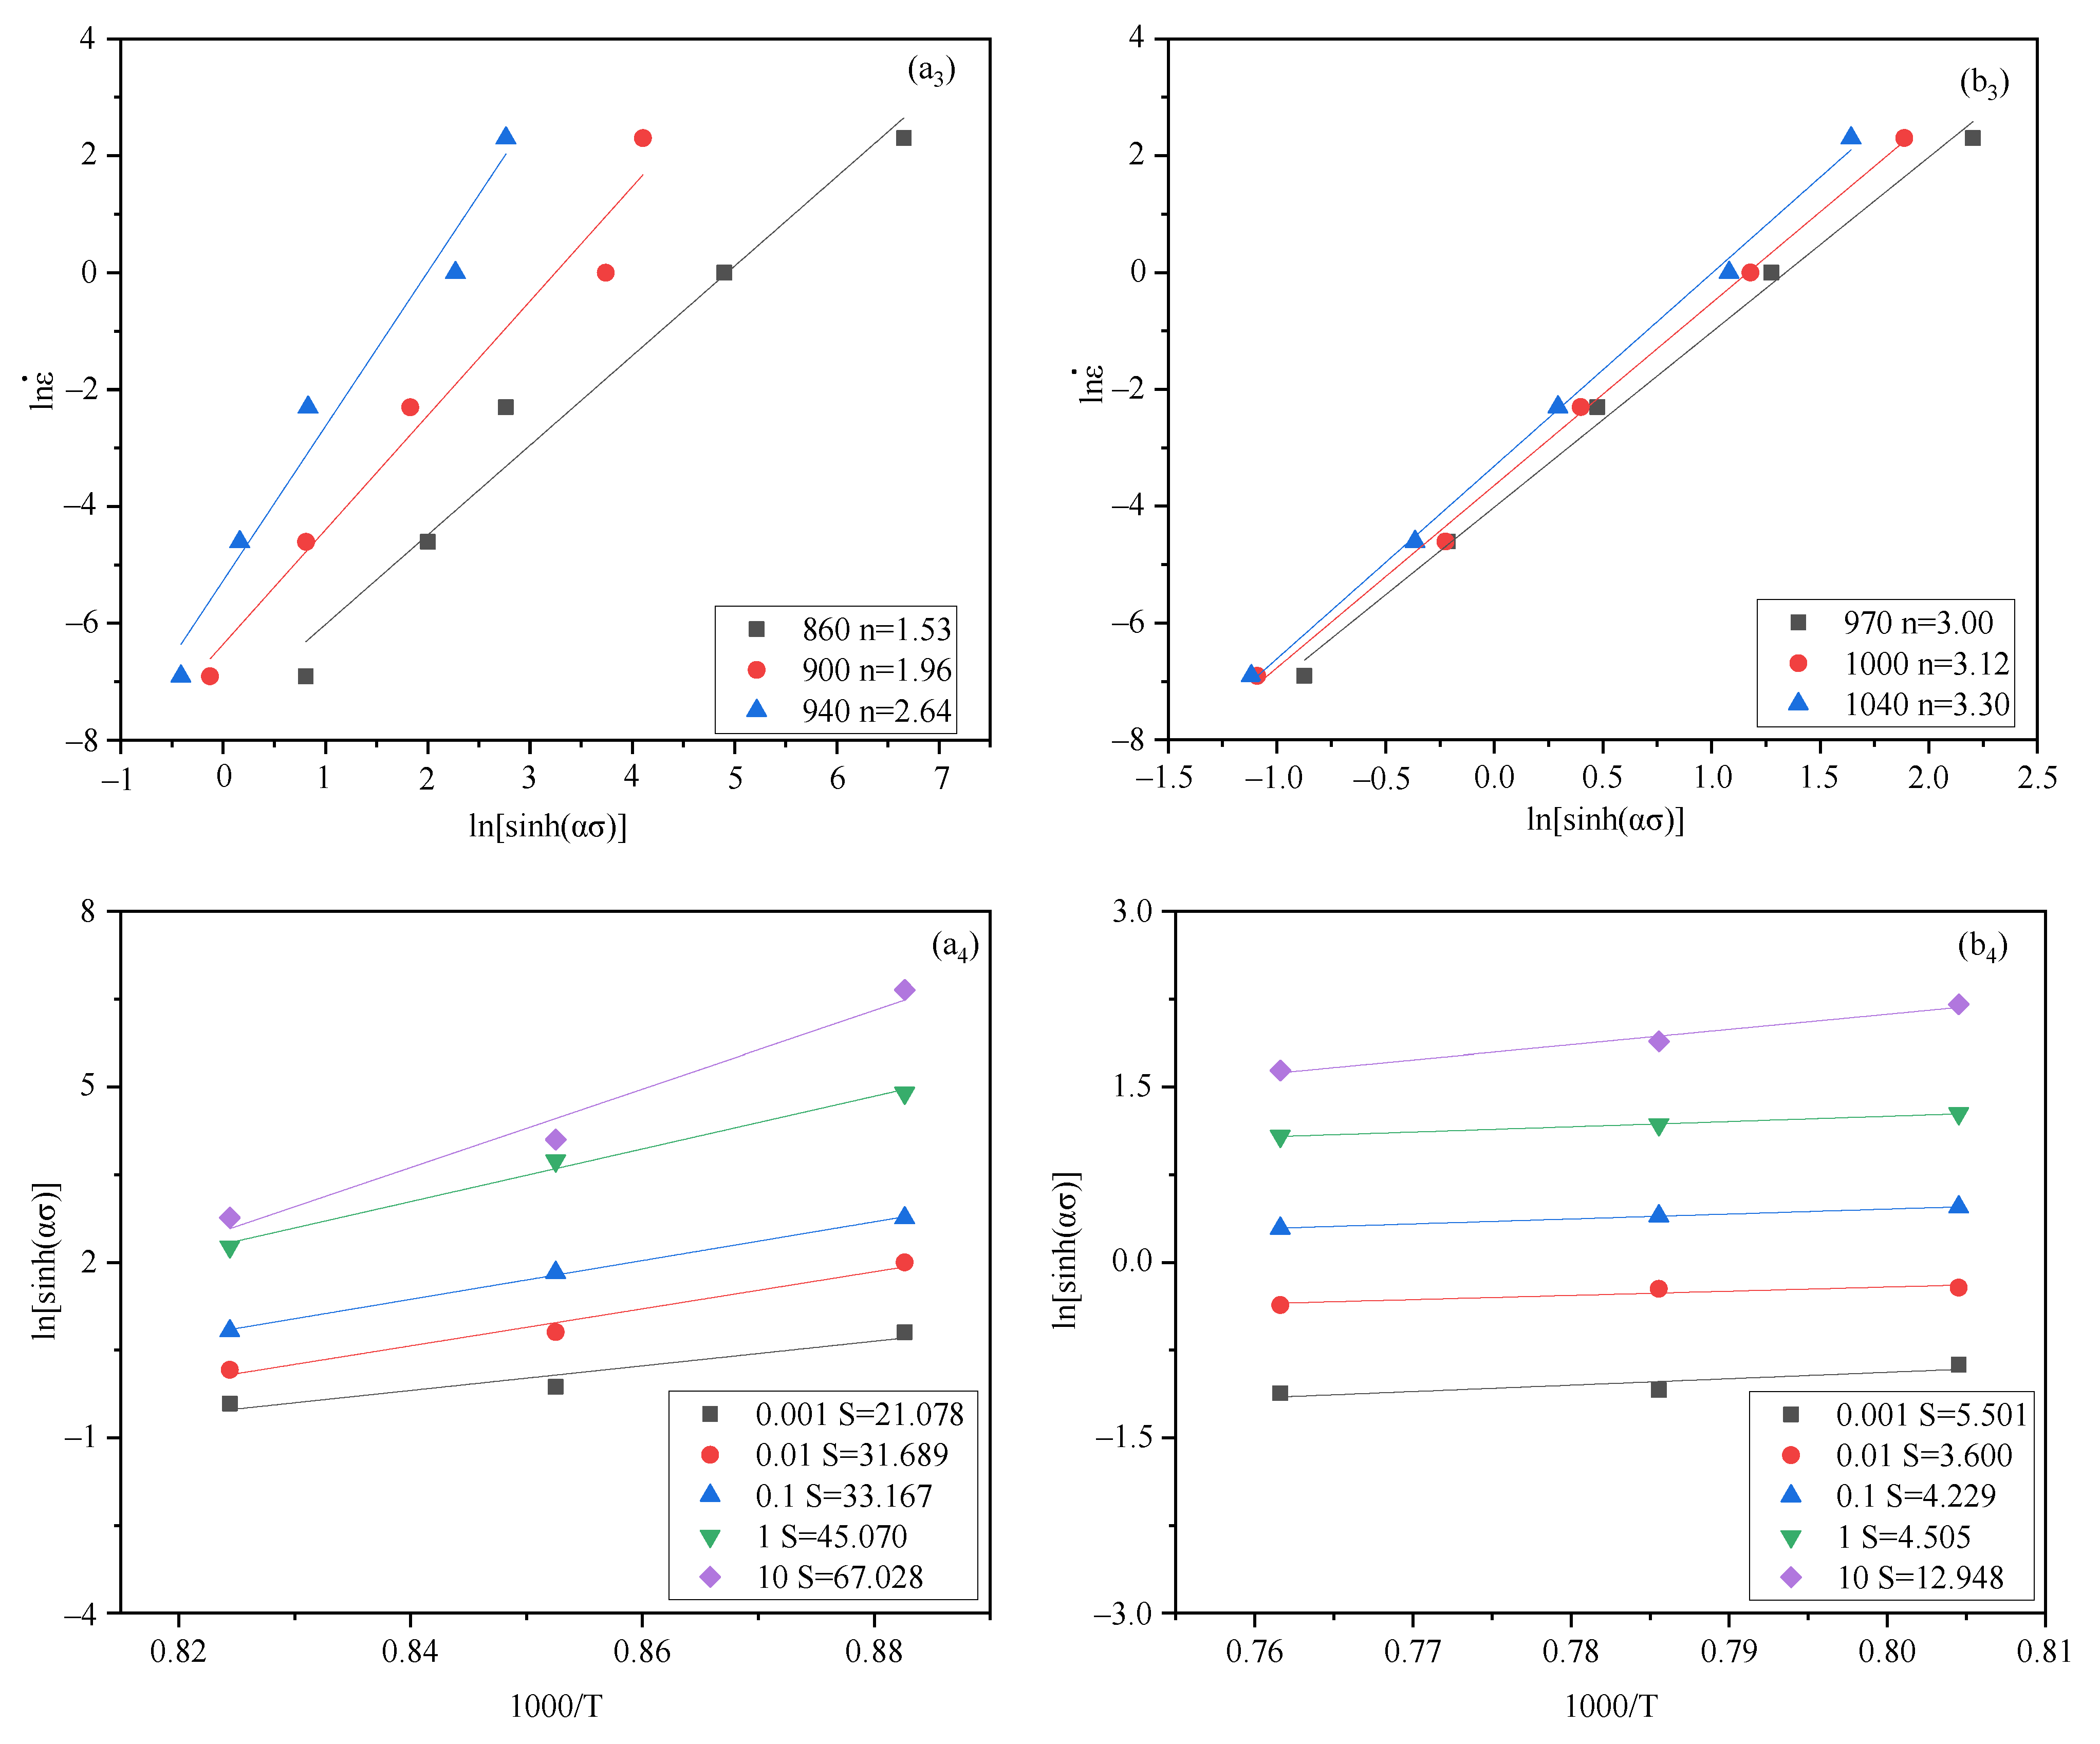
3.2. The Constitutive Equation
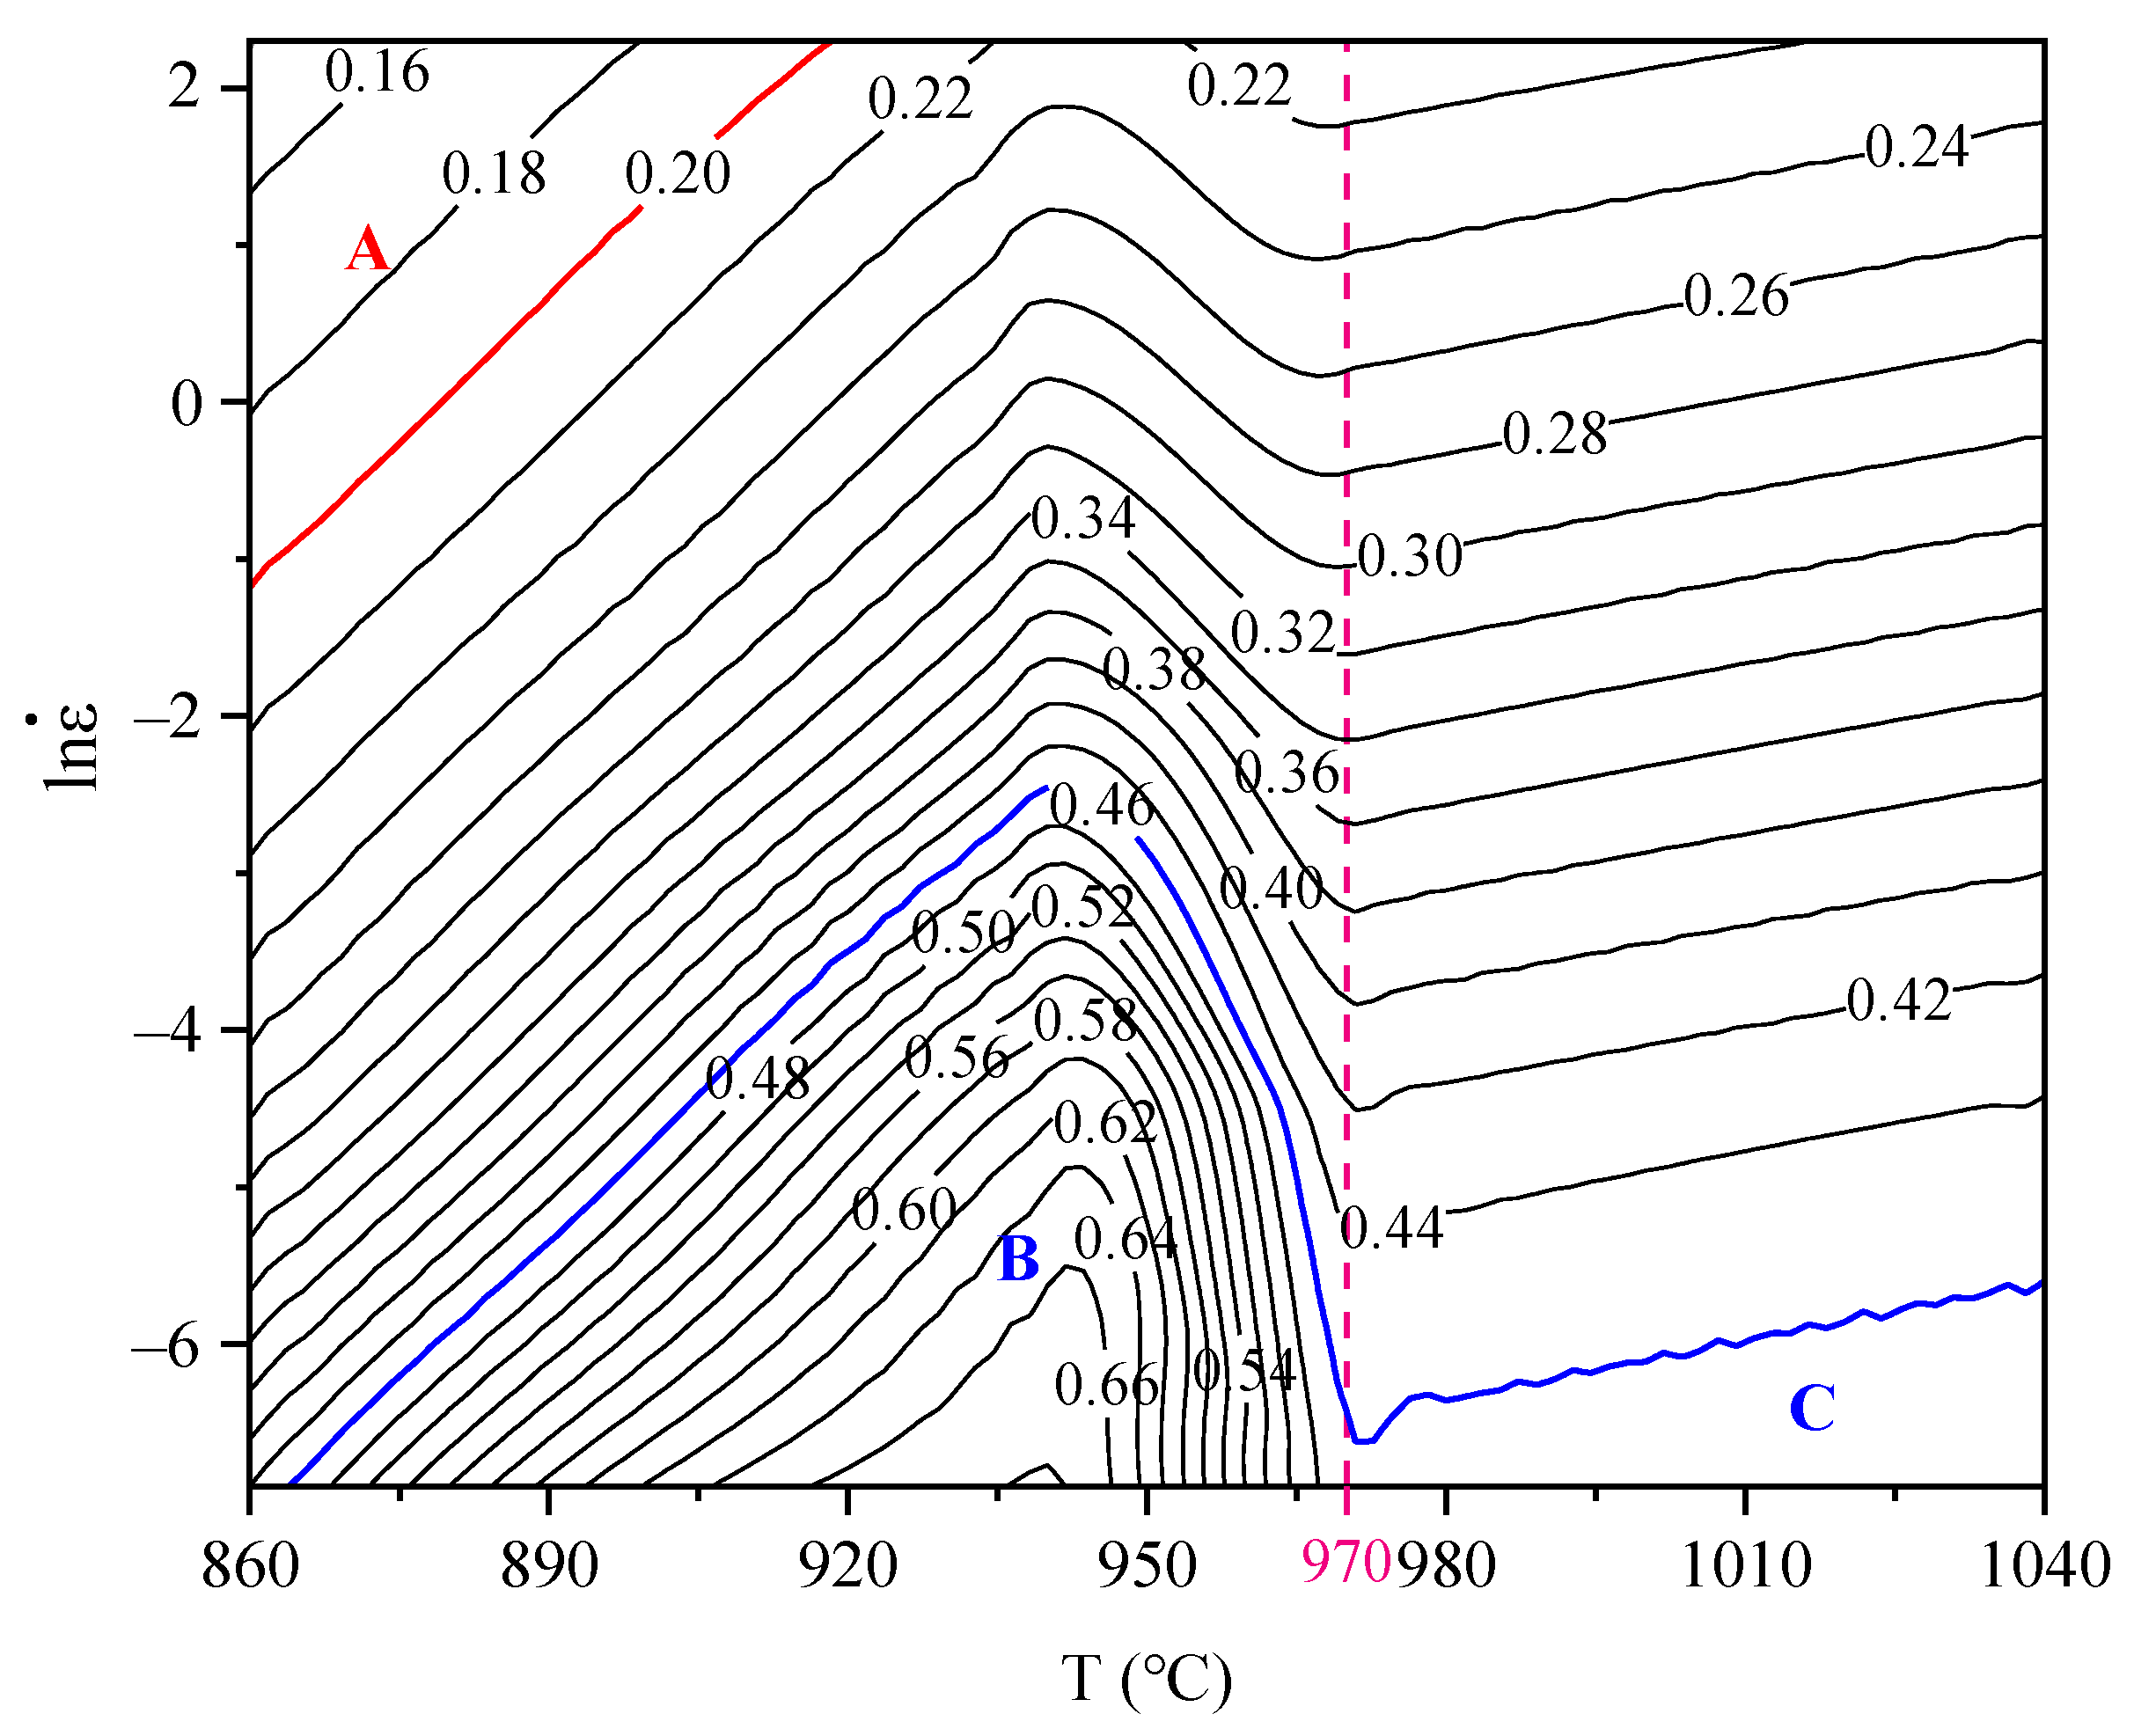
Constitutive relation is the dynamic response of material to deformation parameters, which is a useful tool to describe material deformation and an important basis to simulate and predict the evolution process of microstructure in the process of thermal deformation. In this study, the Arrhenius constitutive equation proposed by Sellars and McTegart was used [19,20,21], which can be divided into the following three forms according to the stress level: when ασ < 0.8,
ε ˙ = A 1 σ n 1 exp ( Q / RT )
when ασ > 1.2,
ε ˙ = A 2 exp ( β σ ) exp ( Q / RT )
for all σ,
ε ˙ = A [ sin h ( α σ ) n ] exp ( Q / RT )
where A1, A2, A, α (MPa−1), and β are the temperature-independent material constants, n1 and n are the stress exponent, ε ˙ is the strain rate (s−1), σ is the flow stress of steady state at the true strain of 1.1 (MPa), Q is the activation energy of deformation (kJ·mol−1), R is the gas constant (8.3145 J·(mol·K)−1), T is the absolute temperature of deformation (K), and α = β/n1.
Taking the natural logarithms of both sides of Equations (1)–(3) gives:
ln ε ˙ = lnA 1 + n 1 ln σ Q / RT
ln ε ˙ = lnA 2 + β σ Q / RT
ln ε ˙ = lnA + nln [ sin h ( α σ ) ] Q / RT
Assuming that the value of Q is independent of T, then:
n 1 = ( ln ε ˙ ) ( ln σ ) | 1 / T
β = ( ln ε ˙ ) σ | 1 / T
n = ( ln ε ˙ ) { ln [ sin h ( α σ ) ] } | 1 / T
Q = R n S = R n { ln [ sin h ( α σ ) ] } ( 1 / T ) | ε ˙
The value of lnσ was calculated and the lnσ–ln ε ˙ graph was drawn using the steady-state stress σ at a true strain of 1.1. According to Equation (7), the slope was obtained by linear fitting of the low stress data at the same temperature. Then the value of n1 was obtained by averaging slopes at different temperatures. Similarly, the σ–ln ε ˙ image was used to calculate the β value using high stress data according to Equation (8). Since α = β/n1, the value of α was obtained. Then the value of ln[sinh(ασ)] was calculated, so that the same method could be used to obtain n by plotting ln[sinh(ασ)]–ln ε ˙ graph according to Equation (9). The apparent activation energy Q of deformation was finally obtained by substituting n and the average slope value S obtained from the linear fitting of ln[sinh(ασ)]–1000/T graph. Figure 3 shows the fitting diagrams and fitting results of the above calculation processes.
For alloys with more than one activation process during the thermal deformation process, the obtained Q reflects the activation energy of the process that dominates the thermal activation and, thus, can be used to determine the prevailing softening mechanism and estimate the thermal workability of the material [14,18,22]. For Ti90 alloy, it can be found that the Q value of deformation in α + β two-phase region (673 kJ∙mol−1) is much higher than the pure titanium self-diffusion activation energy, which is reported as 150 kJ∙mol−1 for α-Ti [23] and 153 kJ∙mol−1 for β-Ti [24]. While the Q value of β single-phase region deformation (161 kJ∙mol−1) is similar to that of pure titanium. The similar activation energies suggest that DRV mechanism controlled by dislocation climb and cross slip is dominant when deformed in β single-phase region [25]. Whereas high apparent thermal activation energy of deformation in the α + β two-phase region indicates the occurrence of other softening process like DRX or superplastic instead of the DRV process. This result is in good agreement with the strain–stress curves in Figure 2a,b.
To further estimate the comprehensive effect of temperature and strain rate on the deformation behavior, the Zener–Hollomon parameter Z were calculated by the following Equation [14,20,21]:
Z = ε ˙   exp ( Q RT ) = A [ sin h ( α σ ) ] n
Taking the natural logarithms of both sides of Equation (11) gives:
lnZ = lnA + nln [ sin h ( α σ ) ]
By substituting the previously calculated Q values and the steady-state stresses at the true strain of 1.1 under different deformation conditions, the values of lnZ and corresponding ln[sinh(ασ)] could be calculated. Then, using the same linear fitting method, the average intercept lnA and average slope n were obtained as: 62.555 and 1.899 in the α + β two-phase region, 11.489 and 3.129 in the β single-phase region. Therefore, the constitutive equation of Ti90 alloy during hot compression can be expressed as follows:
In the α + β two-phase region:
ε ˙ = e 62.555 [ sin h ( 0.035 σ ) ] 1.899 exp [ 672 , 844 / ( RT ) ]
In the β single-phase region:
ε ˙ = e 11.489 [ sin h ( 0.026 σ ) ] 3.129 exp [ 160 , 724 / ( RT ) ]
In order to verify the accuracy of the developed equation, the flow stresses under all deformation conditions were further calculated by the following Equation [7,21]:
σ = 1 α ln { ( Z A ) 1 n + [ ( Z A ) 2 n + 1 ] 1 2 }
The experimental data were subsequently compared with the predicted data. As shown in Figure 4, the data points are almost all distributed along the line y = x, which indicates a high consistency between the predicted results and the experimental results. Meanwhile, the correlation coefficient (R) is also calculated as 0.97363, which effectively verifies the accuracy of the constitutive equation.

3.3. Processing Map

In order to further understand the dominant mechanisms during the deformation, and optimize the process parameters of Ti90 alloy, the dynamic material model (DMM) is applied in this study to construct the processing map [26,27]. According to DMM, the thermal deformed workpiece can be regarded as a power dissipator, and the thermal deformation process can be regarded as a power dissipation process. During the thermal deformation, part of the energy is dissipated through plastic deformation, which is represented by G, and the other part of energy is dissipated through microstructure evolution, represented by J. The corresponding power dissipation efficiency η can be used to reflect the mechanism of the microstructure evolution with a certain condition of deformation temperature and strain rate, which is defined as follows [7,11]:
η = J J max = 2 m m + 1
where, Jmax can only be obtained at linear dissipation, in which case J is equal to G. While m is the strain rate sensitivity exponent, which is expressed as follows [7,11]:
m = ( ln σ ) ( ln ε ˙ ) | T
Based on the irreversible thermodynamic extremum principle of large plastic flow proposed by Zeigler, the Prasad instability criterion is established on the assumption that m is constant in the dynamic constitutive equation to identify the flow instable region in the processing maps. The Prasad flow instability parameter ξ is defined as follows [7,11]:
ξ = { lg [ m / ( m + 1 ) ] } ( lg   ε ˙ ) + m < 0
In this study, by taking the constitutive equations, which were constructed above, the explicit equations for m, η, and ξ were expressed as functions of deformation temperature and strain rate. The corresponding calculation process is as follows:
Combining Equation (6) with Equations (15) and (17), it can be deduced that:
m = ( ln σ ) ( ln ε ˙ ) = sin h ( σ α ) n σ α cos h ( σ α ) = F ( T , ε ˙ )
Then, substituting Equation (19) into Equation (16), the power dissipation efficiency η can be expressed as:
η = 2 sin h ( σ α ) sin h ( σ α ) + n σ α cos h ( σ α ) = G ( T , ε ˙ )
Meanwhile, further substituting Equation (19) into Equation (18), Prasad flow instability parameter ξ can also be calculated, as follows:
ξ = 2 n ( σ α ) 2 + cosh ( 2 σ α ) 1 n σ α sin h ( 2 σ α ) + n 2 ( σ α ) 2 cos h ( 2 σ α ) + n 2 ( σ α ) 2 = H ( T , ε ˙ )
In this study, temperature values at intervals of 5 between 860 and 1040, and strain rate values 0.001, 0.01, 0.1, 1, 10 were substituted into Equations (20) and (21) to calculate the corresponding power dissipation efficiency η and Prasad flow instability parameter ξ. According to the temperature, the coefficients n and α in the constitutive equations of the α + β two-phase and β single-phase regions (Equations (13) and (14), respectively) were substituted into the calculation. Then, the final mapping matrixes of power dissipation (η) map and the Prasad flow instability (ξ) map were obtained by using Origin software to XYZ grid all the calculation results of α + β two-phase and β single-phase regions. By superimposing the corresponding η map and the ξ map, the processing map at the true strain of 1.1 was finally obtained, as shown in Figure 5. It should be pointed out that due to the finite number of data points calculated, the hot processing map obtained is an approximate result with limited accuracy. However, the general distribution and variation trend of η and ξ are still reliable and more intuitive; thus, it can be used as a reference for the selection of thermal processing parameters.
In Figure 5, the number on the contour line represents the value of the power dissipation efficiency η. A higher η means a more severe microstructure evolution occurs during processing. In general, a η value of 10% to 30% represents the occurrence of DRV, while a η value of 35% to 55% represents the occurrence of DRX [28,29,30]. The shaded area where ξ < 0 is the unstable areas, and the white area is the stable area. Figure 5 shows that there is no unstable area in the processing map, and the high η value exists in a large range, indicating a wide processing window and good workability of the Ti90 alloy. There is one low η area A (within 860–918 °C, 0.318–10 s−1) and two high η zones, including B (within 864–970 °C, 0.001–0.087 s−1) in the α + β two-phase region and C (970–1040 °C, 0.001–0.004 s−1) in the β single-phase region, observed in Figure 5. The highest η value of B is 68.2% at the data point (940 °C, 0.001 s−1), which is usually attributed to DRX, superplastic deformation, or spheroidization. The highest η values of C is 47.3% at the data point (1040 °C, 0.001 s−1), which is usually attributed to the β grain DRV and DRX [11]. The value of η decreases with the increase of strain rate over the whole temperature range, showing a high sensitivity to strain rate. Because of the poor thermal conductivity of titanium, it is easy to cause instability of local plastic flow due to insufficient time and more serious adiabatic heating under a high strain rate, which should be the main reason for the decrease of η value [14]. As can be seen from the Figure 5, the power dissipation rate η is also affected by deformation temperature. With the increase of temperature, the value of η shows a trend of increasing first, then decreasing and finally increasing again. Moreover, with the decreasing of strain rate, this phenomenon becomes more significant. Besides, the effect of temperature is more obvious in the high temperature area of the α + β phase region. The reason should be related to the phase transformation and the change of deformation mechanism, and a more in-depth analysis has been given in the following part. According to the processing map, it is recommended to select the hot working parameters of Ti90 alloy in the high η region B and C to optimize the microstructure and obtain the best performance, while the low η region A should be avoided to prevent deformation instability.

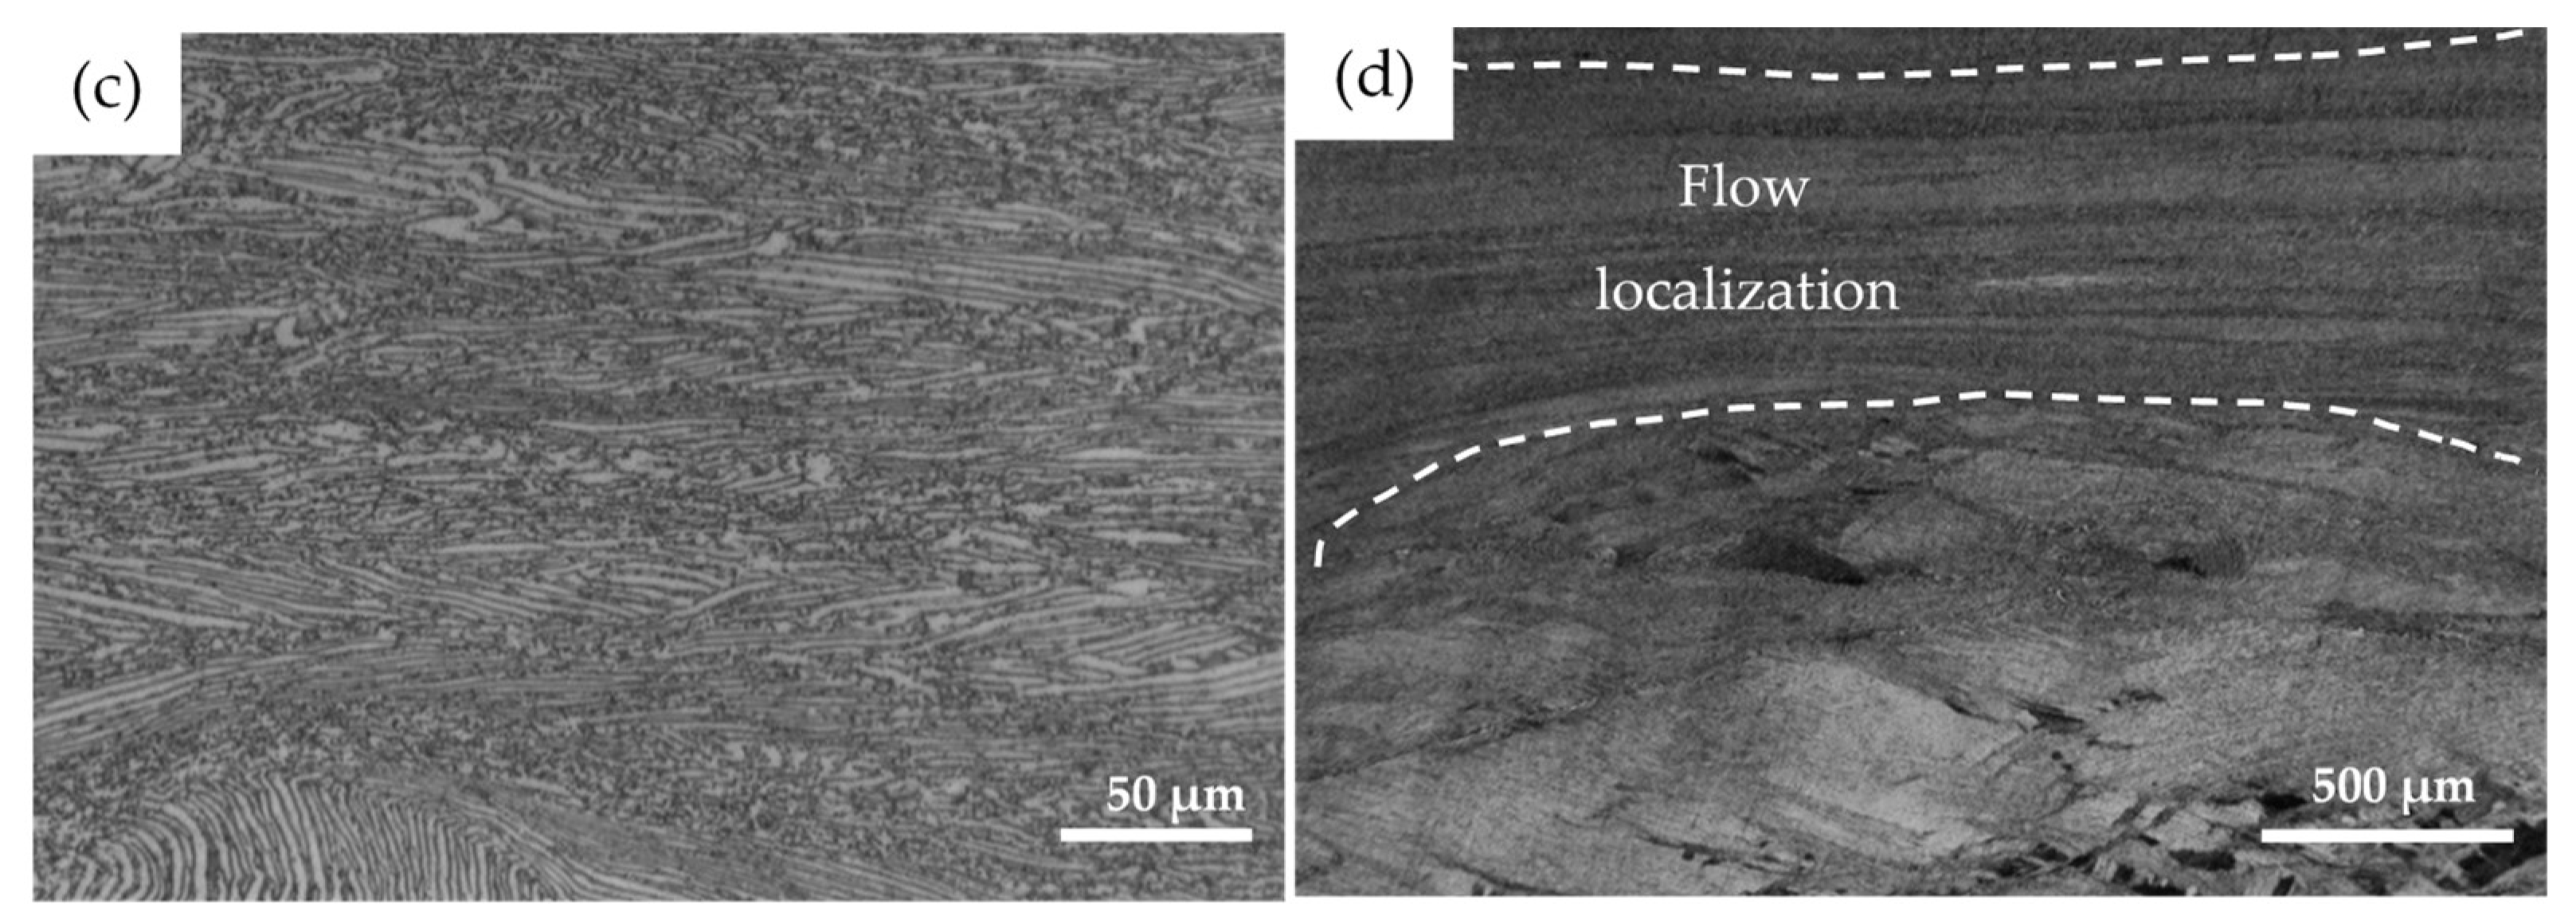
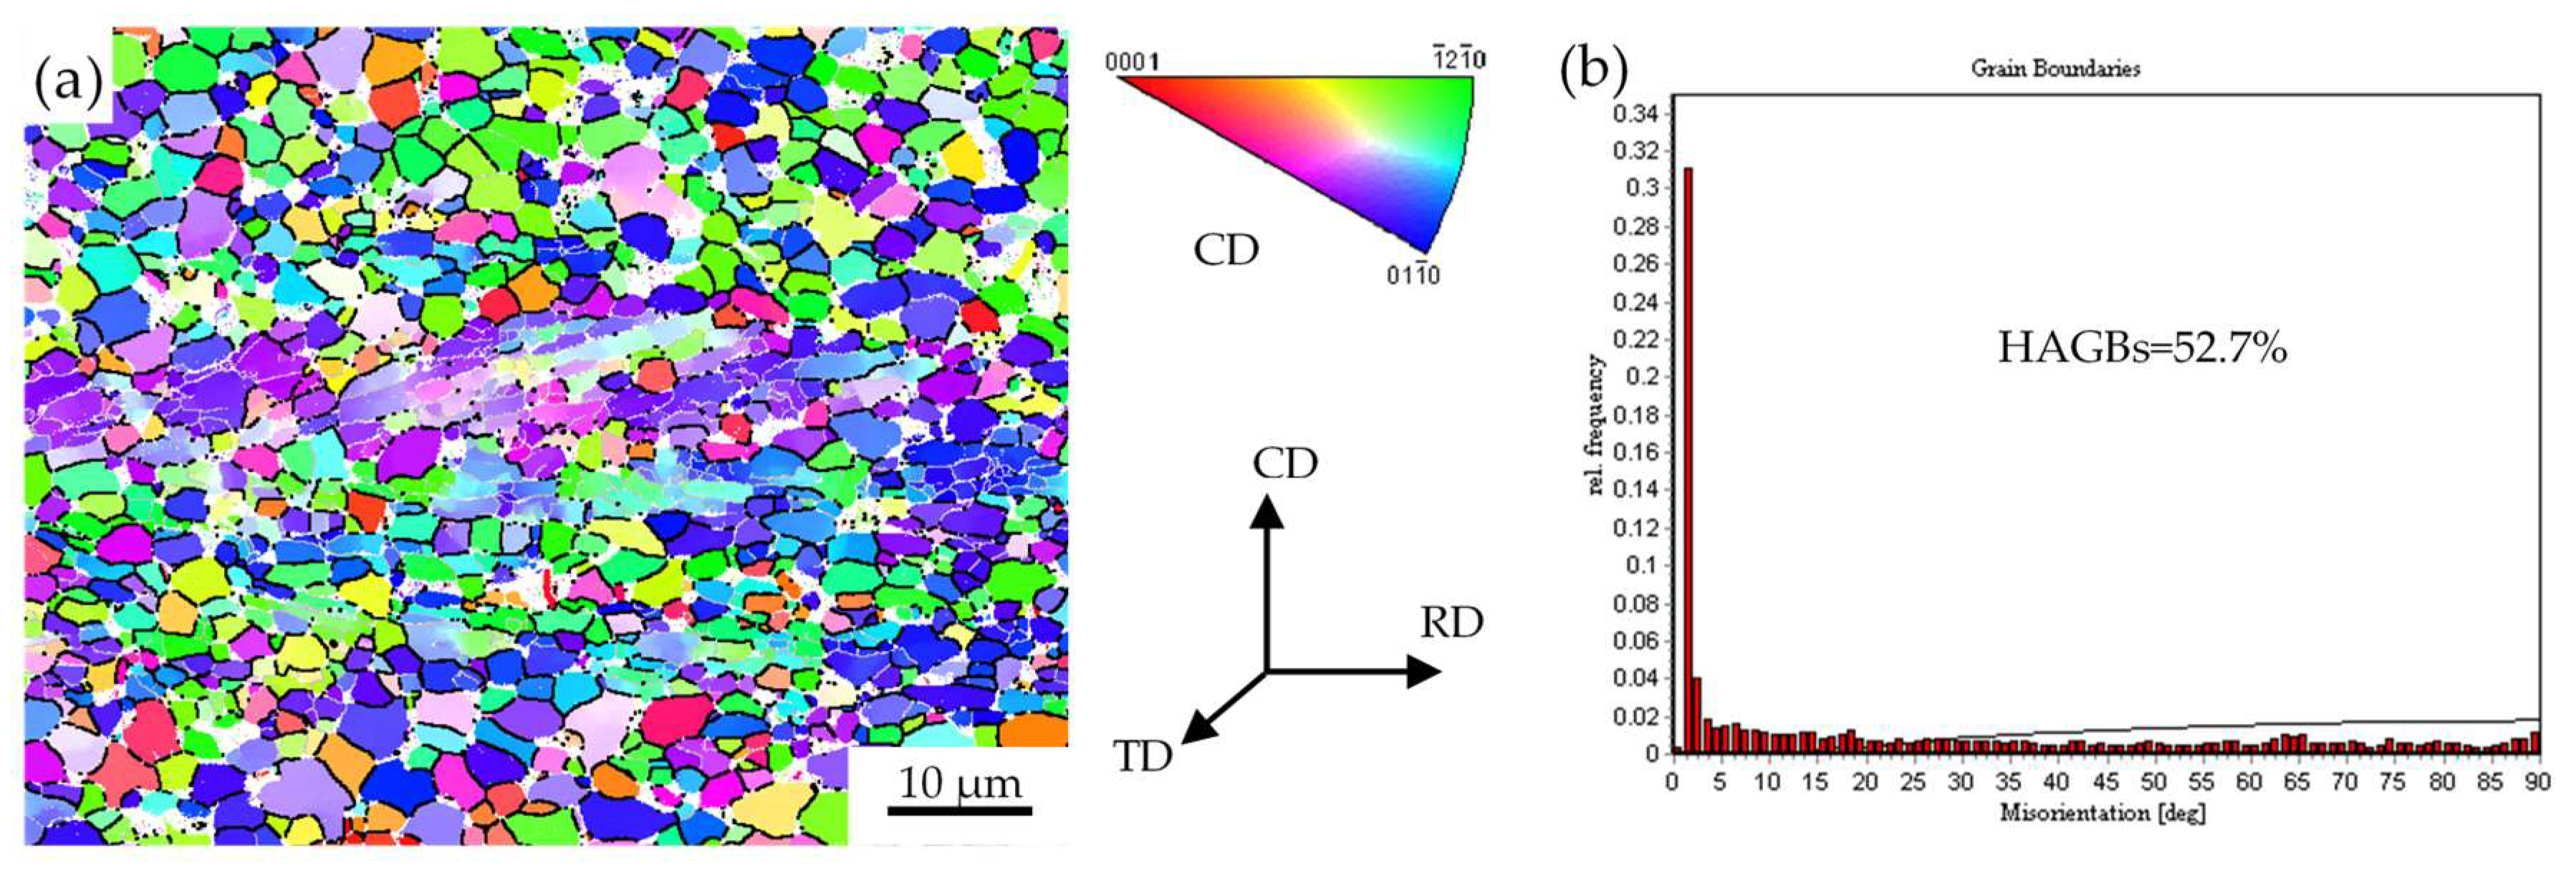
3.4. Microstructure Evolution

The deformation mechanism of metal is closely related to its stacking fault energy [31]. For metals with low stacking fault energy, the extended dislocation width is large, slipping and climbing are difficult; thus, it is difficult for dynamic recovery to occur, and dynamic recrystallization will be the main way of dynamic softening of metal. For Ti90 alloy, the stacking fault energy of α + β phase region is lower than that of the β phase region, which will lead to a difference in the deformation softening mechanism. Thus, the microstructure evolution of the Ti90 alloy in the β single-phase region and the α + β two-phase region will be discussed separately in the following sections.

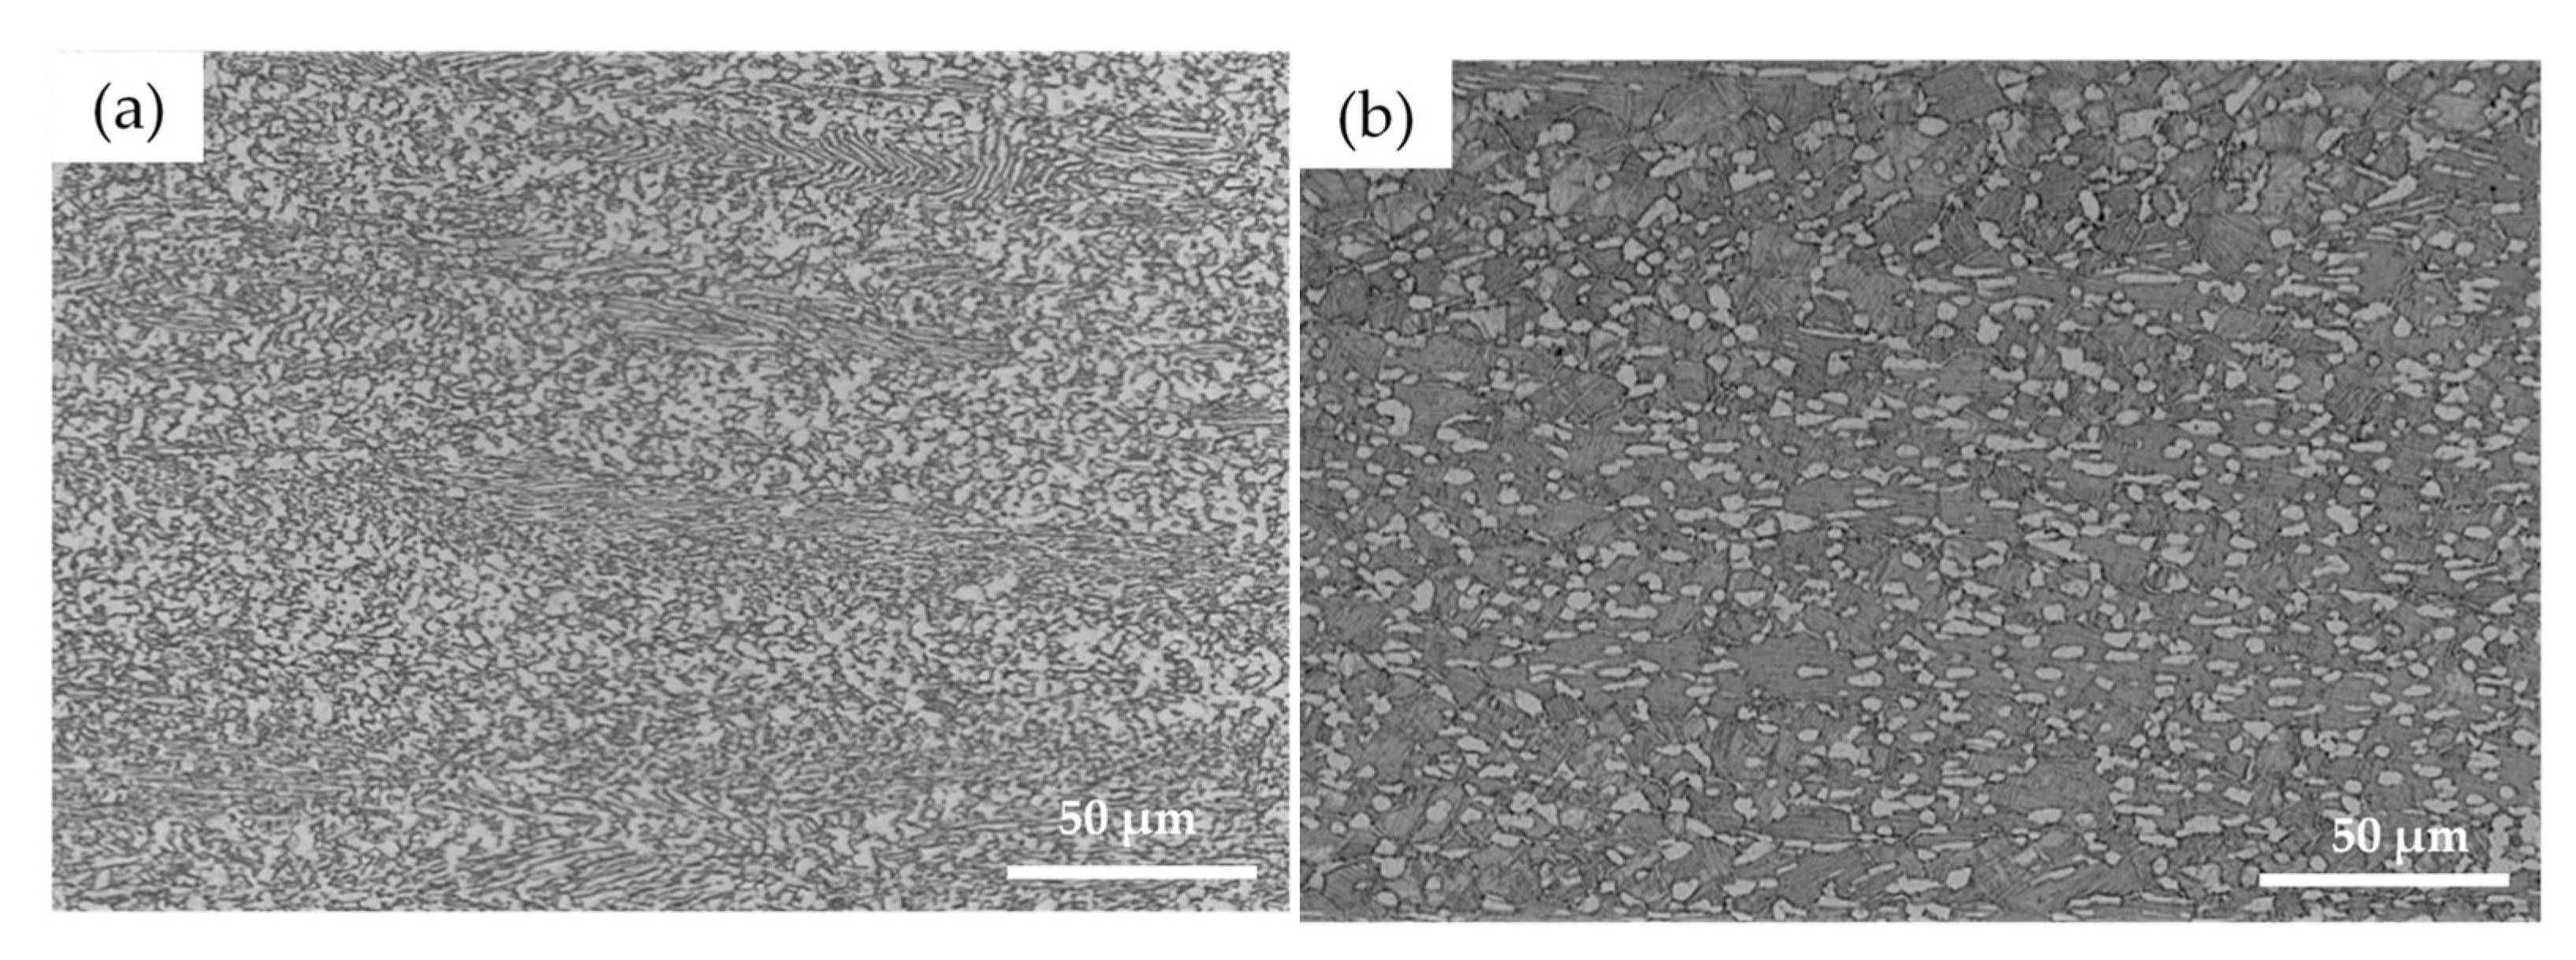
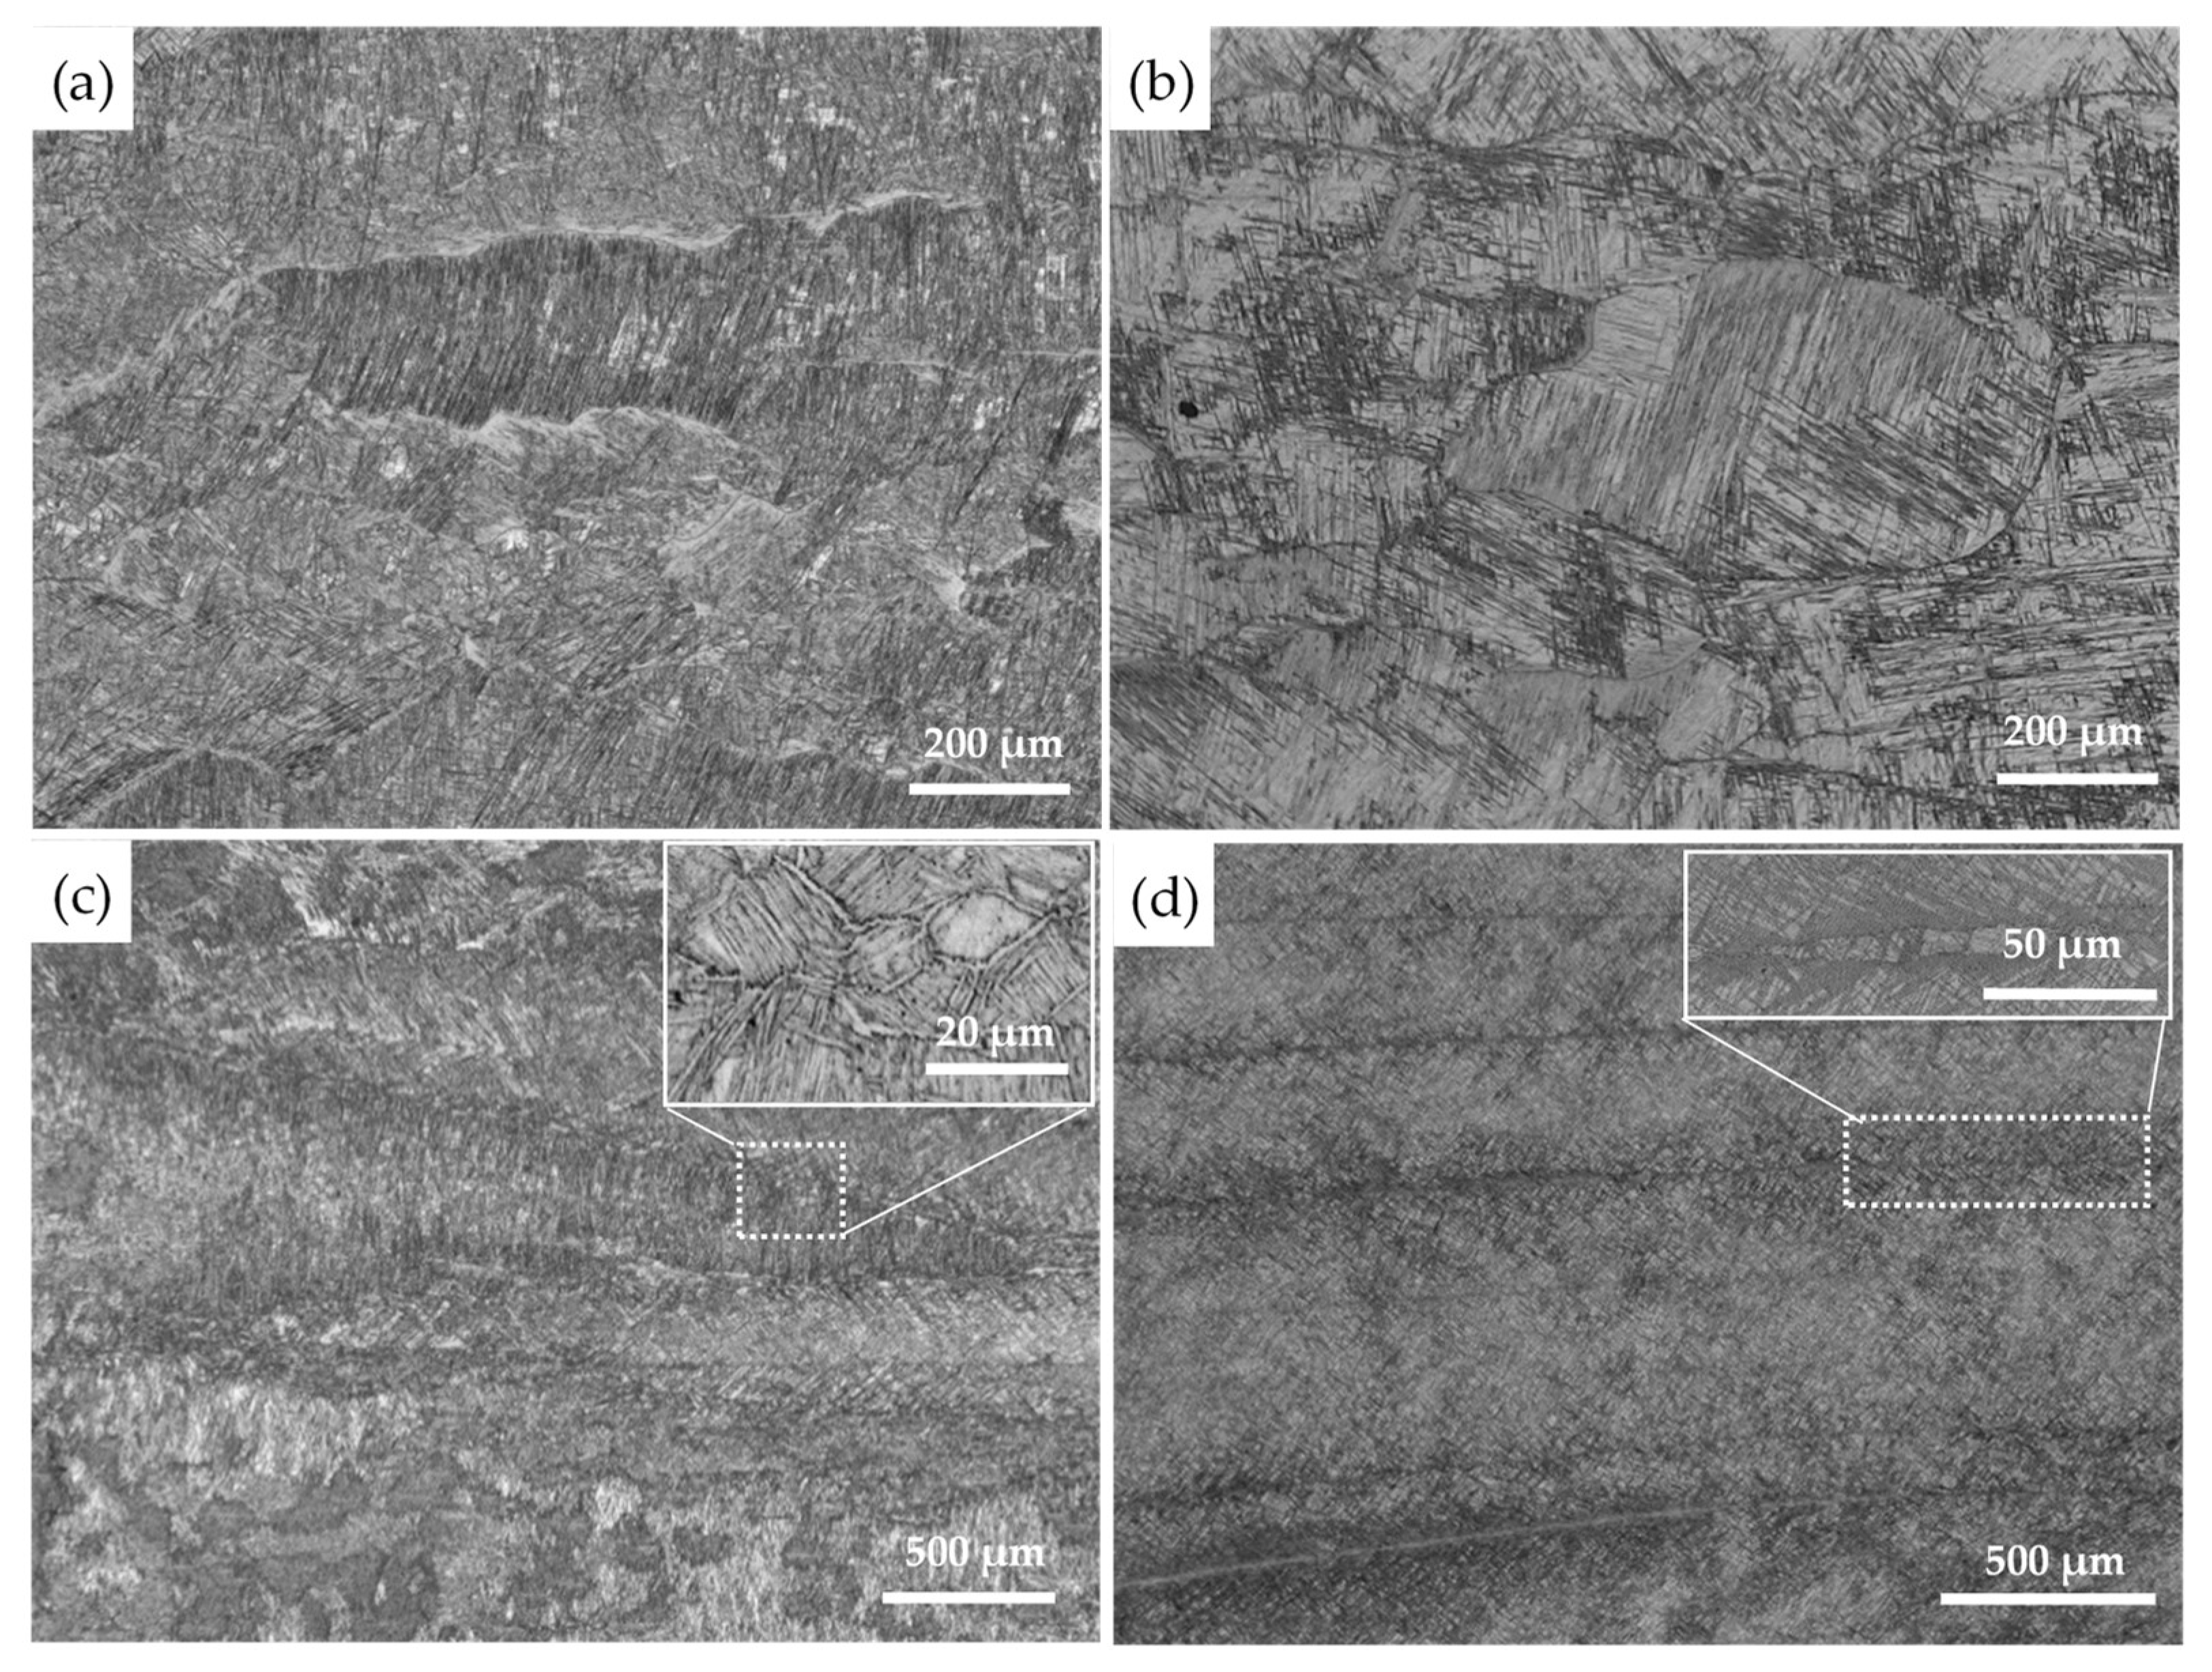
3.4.1. β Single-Phase Region

The microstructures of Ti90 samples deformed in the β single-phase region are presented in Figure 6. Primary α (αp) was transformed into the high-temperature β phase during the deformation, and secondary α (αs) precipitated during the final cooling process. For the sample deformed at 970 °C with the strain rate of 0.001 s−1 (Figure 6a), the pancaked β gains with serrated grain boundaries were elongated along the direction perpendicular to compression direction (CD), which is the classic characteristic of DRV. Meanwhile, some DRX grains can be observed at the original grain boundary, suggesting the local occurrence of DRX. Increasing the temperature to 1040 °C at the strain rate of 0.001 s−1, it can be seen in Figure 6b that the microstructure is composed of a large number of DRX grains or sub-grains whose sizes were significantly reduced compared with the original structures, indicating extensive DRX occurred in this condition. It shows that the increase of deformation temperature had a significant promoting effect on DRX.
Another important factor impacting the microstructure evolution behavior is strain rate. When strain rate increases to 1 s−1 at 1040 °C, (Figure 6c), the β grains are also elongated along the direction perpendicular to CD, while a large number of DRX grains nucleate at the boundaries, which are much smaller than the DRX grain in Figure 6b. The faster strain rate is beneficial to the nucleation of DRX grains at grain boundaries, but also causes the lack of time for the growth of new grains. Further increasing the strain rate to 10 s−1, the elongated β grains show slight bending and grain boundaries are undulating. Necklace-like β grains appear at the grain boundaries of few elongated β grains, and only a small amount of DRX grains can be observed at these positions. Overall, increasing the strain rate will inhibit the DRX process. At a low strain rate (0.001 s−1), DRX grain can nucleate not only at the original β grain boundaries, but also inside the grain, showing a complex DRX behavior, including the discontinuous dynamic recrystallization (DDRX) and the continuous dynamic recrystallization (CDRX), while only the DDRX grain can be observed at the moderate strain rate (1 s−1), and even DDRX becomes difficult to occur at the highest strain rate (10 s−1).
In summary, DRV is the main softening mechanism of Ti90 alloy during the deformation in the β single phase region, while DRX also have a small amount of contributes to the flow softening. However, increasing the temperature and reducing the strain rate both increase the extent of the DRX, which promote the flow softening. This phenomenon is consistent with the characteristic of the strain–stress curves in Figure 2c,d.

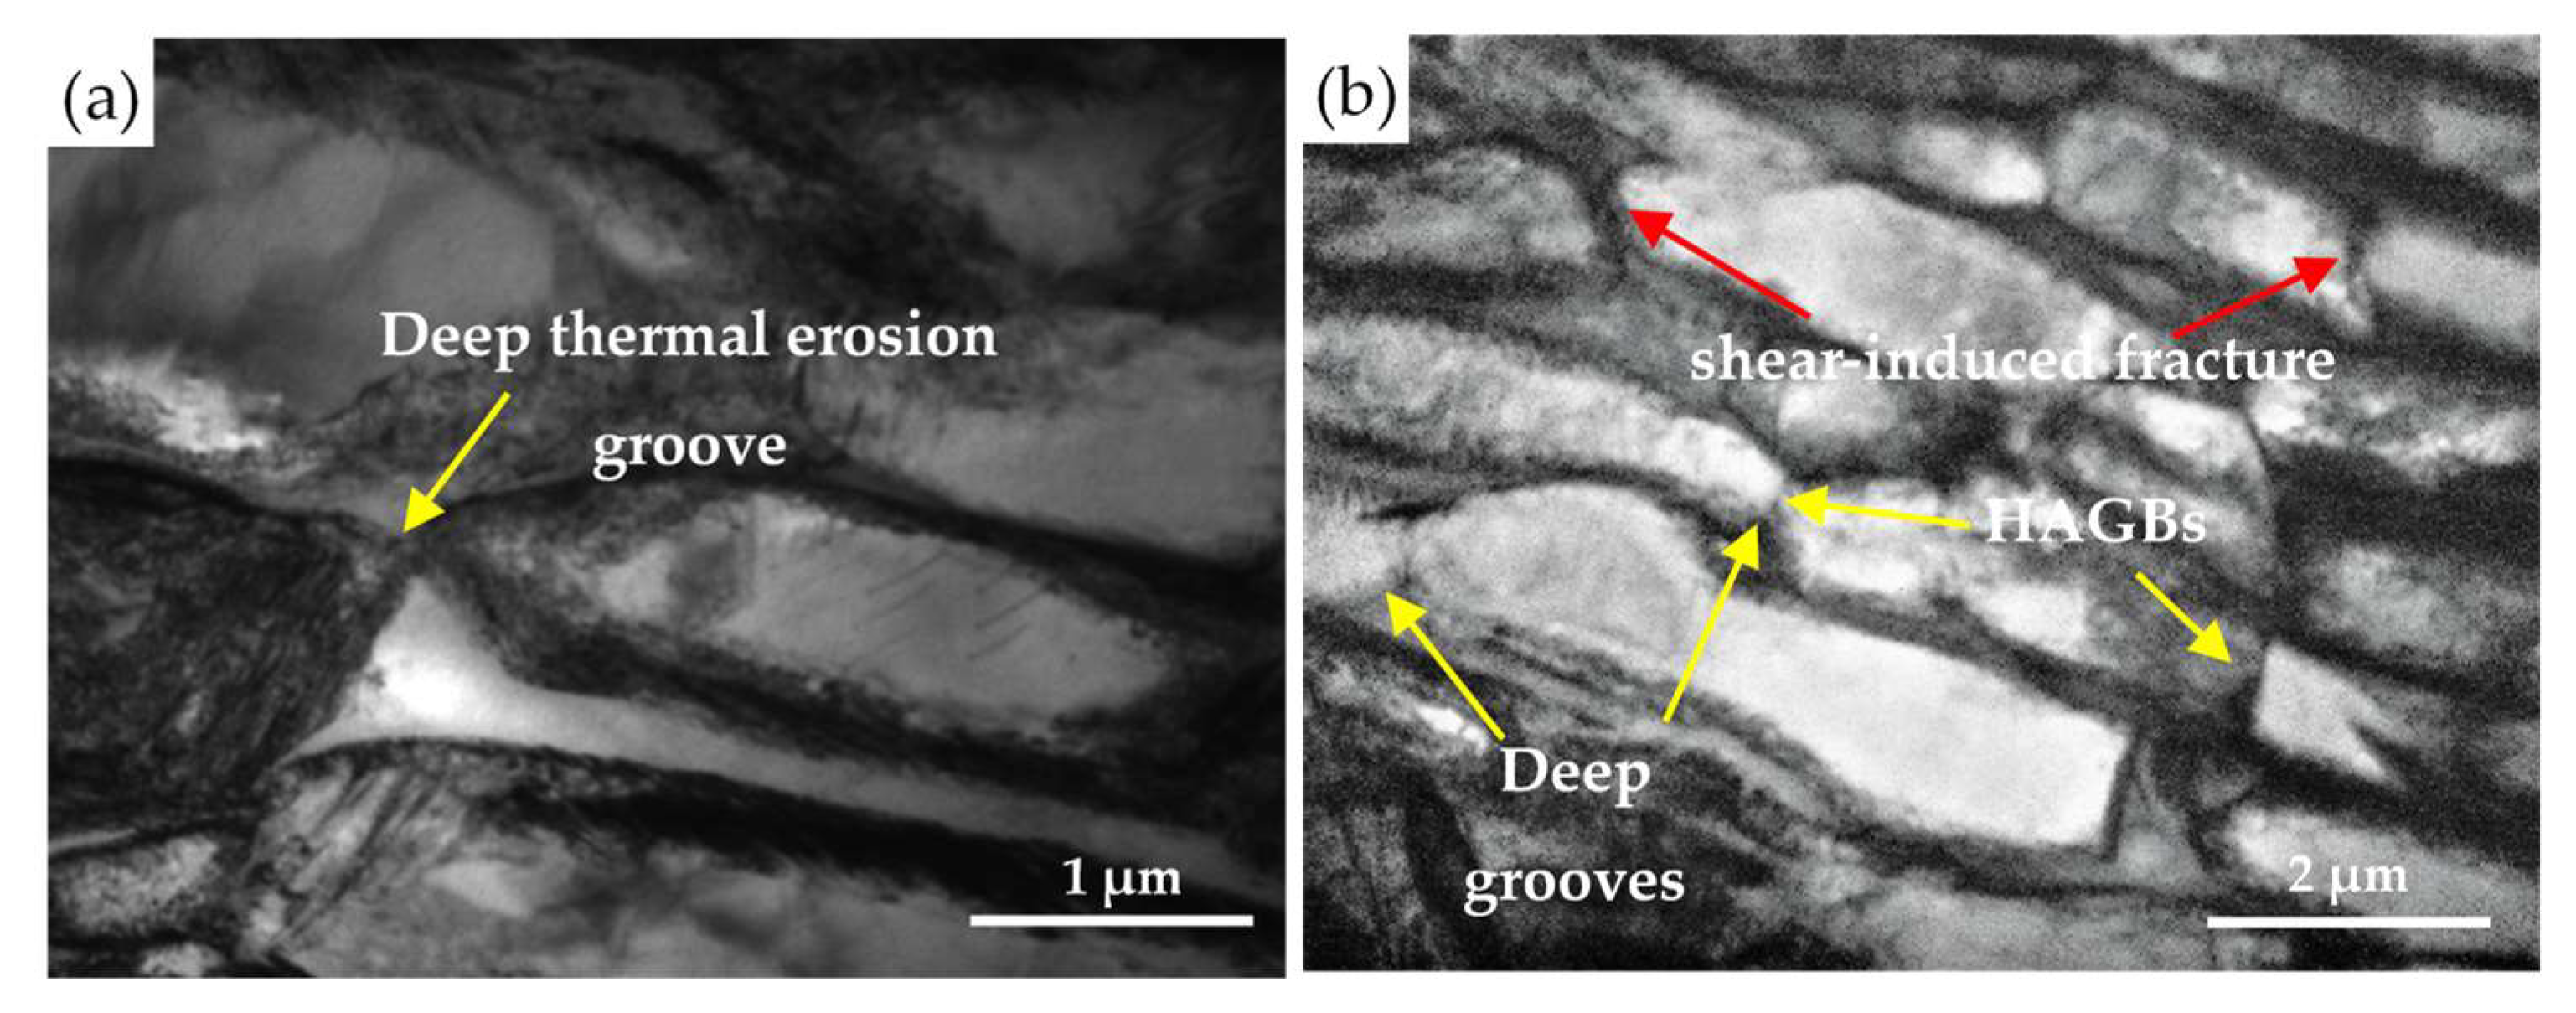
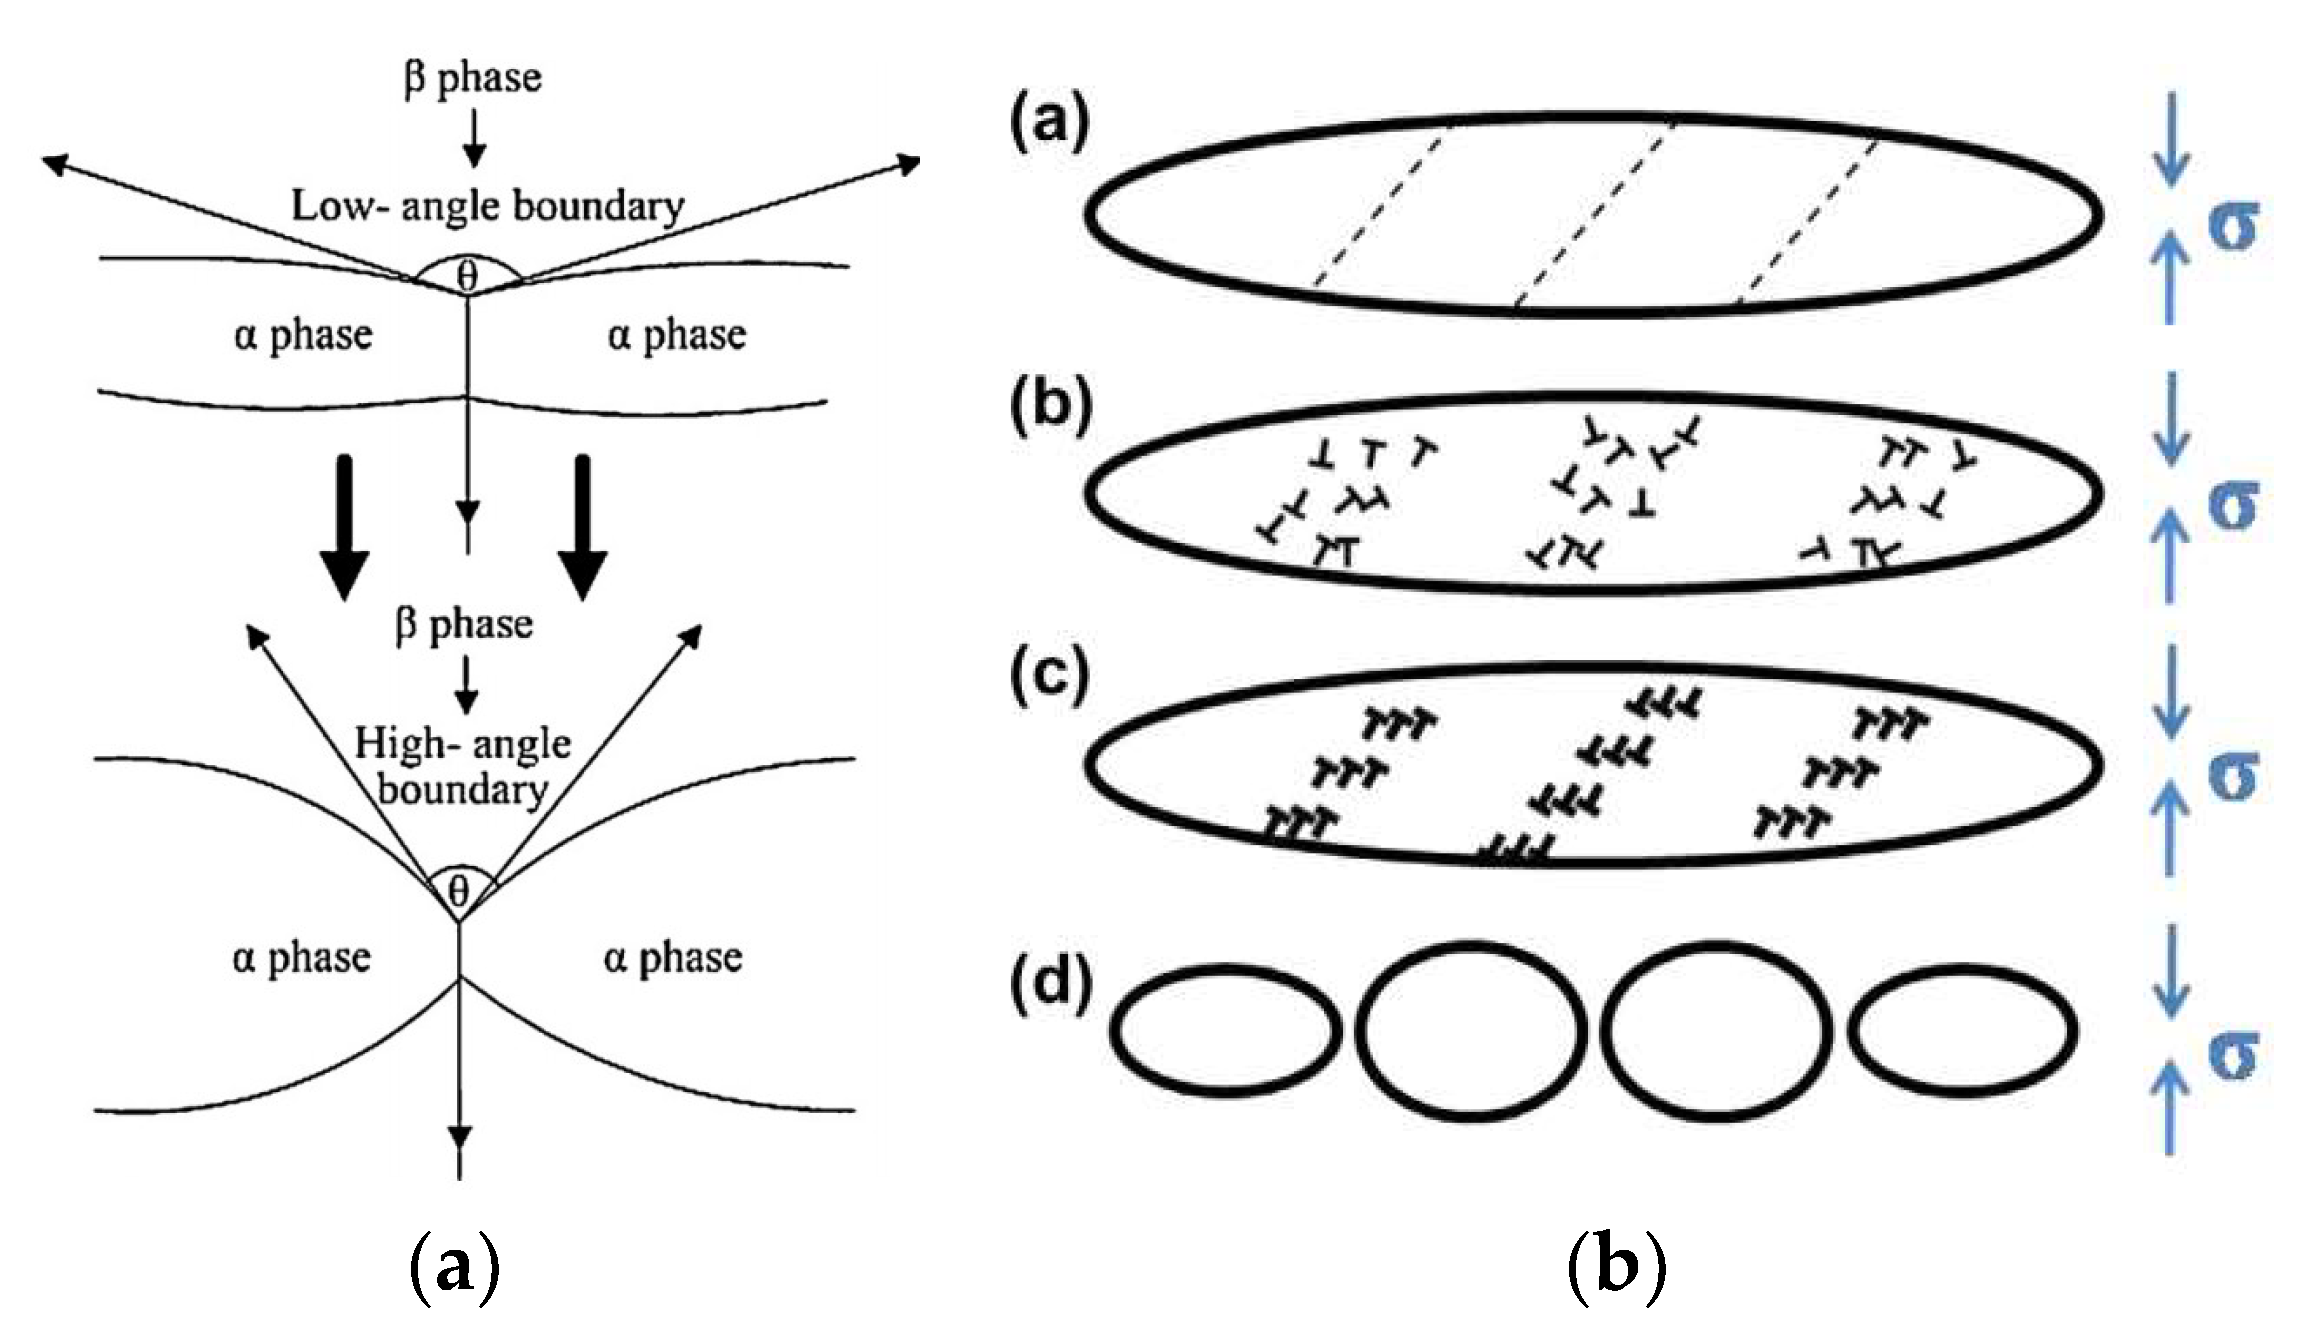
3.4.2. α + β Two-Phase Region

Figure 7 shows the microstructures obtained at different strain rates and temperatures in α + β two-phase field. The obvious effects of deformation temperature and strain rate on the microstructure of Ti90 alloy during the deformation in the α + β phase region can be obtained by comparing Figure 7a–c. One of the most noticeable phenomena is the variation of volume fractions of the primary α phases under different conditions. When the strain rate is 0.001 s−1, the volume fraction of primary α phase of the sample deformed at 900 °C (Figure 7b) is significantly lower than that of the sample deformed at 860 °C (Figure 7a). At the same time, keeping the temperature constant at 900 °C, the volume fraction of the primary α phase of the sample deformed at the strain rate of 0.001 s−1 (Figure 7b) is also considerably lower than that deformed at 1 s−1 (Figure 7c). It can be seen that the volume fraction of the primary α phase (αp) decreases greatly with the increase of deformation temperature and decrease of the strain rate. The change of the αp volume fraction reflects the effect of the deformation parameters on the dynamic phase transformation of α→β during the compression. The decreasing strain rate prolongs the deformation time and weakens the adiabatic temperature rise, which promotes the dynamic α→β phase transformation and induces more αp transform into the high-temperature β phase during the deformation process. However, it is difficult to determine the impact of temperature on the dynamic α→β phase transformation because the static α→β phase transformation also occurs during the holding process.
Another noteworthy phenomenon is the evolution of the α lamellar morphology at different temperatures and strain rates. As can be seen in Figure 7a–c, after deformation in the α + β two-phase region, the morphology of the original primary α changes from straight lamella to equiaxed, short rod-shaped (including elongated α lamella), or kinked lamella. This indicates that the main softening mechanism of the Ti90 alloy during the deformation in the α + β two-phase region is the dynamic globularization, fragmentation, and kinking of α lamellae. Under different deformation conditions, the proportions of the above three states in the primary α phase are obviously different. By comparing Figure 7a–c, it can be easily judged that the proportion of equiaxed state is in the order of 900 °C–0.001 s−1 > 870 °C–0.001 s−1 > 900 °C–1 s−1, the proportion of short rod-shaped state is in the order of 900 °C–0.001 s−1 > 870 °C–0.001 s−1 > 900 °C–1 s−1, and the proportion of kinked lamella state is in the order of 900 °C–1 s−1 > 870 °C–0.001 s−1 > 900 °C–0.001 s−1. The degree of the globularization increases while the degree of kinking decreases with the decrease of strain rate and the increase of temperature. It can be seen that high temperature and low speed can effectively promote the dynamic globularization of lamellar α, resulting in softening of flow stress, as shown in Figure 2a–b. When the strain rate increases to 10 s−1 at 900 °C, severe flow localization was observed in Figure 7d. This deformation condition is in the low η region (within 860–918 °C, 0.318–10 s−1) in the processing map shown in Figure 5. Therefore, it can be inferred that flow localization is one of the main reasons for the instability of Ti90 alloy during low temperature and high strain rate deformation.
TEM was used to further analysis the dynamic globularization mechanism of α lamella, and the results are shown in Figure 8. Currently, the dynamic globularization mechanism is basically divided into two categories. One is the β phase wedging model [32,33,34], as illustrated in Figure 9a. During the deformation, the α/α sub-boundaries across the lamellae are formed. At the interface between α/α and α/β grain boundaries, alloying elements are diffused and redistributed due to interfacial tension, resulting in the wedging of β phase, which leads to the formation and deepening of thermal erosion grooves. Finally, the lamellar is separated into shorter ones or spheroids along the α/α interface. The other is the α lamella shearing model [16,29,33], as illustrated in Figure 9b. The dynamic globularization of α lamella is divided into four steps: shearing of α lath, the generation of dislocations along the shear line, the nucleation of interface due to DRV and the formation of α globules due to the migration of interfaces. In Figure 8, the deep thermal erosion grooves with the related HAGBs were observed, suggesting that globularization behavior of α lamellae is consistent with the β phase wedging model. The wedging of β phase into α lamellar is actually a diffusion process of alloying elements, so the increase of temperature and the decrease of strain rate are favorable to the dynamic globularization. At the same time, the shear induced α lamellar fracture can also be observed, which is in accord with the α lamella shearing model. Therefore, the two globularization modes jointly lead to the dynamic globularization of α lamellae during the deformation in the α + β two-phase region.

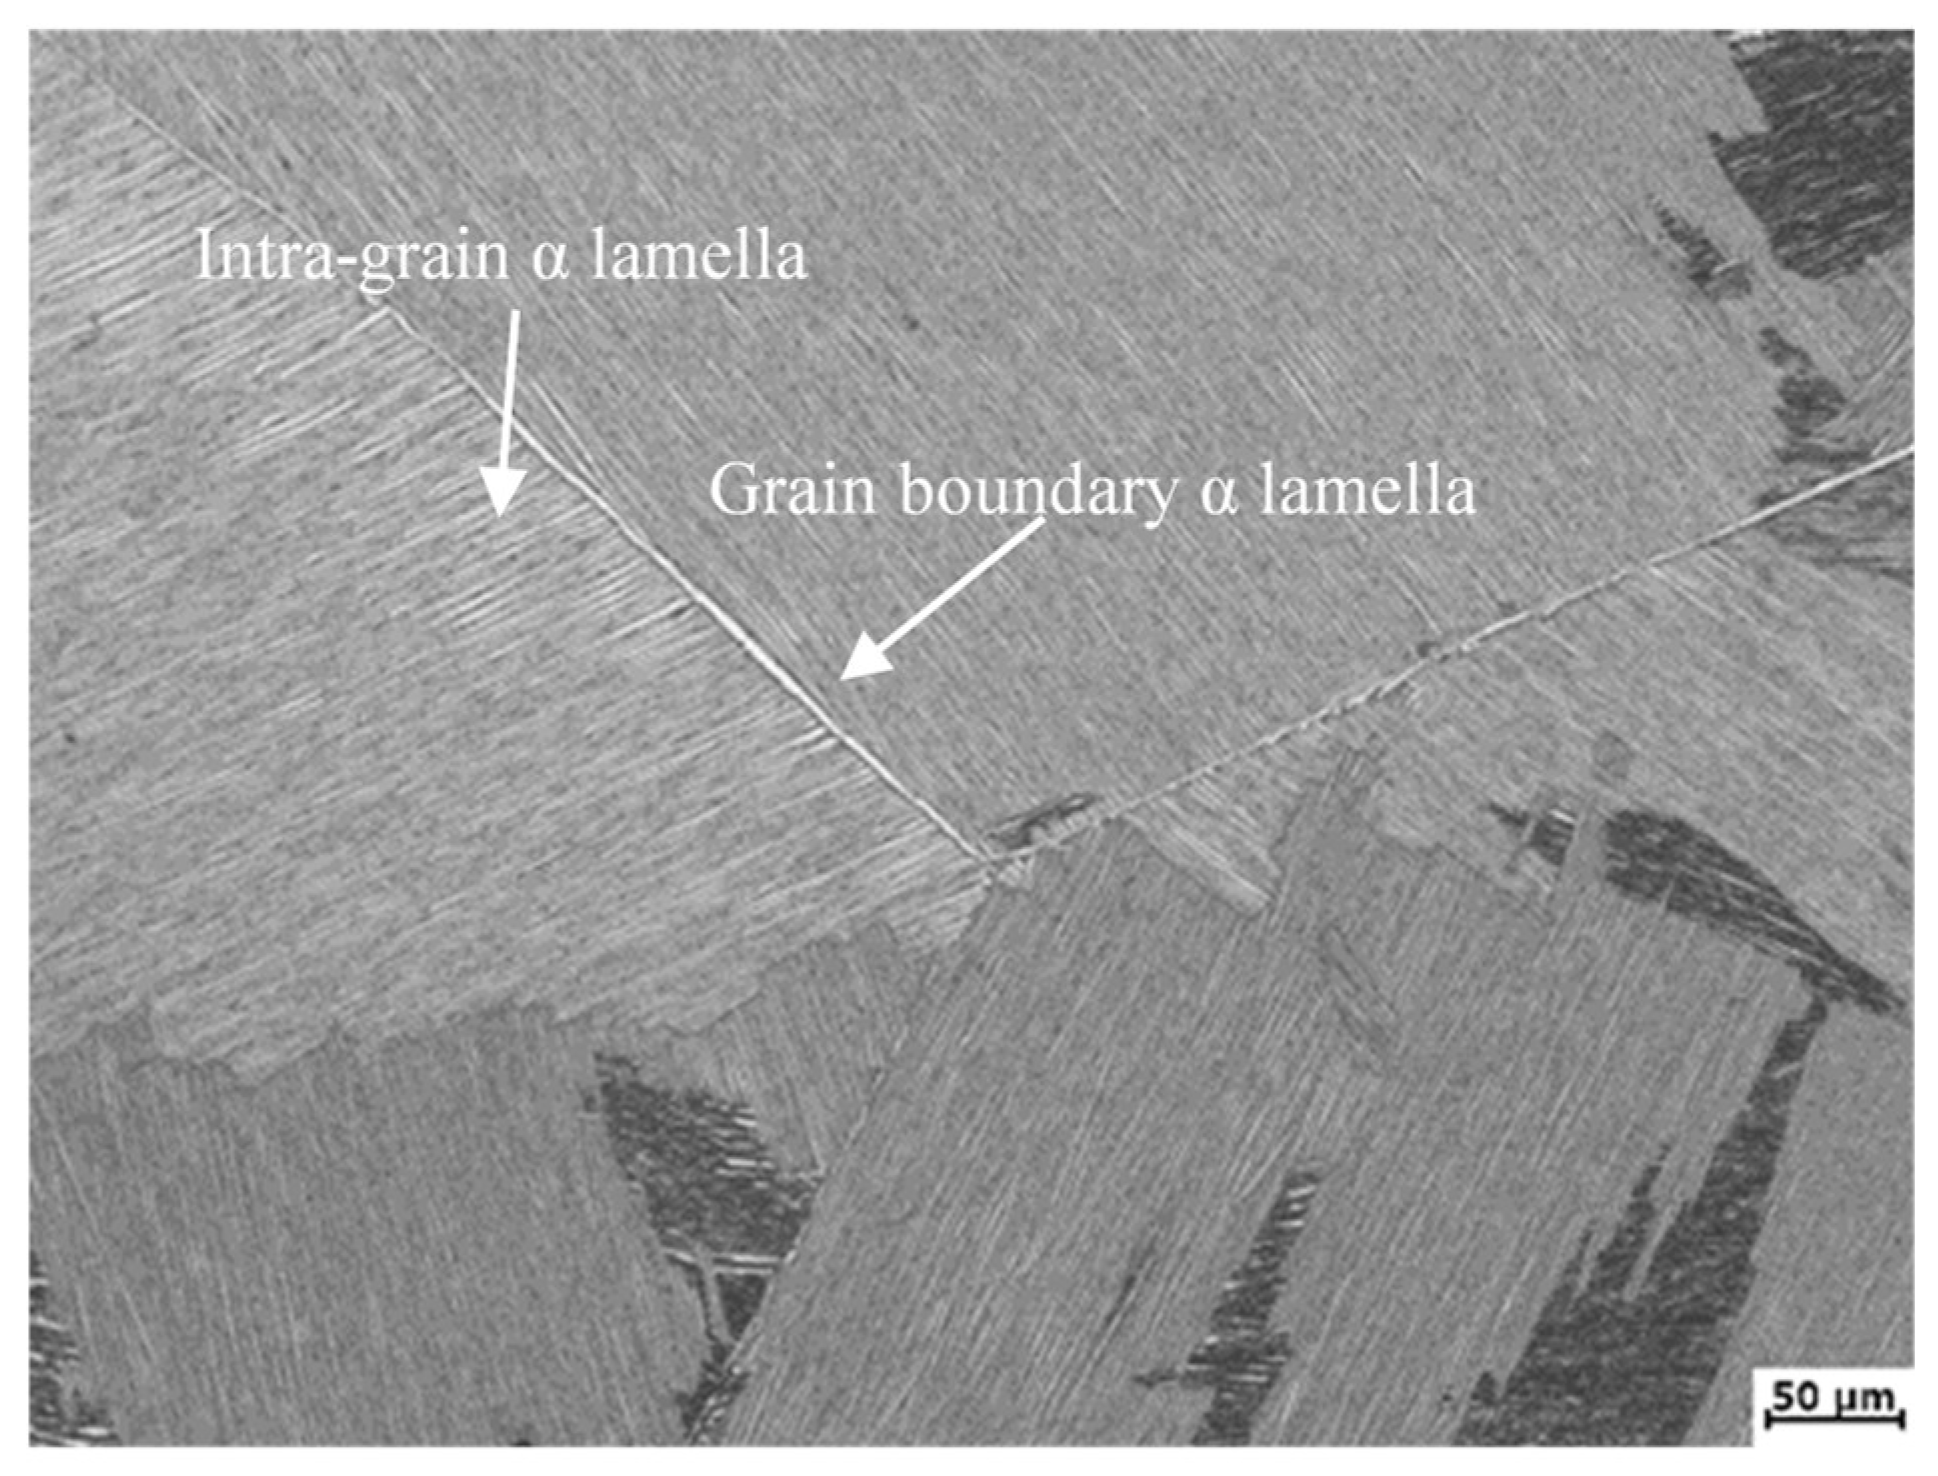
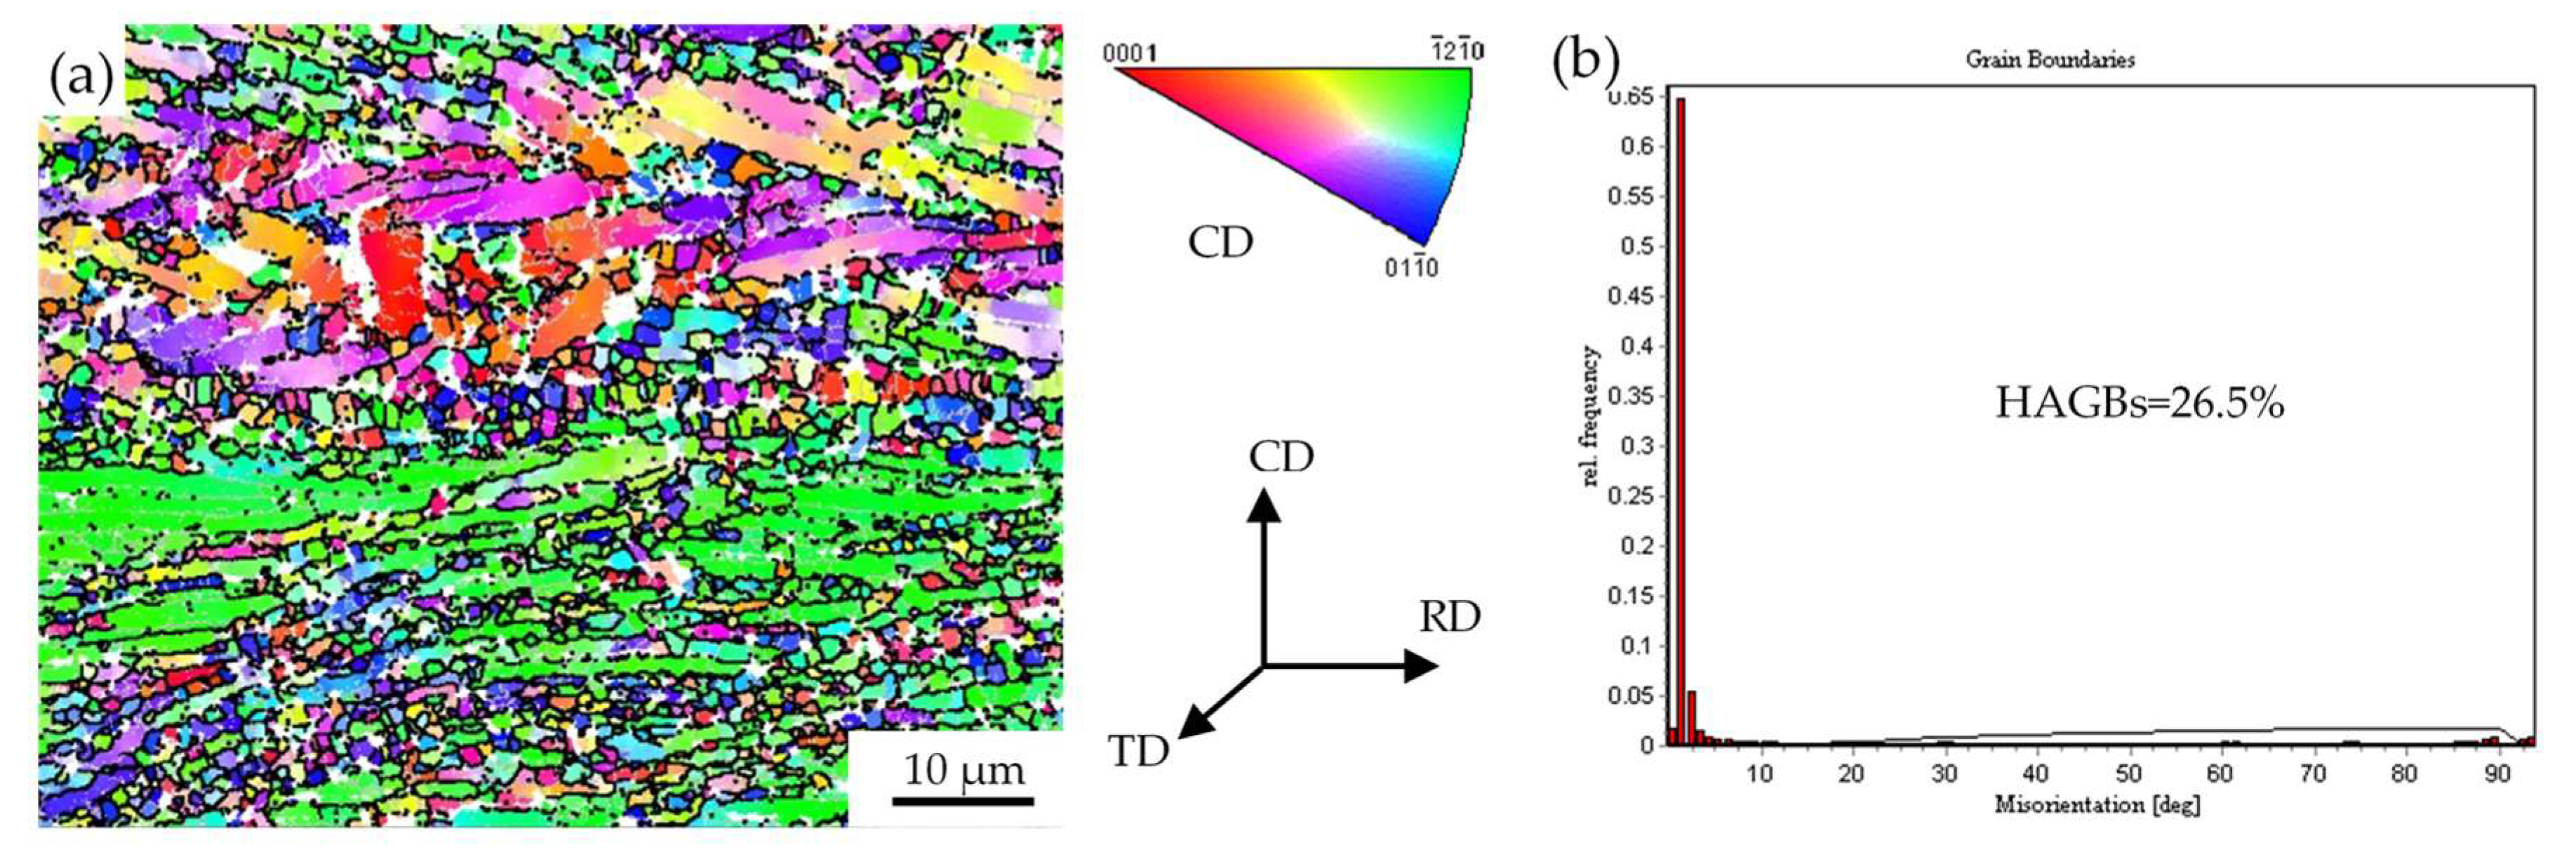
3.4.3. The Crystallographic Orientation Change of Lamellar α

EBSD is further used to analyze the crystallographic orientation evolution of Ti90 alloy during the deformation. Figure 10, Figure 11 and Figure 12 show the inverse pole figure (IPF) maps and the corresponding distributions of boundary misorientation for the α phase under different deformation conditions. As shown in Figure 10a, when deformed at 860 °C with a strain rate of 0.001 s−1, most of the α grains are spheroidized and surrounded by high angle grain boundaries (HAGBs). Obvious misorientations between adjacent grains can be observed. The phenomena above suggest that the primary α lamellae have undergone sufficient DRX during the deformation. The statistical result in Figure 10b shows that the content of HAGBs is as high as 52.7%, which further proves that DRX is the main deformation mechanism under this condition. The orientation change of residual α lamellar is also noteworthy. The formation of internal misorientations and low grain boundaries (LAGBs) within the α lamellae, which are the typical characteristics of DRV, are favorable for the further spheroidization. Besides, the β wedging model of dynamic globularization can be further ascertained from the formation of the α/α sub-boundaries observed in Figure 10a.
When the deformation temperature is raised to 900 °C, it can be seen from Figure 11a that the volume fraction of the primary α phase decreases significantly, and the secondary α phase precipitates in large quantities. Corresponding peaks near 70° and 90° are observed in the misorientation distribution (Figure 11b). The variant selection when lamellar α precipitates from the β phase during the post-cooling process should be the reason. The orientation of the local uneven deformation zone is also detected. The intragranular misorientations and LAGBs can be found in the interior of the un-spheroidized lamellar α, indicating the occurrence of DRV. The presence of local texture [0001]//CD can also be revealed by the similar color of the area. Increasing the strain rate to 1 s−1 with the temperature of 900 °C, as shown in Figure 12a, the α phase is mostly elongated or kinked lamella. Small DRX grains with obvious misorientation from surrounding grains can be found between the lamellae, indicating that DRX can also occur under this condition. The corresponding statistical content of HABGs is 26.5%, which is much smaller than that under the condition of 0.001 s−1, showing the inhibition of DRX with an increasing strain rate. At the same time, there are obvious misorientations in the kinked α lamellae, indicating that the kinking of the α lamellae is accompanied by the rotation of crystallographic orientation, which will promote the formation of sub-grain boundaries and contributes to the further nucleation of DRX. In addition, there is no misorientation between the two sides of some sub-grain boundaries inside the kinked lamellar, which may suggest that the formation of these sub-grain boundaries is caused by the local shear strain. This proves the existence of the dynamic globularization mechanism of the α lamella shearing model to some extent.
Figure 13 shows the Schmid factor maps of the basal slip (0001) <11–20>, prismatic slip (1–100) <11–20>, and pyramidal slip (1–101) <11–20> of Ti90 alloy deformed in the α + β two-phase region. Slip system with large Schmid factor is easier to be activated. As shown in Figure 13 and Table 1, the Schmid factor of the prismatic slip and pyramidal slip are larger than that of the base slip under all deformation conditions on the whole, indicating that the prismatic and pyramidal slip are easier to be activated compared to the basic slip. For the hexagonal close-packed (hcp) structure, the activations of prismatic and pyramidal slip systems are easier when the axial ratio (c/a) is less than 1.733 [35]. Thus, the above phenomenon should be due to the relatively small axial direction of α-Ti, which is only 1.587.
In addition, the Schmid factors of α grains with different morphological characteristics differ greatly. For the equiaxial α under all conditions, the Schmid factor of the prismatic slip and pyramidal slip are significantly larger than that of base slip. The consistency with the intrinsic deformation characteristics of HCP α-Ti indicates that the equiaxial α has a random orientation, which can be further confirmed by the related IPF maps Figure 10, Figure 11 and Figure 12. However, for the lamellar α elongated perpendicular to the compression direction (CD), the Schmid factors are in the order as: prismatic slip > pyramidal slip > basal slip. As can be seen in Figure 11a and Figure 12a, the c axes of these α lamellae are nearly perpendicular to CD. Thus, the basal slip is hard to be activated [36]. As the activation of pyramidal slip needs larger critical shear stress [37,38], the deformation is mainly realized through prismatic slip. Therefore, the dynamic globularization is hard for these elongated α lamellae.
The Schmid factors of the kinked α lamella—different from the elongated lamellar α—are in the order as: pyramidal slip > basal slip > prismatic slip. Figure 12a shows that this c-axis of these α lamellae has a small angle with CD. It was pointed out that, when the angle between the c-axis of α lamella and CD is within the range of 0–20°, the basal and prismatic slip are difficult to be activated, which will induce the kinking of the lamella [36,37]. At the same time, it can be seen from Figure 10a and Figure 13a1–a3 that when the angle between the lamellar α and CD is about 45°, the Schmid factors of different slip systems are similar. Therefore, it can be certified that the Schmid factor of lamellar α depends greatly on its geometric orientation.

4. Conclusions

In the present work, the flow behavior and microstructure evolution of as-cast Ti90 titanium alloy were systematically investigated. The results are as follows:
  • In the α + β two-phase region, the flow stress reaches the peak and then decreases gradually until reaching the stable state under large strain, while in the β single-phase region, the flow stress directly reaches a stable state after reaching the peak value. The increase of strain rate and the decrease of temperature both lead to the increase of flow stress, and the effect of the former is more significant.
  • The Arrhenius constitutive equations and processing map of Ti90 alloy were established. The values of deformation activation energy Q were calculated to be 673 kJ·mol−1 in the α + β two-phase region and 161 kJ·mol−1 in the β single-phase region. The DRV of β phase is the dominate deformation behavior for Ti90 alloy in the β single-phase region, while the kinking and dynamic globularization of α lamellae are the dominate deformation behaviors for Ti90 alloy in the α + β region.
  • Based on the processing map, the low η region within the temperature range of 860–918 °C with a strain rate range of 0.318–10 s−1 should be avoided to prevent the occurrence of deformation instability during the selection of hot processing parameters of Ti90 alloy.
  • The dynamic globularization of α lamellae is thought to be mainly caused by the wedge of the β phase into α lath and the shearing of the α lath result from the applied shear strain; the prismatic slip and the pyramidal slip are easier activated than that of the basic slip. The Schmid factor depends on the morphology of the α phase and the geometric orientation of lamellar α.

Author Contributions

Supervision, Y.Z.; conceptualization, K.W. and Y.Z.; validation, W.J.; methodology, investigation, data curation, formal analysis, and writing—original draft preparation, K.W.; writing—review and editing, W.J. and Y.Z.; resources: S.L. and C.M. All authors have read and agreed to the published version of the manuscript.

Funding

This research received no external funding.

Data Availability Statement

All raw data supporting the conclusion of this paper are provided by the authors.

Conflicts of Interest

The authors declare no conflict of interest.

References

  1. Zhou, D.; Zeng, W.; Xu, J.; Wang, S.; Chen, W. Evolution of equiaxed and lamellar α during hot compression in a near alpha titanium alloy with bimodal microstructure. Mater. Charact. 2019, 151, 103–111. [Google Scholar] [CrossRef]
  2. Banerjee, D.; Williams, J.C. Perspectives on Titanium Science and Technology. Acta Mater. 2013, 61, 844–879. [Google Scholar] [CrossRef]
  3. Xu, J.; Zeng, W.; Zhao, Q.; Zhou, D.; He, S.; Jia, R.; Zhou, X. Analysis of deformation behavior and microstructure of a near-alpha titanium alloy in single phase region. Mater. Sci. Eng. A 2021, 803, 140723. [Google Scholar] [CrossRef]
  4. Zhou, D.; Zeng, W.; Xu, J.; Chen, W.; Wang, S. Characterization of Hot Workability for a Near Alpha Titanium Alloy by Integrating Processing Maps and Constitutive Relationship. Adv. Eng. Mater. 2019, 21, 1801232. [Google Scholar] [CrossRef]
  5. Wang, K.; Zhao, Y.; Jia, W.; Hou, Z.; Li, S.; Mao, C. Effect of Heat Treatment on Microstructures and Properties of Ti90 Alloy. Rare Met. Mater. Eng. 2021, 50, 552–561. [Google Scholar]
  6. Jia, W.; Zeng, W.; Zhou, Y.; Liu, J.; Wang, Q. High-temperature deformation behavior of Ti60 titanium alloy. Mater. Sci. Eng. A 2011, 528, 4068–4074. [Google Scholar] [CrossRef]
  7. Rezaee, M.; Zarei-Hanzaki, A.; Ghambari, M.; Nezhadfar, P.D.; Ghasemi, E. Flow Characterization of a Duplex near α Ti6242 Alloy through Interrelation of Microstructural Evolution, 3D Activation Energy Map, and Processing Map. Adv. Eng. Mater. 2016, 18, 1075–1085. [Google Scholar] [CrossRef]
  8. Wu, C.; Yang, H.; Li, H. Simulated and experimental investigation on discontinuous dynamic recrystallization of a near-α TA15 titanium alloy during isothermal hot compression in β single-phase field. Trans. Nonferrous Met. Soc. China 2014, 24, 1819–1829. [Google Scholar] [CrossRef]
  9. Balasundar, I.; Raghu, T.; Kashyap, B.P. Hot working and geometric dynamic recrystallisation behaviour of a near-α titanium alloy with acicular microstructure. Mater. Sci. Eng. A 2014, 600, 135–144. [Google Scholar] [CrossRef]
  10. Gao, P.; Cai, Y.; Zhan, M.; Fan, X.; Lei, Z. Crystallographic orientation evolution during the development of tri-modal microstructure in the hot working of TA15 titanium alloy. J. Alloys Compd. 2018, 741, 734–745. [Google Scholar] [CrossRef]
  11. Zhang, Z.; Fan, J.; Tang, B.; Kou, H.; Wang, J.; Chen, Z.; Li, J. Microstructure/texture evolution maps to optimize hot deformation process of near-α titanium alloy. Prog. Nat. Sci. 2020, 30, 86–93. [Google Scholar] [CrossRef]
  12. Zhao, J.; Lv, L.; Wang, K.; Liu, G. Effects of strain state and slip mode on the texture evolution of a near-α TA15 titanium alloy during hot deformation based on crystal plasticity method. J. Mater. Sci. Technol. 2020, 38, 125–134. [Google Scholar] [CrossRef]
  13. Peng, W.; Zeng, W.; Wang, Q.; Yu, H. Characterization of high-temperature deformation behavior of as-cast Ti60 titanium alloy using processing map. Mater. Sci. Eng. A 2013, 571, 116–122. [Google Scholar] [CrossRef]
  14. Lei, J.; Zhu, W.; Chen, L.; Sun, Q.; Xiao, L.; Sun, J. Deformation behaviour and microstructural evolution during the hot compression of Ti-5Al4Zr8Mo7V alloy. Mater. Today Commun. 2020, 23, 100873. [Google Scholar] [CrossRef]
  15. Su, Y.; Kong, F.; You, F.; Wang, X.; Chen, Y. The high-temperature deformation behavior of a novel near-α titanium alloy and hot-forging based on the processing map. Vacuum 2020, 173, 109135. [Google Scholar] [CrossRef]
  16. Fan, J.K.; Kou, H.C.; Lai, M.J.; Tang, B.; Chang, H.; Li, J.S. Characterization of hot deformation behavior of a new near beta titanium alloy: Ti-7333. Mater. Eng. 2013, 49, 945–952. [Google Scholar] [CrossRef]
  17. Peng, W.; Zeng, W.; Wang, Q.; Yu, H. Comparative study on constitutive relationship of as-cast Ti60 titanium alloy during hot deformation based on Arrhenius-type and artificial neural network models. Mater Des. 2013, 51, 95–104. [Google Scholar] [CrossRef]
  18. Zhao, Q.; Yang, F.; Torrens, R.; Bolzoni, L. Comparison of hot deformation behaviour and microstructural evolution for Ti-5Al-5V-5Mo-3Cr alloys prepared by powder metallurgy and ingot metallurgy approaches. Mater Des. 2019, 169, 107682. [Google Scholar] [CrossRef]
  19. Sellars, C.M.; Mctegart, W.J. On the mechanism of hot deformation. Acta Metall. 1966, 14, 1136–1138. [Google Scholar] [CrossRef]
  20. Sellars, C.M.; Tegart, W. Hot Workability. Int. Mater. Rev. 1972, 17, 1–24. [Google Scholar] [CrossRef]
  21. Wu, C.; Huang, L.; Li, C.M. Experimental investigation on dynamic phase transformation and texture evolution of Ti55531 high strength titanium alloy during hot compression in the α + β region. Mater. Sci. Eng. A 2020, 773, 138851. [Google Scholar] [CrossRef]
  22. Viguier, B. Dislocation densities and strain hardening rate in some intermetallic compounds, Materials science & engineering. A, Structural materials: Properties. Microstruct. Process. 2003, 349, 132–135. [Google Scholar]
  23. Dyment, F.; Libanati, C.M. Self-diffusion of Ti, Zr, and Hf in their hcp phases, and diffusion of Nb95 in hcp Zr. J Mater Sci. 1963, 3, 349–359. [Google Scholar] [CrossRef]
  24. Reca, N.; Libanati, Y. Autodifusion de titanio beta y hafnio beta. Acta Metall. 1968, 16, 1297–1305. [Google Scholar] [CrossRef]
  25. Dudova, N.; Belyakov, A.; Sakai, T.; Kaibyshev, R. Dynamic recrystallization mechanisms operating in a Ni-20%Cr alloy under hot-to-warm working. Acta Mater. 2010, 58, 3624–3632. [Google Scholar] [CrossRef]
  26. Prasad, Y.V.R.K.; Seshacharyulu, T. Modelling of hot deformation for microstructural control. Int. Mater. Rev. 1998, 43, 243–258. [Google Scholar] [CrossRef]
  27. Prasad, Y.V.R.K.; Gegel, H.L.; Doraivelu, S.M.; Malas, J.C.; Morgan, J.T.; Lark, K.A.; Barker, D.R. Modeling of dynamic material behavior in hot deformation: Forging of Ti-6242. Metall. Trans. A 1984, 15, 1883–1892. [Google Scholar] [CrossRef]
  28. Peng, X.; Guo, H.; Shi, Z.; Qin, C.; Zhao, Z.; Yao, Z. Study on the hot deformation behavior of TC4-DT alloy with equiaxed α + β starting structure based on processing map. Mater. Sci. Eng. A 2014, 605, 80–88. [Google Scholar] [CrossRef]
  29. Seshacharyulu, T.; Medeiros, S.C.; Morgan, J.T.; Malas, J.C.; Frazier, W.G. Hot deformation mechanisms in ELI Grade Ti-6a1-4V. Scr. Mater. 1999, 41, 283–288. [Google Scholar] [CrossRef]
  30. Sargent, P.M.; Ashby, M.F. Deformation maps for titanium and zirconium. Scr. Metall. 1982, 16, 1415–1422. [Google Scholar] [CrossRef]
  31. Liu, Y.; Baker, T.N. Deformation characteristics of IMI685 titanium alloy under β isothermal forging solutions. Mater. Sci. Eng. A 1995, 197, 125–131. [Google Scholar] [CrossRef]
  32. Han, Y.; Zeng, W.; Qi, Y.; Zhao, Y. The influence of thermomechanical processing on microstructural evolution of Ti600 titanium alloy. Mater. Sci. Eng. A 2011, 528, 8410–8416. [Google Scholar] [CrossRef]
  33. Stefansson, N.; Semiatin, S.L. Mechanisms of globularization of Ti-6Al-4V during static heat treatment, Metallurgical and materials transactions. Metall. Mater. Sci. 2003, 34, 691–698. [Google Scholar]
  34. Hua, K.; Xue, X.; Kou, H.; Fan, J.; Tang, B.; Li, J. Characterization of hot deformation microstructure of a near beta titanium alloy Ti-5553. J. Alloys Compd. 2014, 615, 531–537. [Google Scholar] [CrossRef]
  35. Yan, G.; Gm, A.; Xz, C.; Jx, D. Microstructure evolution and hot deformation behavior of Ti-6.5Al–2Zr–1Mo–1V alloy with starting lamellar structure. J. Alloys Compd. 2019, 809, 151852. [Google Scholar]
  36. Roy, S.; Madhavan, R.; Suwas, S. Crystallographic texture and microstructure evolution during hot compression of Ti 6Al 4V 0.1B alloy in the (α + β)-regime. Philos. Mag. 2014, 94, 358–380. [Google Scholar] [CrossRef]
  37. Bieler, T.R.; Semiatin, S.L. The origins of heterogeneous deformation during primary hot working of Ti–6Al–4V. Int. J. Plast. 2002, 18, 1165–1189. [Google Scholar] [CrossRef]
  38. Bridier, F.; Villechaise, P.; Mendez, J. Analysis of the different slip systems activated by tension in a α/β titanium alloy in relation with local crystallographic orientation. Acta Mater. 2005, 53, 555–567. [Google Scholar] [CrossRef]
Figure 1. Microstructures of as-cast Ti90 alloy.
Metals 11 01630 g001
Figure 2. The strain–stress curves of Ti90 alloy deformed (a) at 900 °C with different strain rates, (b) at 0.001 s−1 with different temperatures in the α + β two-phase region, and (c) at 1040 °C with different strain rates, (d) at 0.001 s−1 with different temperatures in the β single-phase.
Metals 11 01630 g002
Figure 3. Linear fitting diagrams under stable state at the true strain of 1.1: in the α + β two-phase region: (a1) ln ε ˙ –lnσ, (a2) ln ε ˙ –σ, (a3) ln ε ˙ –ln[sinh(ασ)], (a4) ln[sinh(ασ)]–1000/T; in the β single phase region: (b1) ln ε ˙ –lnσ, (b2) ln ε ˙ –σ, (b3) ln ε ˙ –ln[sinh(ασ)], (b4) ln[sinh(ασ)]–1000/T.
Metals 11 01630 g003aMetals 11 01630 g003b
Figure 4. The consistency between the experimental data and calculated data obtained from the Arrhenius type constitutive equation.
Metals 11 01630 g004
Figure 5. Processing map of Ti90 alloy with the true strain of 1.1.
Metals 11 01630 g005
Figure 6. Microstructures of Ti90 alloy after deformation in β single-phase region: (a) 970 °C, 0.001 s−1, (b) 1040 °C, 0.001 s−1, (c) 1040 °C, 1 s−1, (d) 1040 °C, 10 s−1.
Metals 11 01630 g006
Figure 7. Microstructures of Ti90 alloy after deformation in the α + β two-phase region: (a) 860 °C, 0.001 s−1; (b) 900 °C, 0.001 s−1; (c) 900 °C, 1 s−1; (d) 900 °C, 10 s−1.
Metals 11 01630 g007aMetals 11 01630 g007b
Figure 8. TEM micrographs of Ti90 alloy at the temperature of 900 °C with strain rate of 0.01 s−1: (a) β phase wedges into α lamella; (b) shear-induced α lamella fracture.
Metals 11 01630 g008
Figure 9. Two spheroidization models of lamellar α: (a) β phase wedging model, reprinted with permission from ref. [32], copyright 2021, Elsevier; (b) α lamella shearing model, reprinted with permission from ref. [16], copyright 2021, Elsevier.
Metals 11 01630 g009
Figure 10. The (a) inverse pole figure (IPF) (//CD) and (b) distribution of grain boundary misorientation for the α phase of Ti90 alloy at the temperature of 860 °C with strain rate of 0.001 s−1. The β phase is indicated in white background, the black lines correspond to the HAGBs with misorientation over 15° while the gray lines are the LAGBs with misorientation between 2° and 15°. The standard triangle in the right side indicates the map color code for the α phase.
Metals 11 01630 g010
Figure 11. The (a) inverse pole figure (IPF) (//CD) and (b) distribution of grain boundary misorientation for the α phase of Ti90 alloy at the temperature of 900 °C with strain rate of 0.001 s−1. The β phase is indicated in white background, the black lines correspond to the HAGBs with misorientation over 15° while the gray lines are the LAGBs with misorientation between 2° and 15°. The standard triangle in the right side indicates the map color code for α phase.
Metals 11 01630 g011
Figure 12. The (a) inverse pole figure (IPF) (//CD) and (b) distribution of grain boundary misorientation for the α phase of Ti90 alloy at the temperature of 900 °C with strain rate of 1 s−1. The β phase is indicated in white background, the black lines correspond to the HAGBs with misorientation over 15° while the gray lines are the LAGBs with misorientation between 2° and 15°. The standard triangle in the right side indicates the map color code for α phase.
Metals 11 01630 g012
Figure 13. The Schmid factor distributions of the basal slip (0001) <11–20> (indicated by subscript 1), prismatic slip (1–100) <11–20> (indicated by subscript 2), and pyramidal slip (1–101) <11–20> (indicated by subscript 3) of Ti90 alloy at deformation conditions: (a) 860 °C, 0.001 s−1; (b) 900 °C, 0.001 s−1; (c) 900 °C, 1 s−1.
Metals 11 01630 g013
Table 1. The mean Schmid factors of different slip systems for Ti90 alloy under different deformation conditions.
Temperature/℃Strain Rate/s−1Mean Schmid Factor
(0001) <11–20>(1–100) <11–20>(1–101) <11–20>
8600.0010.2820.3920.401
9000.0010.2930.3940.329
90010.2820.3640.374
Publisher’s Note: MDPI stays neutral with regard to jurisdictional claims in published maps and institutional affiliations.

