Article

Three-Point Bending Fatigue Behavior of Aluminum Foam Sandwich Panels with Different Density Core Material

Shanghai Key Lab for R&D and Application of Metallic Functional Materials, School of Materials Science and Engineering, Tongji University, Shanghai 201804, China
*
Author to whom correspondence should be addressed.
Metals 2021, 11(10), 1542; https://doi.org/10.3390/met11101542
Submission received: 27 August 2021 / Revised: 22 September 2021 / Accepted: 25 September 2021 / Published: 28 September 2021

Abstract

:
The monotonic and fatigue strength of adhesively bonded aluminum foam sandwich panels with different densities of core aluminum foam (0.3 g/cm3, 0.4 g/cm3, 0.6 g/cm3) were investigated in three-point bending tests to study the flexural fatigue behavior of aluminum foam sandwich panels. The force cycle curves, deflection curves, and hysteretic curves are presented to describe the fatigue process of aluminum foam sandwich panels. Their fatigue fracture modes are completely different, the failure modes of the low-density cores (0.3 g/cm3, 0.4 g/cm3) are debonding and face fatigue, whereas the failure mode of the high-density core (0.6 g/cm3) is face fatigue without debonding. The reason is that high-density aluminum foam cores with lower porosity have a larger joining face, which can also provide higher strength and lead to a longer fatigue life.

1. Introduction

Metallic foams have many outstanding physical and chemical properties, such as low density and a high specific strength, which impact energy absorption, flame resistance, and electromagnetic shield effectiveness [1,2,3,4,5,6,7,8]. As a result, metallic foams have been widely used for many applications in the aerospace, marine, railway, automotive, and construction industries [9,10,11].
Aluminum foam sandwiches, which are fabricated by sandwiching a thick aluminum foam as a core material between two thin alloy sheets as facing sheets, are a special class of composite materials widely used for panels, shells, tubes, crash protection devices, and lightweight structures [12,13]. The alloy sheets in the sandwich structure can provide specific strength and better dimensional stability than the aluminum foam itself, because the core aluminum foam bears the shear load while the face sheets carry an axial load and resist against bending [14,15,16].
Early contributions in this field include a study by Burma and Zenkert [17] in 1997 which analyzed the fatigue strength of sandwich structures with PVC cellular cores and fiber-reinforced composite face sheets. They studied the effects of different stress ratios on bending fatigue strength, and further researched crack initiation and propagation behaviors. Additionally, they presented a Haigh diagram to predict fatigue results and behavior. A. Hart et al. [18] studied the tension–tension and compression–compression cyclic properties of open-cell and closed-cell aluminum alloy foams, finding that the fatigue ratio is almost independent of the mean stress and the relative density of the foam. They [19] also proposed a plastic collapse failure mode for aluminum foam sandwich panels and presented a design map to display the fatigue strength and mode of failure as a function of aluminum foam sandwich geometry. In conclusion, they suggested three types of bending fatigue failure modes: face fatigue, indentation fatigue, and core shear. When low fatigue strength material is used as the face sheet, the endurance limit of the sandwich beam is set by the face fatigue strength. Due to the tensile separation of the face sheet, the face fatigue mode of failure manifests as fatigue cracks across the face sheet on the tensile side of the beam. The indentation fatigue mode is associated with both fatigue failure through the bending of the face sheet and the failure of the foam core through compression. It is shown as an indentation beneath the loading rollers, which appears similar to the uniaxial compression of metal foam. Moreover, when a sandwich beam is subjected to a monotonic transverse shear force, plastic collapse can occur due to core shear. Core shear in cycling is caused by fatigue failure of the core and simultaneous fatigue failure of the face sheets resulting in bending. It manifests as fatigue cracks which are inclined at an angle of approximately 45° to the neutral axis. In some cases, the plane of microcrack coalescence was located off-center due to some variability of strength within the foam core.
In further research of sandwich panels, Vendra et al. [20] studied the fatigue behavior of composite metal foam and found that the fatigue life and load limit have a strong correlation with the sample geometry and hole wall thickness. A study of PMI foam sandwich panels by Yang et al. [21] also applied the predicted formula of fatigue results. Some studies [22,23,24,25] have reported that welding methods can improve fatigue strength, but they did not focus on the behavior of the failure mode.
Many papers have discussed the failure modes and S–N curves of three-bonding fatigue tests; however, few researchers have focused on hysteretic behavior in three-bonding fatigue tests. The hysteretic responses of aluminum foam sandwich panels under reversed loads need to be studied, because they indicate the loading capacity, which considerably influences the bending fatigue life. There are many reports on other kinds of composite materials which address hysteretic behavior in complex working conditions [26,27]. Therefore, it is necessary to discuss the hysteretic behavior of aluminum foam sandwiches in three-point bending test.
In this paper, we investigated the three-point bending fatigue behavior of aluminum foam sandwich panels with different densities of core foam. To measure the fatigue properties, the specimens were made in the shape of beams, according to the ASTM C393 [28]. Additionally, the results, including force cycles and hysteretic curves, reflects the differences in behavior between different core materials.

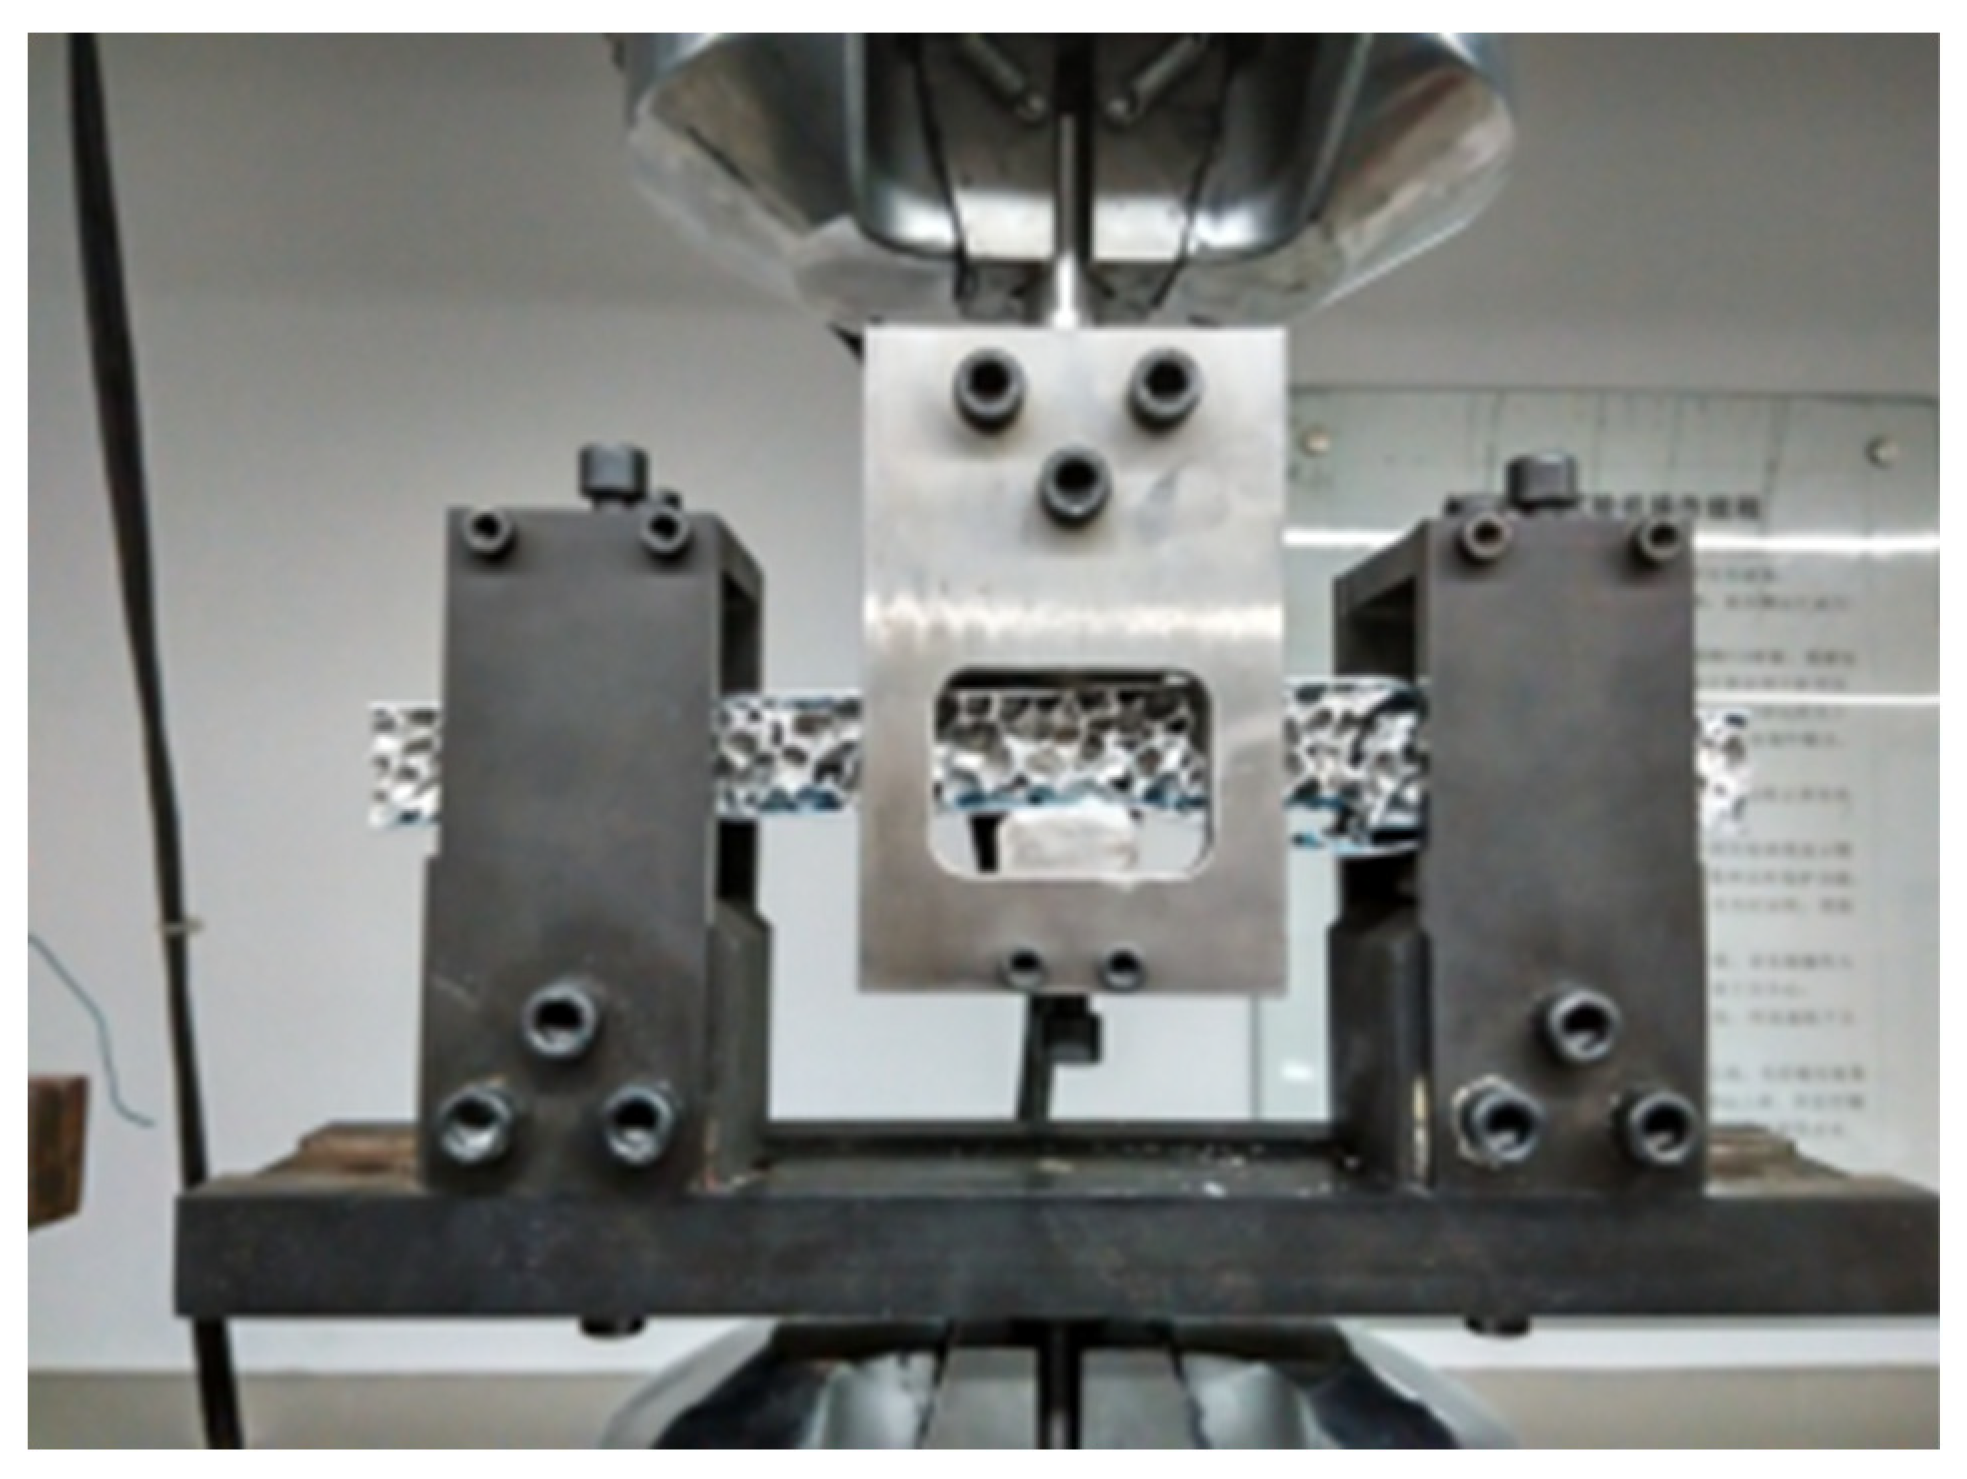
2. Materials and Methods

Pure aluminum foam with closed cells was selected to be the core foam material for the aluminum foam sandwiches. They included 3 different densities, which are listed in Table 1. In this paper, “low-density samples” refers to samples with the core of 0.3 g/cm3 and 0.4 g/cm3, and “high-density samples” refers to samples with the core of 0.6 g/cm3, respectively. Additionally, 1 mm thick aluminum alloy 5056 was used as the surface face material. Aerial glue coat was used as the joining glue. The sandwich panels are made using the hot press method at 90 °C for 10 min to join the face sheets and the core. The thickness of the core, c, the thickness of the skin, t, the length, a, width, b, the thickness of the aluminum foam sandwich, c, and the distance between the lower rolls, S, are shown in Figure 1 and Table 2.
Three-point bending fatigue tests were carried out on the aluminum foam sandwich samples using an MTS-809 fatigue test machine with self-made fixtures (span length = 200 mm), as shown in Figure 2, according to the ASTM C393 standard [28]. The aluminum foam sandwich samples were tested at loading ratios of R = −0.1 and a cycle frequency of C = 7 Hz. A digital camera was used to record the fracture process. The criterion for the end of the fatigue test was that the sample had visibly broken or the strain (deflection/thickness) was over 20%. Every kind of aluminum foam sandwich of the different densities of core material was tested in at least 4 different loading force experiments. The failure modes were limited to face fatigue and core shear.

3. Results

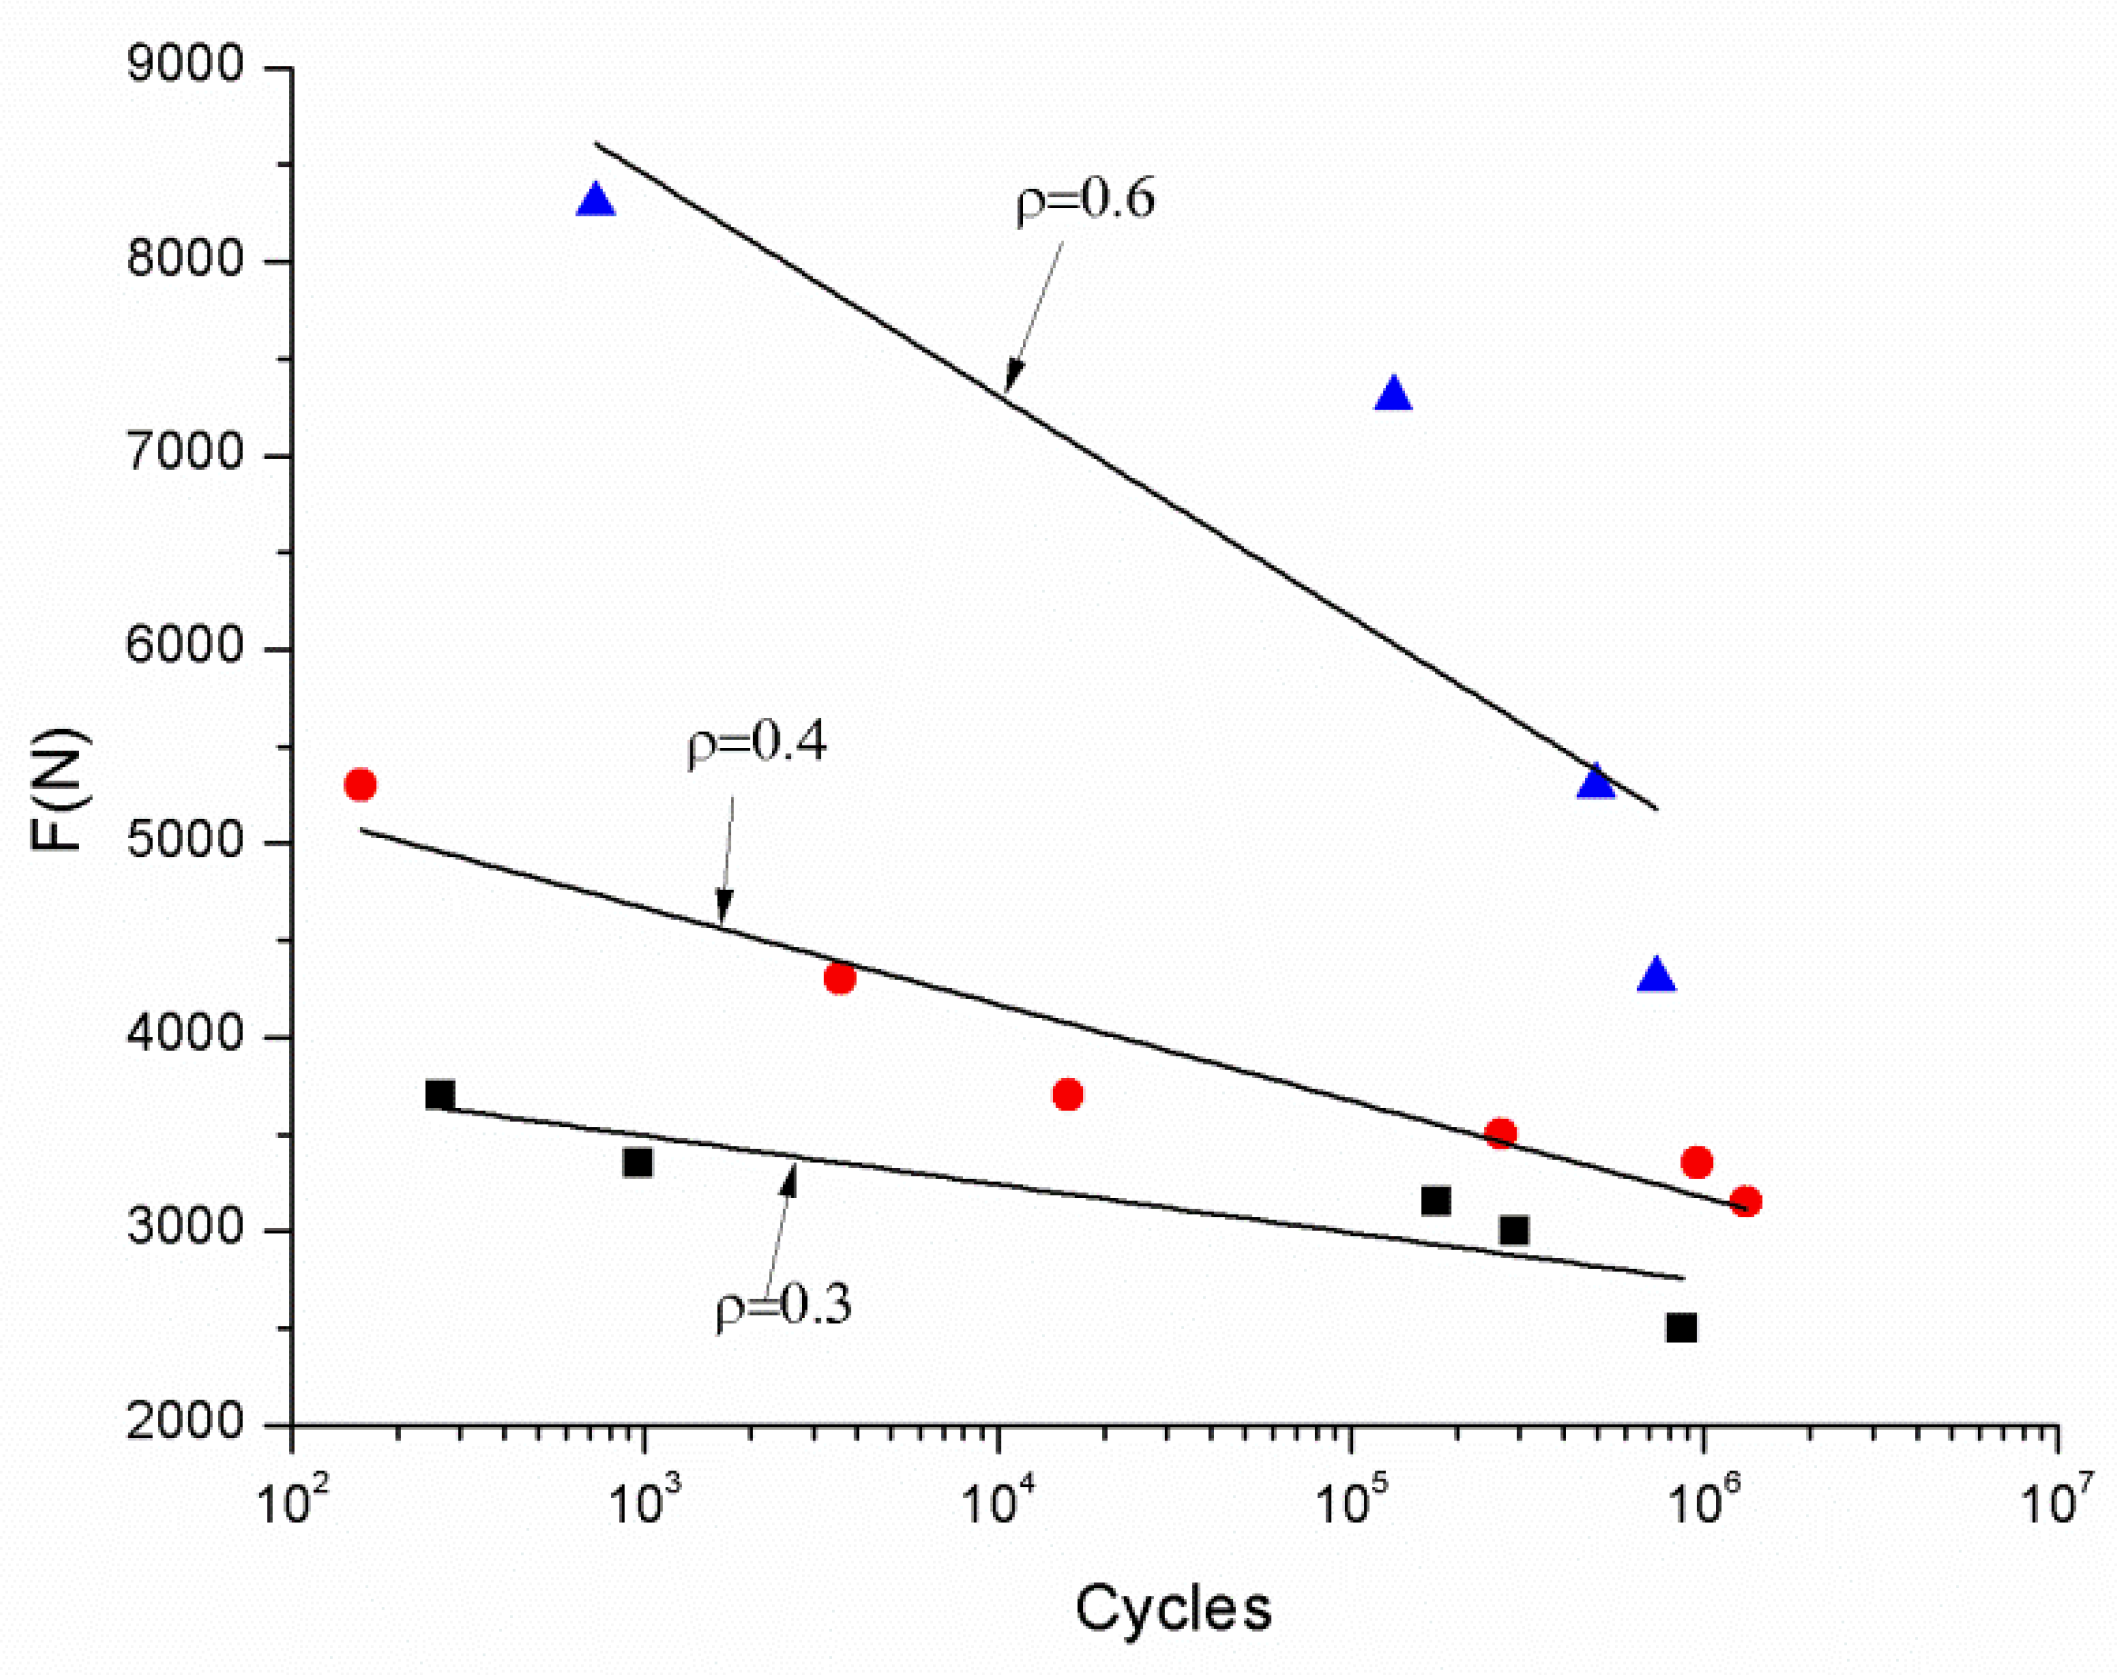
3.1. Force Cycle Curves
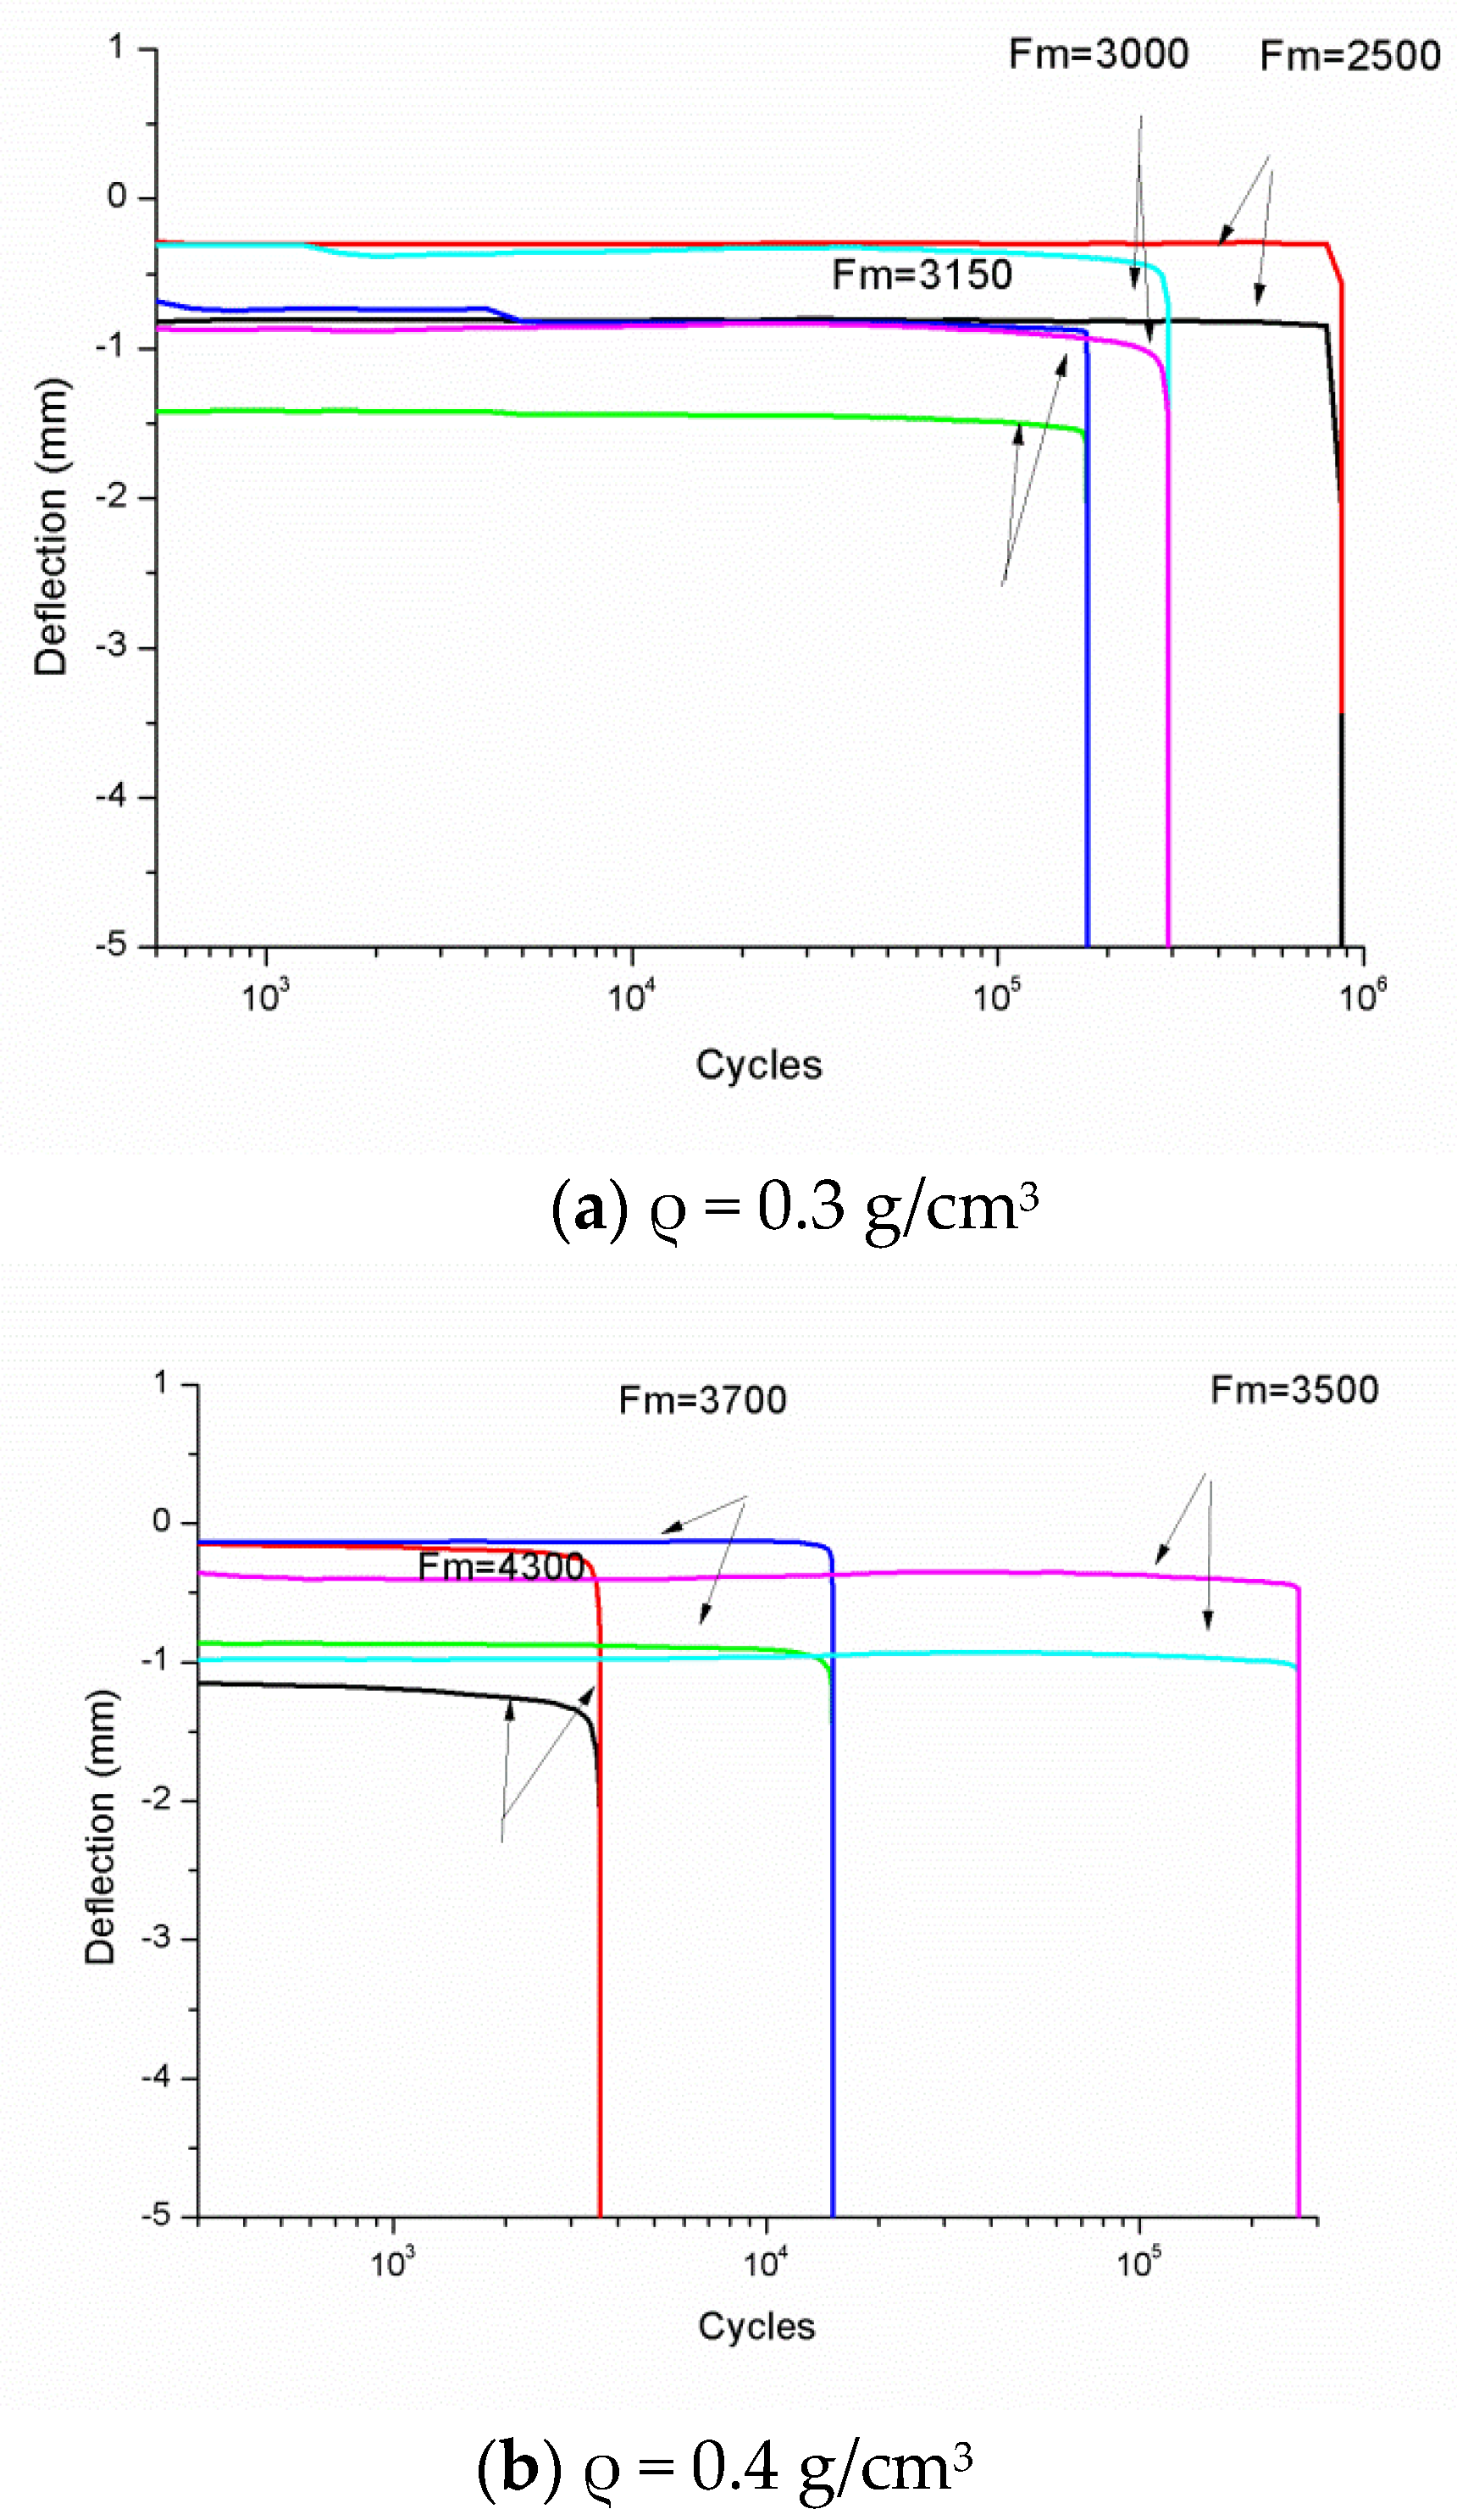
The experimental results of fatigue tests on the aluminum foam sandwiches are shown in Table 3, and the force cycle curves are shown in Figure 3, with regression lines to show the overall trends of the three cores with different densities. The specimens were the same size. The fatigue lives of the aluminum foam sandwich panels with higher-density foam cores were much better than those with low-density foam cores. These phenomena can contribute to the fracture morphology, showing that debonding has a significant influence on fatigue life.
The criterion for curve fitting uses the nonlinear curve fit:
y = a + b log 10 x  
Which is fitting with the experimental equation:
N · e a S = C  
The fitting curves are linear in logarithmic coordinates. Harte [18] investigated the use of the fitting formula of the force cycle curves to predict the fatigue limit in certain cycles and to characterize the effects of different parameters. Generally, the fitting curves with cores of 0.3 and 0.4 g/cm3 density have a similar shape and fatigue life limit. However, curves with cores of 0.6 g/cm3 density have more drastic changes and much longer fatigue life. In order to obtain the exact fatigue life limit, the force cycle curves were fitted to achieve the experimental formulae (ρ = 0.3 (3), 0.4 (4), 0.6 (5) g/cm3):
F = 4261 262.6 log 10 N
F = 6162 497.5 log 10 N
F = 10412.7 946.2 log 10 N
N represents the number of cycles; Therefore, we define the force when the fatigue life is five million cycles is the fatigue limit [29]. According to the fitting formulae above, the fatigue limits are shown in Table 4. This confirmed that an aluminum foam sandwich with a high-density core has a higher fatigue life limit than others with lower-density cores, due to the debonding between the face sheet and foam core.

3.2. Deflection

In order to describe the mechanical behavior changes in the aluminum foam sandwich panels in the three-point bending fatigue test in depth, the deflection of the aluminum foam sandwich with foam cores of different densities was recorded at various force levels and was changed according to the number of cycles during the fatigue experiment. The curves are shown in Figure 4, with Fm representing the peak force in the cycle. In addition, the curves do not include the low cycle fatigue (N < 1000) because of the deflection record on time. When we tested in high frequency, the low cycle fatigue only recorded several dots which either cannot draw the curve, or have big margins of error, so we do not list the low cycle fatigue curves in Figure 4.
The deflection curves generally had the same trend. At the beginning, the fatigue response presented a slow rate of accumulation of deflection with increasing cycles. The defects in the incubation period grew slowly and steadily due to the development of micro damage. When micro damage developed to a critical collapsing level, the internal cracks rapidly grew and the rate of deflection increased dramatically, which signified the end of the incubation period, leading to failure. Comparing Figure 4a–c, the higher the density of the aluminum foam core, the higher the critical collapsing level at the same loading force. These behaviors are similar to those noted by Harte et al. [19].

3.3. Hysteretic Curves

The authors want to differentiate the mechanism between the high-cycle results and low-cycle results, but the fracture morphology and defection trends are mainly similar. Therefore, the hysteretic curves are used to describe this behavior.
The typical hysteretic curves (ρ = 0.4 g/cm3, R = −0.1, Fm = 3700 N) are shown in Figure 5. In the 100th cycle group, the shape of the hysteresis curve is relatively full (reflecting the strong plastic deformation ability of the specimen at the initial stage), and no obvious shear deformation occurs. As the number of cycles increases, the shape of the hysteresis curve shrinks under the effects of alternating stress, indicating that the sample is affected by the slip inside the core. In addition, as the number of cycles increases, the displacement of the maximum force also rises, indicating that the aluminum foam core has a certain compressibility.
The area of the hysteresis curve represents the absorbed energy of deformation after loading for one week, which characterizes the plastic energy dissipation and seismic performance of the material. The hysteresis curve area, S, of the experimental group is shown in Table 5. As the cycle increases, the aluminum foam sandwich undergoes shear deformation and cumulative energy consumption, and as the density increases, its seismic and shear resistance also increases. However, this is still a qualitative analysis. More experimentation is needed to build a bending fatigue model to make a quantitative analysis for the comparison of fatigue behavior between the low-cycle and high-cycle samples.

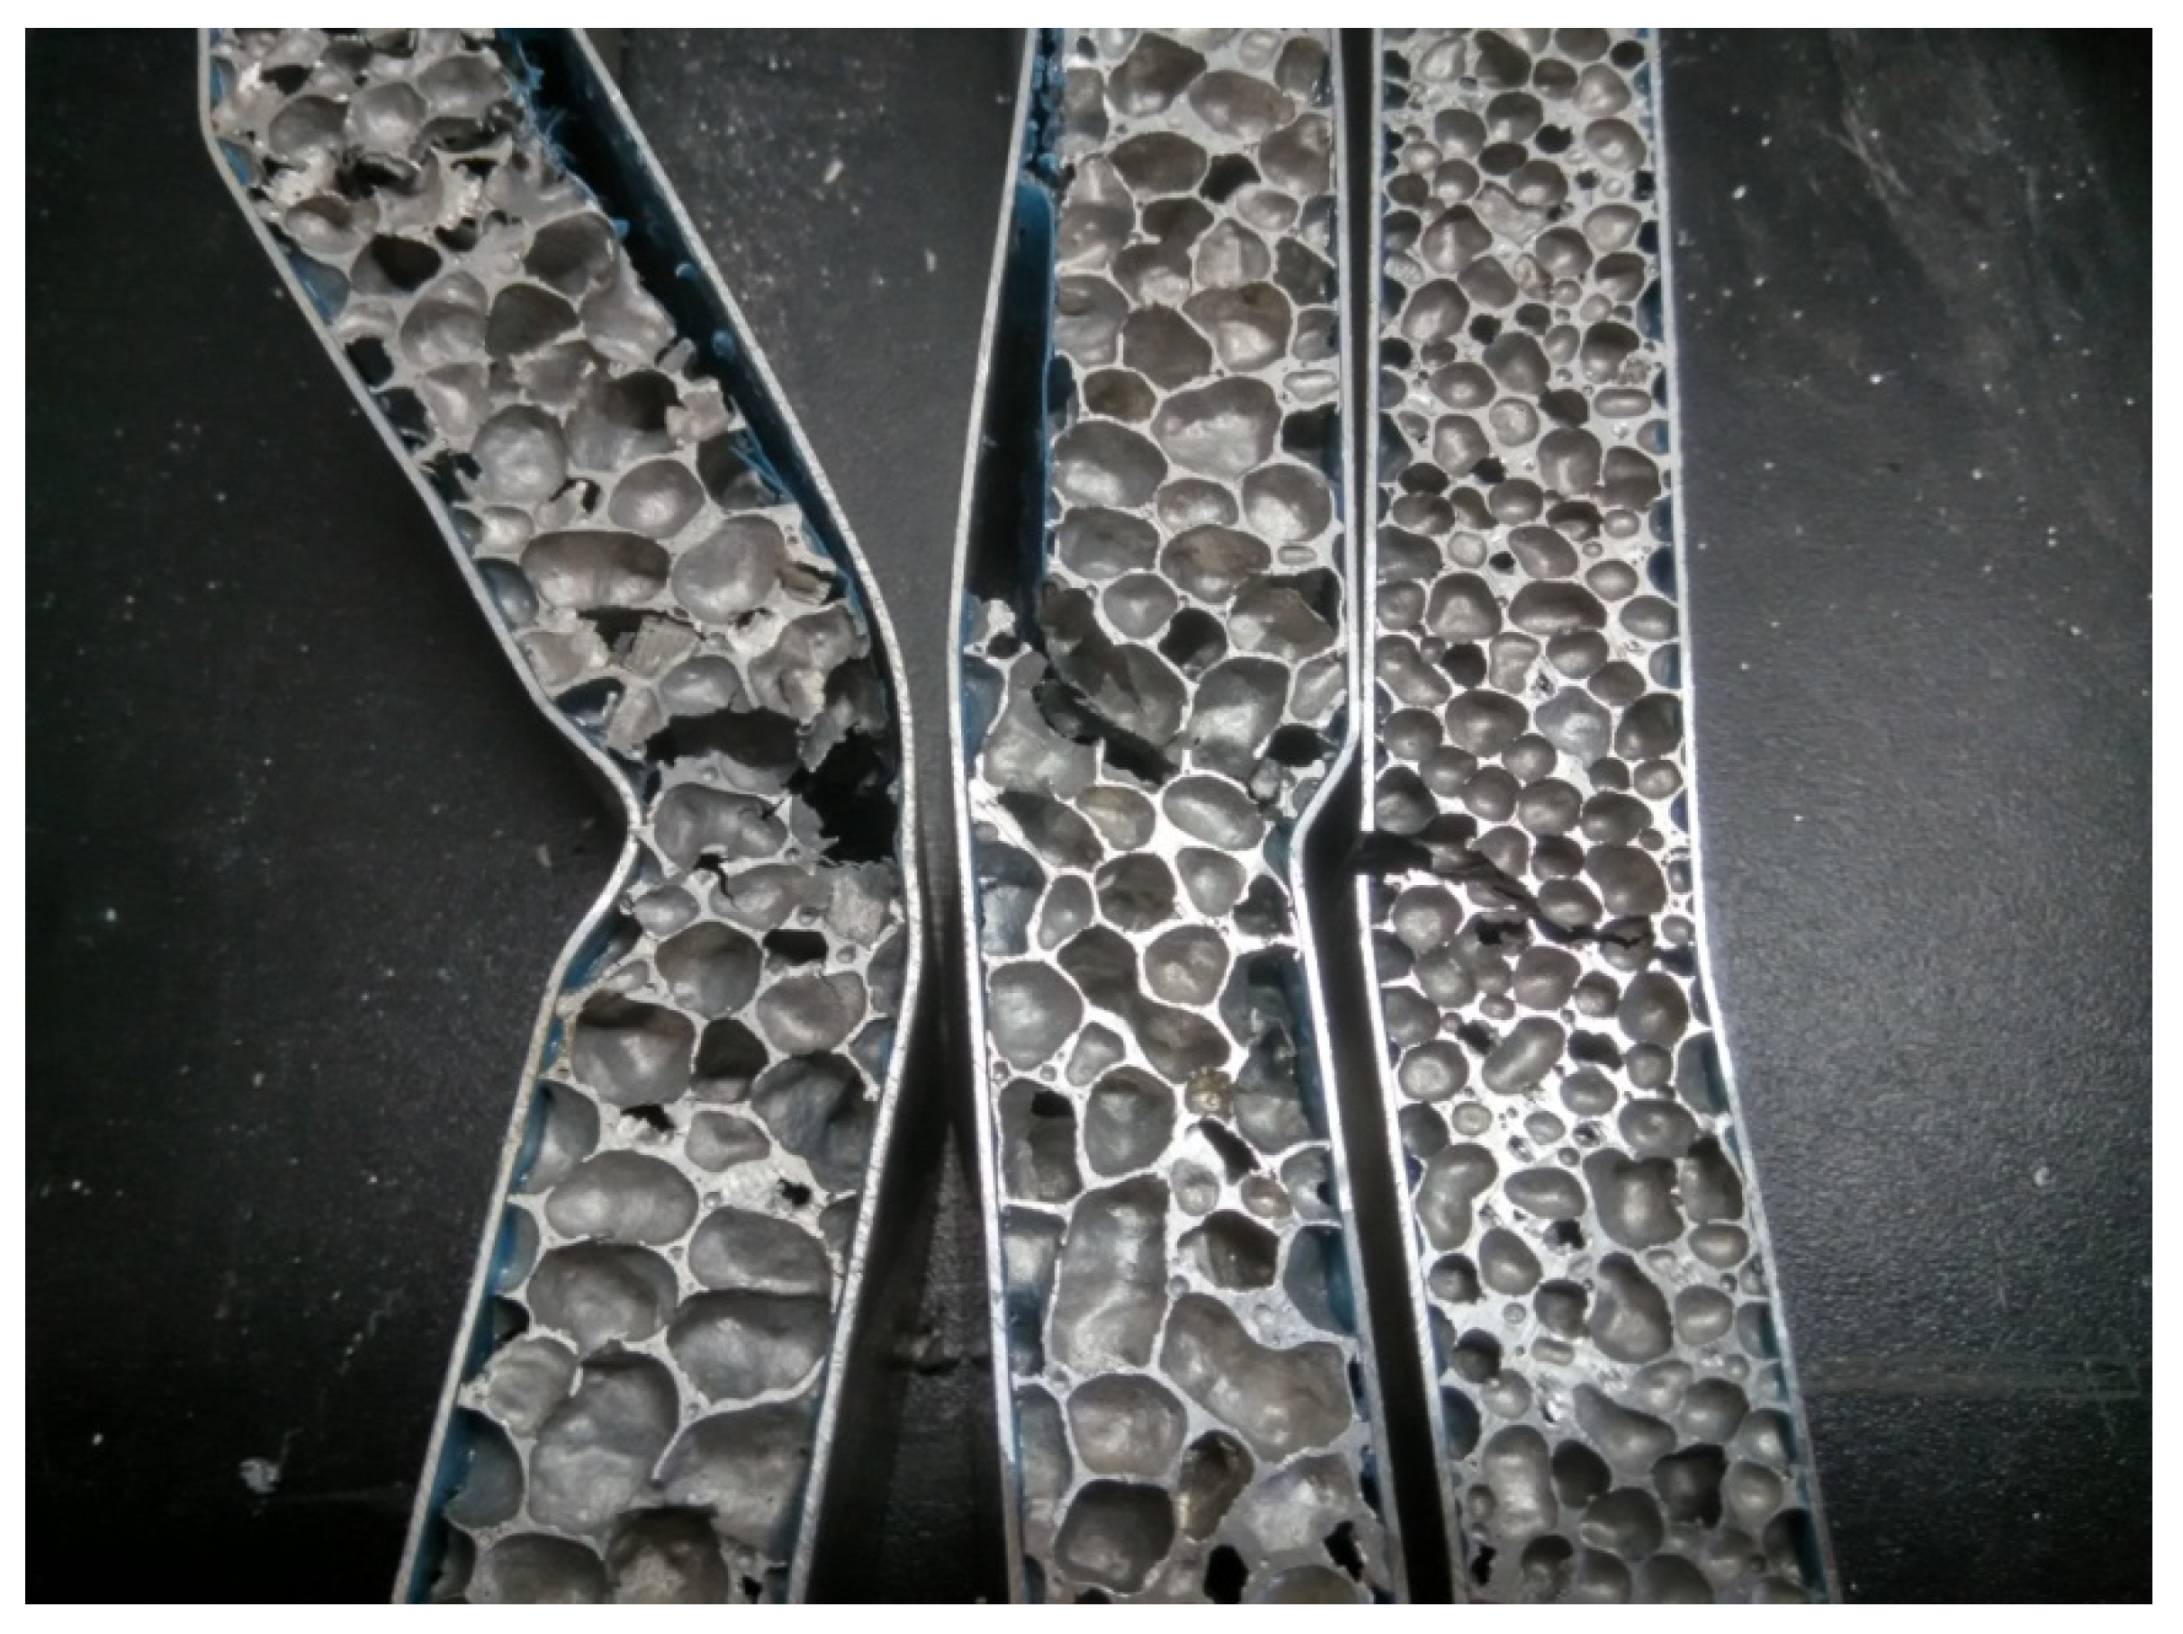
3.4. Fatigue Fracture Morphology

The fatigue fractures of the three kinds of aluminum foam sandwich panels are shown in Figure 6. The fatigue cracks are on the tensile side of the aluminum foam sandwich panels. It is clear that the failure modes of the low-density core samples (0.3 g/cm3, 0.4 g/cm3) are debonding and face fatigue, whereas the failure mode of the high-density core samples (0.6 g/cm3) is face fatigue without debonding. According to the test records, the failure process of the low-density samples (0.3 g/cm3 and 0.4 g/cm3 left and middle side) can be divided into two stages: first, the core and the face sheets are debonded; then, the aluminum foam sandwich is broken by the bending force. When debonding occurs, the foam core loses the protection of the face sheet, and the load induces a collapse. On the other hand, the high-density sample (0.6 g/cm3, right side) did not debond, and the face sheet and core broke in the same tension direction, which is the typical feature of face fatigue.
Hart [18,19] built failure mode maps with contours of normalized cyclic failure load. From the map, the failure mode of the aluminum foam sandwich sample may appear to be in the area of indentation; however, the failure mode was face fatigue, which may have resulted from the debonding.
Sandwich beams with low yield strength face sheet collapses at a load limit; the peak load, F, is:
F = 4 b t ( c + t ) l S σ f + b c 2 l S σ c
In Equation (6) [18], b is the aluminum foam sandwich width, t is the thickness of face sheet, l is the span length of three-point bending, S is the length between the upper forces in four-point bending fatigue failure, σf is the yield strength of the face sheet, and σc is the yield strength of the core.
In this failure mode, the collapse load is determined by equating the maximum bending moment within the sandwich beam to the moment of plastic collapse. However, in three-point bending, S can be regarded as zero; therefore, Equation (6) can be changed to:
F = 4 b t ( c + t ) l σ f + b c 2 l σ c
When debonding occurs, the face sheets and core are separated, which means that the face and core form the load independently, and the peak load will be the smaller of the two parts in the formula. Thus, Equation (7) can be changed to:
F = m in { 4 b t ( c + t ) l σ f , b c 2 l σ c }
Therefore, face sheet debonding leads to a decrease in bending strength. In conclusion, metallurgical joining did not exhibit the process of debonding, which clearly demonstrates the higher bonding strength. The higher density, lower porosity, and larger joining face of the aluminum foam core led to the formation of a good joint in the aluminum foam sandwich. In conclusion, the high-density samples did not exhibit debonding processes, which lead to high bending strength and long flexural fatigue life.

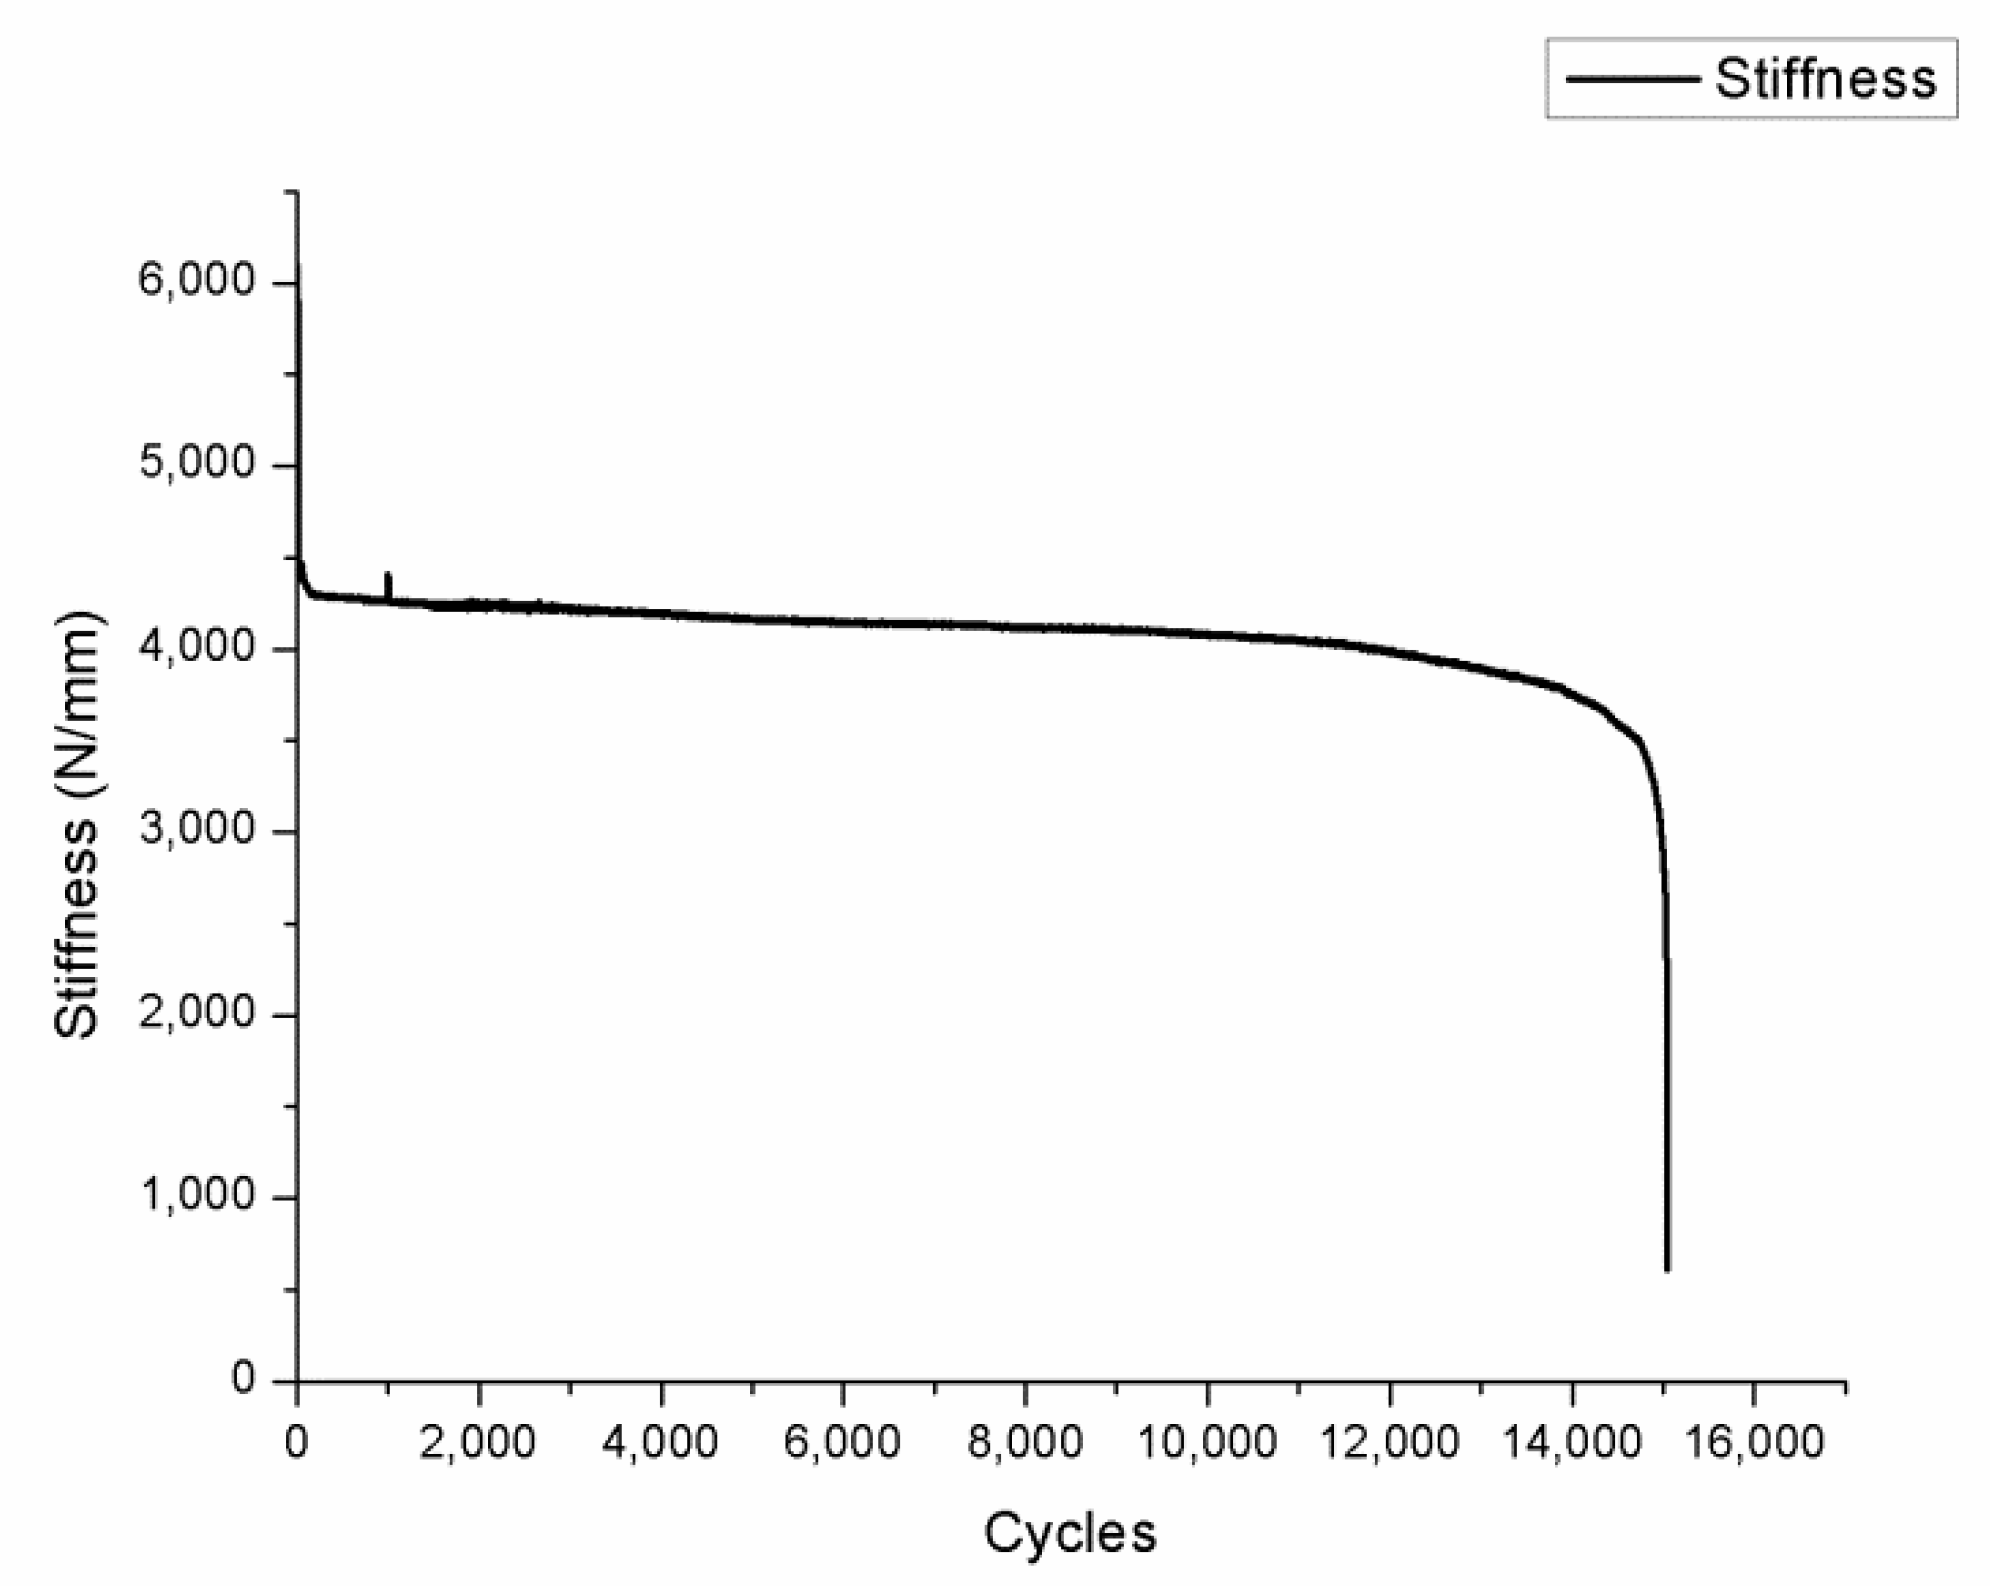
3.5. Stiffness Degradation

The accumulation of fatigue damage is the most serious form of fatigue failure in a component or structure. In the case of cyclic load, fatigue damage will accumulate with the increase in the number of cycles. When the accumulation of microscopic fatigue damage reaches the critical value, fatigue failure of components or structures will occur on the macroscopic scale. The fatigue damage can be described by residual strength, residual stiffness, and dissipated energy. In the three-point bending process, the bending stiffness, B, of the sample is usually defined as:
B = P w
In Equation (9), P is the load borne by the sample, and w is the deflection of the sample [30]. The peak load of the three-point bending test remained the same; therefore, the consistency of the change in deflection suggests that there may be some stiffness changes, and that the change in the deflection can be directly identified in the experimental process. Thus, we chose to analyze a stiffness degradation model of the fatigue experiments of aluminum foam sandwich plates, and because the deflection curves had the same trend as in Figure 4, we chose one typical curve to draw the stiffness–cycles curve shown in Figure 7.
As mentioned above, for different samples, the deflection proceeded through three stages during the fatigue test. In fact, the stiffness change is also divided into three stages, corresponding to the three stages in deflection change:
(1)
The first stage is the initial loading stage, during which the stiffness attenuation is rapid. The first stage is very short, for the initial loading stage is in the adaptation stage. At the same time, initial defects in the aluminum foam sandwich panels occur due to the porous characteristics of aluminum foam;
(2)
The second stage is the stable stage of stiffness degradation, which accounts for the majority of the fatigue life. The fatigue damage accumulates slowly with the number of cycles, and the stiffness degrades relatively slowly;
(3)
The third stage is a stage of rapid stiffness degradation. After the slow accumulation of fatigue damage in the second stage, the internal fatigue damage reaches a critical value. The stiffness decreases rapidly, and the samples come to failure in the end.

4. Conclusions

This research experimentally studied the influence of the aluminum foam core density in fatigue tests for adhesively bonded aluminum foam sandwich panels subjected to three-point bending loading. Analytical procedures were used to predict the three-point bending fatigue lives and ultimate applied loads by comparing the former theoretical solutions corresponding to various reference failure modes. The conclusions which can be drawn from the experimental and analytical studies are as follows. The three-bending fatigue strengths of the studied aluminum foam sandwich samples increased with the increasing density of the core aluminum foam, and the failure mode changed from face/core interfaces and core shear to face failure as density increased. From in-depth analysis of the behavior of sandwich panel fatigue by comparing the estimated three-bending fatigue lives for various failure modes, the proposed analytical procedure can predict the fatigue life through the force cycle curves of aluminum foam sandwiches with core foam of different densities. The failure mode of all high-density samples was face fatigue, whereas the failure modes for low-density samples were face fatigue and debonding. Higher density leads to better joining and higher strength, which improves the bending force strength significantly.

Author Contributions

Conceptualization, Z.H.; formal analysis, C.Y.; funding acquisition, Z.H. and F.M.; investigation, C.Y.; methodology, C.Y.; supervision, Z.H. and F.M.; validation, C.Y.; writing—original draft, C.Y.; writing—review and editing, Z.H. All authors have read and agreed to the published version of the manuscript.

Funding

This research was funded by the National Key Research and Development Program of China (Project No. 2017YFB0103700, 2013BAG19B01).

Institutional Review Board Statement

Not applicable.

Informed Consent Statement

All authors involved in this study give their informed consent.

Data Availability Statement

All data generated or analyzed during this study are included in this published article.

Conflicts of Interest

The authors declare no conflict of interests.

References

  1. Ashby, M.F.; Lu, T.J. Metals foam: A survey. Sci. China 2003, 46, 521–532. [Google Scholar] [CrossRef]
  2. Davies, G.J.; Zhen, S. Metallic foams: Their production, properties and applications. J. Mater. Sci. 1983, 18, 1899–1911. [Google Scholar] [CrossRef]
  3. Alvandi-Tabrizi, Y.; Whisler, D.A.; Kim, H.; Rabiei, A. High strain rate behavior of composite metal foams. Mater. Sci. Eng. 2015, A631, 248–257. [Google Scholar] [CrossRef]
  4. Gui, M.C.; Wang, D.B.; Wu, J.J.; Yuan, G.J.; Li, C.G. Deformation and damping behaviors of foamed Al-Si-SiCp composite. Mater. Sci. Eng. 2000, A286, 282–288. [Google Scholar] [CrossRef]
  5. Gibson, L.J.; Ashby, M.F. Cellular Solids: Structure & Properties; Cambridge University Press: Cambridge, UK, 1997; p. 510. [Google Scholar]
  6. Katona, B.; Szebényi, G.; Orbulov, I.N. Fatigue properties of ceramic hollow sphere filled aluminium matrix syntactic foams. Mater. Sci. Eng. 2017, A679, 350–357. [Google Scholar] [CrossRef] [Green Version]
  7. Katona, B.; Szebényi, A.T.; Orbulov, I.N. Compressive characteristics and low frequency damping of aluminium matrix syntactic foams. Mater. Sci. Eng. 2019, A739, 140–148. [Google Scholar] [CrossRef]
  8. Banhart, J. Manufacture, Characterization and Application of Cellular Metals And Metal Foams. Prog. Mater. Sci. 2001, 46, 559–632. [Google Scholar] [CrossRef]
  9. Banhart, J.; Seeliger, H.W. Aluminium Foam Sandwich Panels: Manufacture, Metallurgy and Applications. Adv. Eng. Mater. 2008, 10, 793–802. [Google Scholar] [CrossRef]
  10. Garcia-Moreno, F. Commercial Applications of Metal Foams: Their Properties and Production. Materials 2018, 9, 85. [Google Scholar] [CrossRef]
  11. Crupi, V.; Epasto, G.; Guglielmino, E. Comparison of aluminium sandwiches for lightweight ship structures: Honeycomb vs. foam. Mar. Struct. 2013, 30, 74–96. [Google Scholar] [CrossRef]
  12. Golovin, I.S.; Sinning, H.R. Damping in some cellular metallic materials. J. Alloys Compd. 2003, 355, 2–9. [Google Scholar] [CrossRef]
  13. Yang, D.H.; Yang, S.R.; Wang, H.; Ma, A.B.; Jiang, J.H.; Chen, J.Q.; Wang, D.L. Compressive properties of cellular Mg foams fabricated by melt-foaming method. Mater. Sci. Eng. 2010, A527, 5405–5409. [Google Scholar] [CrossRef]
  14. Huang, Z.; Qin, Z.; Chu, F. Damping mechanism of elastic-viscoelastic-elastic sandwich structures. Compos. Struct. 2016, 153, 96–107. [Google Scholar] [CrossRef]
  15. Yu, G.C.; Feng, L.J.; Wu, L.Z. Thermal and mechanical properties of a multifunctional composite square honeycomb sandwich structure. Mater. Des. 2016, 102, 238–246. [Google Scholar] [CrossRef]
  16. Harte, A.M.; Fleck, N.A.; Ashby, M.F. Sandwich panel design using Aluminum alloy foam. Adv. Eng. Mater. 2000, 2, 219–222. [Google Scholar] [CrossRef]
  17. Burman, M.; Zenkert, D. Fatigue of foam core sandwich beams—1: Undamaged specimens. Int. J. Fatigue 1997, 19, 551–561. [Google Scholar] [CrossRef]
  18. Harte, A.M.; Fleck, N.A.; Ashby, M.F. The fatigue strength of sandwich beams with an aluminium alloy foam core. Int. J. Fatigue 2001, 23, 499–507. [Google Scholar] [CrossRef]
  19. Chen, C.; Harte, A.M.; Fleck, N.; Ashby, A. The plastic collapse of sandwich beams with a metallic foam. Int. J. Mech. Sci. 2001, 43, 1483–1506. [Google Scholar] [CrossRef]
  20. Vendra, L.; Neville, B.; Rabiei, A. Fatigue in aluminum–steel and steel–steel composite foams. Mater. Sci. Eng. A 2009, 517, 146–153. [Google Scholar] [CrossRef]
  21. Yang, F.P.; Lin, Q.Y.; Jiang, J.J. Experimental study on fatigue failure and damage of sandwich structure with PMI foam core. Fatigue Fract. Eng. Mater. Struct. 2015, 38, 456–465. [Google Scholar] [CrossRef]
  22. Shapovalov, O.S.; Kodzhaspirov, G.E.; Hantelmann, K.; Mikhailov, V.G. Effect of a Welding Method on the Fatigue Strength and Fracture of Foam-Aluminum Sandwiches. Russ. Metall. 2019, 10, 1063–1066. [Google Scholar] [CrossRef]
  23. Wang, Z.G.; Li, Z.D.; Xiong, W. Experimental investigation on bending behavior of honeycomb sandwich panel with ceramic tile face-sheet. Compost. Part B-Eng. 2019, 164, 280–286. [Google Scholar] [CrossRef]
  24. Yao, C.; Hu, Z.F.; Mo, F.; Wang, Y. Fabrication and Fatigue Behavior of Aluminum Foam Sandwich Panel via Liquid Diffusion Welding Method. Metals 2019, 9, 582. [Google Scholar] [CrossRef] [Green Version]
  25. Duart, I.; Teixeir-Dias, F.; Graça, A.; Ferreira, A.J.M. Failure Modes and Influence of the Quasi-static Deformation Rate on the Mechanical Behavior of Sandwich Panels with Aluminum Foam Cores. Mech. Adv. Mater. Struct. 2010, 17, 335–342. [Google Scholar] [CrossRef]
  26. Zhao, J.; Cai, G.; Larbi, A.S.; Zhang, Y.; Dun, H.; Degée, H.; Vandoren, B. Hysteretic behaviour of steel fibre RC coupled shear walls under cyclic loads: Experimental study and modeling. Eng. Struct. 2018, 156, 92–104. [Google Scholar] [CrossRef]
  27. Zhang, Z.; Bai, Y.; He, X.; Jin, L.; Zhu, L. Cyclic performance of bonded sleeve beam-column connections for FRP tubular sections. Compos. Part B 2018, 142, 172–182. [Google Scholar] [CrossRef]
  28. ASTM_C393-C393M-06 Standard Test Method for Core Shear Properties of Sandwich Constructions by Beam Flexure; ASTM International: West Conshohocken, PA, USA, 2006.
  29. Roosen, D. Fatigue behavior of sandwich foam core materials comparison of different core materials. J. Adv. Mater. 2005, 37, 16–20. [Google Scholar]
  30. El Mahi, A.; Farooq, M.K.; Sahraoui, S.; Bezazi, A. Modelling the flexural behaviour of sandwich composite materials under cyclic fatigue. Mater. Des. 2004, 25, 199–208. [Google Scholar] [CrossRef]
Figure 1. Schematic of the aluminum foam sandwich and the loading rolls.
Metals 11 01542 g001
Figure 2. Loading diagram of the sample and fixture for fatigue tests.
Metals 11 01542 g002
Figure 3. Force cycle curves for the aluminum foam sandwiches in the three-point bending tests.
Metals 11 01542 g003
Figure 4. Deflection versus the number of cycles for aluminum foam sandwiches in three-point bending fatigue((a) ρ = 0.3 g/cm3, (b) ρ = 0.4 g/cm3, (c) ρ = 0.6 g/cm3).
Metals 11 01542 g004aMetals 11 01542 g004b
Figure 5. Hysteretic behavior of the tested aluminum foam sandwich.
Metals 11 01542 g005
Figure 6. Fatigue fracture morphology of three aluminum foam sandwich samples with different core densities (from left to right, ρ = 0.3, 0.4, 0.6 g/cm3).
Metals 11 01542 g006
Figure 7. Stiffness–cycles curve (ρ = 0.4 g/cm3, Fm = 3700 N).
Metals 11 01542 g007
Table 1. Specification of core aluminum foam.
NumberDensity (g/cm3)Relative Density (ρ/ρs)Cell Size (mm)
10.30.1110
20.40.157
30.60.224
Table 2. Size of the aluminum foam sandwich samples.
ProjectalScbtHR
Length (mm)3005020025501275
Table 3. Experimental results of the fatigue tests of the aluminum foam sandwiches.
ρ = 0.3F(N)37003350315030002500
Cycles267965176,088292,371871,419
ρ = 0.4F(N)530043003700350033503150
Cycles157359215,861267,345958,2521,320,034
ρ = 0.6F(N)8300730063005300
Cycles838131,727287,251987,570
Table 4. Fatigue life limit of aluminum foam sandwiches with different core densities.
NumberDensity (g/cm3)Fatigue Life Limit (N, 5 × 10⁶ Cycles)
10.32501.8
20.42829.3
30.64047.1
Table 5. Comparisons of the area of the hysteresis curve.
Density (g/cm3)Fm (N)Chosen Cycle of the Hysteresis CurveFirst Cycle Area (N·mm)Half Cycle Area (N·mm)Last Cycle Area (N·mm)
0.32500500, 400,000, 800,000340333163381
3000500, 100,000, 200,000221522482435
3150500, 50,000, 100,000761281568271
0.43500500, 100,000, 200,000511952765444
3700500, 5000, 10,000400740904175
4300500, 2000, 3000641764967602
0.66300500, 100,000, 200,000934794029915
7300500, 50,000, 100,00012,86513,12813,670
8300500, 10,000, 20,00017,83618,21519,964
Publisher’s Note: MDPI stays neutral with regard to jurisdictional claims in published maps and institutional affiliations.

