Article

Effect of Solute Redistribution on Seeding Process of TiAl Alloys with Limited Convection in a Float Zone

Key Laboratory of Solidification Processing, Northwestern Polytechnical University, Xi’an 710072, China
*
Author to whom correspondence should be addressed.
Metals 2021, 11(10), 1525; https://doi.org/10.3390/met11101525
Submission received: 9 August 2021 / Revised: 20 September 2021 / Accepted: 21 September 2021 / Published: 26 September 2021

Abstract

:
Two different analytic models, in which convection in the float zone is assumed, are developed to understand the solute redistributions during general seeding and quasi-seeding processes of TiAl alloys, respectively. The results suggest that the solute redistribution plays an important effect in the phase selection and microstructural development during the initial stage of seeding processes. In the initial stage of the quasi-seeding process, the interface concentration increases gradually and the solute diffusion boundary forms with the crystal growth of α phase. Correspondingly, a maximum constitutional undercooling with respect to β phase occurs ahead of the solidifying α interface and then decreases gradually. Simultaneously, the position where the maximum constitutional undercooling occurs also moves forward with regard to the interface. While in the initial stage of the general seeding process, the α phase can grow continuously as stable phase when the initial composition of the melt is higher than Al 48.9%. Under the influence of both the constitutional undercooling and Ti5Si3 particles, coarse dendrites form and then are transformed to cellular morphology. Nevertheless, the lamellar microstructure can still be aligned well during the entire seeding process. Besides, it is also found that the thickness of solute diffusion boundary decreases with the increase of convection intensity and thus, the growing interface become more stably correspondingly, which is beneficial to the lamellar alignment of TiAl alloys.

1. Introduction

Float zone techniques, such as the optical float zone (OFZ) [1,2,3] and the electromagnetic confinement and directional solidification (EMCDS) [4,5], have been successfully employed to obtain non-contamination samples of TiAl alloys. However, simple directional solidification usually produces the worst samples in which the lamellar microstructures are inclined or normal to the growth direction [6]. To obtain the desired lamellar microstructure with excellent mechanical properties, the seeding method has been developed to align the lamellar microstructure by the float zone techniques [4,5,7]. In terms of the preparation and application of the seed materials, the present seeding methods can be categorized into two types: general seeding process [4,7] and quasi-seeding process [5]. For the general seeding process, because the primary phase of the seed alloy is α whereas that of the master alloy is usually β, there exists a large composition difference between them. Thus, the solute redistribution and microstructural development are very complicated during the initial seeding process [4,8] and the lamellae alignment in this stage usually fails unexpectedly. For the quasi-seeding process, by contrast, the greatest feature is that the quasi-seed alloy has the same composition as the master alloy. Correspondingly, it is also found that the microstructural development during the quasi-seeding process is quite different from that during the general seeding process, which is likely caused by the difference of solute redistribution between the seeding processes.
In order to obtain the desired lamellar microstructure, the primary aim of the seeding process is to keep the α grains growing continuously along the original orientation of the seed. Any nucleation of new grains, either α or β phase, may cause the failure of seeding [7]. Notably, for TiAl alloys, as a typical peritectic alloy, the phase selection and microstructural development during directional solidification are largely dependent on the solute redistribution in the initial transient [9,10]. Accordingly, with the change of the solute redistribution during the seeding process, it is not surprising that the phase selection and microstructural development are usually different. However, although great progress has been made to fabricate the desired lamellar microstructures of various TiAl alloys at present, the solute redistribution during the seeding process is still unclear and how it affects the phase selection and microstructural development.
Up to now, a limited number of studies have been performed to understand the solute redistribution during the zone melting under different mass transport conditions [11,12]. In the study reported by Pfann [13], it was assumed that the diffusion in liquid is very rapid and then the interface concentrations both in liquid and solid were determined as the solidification proceeds. Because the solute composition in the molten zone is uniform, there is no constitutional undercooling ahead of the solidifying interface and thus it is difficult to explain the cellular or dendritic morphology during the directional solidification by this model. Assuming that the convection in liquid can be ignored when the float zone is shorter than the equivalent boundary layer, Humphreys et al. [14] investigated the solute distribution in the float zone; and it is suggested that the interface morphology is more stable than that in the Bridgman directional solidification, in which the length of the melt is semi-infinite [11]. Afterwards, Louchev [15] assumed that the convection can still be ignored even in a longer float zone and then discussed the solute distribution in the float zone, and the results are found to be identical with those in the Bridgman directional solidification. Besides, it is also suggested that the length of the float zone has few effects on the solute distribution and the interface morphology.
The above models studied the solute redistribution under extreme conditions, but such conditions can hardly be reached in general directional solidification processes. In most cases, there exists liquid flow in the melt and it usually has a great effect on the solute redistribution and then the phase selection and microstructural development of peritectic alloys [16,17]. In our recent studies performed by EMCDS, the convection in the melt can be clearly observed during the seeding process. For the OFZ technique, extensive studies have also reported that there exists intense convection in the float zone [17]. For this case, if the solute redistribution during the seeding process can be discussed in consideration of the effect of convection, it is undoubtedly beneficial to understand the phase selection and microstructural development in experiment. However, relevant matters lack sufficient and intensive studies.
In the study performed by Burton et al. [18], a diffusion boundary model is developed to well understand the effect of convection on the solute distribution in the melt. Although the length of the melt was assumed semi-infinite rather than finite, the concept is still beneficial to study the solute distribution during the seeding process with convection in the float zone. In this paper, two different analytic models, in which convection in the float zone is assumed, are developed to understand the solute redistributions during general seeding and quasi-seeding processes of TiAl alloys, respectively. Based on the results, the phase selection and microstructural development during the seeding processes are discussed.

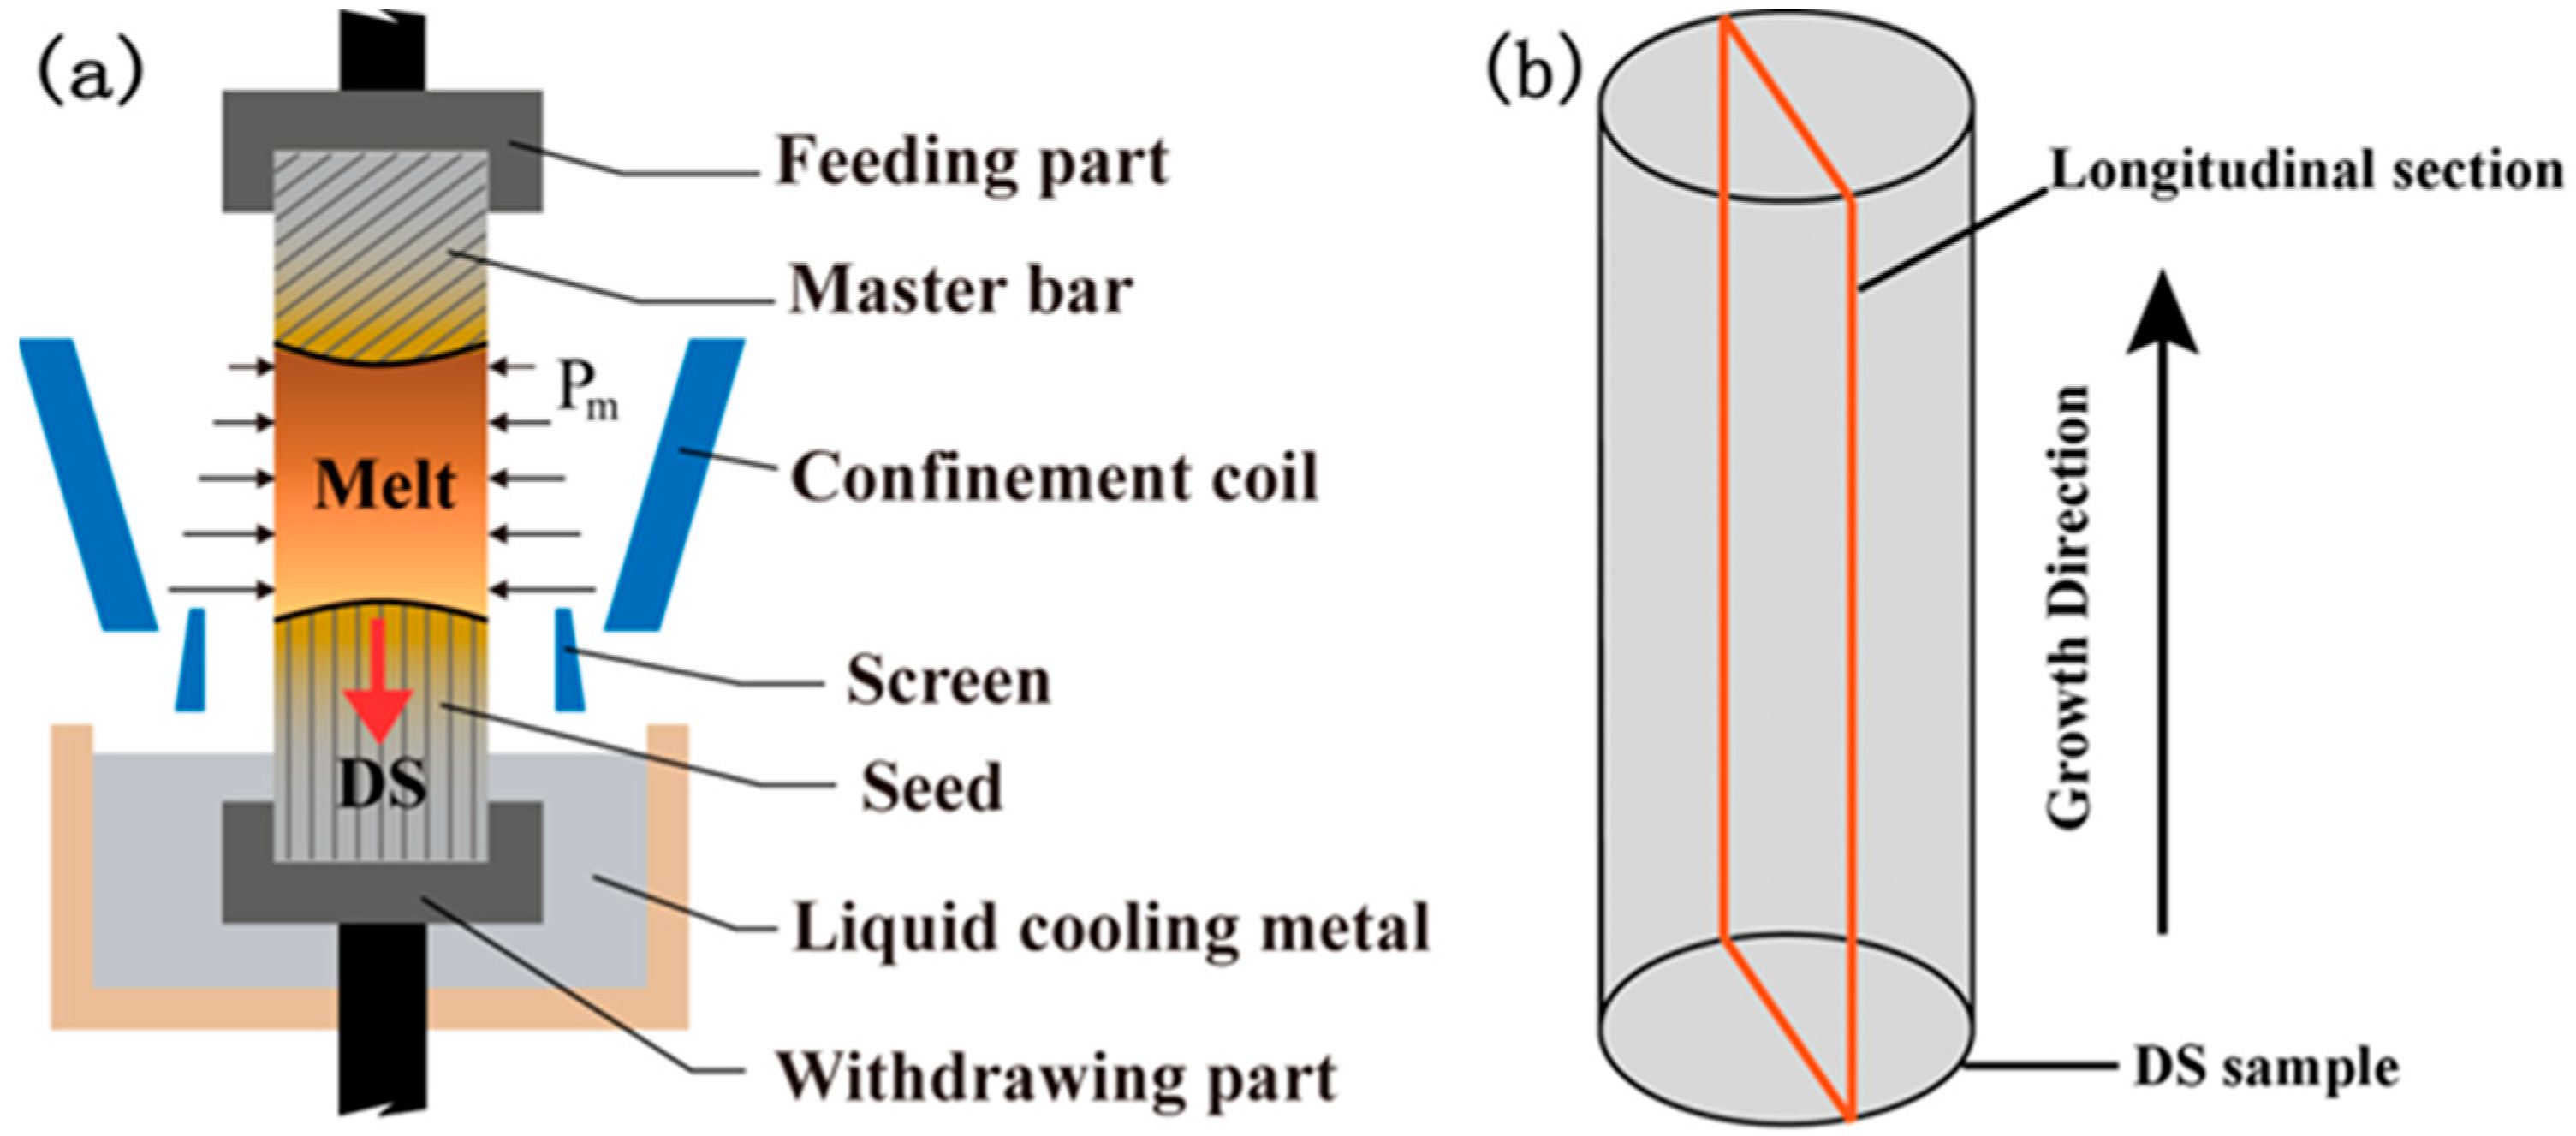
2. Materials and Methods

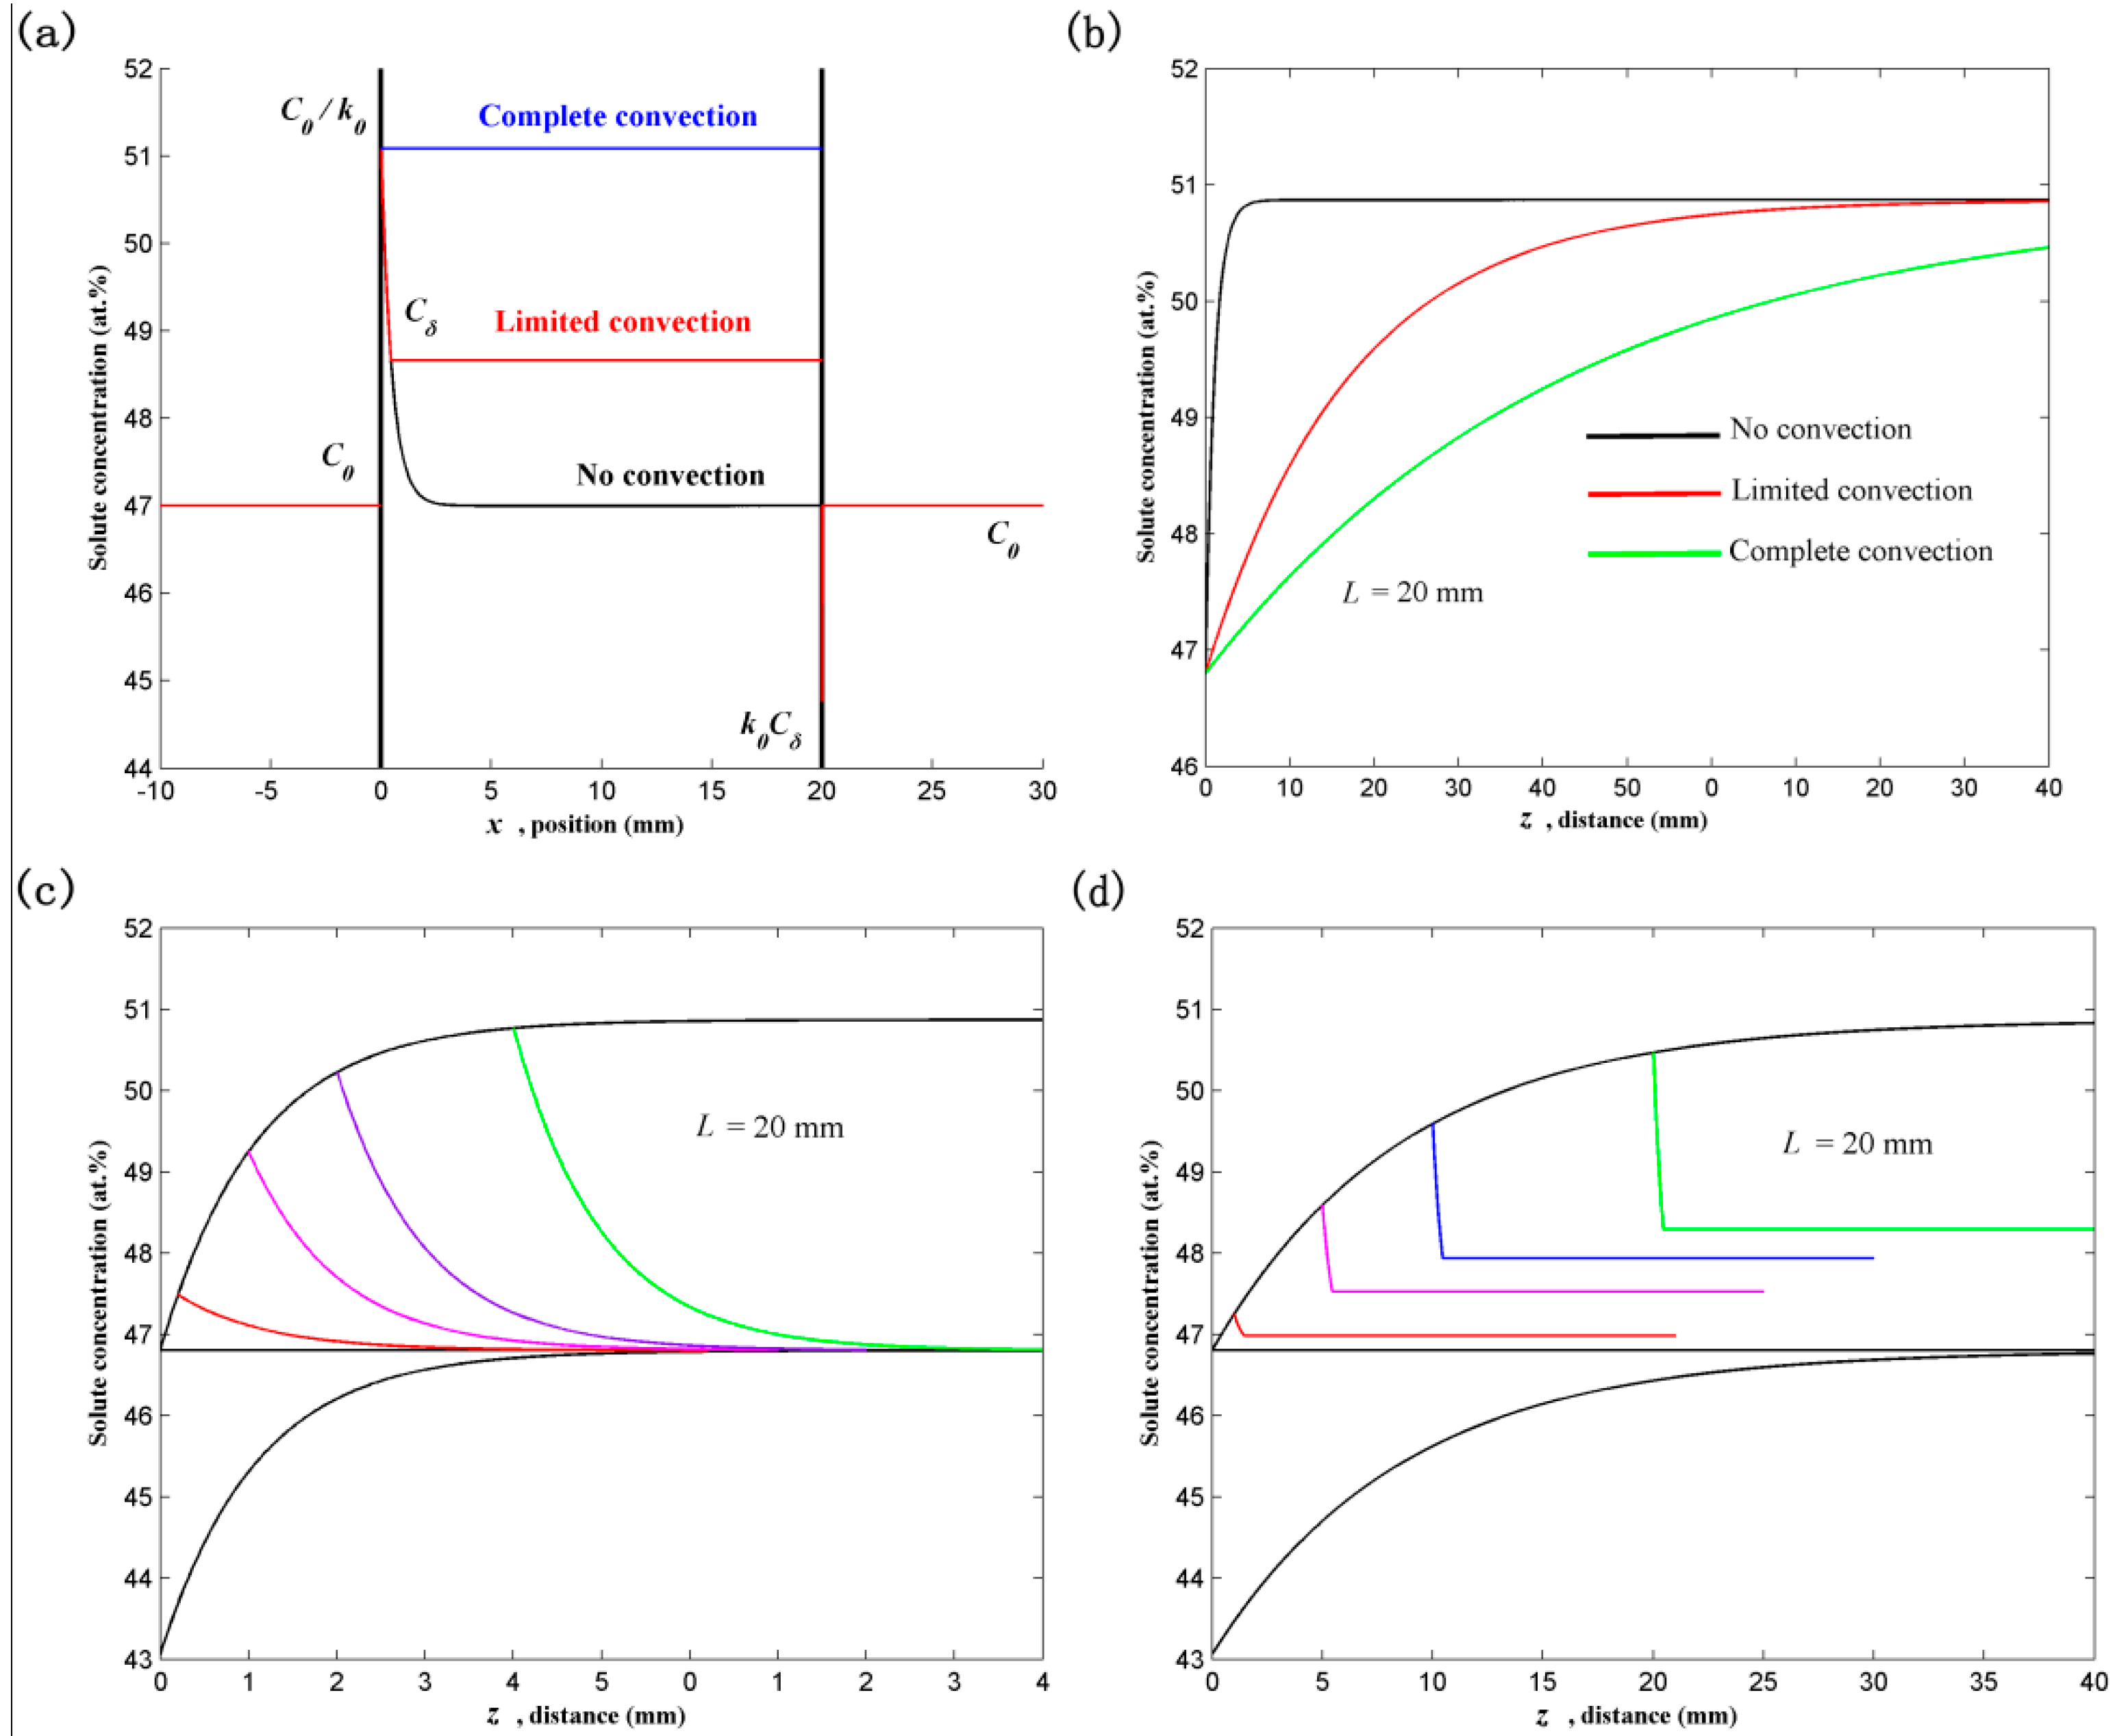
2.1. Solute Redistribution in the Steady State

To study the solute redistribution during directional solidification with convection in the float zone, it is necessary to study the solute distribution in the steady state first. Based on the diffusion boundary model reported by Burton et al. [18], the following assumptions are made:
(1) There exists a diffusion boundary layer of thickness δ ahead of the solidifying interface. Within δ diffusion is the only solute transport mechanism and beyond δ is of uniform concentration due to the convection.
(2) Diffusion coefficient is constant in the melt and feed crystal, and is negligible in the solidifying crystal.
(3) The compositions of the original feed crystal and the solidifying crystal are C0.
(4) The solidifying and melting interface is in a local-equilibrium state, and the equilibrium partition coefficient is constant k0.
Based on these assumptions, the solute distributions in the solidifying crystal, melt and feed crystal are then expressed and determined as follows:
(i)
Solidifying crystal (−∞ < x ≤ 0)
C s C 0
(ii)
Melt (0 ≤ xL)
D l 2 C l x 2 + V C l x = 0 ,   0 x δ
D l C l x | x = 0 = V C l * ( 1 k 0 )
C l = C δ ,   δ < x     L
(iii)
Feed crystal (Lx < ∞)
D s 2 C m x 2 + V C m x = 0
D s C m x | x = L = V C δ ( 1 k 0 )
C m = k 0 C δ ,   x = L
C m = C 0 ,   x  
where Cs, Cl and Cm are the solute distributions in the solidifying crystal, melt and feed crystal, Cl* the solidifying interface concentration in the melt, Cδ the solute concentration at the terminal of diffusion boundary, Dl and Ds the solute diffusion coefficients in the melt and feed crystal, L the length of the float zone, k0 the solute partition coefficient, V the growth velocity, x the distance from the solidifying interface.
The solute distribution in the steady state with convection in the melt (δxL) is obtained by solving the partial diffusion Equation (2), which is subject to the boundary conditions of Equations (3) and (4):
C l = C 0 [ 1 + 1 k 0 k 0 exp ( V D l x ) ] ,   0     x     δ
C l = C δ = C 0 [ 1 + 1 k 0 k 0 exp ( V D l δ ) ] ,   δ < x     L
Notably, Cl is not differentiable at x = δ, which implies that the Equations (9) and (10) cannot express the solute distribution very well, actually. Moreover, with the variation of the convection intensity, δ will change correspondingly, but its definite value is difficult to detect in a specific experiment. Nevertheless, qualitative discussion can still be conducted based on the equations. When the convection is sufficiently intense, the composition in the float zone is absolutely uniform. For this case, δ in Equation (10) tends to be zero and the solute distribution in the melt will become:
C l = C 0 k 0 ,   0     x     L
This is known as the equation reported by Pfann et al. [19], in which diffusion in the melt is assumed to be sufficiently rapid. Such a phenomenon can be explained by the fact that either sufficient diffusion or sufficient convection can lead to the same result: an absolutely uniform composition in the float zone. By contrast, when the convection is slight enough to be ignored, δ will become infinite. Correspondingly, the solute distribution in the melt will become:
C l = C 0 [ 1 + 1 k k exp ( V D l x ) ] ,   0 x L
This result is in accord with that reported by Humphreys et al. [14] and Louchev [15], respectively, in which the convection is ignored and there is only solute diffusion in the melt. Notably, if x tends to be infinite and the L can be considered infinite, Cl tends to be C0 at infinity. This is the well-known result reported by Tiller et al. [11].
Similar to the solving method of the solute redistribution in the melt, the solute concentration in the feed crystal (Lx < ∞) is given by solving the Equation (5), which is subject to the boundary conditions of Equations (6)–(8):
C m = C 0 { 1 + exp [ V D s ( x L ) ] [ ( 1 k 0 ) exp ( V D l δ ) ( 1 k 0 ) ] }
The equation is similar to the solution reported by Humphreys et al. [14] and Louchev [15]. According to Equation (13), the solute distribution in the feed crystal is dependent on the melting interface concentration in the melt. Considering that the solute composition beyond δ is uniform due to the convection, the solute distribution in feed crystal is therefore dependent on Cδ, which relies on the intensity of liquid flow in the float zone fundamentally.

2.2. Solute Redistribution in the Initial Transient

By comparing the Equations (9), (10) and (13), it can be found that the solute diffusion boundary in the feed crystal is far thinner than that in the melt because Dl >> Ds. Thus, for simplicity, the solute diffusion coefficient in the feed crystal is ignored here and then the composition in the feed crystal is of uniform C0. Besides, based on the steady-state solute distribution in the melt (Equations (9) and (10)), it is assumed that the solute distribution in the initial transient always satisfies the following equations:
C l = C 0 + ( C l * C 0 ) exp ( V D l x ) ,   x δ
C l = C 0 + ( C l * C 0 ) exp ( V D l δ ) ,   δ x L
C s * C l * = k 0 .  
where C l * and C s * are the interface concentration in the melt and solidifying crystal, respectively. Thus, the total solute content in the float zone at any time can be expressed as follows:
C t = 0 L C l d x = 0 δ [ C 0 + ( C l * C 0 ) exp ( V D l x ) ] d x + δ L [ C 0 + ( C l * C 0 ) exp ( V D l δ ) ] d x
Substituted Equation (16) into Equation (17), Ct is given:
C t = A + B C s *
A = L C 0 C 0 { D l V [ 1 exp ( V D l δ ) ] + ( L δ ) exp ( V D l δ ) }
B = 1 k 0 { D l V [ 1 exp ( V D l δ ) ] + ( L δ ) exp ( V D l δ ) }
This is an obvious function regarding C s * , which is dependent on the solidification distance from the initial solidifying interface. Because any solute that accumulates in the float zone is always equal to that rejected from the solidifying interface during the solidification, the equilibrium of solute content in the float zone can be determined by the following equation:
d C t = ( C 0 C s * ) d z
where z is the solidification distance from the initial solidifying interface. Putting Equation (18) into Equation (21) and then integrating it, the interface concentration in the solidifying crystal during the directional solidification is given:
C s * = C 0 C 0 ( 1 k 0 ) exp ( k 0 D l V [ 1 exp ( V D l δ ) ] + ( L δ ) exp ( V D l δ ) z )
Equation (16) combining with Equation (22) gives the interface concentration in the melt:
C l * = C 0 k 0 C 0 1 k 0 k 0 exp ( k 0 D l V [ 1 exp ( V D l δ ) ] + ( L δ ) exp ( V D l δ ) z )
Accordingly, the solute distribution in the melt at any time can also be obtained. Similar to the effect of convection on the solute distribution in the steady state, the convection also plays an important role in the solute redistribution in the initial transient. As discussed above, when the convection is sufficiently intense, the solute concentration in the melt is absolutely uniform and then δ = 0. For this case, Equations (22) and (23) become:
C s * = C 0 C 0 ( 1 k 0 ) exp ( k 0 L z )
C l * = C 0 k 0 C 0 1 k 0 k 0 exp ( k 0 L z )
The results are also in accord with those reported by Pfann et al. [19]. By contrast, when there is only solute diffusion in the melt, δ tends to be infinite. Therefore, Equations (22) and (23) become:
C s * = C 0 C 0 ( 1 k 0 ) exp ( k 0 V D l z )
C l * = C 0 k 0 C 0 1 k 0 k 0 exp ( k 0 V D l z )
These are the well-known results reported by Tiller [11]. Somewhat differently is that the length of melt is assumed semi-infinite whereas that in our study is finite. Nevertheless, because the length of equivalent diffusion boundary layer (2Dl/V) [20] is far shorter than the length of the float zone, the effect of the melt length on the solute redistribution can be ignored here. This can well explain why the same results are obtained in both cases.

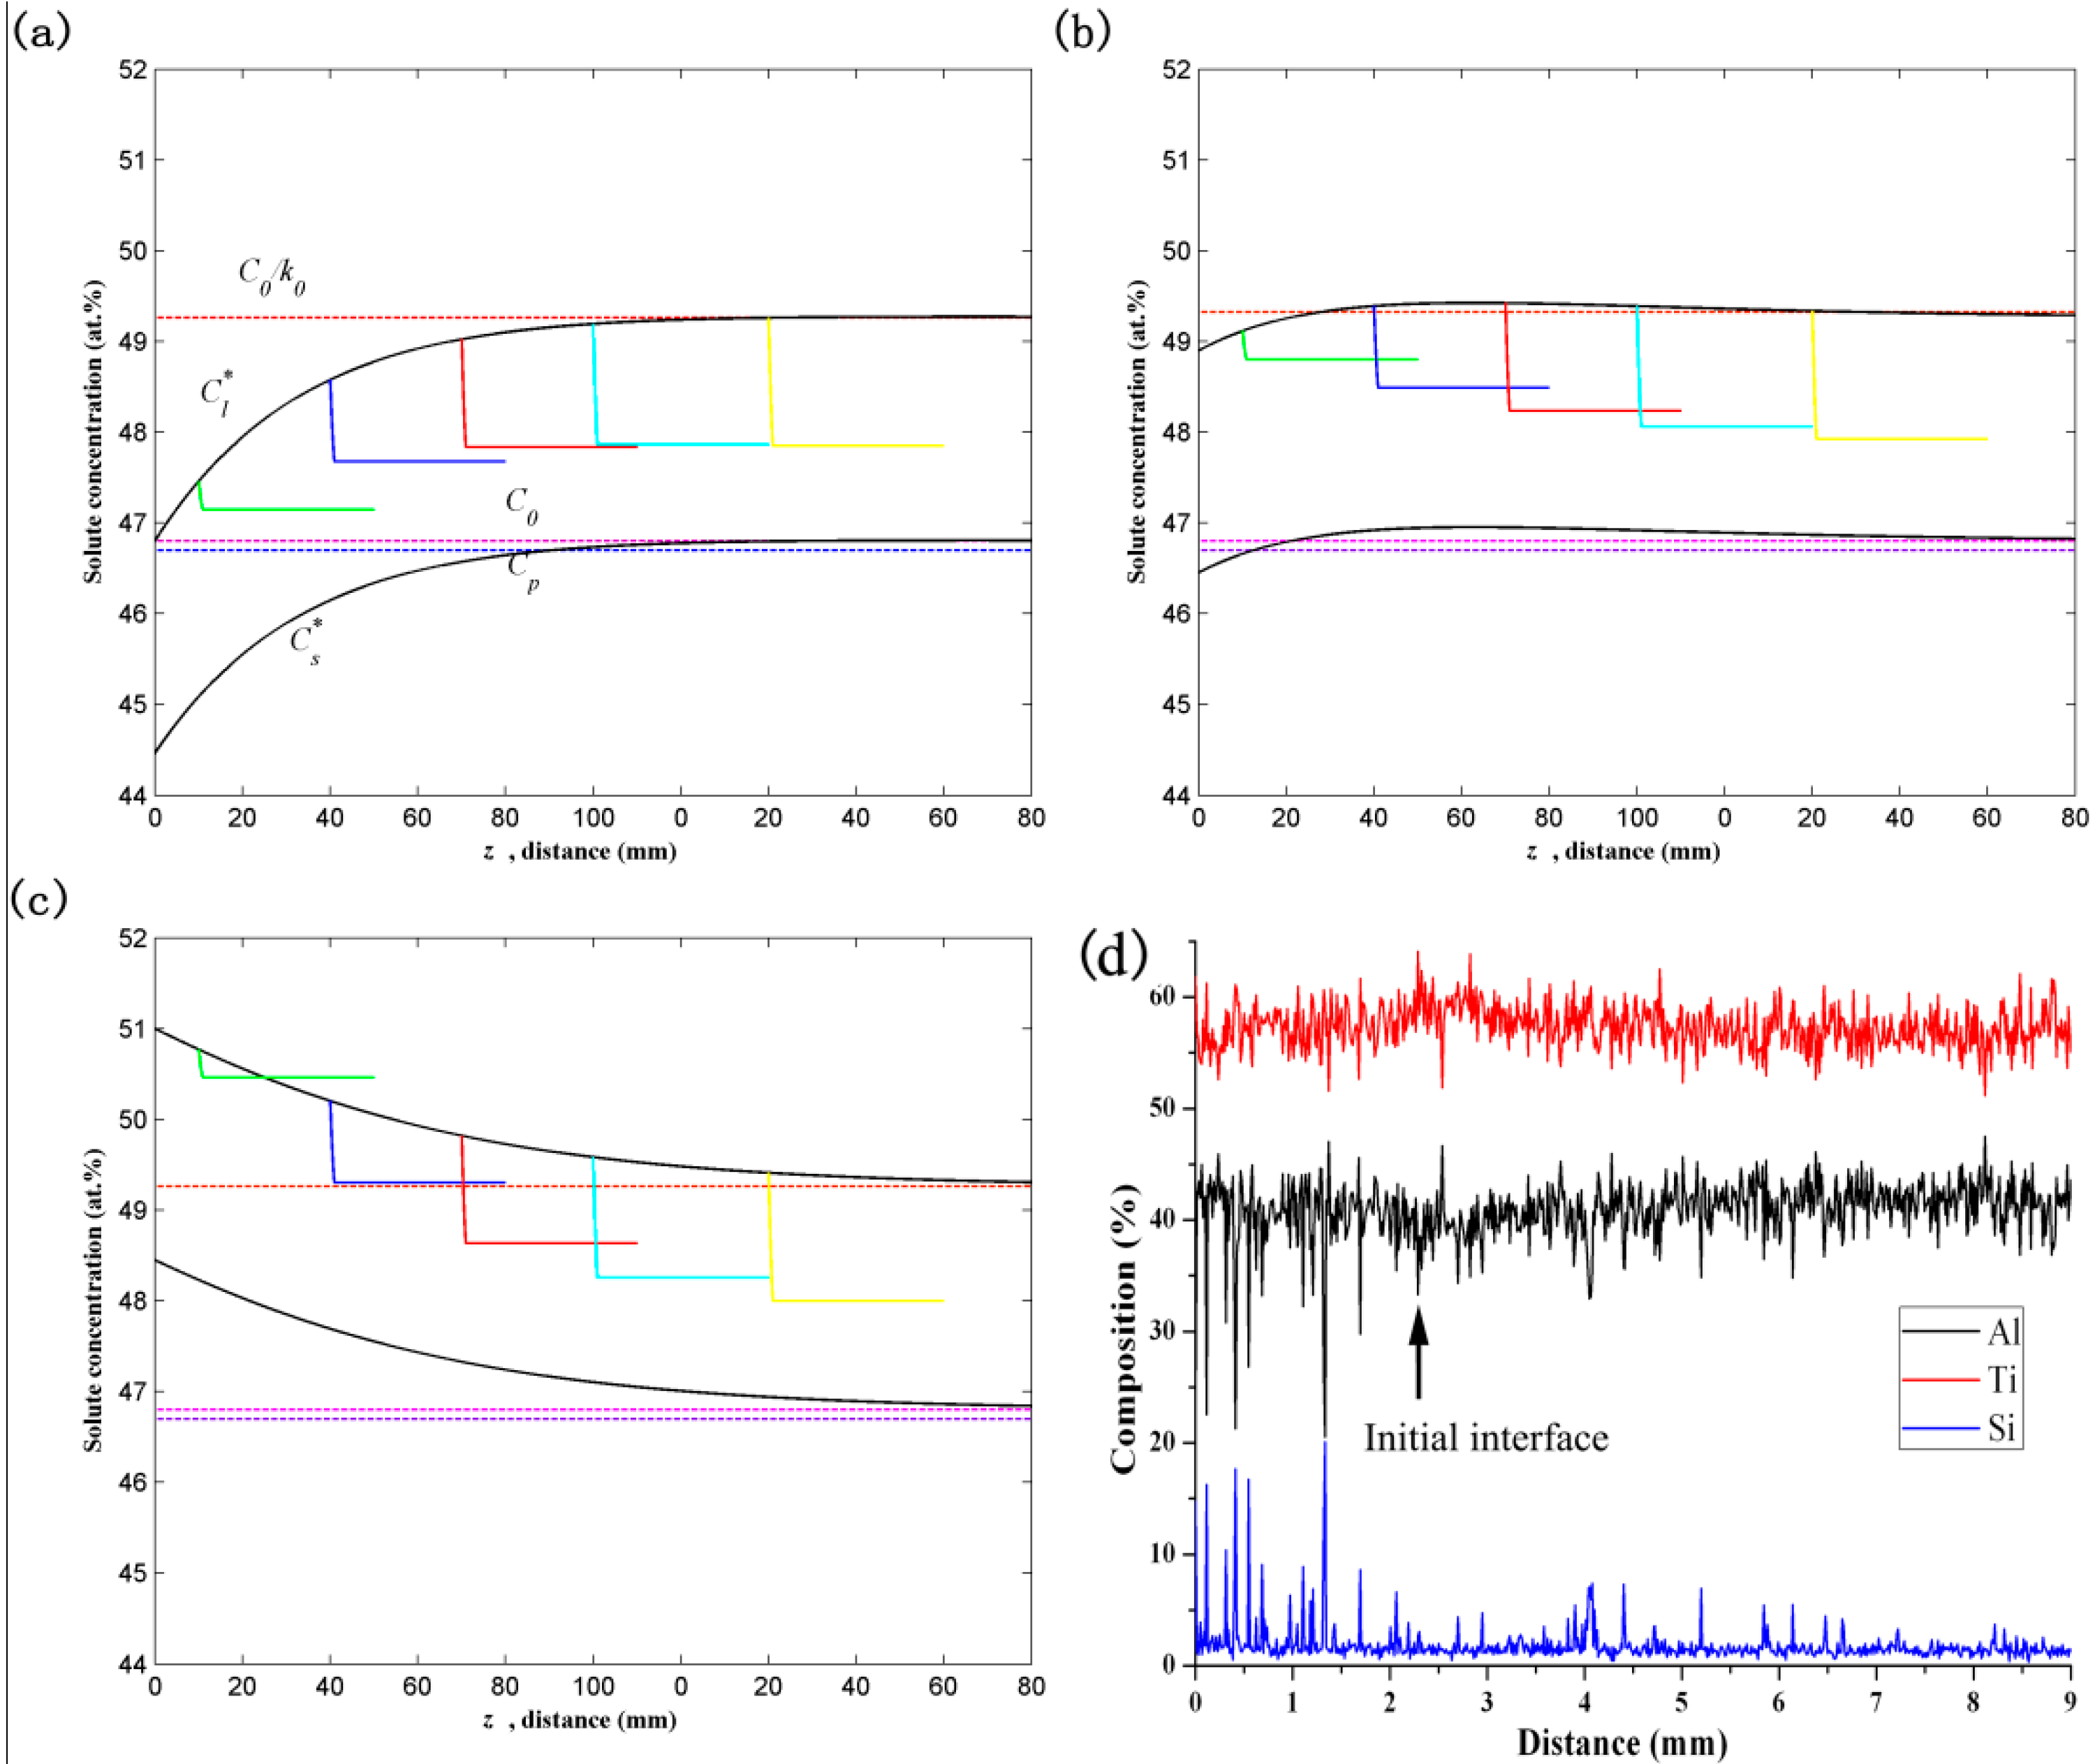
2.3. Solute Redistribution during the General Seeding Process

For general seeding process, there usually exists a large composition difference between the seed and master alloy, which leads to the complicacy of solute redistribution in the initial transition. Due to the melting of seed, the initial composition of the float zone is not C0 and the liquid concentration at infinite cannot be considered C0. For this case, it is unreasonable to describe the solute distribution in the melt by Equations (14) and (15). Therefore, an assumed value C is used to express the solute distribution conveniently and then the equations become as follows:
C l = C + ( C l * C ) exp ( V D l x ) ,   x     δ
C l = C + ( C l * C ) exp ( V D l δ ) ,   δ   <   x     L
where C is the solute concentration at infinite when there is no convection in the melt; and both C and C l * here are related to the initial composition of the float zone and the solidified distance from the initial interface. Follows are the boundary conditions to which those equations should be subject:
C l * = C = C m ,   z = 0
C l * = C 0 k 0 ,   z    
C = C 0 ,   z  
where Cm is the initial composition of the float zone, which can be expressed as follows:
C m = h C s e e d L + ( L h ) C m a s t e r L
where h is the length of seed that is melted into the float zone at the beginning, Cseed the composition of the seed alloy, Cmaster the composition of the master alloy. When h = 0, no seed is melted and the initial composition is Cmaster. With the increase of h, the initial composition of the melt increases and thus the solute distribution in transition region also changes correspondingly. When the h increases to L, the initial melt only consists of the melted seed, and thus the initial composition of the melt will become Cseed.
According to the solute distribution given by Equations (28) and (29), the total solute content in the float zone is also given:
C t = 0 L C l d x = L C + ( C l * C ) { D l V [ 1 exp ( V D l δ ) ] + ( L δ ) exp ( V D l δ ) }
Here, because both C and C l * in this equation change with the initial composition and the solidification distance, Ct can still not be determined uniquely, and thus, additional constraint is needed here. Considering that the solute boundary is established gradually during the general directional solidification, it is believed that the solute boundary is also established gradually with crystal growth during the seeding process. For simplicity, we assumed that the solute boundary ahead of the S/L interface is established gradually, and the relationship of C l * and C can be expressed:
C l * C = ( C l , * C 0 ) ( C l , * C 0 ) exp ( ε V D l z )
where C l , * is the interface concentration in the melt when the steady state is reached, which is equal to C0/k0 in that case. ε is the dimensionless number assumed to adjust the establishing rate of the diffusion boundary during the seeding process, which is related to the initial composition of the float zone and some other unclear factors at present. Notably, due to the complicacy of solute redistribution, it is apparent that the Equation (35) cannot fully describe the fact during the seeding process in some cases. Thus, more exact descriptions similar to Equation (35) are needed further.
Substituting Equation (35) into Equation (34), the total solute in the float zone becomes:
C t = L C l * + M exp ( ε V D l z ) N
M = ( C 0 k 0 C 0 ) { L + D l V [ 1 exp ( V D l δ ) ] + ( L δ ) exp ( V D l δ ) }
N = L ( C 0 k 0 C 0 ) + ( C 0 k 0 C 0 ) { D l V [ 1 exp ( V D l δ ) ] + ( L δ ) exp ( V D l δ ) }
Additionally, ignoring the solute diffusion in the solid, the accumulation of solute in the float zone is always equal to that rejected from the solidifying interface during the seeding process. The relationship can be expressed by the following equation:
d C t = ( C 0 C s * ) d z
Substituting Equations (16) and (36) into Equation (39), and then integrating it, the interface concentration in liquid phase is solved:
C l * = ( C m C 0 k 0 ε M V L D l ) exp ( k 0 L z ) + C 0 k 0 + ε M V L D l exp ( ε V D l z )
Substituting Equation (40) into Equation (35), we get:
C = ( C m C 0 k 0 ε M V L D l ) exp ( k 0 L z ) + ( ε M V L D l + C 0 k 0 C 0 ) exp ( ε V D l z ) + C 0
Correspondingly, the solute distribution in the float zone during the seeding process can be obtained by substituting Equations (40) and (41) into Equations (28) and (29), respectively.
The EMCDS device is mainly composed of confinement coil, screen, feeding part, withdrawing part and liquid cooling metal, and the schematic diagram is shown in Figure 1a. When the high-frequency current is introduced into the confinement coil, the metal sample in the confinement coil can be heated and melted by induction heating. At the same time, under the combined action of the induced magnetic field generated by the confinement coil and the induced current generated in the sample, an electromagnetic pressure pointing to the inside of the melt will be generated on the melt surface. By adjusting the shape of the confinement coil, the position of the screen and the coolant, the electromagnetic pressure acting on the metal melt, the pressure produced by the melt surface tension and the static pressure of the melt itself can reach a dynamic balance, and a certain height of the melting zone can be formed. Non-polluting directional solidification of TiAl alloy was realized by pulling the sample down into liquid metal coolant at a certain rate.
Ф20 mm master alloy bars and seed alloy bars were cut from Ф65 mm ingot pre-pared by water-cooled copper crucible induction skull melting technique. Nominal compositions of the master alloy and the seed alloy are Ti-48Al-8Nb (at.%) and Ti-43Al-3Si, respectively. Directional solidified experiments were performed on the self-designed EMCDS device. Withdrawal rates applied in this paper were 10 μm/s. The Specimens for optical microscope (OM, LeicaDM4000M, Leica Camera AG, Wetzlar, Germany) observations were prepared and polished by 2000# sandpaper and then diamond grinding paste with a particle size of W2.5.

3. Results and Discussion

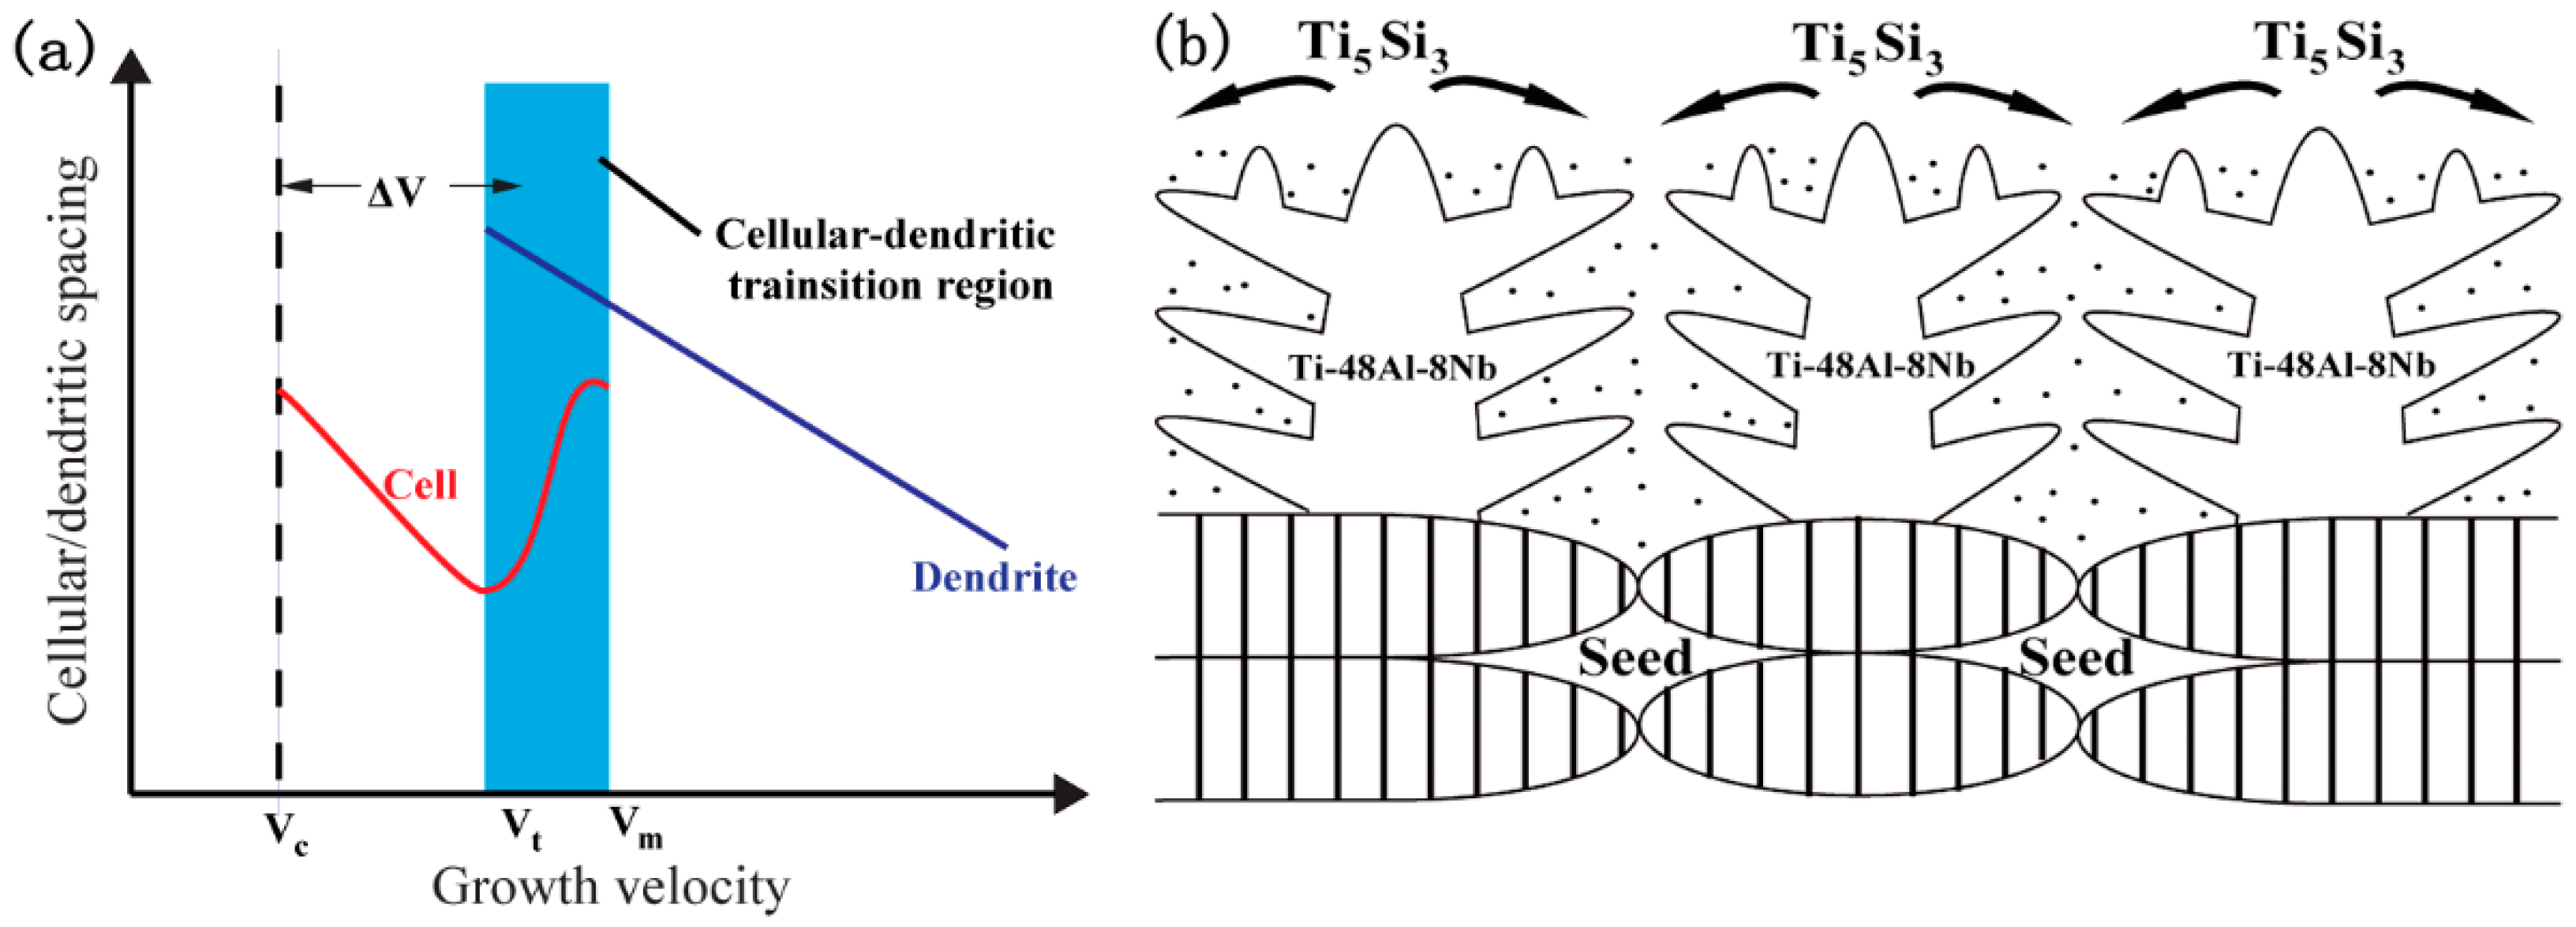
3.1. Microstructural Development during the Quasi-Seeding Process

Figure 2 depicts the typical directional solidified (DS) microstructures in different regions controlled by a quasi-seed. Attributed to the high heating rate during EMCDS and the low growth velocity, duplex microstructure is observed in anneal region, as shown in Figure 2a. According to our previous study, the microstructure is transformed from high-temperature α grains, which have the same orientation as that of the original lamellar microstructure within the quasi-seed. Seeded by the high-temperature α grains, columnar grains are aligned well and the desired lamellar microstructure is obtained, as shown in Figure 2b. After competitive growth, some columnar grains grow stably and then the lamellar microstructure is aligned parallel to the growth direction in the DS region, as shown in Figure 2c, which suggests that the lamellar microstructure is aligned well by the Ti-48Al-8Nb quasi-seed.
Because the master alloy has the same composition as the quasi-seed alloy, the solute redistribution during the quasi-seeding process is similar to the case discussed in Section 2.2. According to the “Al-equivalent” concept [7], the Ti-48Al-8Nb alloy is equivalent to the Ti-46.8Al alloy, and the material properties used in the calculations are listed in Table 1. Figure 3a shows the steady-state solute distributions with different convections in the float zone. When there is limited convection in the melt, the diffusion boundary layer is very thin and the solute concentration within δ decreases exponentially from C0/k0 to Cδ, and beyond δ is of uniform concentration of Cδ. This is somewhat different form the results reported by Burton [18], in which the interface concentration is always less than C0/k0 and the concentration beyond δ is always C0. This is largely because the length of the float zone in our study is finite rather than semi-infinite, and thus, the solute can accumulate continuously both within and beyond δ until the steady state is reached.
With the increase of convection intensity, the δ becomes thinner and solute concentration beyond δ increases correspondingly, and vise verse. Once the convection is intense enough, δ will decrease to 0 and the solute composition in the melt will be absolutely uniform. For this case, the composition in the melt will maintain C0/k0 in the steady state, which is in accord with the results reported by Pfann [19]. By contrast, when there is no convection in the melt, the solute distribution is then similar to the results reported by Humphreys et al. [14] and Louchev [15], respectively, as shown in Figure 3a.
The interface concentrations during the quasi-seeding process with different convections in the melt are depicted in Figure 3b. The growth distance before the steady state increases with the increase of convection intensity; and the shortest growth distance is reached when there is no convection in the melt. When the convection is sufficiently intense, the solute composition in the melt is absolutely uniform and then the longest growth distance is needed. Figure 3c shows the solute redistribution in the initial transient when there is no convection in the melt. The diffusion boundary ahead of the solidifying interface is established gradually with crystal growth and the concentration at infinity always maintains constant C0. By contrast, when limited convection exists in the melt, as shown in Figure 3d, the diffusion boundary ahead of the solidifying interface, in which the solute concentration decreases exponentially, is also established gradually with crystal growth. Besides, it is also observed that the solute concentration beyond δ is always uniform due to the convection and increases with crystal growth correspondingly.
The images in Figure 4 show the constitutional undercooling ahead of the S/L interface during the quasi-seeding process. Because the initial composition in the float zone is uniform and the growing grains are α phase, the maximum constitutional undercooling of approximate 16 K for nucleation of β exists at the solidifying interface, as shown in Figure 4a. Nevertheless, those aligned α grains can still grow as a metastable phase. With the crystal growth, the constitutional undercooling deceases and the position where the maximum constitutional undercooling occurs also moves forward with respect to the interface, which can be observed from Figure 4a–c. When the steady state is reached, as shown in Figure 4c, the constitutional undercooling occurs at some distance of the growing α phase. Correspondingly, the grains at the S/L interface can grow as stable phase. Moreover, it is also found that the convection has a significant effect on the constitutional undercooling in the steady state. As shown in Figure 4d, with the increase of convection intensity, the δ becomes thinner and the concentration beyond δ becomes higher. For this case, the constitutional undercooling with respect to β will decrease correspondingly, which is beneficial to the growth of those aligned α grains.

3.2. Microstructural Development during the General Seeding Process

The images in Figure 5 show the typical microstructures during the general seeding process, in which the lamellar microstructure of Ti-48Al-8Nb alloy is aligned by a Ti-43Al-3Si seed. After heating to and cooling from the melting point, the original seed grains in the annealing region become coarse and the lamellar microstructures within these grains are still retained well, as shown in Figure 5a. Besides, it is also observed numerous Ti5Si3 particles are distributed at grain boundaries and within grain interiors. Once the solidification starts, columnar grains grow along the orientation of the coarse seed grains and thus the lamellar microstructure is aligned parallel to the growth direction. Somewhat surprisingly is that coarse dendrites form in initial transition region. Additionally, numerous fine Ti5Si3 particles are also observed in the interdendritic region, whereas few particles can be found within dendritic cores, as depicted in Figure 5b. With crystal growth, the fine Ti5Si3 particles reduce gradually and the dendritic spacing decreases. Then, cellular morphology is observed at the quenched interface. Figure 5c shows the lamellar microstructure aligned well in EMCDS, which suggests that the high-temperature α grains grow continuously controlled by the Ti-43Al-3Si seed. More details have been reported in Ref. [4].
Because the master alloy has different composition from the seed alloy, as discussed before, the case of the solute redistribution during the general seeding process is more complicated than that during the quasi-seeding process. To study the solute redistribution during the general seeding process, the ternary alloy of Ti-43Al-3Si is considered a binary alloy of Ti-51Al according to the “Al-equivalent” concept [7] and the ε of 0.024 is arbitrarily valued. Although it is found that the calculated results are very sensitive with regard to the value of ε and the solute distribution is apparently deviating from the actual levels in some cases, the results are still helpful for us to understand the solute redistribution during the seeding process.
The images in Figure 6a–c show the solute distribution during the seeding process when the initial compositions of the melt are different. It can be observed that the interface concentration in liquid and solid phase changes with the initial composition. As depicted in Figure 6a, when the initial composition is Al 46.8%, the solute accumulates gradually both within and beyond δ with crystal growth and the interface concentration in liquid and solid phase increased correspondingly, which is similar to the case in the quasi-seeding process, namely, the directional solidification without seed. When the initial composition increases to Al 51%, the solute boundary is also established as that case in Al 46.8%, but the difference is that the interface concentrations both in liquid and solid phase decrease with crystal growth, as shown in Figure 6c. As a result, interface concentration in liquid is always larger than the liquid concentration at the peritectic temperature. When the initial composition is Al 48.9%, solute redistribution during the seeding process is between that of the above cases. Although the solute boundary is still established gradually with crystal growth, as shown in Figure 6b, the solute concentrations both in liquid and solid can approximately maintain unchanged.
For seeding process of TiAl alloys, the critical factor is to keep the α phase growing continuously. Thus, maintaining a stable interface concentration in the initial transient is significant. When the initial composition of the melt is Al 46.8%, the solute redistribution and the constitutional undercooling are similar to that during the quasi-seeding process. If the initial composition is Al 51%, the interface concentration in liquid is always higher than the liquid composition at peritectic temperature. For this case, the α phase can grow as a stable phase and the nucleation of β phase is difficult, as shown in Figure 7a. With the crystal growth, the solute diffusion boundary is established gradually. Despite that, no constitutional undercooling with respect to β exists ahead of the S/L interface, as depicted in Figure 7b. The image in Figure 7c shows the local temperature and local liquidus temperatures of α and β when the steady state is reached. Like the case during the quasi-seeding process, the constitutional undercooling appears at some distance of the growing α phase. Similarly, it is also greatly dependent on the convection in the float zone. To identify the solute redistribution during the initial transient, the solute distribution at the initial interface of the sample is checked by EDS, as shown in Figure 6d. Because the seed is melted more than 10 mm and the length of the float zone is about 20 mm, the initial composition of the melt is more than Al 49%, and thus, the solute distribution at the initial interface is similar to the calculated result shown in Figure 6b.
However, unlike the microstructural development during the quasi-seeding process, coarse dendrites in the initial transient and cellular morphology at S/L interface are observed during the general seeding process. Thus, it is believed that the interface morphology is transformed from initial planar to coarse dendritic and then cellular. However, such an abnormal phenomenon cannot be explained by the establishment of solute boundary. In the study performed by Trivedi and Somboonsuk [24], two different pattern propagation mechanisms are proposed to understand the interface transformation from planar to cellular or dendritic. During the transformation of cellular interface, nearly all the perturbations that form at the planar interface will propagate to be a stable cellular structure. By contrast, when the interface morphology is transformed from planar to dendritic, only several perturbations that meet certain conditions can propagate further and finally the dendritic interface is observed. The effect of growth velocity on the cellular/dendritic spacing is studied by Eshelman et al. [25]. As shown in Figure 8a, while in the cellular–dendritic transition region, both cellular and dendritic interface can be obtained although the experiment condition are identical and the dendritic spacing is always larger than the cellular spacing. Besides, it is also suggested that the value of ΔV, i.e., Vt − Vc, is dependent on the solute distribution coefficient.
As discussed before, to study the solute redistribution during the general seeding process, the Ti-43Al-3Si seed alloy is considered to be binary Ti-51Al alloy and then the solute boundary can be gradually established with crystal growth. However, the model ignores the effect of Si on the solute redistribution and then the interface instability. In general, due to the addition of alloy elements, the solute distribution coefficient changes and the S/L interface becomes unstable. For this case, the cellular interface may transform to the dendritic morphology when other conditions are the same. Correspondingly, the cellular–dendritic transition region will shift to the low range of growth velocity, as shown in Figure 8a. This can well explain why dendrites formed in the initial stage of seeding process. Moreover, because the growth velocity is in the cellular–dendritic transition region, the dendritic spacing is larger than the cellular spacing at S/L interface.
With the crystal growth, the influences of solute distribution on the development of dendritic morphology become complicated. On one hand, the diffusion boundary is established gradually and thus, the S/L interface is expected to be more unstable. On the other hand, the S/L interface will become stable owing to the reduction of the Ti5Si3 particles. According to our experiment results, it is suggested that the interface becomes more stable and thus the cellular morphology is formed at the quenched S/L interface. Note that, because the orientation of the lamellar microstructure is aligned by the seed, the interface transformation from dendritic to cellular should be achieved by branching, as illustrated in Figure 8b. Any nucleation and growth of new α or β grains usually lead to the failure of seeding process. To avoid the nucleation of new grains in the initial transient, a slower growth velocity is expected to maintain planar interface in the transition region and a higher growth velocity is used while the steady state of the S/L interface is reached.

4. Conclusions

Assuming limited convection in the float zone, two different analytic models are developed to investigate the solute redistributions during general seeding and quasi-seeding processes of TiAl alloys, respectively. Additionally, the phase selection and microstructural development during the seeding processes are also discussed. The results are as follows:
1. Affected by the convection, the solute decreases exponentially within δ and has a uniform composition of Cδ beyond δ. With the increase of convection intensity, the δ becomes thinner and the growth distance in the initial transient increases. Correspondingly, the constitutional undercooling with respect to the β phase also decreases, which is beneficial to growth of those aligned α grains and the lamellar alignment of TiAl alloys.
2. At the beginning of quasi-seeding process, the maximum constitutional undercooling with respect to β occurs at the solidifying α interface. With crystal growth, the solute diffusion boundary forms gradually and the constitutional undercooling decreases. It is found that the position, where the maximum constitutional undercooling occurs, will move forward regarding the interface.
3. The solute redistribution during the general seeding process is analyzed based on the binary TiAl alloy. The results suggest that the initial composition higher than Al 48.9% can keep the α grains growing continuously as a stable phase. Nevertheless, affected by the alloy elements of Si, a coarse dendritic interface forms in the initial stage and then transform to cellular with crystal growth.

Author Contributions

Conceptualization, Y.-L.X.; Data curation, J.S.; Formal analysis, Y.-J.D.; Funding acquisition, J.S.; Methodology, Y.-L.X.; Validation, Y.-L.X.; Writing—original draft, Y.-L.X.; Writing—review & editing, Y.-J.D. All authors have read and agreed to the published version of the manuscript.

Funding

This research was funded by the National Natural Science Foundation of China, grant number 51574195.

Data Availability Statement

Not applicable.

Conflicts of Interest

The authors declare no conflict of interest.

References

  1. Lee, H.N.; Johnson, D.R.; Inui, H.; Oh, M.H.; Wee, D.M.; Yamaguchi, M. Microstructural control through seeding and directional solidification of TiAl alloys containing Mo and C. Acta Mater. 2000, 48, 3221–3233. [Google Scholar] [CrossRef]
  2. Lee, H.N.; Johnson, D.R.; Inui, H.; Oh, M.H.; Wee, D.M.; Yamaguchi, M. A composition window in the TiAl–Mo–Si system suitable for lamellar structure control through seeding and directional solidification. Mater. Sci. Eng. A 2002, 329–331, 19–24. [Google Scholar] [CrossRef]
  3. Takeyama, M.; Yamamoto, Y.; Morishima, H.; Koike, K.; Chang, S.Y.; Matsuo, T. Lamellar orientation control of Ti-48Al PST crystal by unidirectional solidification. Mater. Sci. Eng. A 2002, 329–331, 7–12. [Google Scholar] [CrossRef]
  4. Du, Y.; Shen, J.; Xiong, Y.; Shang, Z.; Wang, L.; Fu, H. Lamellar microstructure alignment and fracture toughness in Ti–47Al alloy by electromagnetic confinement and directional solidification. Mater. Sci. Eng. A 2015, 621, 94–99. [Google Scholar] [CrossRef]
  5. Du, Y.; Shen, J.; Xiong, Y.; Shang, Z.; Fu, H. Stability of lamellar microstructures in a Ti–48Al–2Nb–2Cr alloy during heat treatment and its application to lamellae alignment as a quasi-seed. Intermetallics 2015, 61, 80–84. [Google Scholar] [CrossRef]
  6. Kim, M.C.; Oh, M.H.; Lee, J.H.; Inui, H.; Yamaguchi, M.; Wee, D.M. Composition and growth rate effects in directionally solidified TiAl alloys. Mater. Sci. Eng. A 1997, 239–240, 570–576. [Google Scholar] [CrossRef]
  7. Johnson, D.R.; Inui, H.; Muto, S.; Omiya, Y.; Yamanaka, T. Microstructural development during directional solidification of α-seeded TiAl alloys. Acta Mater. 2006, 54, 1077–1085. [Google Scholar] [CrossRef]
  8. Johnson, D.R.; Masuda, Y.; Inui, H.; Yamaguchi, M. Alignment of the TiAl/Ti3Al lamellar microstructure in TiAl alloys by directional solidification. Mater. Sci. Eng. A 1997, 239–240, 577–583. [Google Scholar] [CrossRef]
  9. Li, M.; Xiao, S.; Xu, L.; Tian, J.; Chen, Y. Microscale investigation of perovskite-Ti3AlC strengthening and plastic deformation in high niobium containing TiAl alloys. J. Alloys Compd. 2021, 857, 157563. [Google Scholar] [CrossRef]
  10. Rackel, M.W.; Stark, A.; Gabrisch, H.; Pyczak, F. Screening for O phase in advanced γ–TiAl alloys. Intermetallics 2021, 131, 107086. [Google Scholar] [CrossRef]
  11. Tiller, W.A.; Jackson, K.A.; Rutter, J.W.; Chalmers, B. The redistribution of solute atoms during the solidification of metals. Acta Metall. 1953, 1, 428–437. [Google Scholar] [CrossRef]
  12. Smith, V.G.; Tiller, W.A.; Rutter, J.W. A Mathematical Analysis of Solute Redistribution During Solidification. Can. J. Phys. 1955, 33, 723–745. [Google Scholar] [CrossRef]
  13. Jackson, K.A.; Pfann, W.G. Producing a linear gradient of solute concentration by changing the volume of a molten zone. J. Appl. Phys. 1965, 36, 320. [Google Scholar] [CrossRef]
  14. Humphreys, L.B.; Heminger, J.A.; Young, G.W. Morphological instability in a float zone. J. Cryst. Growth 1990, 100, 31–50. [Google Scholar] [CrossRef]
  15. Louchev, O.A.; Otani, S. Morphological instability of the solid-liquid interface and the supersaturation gradient in crystal growth from a high-temperature solution. Phys. Rev. E 1996, 54, 6372–6380. [Google Scholar] [CrossRef] [PubMed]
  16. Xu, X.; Ding, H.; Huang, H.; Liang, H.; Chen, R.; Guo, J.; Fu, H. Microstructure formation and columnar to equiaxed transition during cold crucible directional solidification of a high-Nb TiAl alloy. J. Mater. Res. Technol. 2021, 11, 2221–2234. [Google Scholar] [CrossRef]
  17. Xu, X.; Ding, H.; Li, W.; Huang, H.; Liang, H.; Chen, R.; Guo, J.; Fu, H. The microstructure and high cycle fatigue performance of as-cast and directionally solidified Ti46Al7Nb alloy under the three-point bending loading. Mater. Sci. Eng. A 2021, 822, 141633. [Google Scholar] [CrossRef]
  18. Burton, J.A.; Prim, R.C.; Slichter, W.P. The Distribution of Solute in Crystals Grown from the Melt. Part I. Theoretical. J. Chem. Phys. 1953, 21, 1987–1991. [Google Scholar] [CrossRef]
  19. Seidensticker, R.G. Kinetic Effects in Temperature Gradient Zone Melting. J. Electrochem. Soc. 1966, 113, 152. [Google Scholar] [CrossRef]
  20. Pfann, W.G. Zone melting. Metall. Rev. 1957, 2, 29–76. [Google Scholar] [CrossRef]
  21. Mishin, Y.; Herzig, C. Diffusion in the Ti–Al system. Acta Mater. 2000, 48, 589–623. [Google Scholar] [CrossRef]
  22. Jung, I.-S.; Kim, M.-C.; Lee, J.-H.; Oh, M.-H.; Wee, D.-M. High temperature phase equilibria near Ti–50 at% Al composition in Ti–Al system studied by directional solidification. Intermetallics 1999, 7, 1247–1253. [Google Scholar] [CrossRef]
  23. Schuster, J.C.; Palm, M. Reassessment of the binary aluminum-titanium phase diagram. J. Phase Equilibria Diffus. 2006, 27, 255–277. [Google Scholar] [CrossRef]
  24. Trivedi, R.; Somboonsuk, K. Pattern formation during the directional solidification of binary systems. Acta Metall. 1985, 33, 1061–1068. [Google Scholar] [CrossRef]
  25. Eshelman, M.; Seetharaman, V.; Trivedi, R. Cellular spacings—I. Steady-state growth. Acta Metall. 1988, 36, 1165–1174. [Google Scholar] [CrossRef]
Figure 1. Schematic illustration of electromagnetic confinement and directional solidification system (a) and the sectioned longitudinally of the DS bar by EDM (b).
Metals 11 01525 g001
Figure 2. Microstructures of (a) annealing region, (b) initial interface and (c) DS region during the quasi-seeding process at 10 μm/s.
Metals 11 01525 g002
Figure 3. Solute distributions in the steady state (a), interface concentrations during the quasi-seeding process with different convections in the float zone (b) and the solute redistributions in the initial transient when there is no convection (c) and limited convection (d) in the float zone.
Metals 11 01525 g003
Figure 4. Local temperature and local liquidus temperatures of α and β and the constitutional undercooling with respect to β (grey region) during the general seeding process when the growth distance is 0 mm (a), 5 mm (b) and 50 mm (c) and the effect of the δ on the constitutional undercooling when the steady state is reached (d).
Metals 11 01525 g004
Figure 5. Longitudinal microstructures in the (a) annealing region, (b) transition region and (c) DS region during the general seeding process at 10 μm/s.
Metals 11 01525 g005
Figure 6. Solute distribution during the general seeding process when the initial concentration of the melt is 46.8% (a), 48.9% (b) and 51% (c) and the detected solute distribution of the solid phase at initial interface when the growth velocity is 10 µm/s (d).
Metals 11 01525 g006
Figure 7. Local temperature and local liquidus temperatures of α and β and the constitutional undercooling with respect to β when the growth length is 0 mm (a), 50 mm (b) and 100 mm (c) during the quasi-seeding process.
Metals 11 01525 g007
Figure 8. Effects of growth velocity and alloy elements on the interface morphology (a) and the illustration of interface transformation during the general seeding process (b). Vc is the velocity after which the cellular interface forms, Vt and Vm are the velocity after which the cellular–dendritic transition starts and ends, respectively, and ΔV is the range of velocities in which only cellular interface can form.
Metals 11 01525 g008
Table 1. Material properties of TiAl alloy.
PropertySymbolValueUnit
Diffusion coefficient of Al in liquid [8]Dl5 × 10−9m2/s
Diffusion coefficient of Al in solid [21]Ds1 × 10−11m2/s
Peritectic temperature [22,23]Tp1491.8°C
Liquid concentration at Tp [22,23]CL49.5at.%
Partition coefficient of α phase [8]0.94-
Liquidus slope of α phase [8]−2.4K/at.%
Liquidus slope of β phase [8]−8.5K/at.%
Length of the float zoneL20mm
Thickness of the diffusion boundaryδ0.45mm
Growth velocityV10µm/s
Temperature gradientG2 × 104K/m
Publisher’s Note: MDPI stays neutral with regard to jurisdictional claims in published maps and institutional affiliations.

