Article

Friction Stir Welding of a TRIP Fe49Mn30Cr10Co10C1 High Entropy Alloy

Laboratory of Bulk Nanostructured Materials, Belgorod State University, 308015 Belgorod, Russia
*
Author to whom correspondence should be addressed.
Metals 2021, 11(1), 66; https://doi.org/10.3390/met11010066
Submission received: 7 December 2020 / Revised: 26 December 2020 / Accepted: 27 December 2020 / Published: 30 December 2020
(This article belongs to the Special Issue Design of High-Entropy Alloys)

Abstract

:
The effect of friction stir welding parameters on the structure and properties of Fe49Mn30Cr10Co10C1 high-entropy alloy welds was studied. Due to the development of the TRIP effect, the mechanical behaviour of this alloy was associated with the γ fcc-to-ε hcp martensitic transformation. In the initial condition, the microstructure of the program alloy comprised equiaxed fcc grains and small fractions of the hcp ε-martensite (~5%) and M23C6 carbides (~4%). Friction stir welding of the program alloy resulted in recrystallization of the stir zone and a decrease in the fraction of the carbides to 1–2%; however, the percentage of the hcp phase remained at nearly the same level as that in the initial condition. Post-welding tests showed a considerable increase in the strength and microhardness of the welds both due to the recrystallization-induced decrease in grain size and martensitic transformation.

1. Introduction

So-called high entropy alloys (HEAs) have attracted considerable attention due to an unusual combination of mechanical and functional properties [1,2,3,4]. Initially, HEAs were defined as alloys containing five or more elements in equiatomic or near-equiatomic concentrations. The latter should maximize the value of mixing entropy causing, therefore, the formation of a single solid-solution phase instead of a mixture of intermetallic phases. Although some recent research [5] did not support the crucial effect of configurational entropy in equiatomic HEAs on the formation of a solid-solution phase, the idea of searching for new promising compositions with unique structures and properties in central poorly explored areas of multicomponent phase diagrams still attracts increasing interest.
Among the many possible variants, the Co-Cr-Fe-Ni-Mn system is the most studied. Many alloys of this system (including equiatomic CoCrFeMnNi) exhibit high ductility and exceptional fracture-toughness at room and cryogenic temperatures. This behavior was mainly attributed to the development of deformation-induced twining causing twinning-induced plasticity (TWIP) in a face-centered cubic (fcc) solid solution. To reduce the cost of the alloy, some modifications to the equiatomic proportion aiming to decrease the percentage of expensive elements were suggested; besides this, an addition of interstitial elements can increase the strength of the material [6,7,8,9,10,11,12]. Some of the obtained alloys demonstrate rather high strength due to the activation of several strengthening mechanisms (e.g., solid-solution-strengthening or precipitation hardening); besides this, some of those mechanisms (specifically, so-called dynamic Hall–Peth strengthening due to TWIP and/or TRIP transformation-induced plasticity (TRIP) effects) provide a considerable improvement in ductility [13].
One of the successive examples was found to be a dual-phase (fcc + hexagonal close packed (hcp)) Fe50Mn30Co10Cr10 alloy [14,15,16,17,18,19,20], which demonstrated an excellent combination of strength and ductility at room temperature caused by the dynamic Hall–Peth effect due to an extensive TRIP effect. The strength of the HEAs can further be increased by an addition of 0.5 at.% of interstitial carbon [13,21,22] due to both precipitation hardening and interstitial solid-solution hardening. However, the amount of C should not be very high to avoid excessive fcc phase stability and corresponding suppression of the TWIP/TRIP effects.
Meanwhile, any practical application of a structural material suggests acceptable technological properties; one of the most important among them is weldability. There are many ways of joining two metallic parts; however, “welding” in the solid-state condition attracts increasing attention due to minimal (in contrast to fusion welding) changes in structure and properties nearby the weld. Friction stir welding (FSW) is a very promising solid-state joining method with a rapidly increasing application area. Many studies have revealed good weldability of Co-Cr-Fe-Mn-Ni-based HEAs with the fcc structure [23,24,25,26,27]. Recently, FSW was successfully used for butt-joint of a carbon-doped CoCrFeNiMn alloy [28,29]. The weld was found to be even stronger than the base material due to strengthening by carbide particles. It should be noted, however, that the FSW of dual-phase HEAs has not been studied to date, although Mishra et al. [12,30] have shown the applicability of friction stir processing (FSP) for improving the structure and properties of related alloys.
Therefore, in the current work, the effect of FSW parameters on structure and properties of a Fe49Mn30Cr10Co10C1 (at.%) alloy was investigated to establish (i) the optimal processing conditions required to obtain a high-strength joint; (ii) the effect of FSW parameters on the structure and properties of the joints.

2. Materials and Methods

A Fe49Mn30Cr10Co10C1 (at.%) high-entropy alloy was used as the program material. The ingot of the alloy was obtained by vacuum induction melting using a mixture of pure (not worse than 99.9 wt.%) elements. The size of the produced ingot was 80 × 60 × 20 mm3.
Before FSW, the alloy was cold-rolled to 56% of thickness reduction (the final thickness was ~2 mm) and then annealed at 900 °C for an hour to obtain a uniform recrystallized microstructure. The produced plates measured 80 × 40 × 2 mm3 were then butt-joined using FSW under the following welding parameters: a tool rotation rate ω of 400–1000 rpm and a tool traverse speed ν of 100 mm/min. Welding at ω = 400 rpm and ν = 50 mm/min was also carried out to evaluate the effect of the traverse speed. For the sake of simplicity, the examined specimens were denoted hereinafter in the form ω-ν (for example, 400-100 specimen). The welding parameters and corresponding designations are listed in Table 1. The tool tilt angle and downward force were 2.5° and 2.6–3.2 kN, respectively. FSW was conducted in-air using a WC-Co-based tool with a shoulder of 11.2 mm in diameter and a hemispherical pin of 2.0 mm in diameter.
Macrostructures of the cross-sections of the welds were examined using an optical microscope Olympus GX41(Olympus Scientific Solutions, Tokyo, Japan). The microstructure of the welds in different areas was studied using a JEOL JEM-2100 (JEOL Ltd., Tokyo, Japan) transmission electron microscope (TEM) operated at 200 kV and equipped with an energy dispersive spectrometry (EDS) detector and a FEI Quanta 600 FEG (FEI Company, OR, USA) scanning electron microscope (SEM), equipped with an electron back-scattered diffraction (EBSD) detector and an EDS analyzer. Samples for SEM analysis were prepared by conventional mechanical polishing with grinding paper and OP-S suspension. The density of geometrically necessary dislocations (GND) was evaluated using Kernel average misorientation maps; a detailed description of the method can be found elsewhere [31]. Samples for TEM analysis were cut parallel to the welds at 0.3 and 1.3 mm from the weld surface and were prepared by the conventional twin-jet electro-polishing of mechanically pre-thinned to 100 μm foils, in a mixture of 10% HClO4 and 90% CH3COOH at the 27 V potential at room temperature. The areas examined by TEM were in the center of the stir zones (SZ) and thermo-mechanical affected zone (TMAZ). The volume fractions of carbides were calculated from TEM images. At least 15 fields of view were analyzed for each condition. The phase composition of the welds was examined using X-ray diffraction (XRD) on a RIGAKU diffractometer (Rigaku, Tokyo, Japan) (CuKα radiation).
The mechanical properties of FSW joints were evaluated at room temperature by both Vickers microhardness measurements under 0.2 kg load and by tensile testing dog-bone flat specimens at a strain rate 10−3 s−1. The tensile specimens were cut either along (the gage size was 6.0 × 3.0 × 1.5 mm3) or across (the gage size was 28.0 × 3.0 × 1.5 mm3) the FSW welds. Since the weld lines and the rolling direction (RD) were perpendicular to each other, the samples cut along the welds (longitudinal specimens) were perpendicular to RD, while specimens cut across the welds (transverse specimens) lay along RD (Figure 1). Therefore, in the initial condition, longitudinal specimens were oriented across RD and transverse specimens along RD.
A Thermo-Calc (version 2020a) software (Thermo-Calc Software, Stockholm, Sweden) and a TCHEA3 (high-entropy alloys) database were used to determine the thermodynamic properties of the program alloy.

3. Results

The fully recrystallized microstructure of the alloy (this condition is referred to hereafter either as the base material or initial condition) consisted of equiaxed grains with the mean size of 7.0 ± 3.2 μm (Figure 2a); a lot of annealing twins (the fraction of twin boundaries was found to be ~33%) can be seen in the microstructure (Figure 2a,c). In the initial condition, the alloy shows a weak irregular texture, most probably caused by recrystallization and annealing twins’ formation; similar texture after cold rolling and recrystallization annealing was often observed in fcc HEAs (e.g., [28]). The phase composition map obtained by EBSD (Figure 2b) suggested that the alloy comprised mainly of an fcc (γ) phase and a small fraction (~5%) of a martensite hcp (ε) phase. In addition, TEM examination revealed coarse (480 ± 110 nm) and fine (140 ± 50 nm) M23C6 carbides. The total volume fraction of the carbides was evaluated to be ~4%.
Sound joints were obtained with all studied parameters of FSW. Macrostructure of the cross-sections suggests a typical cauldron-like shape of the welds obtained with all FSW parameters; an example (the 400-50 specimen) is shown in Figure 3a. The advancing and retreating sides are denoted as AS and RS, respectively, and the heat-affected zone is denoted as HAZ. Numbered boxes in Figure 3a indicate areas where the microstructure of the weld was examined in detail (see below). Some small (2–4 μm) sporadically distributed defects can be seen in the weld (shown by arrows in Figure 3a). Besides this, higher magnification images of area #3 show pores, the size of which increased with an increase in the tool rotation rate (Figure 3b,c). These pores can be associated with the so-called white bands (WBs), whose formation is usually attributed to the WC-Co-based tool wear during FSW [32,33]. The lighter color of WB was caused by small white tungsten-rich (1–8 at.% of W) particles embedded into the Fe49Mn30Cr10Co10C1 matrix [33,34]. The volume fraction of WBs increased with an increase in the rotation speed ). The presence of WB can result in a local increase in hardness by ~20% [28]; however, the effect of WB on macroscopic strength properties (yield strength of ultimate tensile strength) was most probably quite insignificant.
EBSD IPF maps in areas #1–3 (Figure 3a; the areas are associated with the lower and upper parts of SZ and the border between SZ and the base material, respectively) for the welds obtained by FSW with different parameters are shown in Figure 4. The corresponding average grain sizes, density of GND and the fraction of the hcp phase are collected in Table 2. The microstructure of the welds mostly consisted of fine, equiaxed recrystallized grains of the fcc phase. Based on the obtained results, an increase in the tool rotation rate ω tended to cause some grain coarsening, while higher ν can result in the formation of smaller grains. For example, an increase in ω from 400 to 600 rpm (at ν = 100 mm/min) resulted in an increase in grain size in the #1 area by a factor of ~2 from 1.0 ± 0.6 μm to 2.3 ± 1.5 μm. A two-fold increase in the tool traverse speed from 50 to 100 mm/min (at ω = 400 rpm) decreased the size of grains in the same area from 1.6 ± 1.1 μm (Figure 4a) to 1.0± 0.6 μm. The average grain size in area #2 was found to be noticeably greater in comparison with that in area #1 (Figure 4a,b,d,e), which could be caused by higher temperatures at the surface of the weld [30]. Grains can contain annealing twins; their fraction tended to increase with an increase in the ω value (and, correspondingly, higher temperatures in the weld center). Specifically, the fractions of twin boundaries gradually change from 4.3% or 3.1% after FSW at 400-50 or 400-100, respectively, to 9.3% after FSW at 1000-100.
The observed changes in crystallographic texture were found to be rather typical for the FSW of fcc alloys [35,36]. In both zones #1 and #2, a texture close to {111} 〈112〉 was formed Figure 4a,b,d,e. It should be mentioned that plastic flow in the near-surface areas was caused by the tool shoulder, whereas in area #1 the texture was associated with the pin [36]. It should be noted that the welding parameters did not significantly influence the type of texture.
In the #3 area, the microstructure is usually bi-modal due to the presence of two zones: SZ with smaller grains and the HAZ with coarser grains (Figure 4c,f). The texture of the third zone can be ascribed to the {111} 〈112〉 orientation that is usually observed in fcc alloys after FSW [35,36]. A pronounced metallographic texture in HAZ (Figure 4f) should also be noted after FSW, with a relatively low tool rotation rate (400 rpm) and a high tool traverse speed (100 mm/min), most likely due to insufficiently high temperatures in HAZ, causing incomplete recrystallization.
The density of GNDs (Table 2) tended to decrease with increasing temperature caused by more intensive tool rotation. However, all obtained data fell in a relatively narrow interval (less than an order of magnitude), suggesting a relatively weak influence of this parameter on mechanical properties.
FSW did not result in noticeable changes in the phase composition of the alloy. Based on EBSD analysis, the fraction of the hcp phase in areas #1–3 was found to be 0.2–5% (Figure 4, Table 2). No systematic correlations between the welding conditions and the hcp fraction were found. It should also be noted that only the fcc phase can be recognized with the XRD patterns (Figure 5), most likely because of a low fraction of the hcp phase. Meanwhile, the estimated lattice parameter of the fcc phase increased from 3.609 nm in the initial condition to 3.613–3.614 nm after FSW, which can be associated with the dissolution of the carbide particles and more pronounced partitioning of carbon to the fcc phase.
Indeed, TEM examination (Figure 6) shows a decrease in the fraction of the M23C6 carbides (shown by arrows in Figure 6) after welding to ~1–2%, in comparison with ~4% in the initial condition. A more pronounced reduction in the volume fraction of the carbides is most likely caused by an increased tool rotation rate or decreased tool traverse speed (due to which the SZ temperature raised and caused the dissolution of the carbides). The average size of the carbides was found to be 370 nm without obvious bimodal distribution.
TEM examination also showed the dependence of the grain structure in the SZ on welding parameters (Figure 6). At the lowest value of ω = 400 rpm, small grains with high dislocation density form at both tool traverse speeds (50 or 100 mm/min) (Figure 6a,b). The higher temperature in zone #2 due to higher tool rotation rates resulted in larger grains with lower dislocation density (Figure 6c,d) [33] and suggested a more intensive development of recovery and/or recrystallization processes.
The profiles of the microhardness distribution across the welds (Figure 7a) indicated higher hardness of the SZ in comparison with that of the base material for all examined parameters of FSW. The maximum value of hardness (~300 HV) was obtained in the 400-100 specimen. After FSW at ω = 600–1000 rpm (the tool traverse speed was 100 mm/min in all these cases), the microhardness values were ~230 HV. For comparison, the microhardness of the base material was 210 HV.
The results of tensile tests did not show a noticeable increase in strength (both yield stress (YS) or ultimate tensile strength (UTS)) of the transversal specimens in comparison with that of the base material (Figure 7b, Table 3). Since the welds with all parameters of FSW had higher hardness, plastic flow localized in the base martial and each curve almost reproduced each other, being similar to the curve of the base material (Figure 7b). However, due to the presence of hard “inserts” into the gages (and, therefore shortening of the operating volume), the ductility of the transversal specimens was found to be considerably lower. A similar phenomenon in the case of stronger stir zones was observed earlier in [28]. Besides, some negative contribution to the ductility decrease can be associated with defects formed during FSW (see, for example, Figure 3c).
Meanwhile the longitudinal specimens showed some difference in the mechanical behavior as a function of the FSW parameters (Table 3, Figure 7c). In the initial condition, the longitudinal specimen of the alloy had a relatively low value of YS (360 MPa). However, due to a high strain hardening rate (~2000 MPa), the alloy in the initial condition demonstrated very good ductility of 70% and a high value of UTS (870 MPa). The strength of the longitudinal specimens increased after FSW in agreement with the results of microhardness measurement. The maximum yield stress of 610 MPa was obtained in the 400-100 specimens. However, because of the limited ductility of this specimen (TE = 25%), the maximum attained UTS value was only 885 MPa. The 400-50 specimen showed the best combination of strength (UTS = 962 MPa) and ductility (TE = 60%). All other specimens demonstrated mechanical behavior quite similar to that of the initial condition, with some trend, however, of decreased ductility from 68% after FSW at 600 rpm to 32% at 1000 rpm (ν was 100 mm/min in both cases). An extended stage, during which the strain-hardening rate of some most ductile specimens was rather stable, should also be noted, thereby suggesting the operation of a single predominant strengthening mechanism (Figure 7d). Togaint insight into the structure evolution of this material during deformation, deformed specimens were examined.
EBSD analysis of the microstructure of the tensioned longitudinal 400-50 specimen (in an area close to fracture) suggested the formation of a large volume fraction (67%) of the ε martensite during deformation (Figure 8a). Similarly, the TEM image shows the formation of a lamellar-type microstructure in 400-50 (Figure 8b) specimen, obviously due to the deformation-induced martensitic γ → ε transformation (insert in Figure 8b). Note that preliminary assessment of surface morphology has revealed the occurrence of martensitic transformation in specimens welded with all examined conditions.

4. Discussion

One of the main effects of FSW (or, similarly, FSP) is usually associated with dynamic recrystallization of the SZ microstructure [30]. The observed microstructure refinement, in our case, also suggested the development of dynamic recrystallization (the exact mechanism of dynamic recrystallization requires additional investigations, which is out of the scope of the present study). Due to rather a fine-grained initial structure (d = 7 μm) microstructure refinement in our case was not very prominent; however, the obtained grain sizes in SZ fell in the ~1–5 μm interval depending on the FSW parameters (Table 2, Figure 4).
Meanwhile, even this relatively small decrease in grain size resulted in some increase in microhardness of the welds (Figure 7a) due to the static Hall–Petch effect. Indeed, the Hall–Petch relation plotted for the longitudinal specimens cut from the welds obtained by FSW at different parameters shows a rather obvious linear dependence of the yield strength on grain size, with σ0 = 182 MPa and Ky = 521 MPa/μm−1/2 (Figure 9). The found values are quite compatible with those reported earlier for a TRIP Fe40Mn10Co20Cr20Ni10 alloy (σ0 = 139 MPa, Ky = 504 MPa/μm−1/2) [37]. However, similar values were also obtained for the equiatomic CoCrFeMnNi alloy with a stable fcc phase (σ0 = 182 MPa, Ky = 521 MPa/μm−1/2) [38]. The latter can suggest that yielding in the TRIP alloys (Fe49Mn30Co10Cr10C1 and Fe40Mn10Co20Cr20Ni10) is most likely controlled by dislocation motion in the fcc matrix (like that in the CoCrFeMnNi alloy) rather than by the martensitic transformation. Meanwhile, a somewhat higher friction stress in the program Fe49Mn30Co10Cr10C1 alloy can be attributed to the presence of carbon, which efficiently increases strength due to both interstitial solid solution strengthening and precipitation strengthening by carbide particles (Figure 6) [6,8]. The interstitial solid solution hardening depends on the amount of carbon dissolved in the fcc matrix, which is difficult to measure experimentally. However, this amount can be estimated from the known carbides fraction, which varies from ~4% in the initial condition to ~1–2% after FSW. According to the equilibrium phase diagram produced by the Thermo-Calc software, 1% of carbides corresponds to ~0.8 at.% of C in the solid solution. The solid-solution-strengthening effect of carbon in similar Fe40Mn40Cr10Co10 was estimated to be 62 MPa/at.%C [39]. Thus, the upper bond estimate of the interstitial solid solution hardening in the program Fe49Mn30Co10Cr10C1 alloy is 50 MPa.
The contribution of the carbide particles to the overall strength was evaluated to be low (less than 5 MPa), as per the Orowan theory: σOr = (0.538 G b f1/2/d) ln (d/2b), where, b = 2.58 × 10⁻¹⁰ m−10 is the Burgers vector, G = 80 GPa is the shear modulus (both values were taken for the equiatomic CoCrFeMnNi alloy [40]), f and d are the fraction and size of carbides, respectively. Therefore, interstitial solid-solution hardening and precipitation hardening due to the presence of carbon can give an additional ~50 MPa. Indeed, the program alloy in the initial condition shows a ~100 MPa higher yield strength (Table 3) in comparison with ~300 MPa reported for the carbon-free Fe50Mn30Co10Cr10 alloy [14] with almost the same grain size (6.5 μm). However, the grain boundary strengthening appears to be the major strengthening mechanism in the program alloy after FSW, which agrees well with some recent results on carbon-doped fine-grained fcc HEAs [8,41].
The development of the fcc γ to hcp ε martensite transformation becomes pronounced at later stages of deformation [13], maintaining a rather high strain-hardening rate (Figure 7d. Due to the TRIP effect and corresponding dynamic Hall–Petch strengthening, the alloy attained a rather high ultimate tensile strength (up to 960 MPa) and substantial total elongation (80% in the initial condition and 68% after 600-100 FSW, Figure 6c and Table 3). Deformation-induced martensitic transformation in similar alloys was also observed earlier in [13,42]. At the same time, the carbon-free Fe50Mn30Co10Cr10 alloy [13] demonstrated a noticeably higher ultimate tensile strength (1400 MPa) but a lower value of elongation (45%). This difference can be caused by a higher amount of the ε phase that forms during deformation: 79% vs. 67% in our case.
It is worth noting that both these results were obtained for specimens either after FSP [13] or FSW (the present case). Due to a considerable increase in temperature caused by severe plastic deformation during FSP or FSW, the fraction of the martensitic phase in SZ was rather low (5–10%). A greater starting amount of the γ phase can result in a more pronounced TRIP effect. Meanwhile, the observed difference in the percentage of the ε martensite after tensile tests can also be associated with the presence of carbon in the structure. Since FSW results in some changes in the phase composition of the program alloy (namely, dissolution of the carbides), carbon partitions into the fcc phase.
The latter can result in increased stability of the fcc phase and lower inclination of the alloy to the TRIP effect. Generally, the (in) stability of the fcc phase can be estimated using the ΔGfcc-hcp value, i.e., the difference in the free energies between the fcc and hcp phases. To estimate the effect of carbon concentration on the fcc phase stability, the ThermoCalc software (Thermo-Calc Software, Stockholm, Sweden) was used to calculate the ΔGfcc-hcp values for different Fe50−xMn30Co10Cr10Cx alloys. The obtained results are listed in Table 4. The presented values demonstrate that (i) even a small addition of carbon (0.1 at.%) significantly increases the stability of the fcc phase due to an increase in the ΔGfcc-hcp value from 0.1 kJ/mole for the Fe50Mn30Co10Cr10 alloy to 0.39 kJ/mole and (ii) a further increase in carbon content results in some increase in the ΔGfcc-hcp value to 0.47 kJ/mole in the alloy with 1.0 at.% C. The obtained results clearly show that the amount of the soluted carbon affects the stability of the fcc phase; the dissolution of carbides during FSW can potentially be the reason for the lower work-hardening capacity of the program alloy (Figure 7d) due to partial suppression of the martensitic transformation.
It should be noted however, that in the carbon-doped CoCrFeMnNi HEA [28] some increase in the fraction of carbide particles due to FSW was reported. The observed differences can be attributed to variations in the solvus temperature of the carbide: 1225 °C in the carbon-doped CoCrFeMnNi alloy [43] and 1150 °C in the program alloy (estimated by the ThermoCalc software).
From the technological point of view, more promising parameters of FSW are associated with rather low tool rotation rates of 400–600 rpm and tool traverse speeds of 50–100 rpm mm/min. These parameters resulted in more attractive properties of the welds (Table 3) and, simultaneously, in lower wear of the tool (Figure 3b,c).

5. Conclusions

The effect of friction stir welding parameters on the structure and properties of Fe49Mn30Cr10Co10C1 high-entropy alloy welds was studied. The following conclusions were drawn:
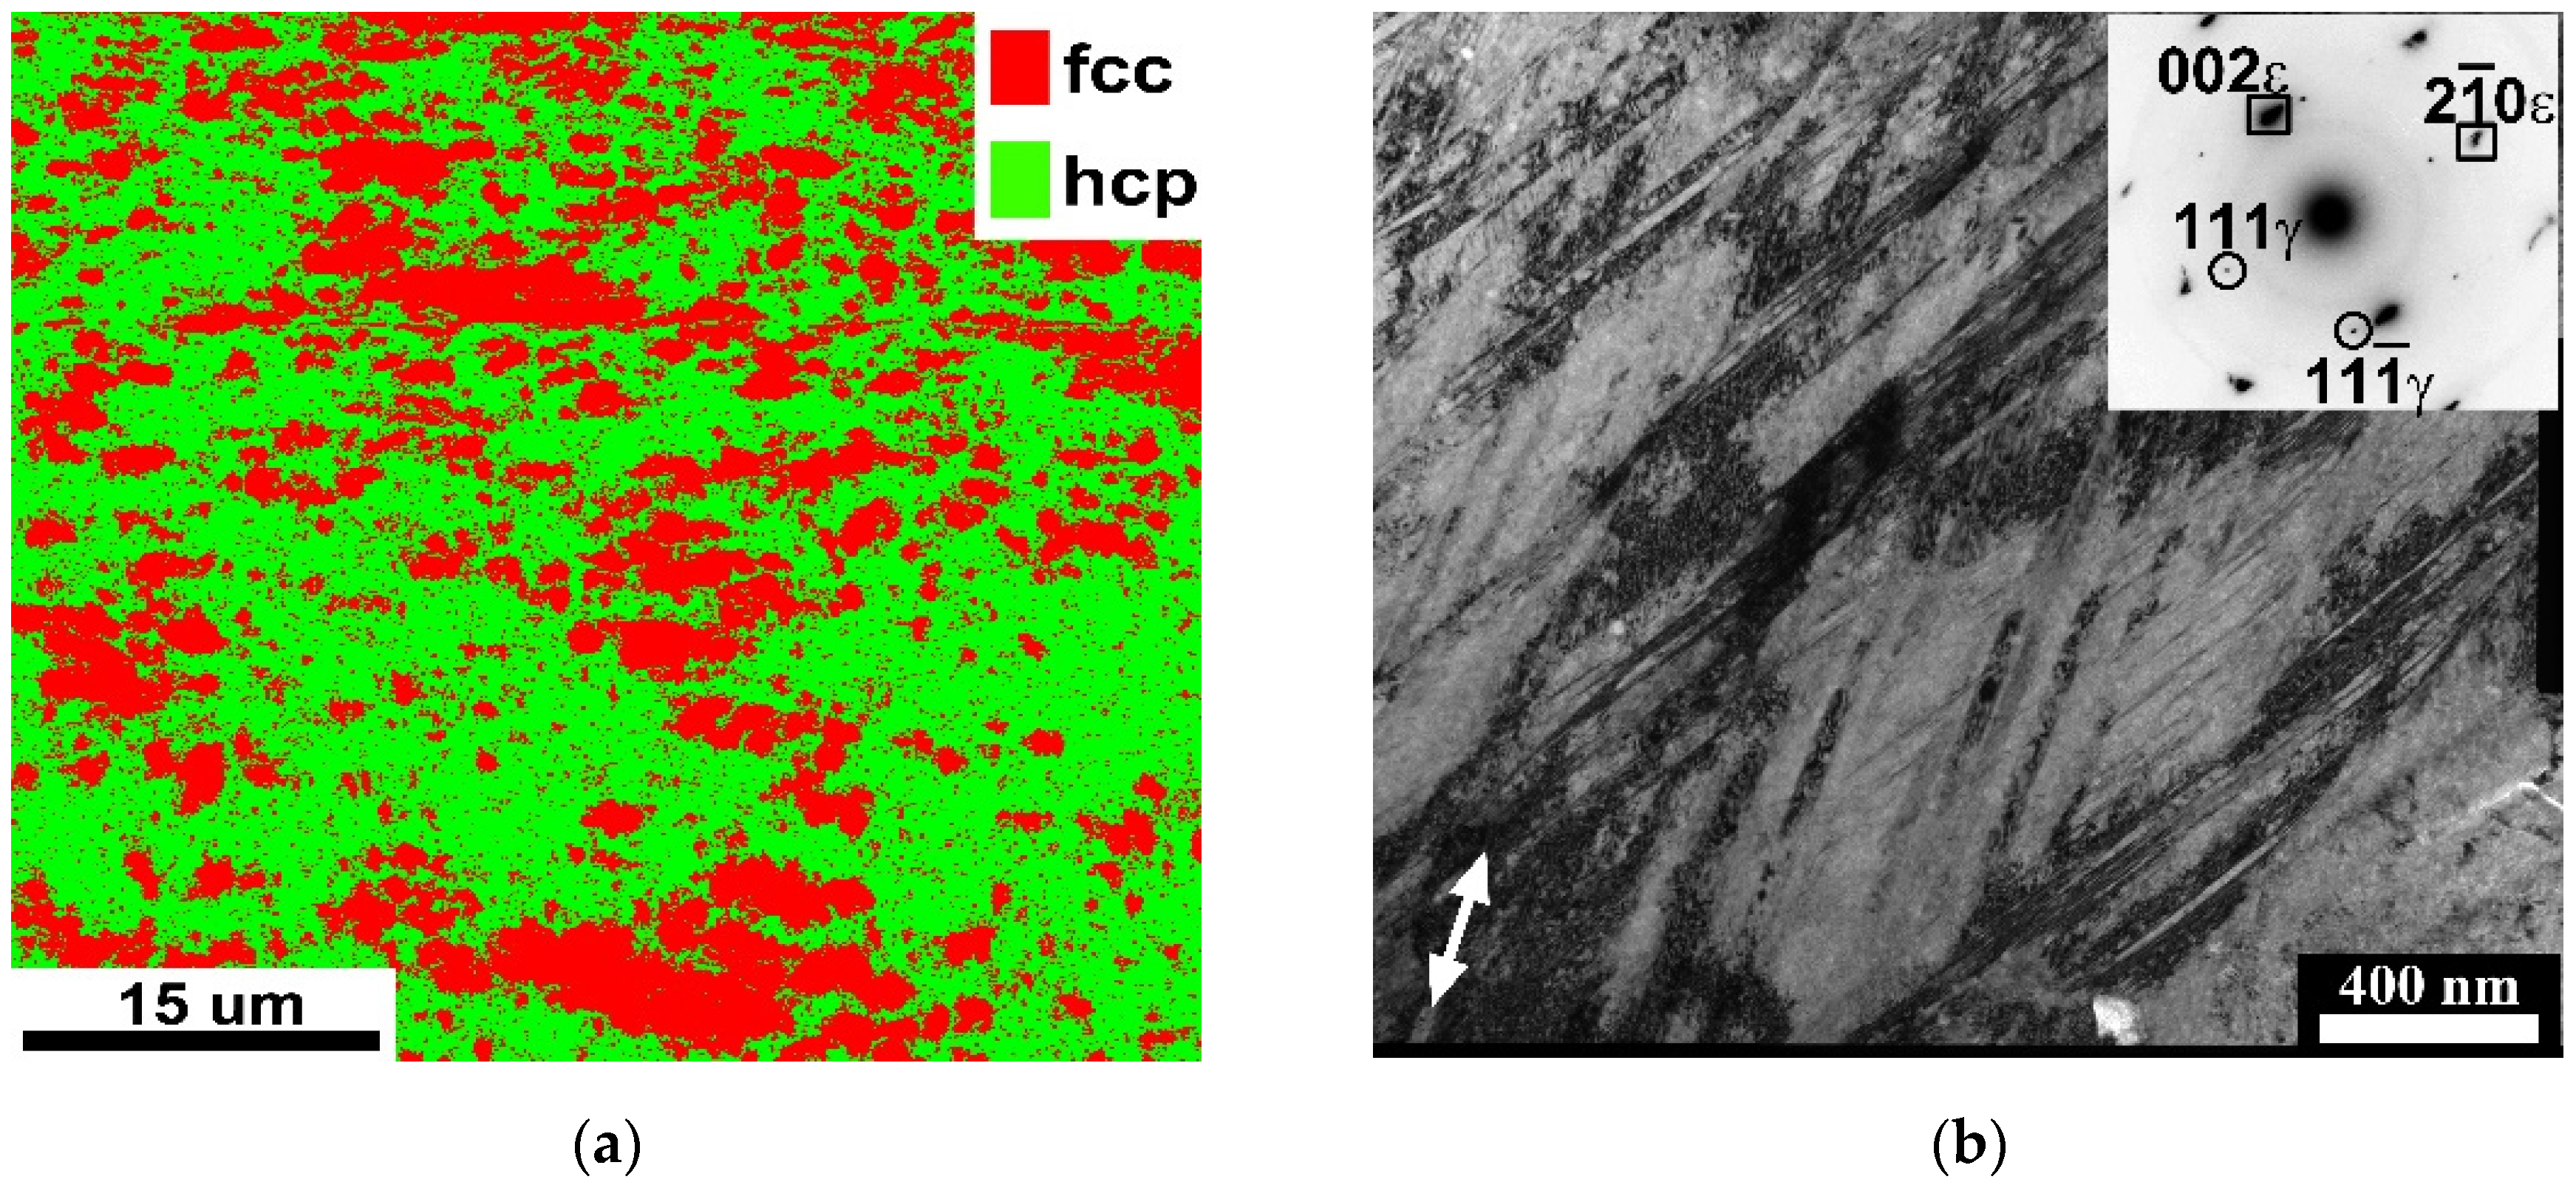
  • In the initial condition, the alloy had a recrystallized microstructure consisted mainly of the fcc γ phase, with a grain size of ~7 μm. The fractions of the ε phase and M23C6 carbides were ~5% and ~4%, respectively;
  • Sound joints were obtained with all studied parameters of welding. FSW slightly decreased the fraction of the carbides to 1–2%, while the ɛ phase percentage remained at the same level. The grain size of the γ phase in the stir zone decreased to ~1–5 μm depending on the welding parameters;
  • Due to a smaller grain size, the microhardness of the welds was higher than that of the base material; this increase in strength can be explained by static Hall–Petch strengthening with σ0 = 182 MPa and Ky = 521 MPa/μm−1/2. The highest value in both the microhardness and yield stress was obtained after FSW at the tool rotation speed of 400 rpm and the tool traverse speed of 100 mm/min. An increase in the tool rotation speed resulted in an increase in grain size and a decrease in the yield strength. A decrease in the tool traverse speed from 100 to 50 mm/min resulted in some decrease in both yield strength and microhardness;
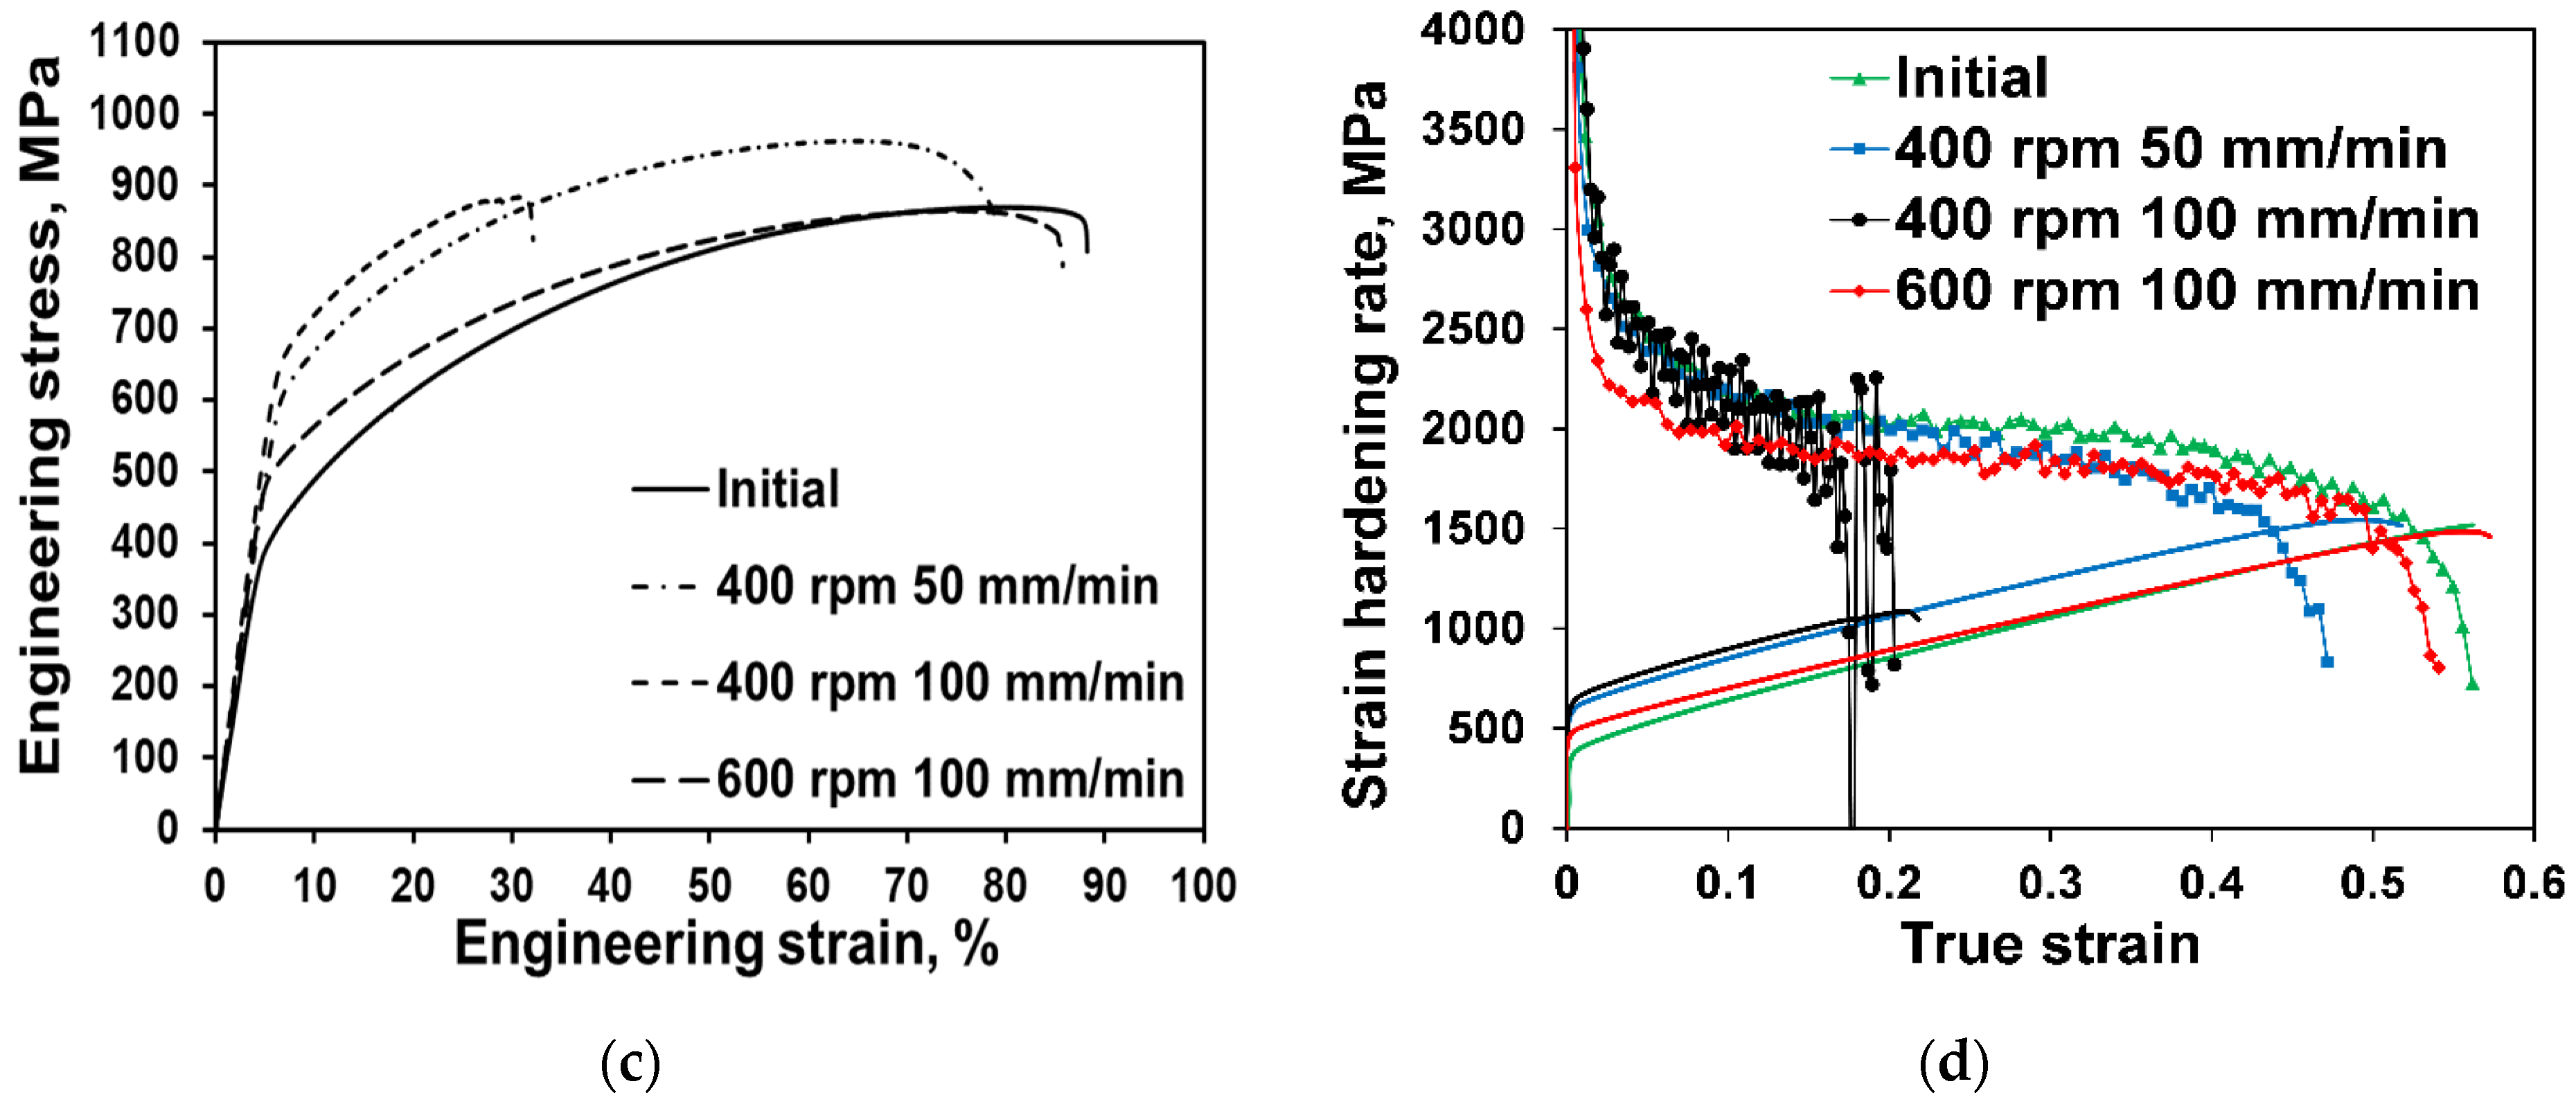
  • The fcc γ to hcp ɛ martensitic transformation developed during a tensile test at room temperature, resulting in high values of both ultimate tensile strength and total elongation in all cases. For example, the tool rotation speed of 400 rpm and tool traverse speed of 100 mm/min resulted in the UTS and TE values of 962 MPa and 60%, respectively. The volume fraction of the ɛ martensite in this specimen after tensile testing was found to be 67%. The efficiency of the TRIP effect can be decreased due to the presence of carbon, which increases the stability of the γ phase.

Author Contributions

S.Z. and N.S. conceived and designed the experiments. D.S. and K.R. performed the experiments. N.S. and S.Z. analyzed the data and wrote the paper. All authors have read and agreed to the published version of the manuscript.

Funding

This study was supported by Russian Science Foundation (grant no. 20-79-10093).

Institutional Review Board Statement

Not applicable.

Informed Consent Statement

Not applicable.

Data Availability Statement

The data presented in this study are available on request from the corresponding author. The data are not publicly available because it is a part of an ongoing study.

Acknowledgments

The authors are grateful to the personnel of the Joint Research Center, “Technology and Materials”, Belgorod State National Research University, for their assistance with the instrumental analysis.

Conflicts of Interest

The authors declare no conflict of interest.

References

  1. Miracle, D.B.; Senkov, O.N. A critical review of high entropy alloys and related concepts. Acta Mater. 2017, 122, 448–511. [Google Scholar] [CrossRef] [Green Version]
  2. Cantor, B.; Chang, I.T.H.; Knight, P.; Vincent, A.J.B. Microstructural development in equiatomic multicomponent alloys. Mater. Sci. Eng. A 2004, 375–377, 213–218. [Google Scholar] [CrossRef]
  3. Yeh, J.W.; Chen, S.K.; Lin, S.J.; Gan, J.Y.; Chin, T.S.; Shun, T.T.; Tsau, C.H.; Chang, S.Y. Nanostructured high-entropy alloys with multiple principal elements: Novel alloy design concepts and outcomes. Adv. Eng. Mater. 2004, 6, 299–303. [Google Scholar] [CrossRef]
  4. George, E.P.; Raabe, D.; Ritchie, R.O. High-entropy alloys. Nat. Rev. Mater. 2019, 4, 515–534. [Google Scholar] [CrossRef]
  5. Otto, F.; Yang, Y.; Bei, H.; George, E.P. Relative effects of enthalpy and entropy on the phase stability of equiatomic high-entropy alloys. Acta Mater. 2013, 61, 2628–2638. [Google Scholar] [CrossRef] [Green Version]
  6. Klimova, M.V.; Semenyuk, A.O.; Shaysultanov, D.G.; Salishchev, G.A.; Zherebtsov, S.V.; Stepanov, N.D. Effect of carbon on cryogenic tensile behavior of CoCrFeMnNi-type high entropy alloys. J. Alloys Compd. 2019, 811, 152000. [Google Scholar] [CrossRef]
  7. Klimova, M.; Shaysultanov, D.; Semenyuk, A.; Zherebtsov, S.; Salishchev, G.; Stepanov, N. Effect of nitrogen on mechanical properties of CoCrFeMnNi high entropy alloy at room and cryogenic temperatures. J. Alloys Compd. 2020, 849, 156633. [Google Scholar] [CrossRef]
  8. Klimova, M.; Shaysultanov, D.; Semenyuk, A.; Zherebtsov, S.; Stepanov, N. Effect of carbon on recrystallised microstructures and properties of CoCrFeMnNi-type high-entropy alloys. J. Alloys Compd. 2021, 851, 156839. [Google Scholar] [CrossRef]
  9. Aguilar-Hurtado, J.Y.; Vargas-Uscategui, A.; Zambrano-Mera, D.; Palma-Hillerns, R. The effect of boron content on the microstructure and mechanical properties of Fe 50-X Mn 30 Co 10 Cr 10 B X (x = 0, 0.3, 0.6 and 1.7 wt%) multi-component alloys prepared by arc-melting. Mater. Sci. Eng. A 2019, 748, 244–252. [Google Scholar] [CrossRef]
  10. Zhang, W.; Yan, D.; Lu, W.; Li, Z. Carbon and nitrogen co-doping enhances phase stability and mechanical properties of a metastable high-entropy alloy. J. Alloys Compd. 2020, 831, 154799. [Google Scholar] [CrossRef]
  11. Zhu, S.; Yan, D.; Gan, K.; Lu, W.; Li, Z. Awakening the metastability of an interstitial high entropy alloy via severe deformation. Scr. Mater. 2021, 191, 96–100. [Google Scholar] [CrossRef]
  12. Liu, K.; Nene, S.S.; Frank, M.; Sinha, S.; Mishra, R.S. Metastability-assisted fatigue behavior in a friction stir processed dual-phase high entropy alloy. Mater. Res. Lett. 2018, 6, 613–619. [Google Scholar] [CrossRef] [Green Version]
  13. Li, Z.; Tasan, C.C.; Springer, H.; Gault, B.; Raabe, D. Interstitial atoms enable joint twinning and transformation induced plasticity in strong and ductile high-entropy alloys. Sci. Rep. 2017, 7, 40704. [Google Scholar] [CrossRef] [PubMed]
  14. Li, Z.; Pradeep, K.G.; Deng, Y.; Raabe, D.; Tasan, C.C. Metastable high-entropy dual-phase alloys overcome the strength-ductility trade-off. Nature 2016, 534, 227–230. [Google Scholar] [CrossRef] [PubMed]
  15. Li, Z.; Raabe, D. Strong and Ductile Non-equiatomic High-Entropy Alloys: Design, Processing, Microstructure, and Mechanical Properties. Jom 2017, 69, 2099–2106. [Google Scholar] [CrossRef]
  16. Nene, S.S.; Liu, K.; Frank, M.; Mishra, R.S.; Brennan, R.E.; Cho, K.C.; Li, Z.; Raabe, D. Enhanced strength and ductility in a friction stir processing engineered dual phase high entropy alloy. Sci. Rep. 2017, 7, 16167. [Google Scholar] [CrossRef]
  17. Li, Z.; Tasan, C.C.; Pradeep, K.G.; Raabe, D. A TRIP-assisted dual-phase high-entropy alloy: Grain size and phase fraction effects on deformation behavior. Acta Mater. 2017, 131, 323–335. [Google Scholar] [CrossRef]
  18. Basu, S.; Li, Z.; Pradeep, K.G.; Raabe, D. Strain rate sensitivity of a TRIP-assisted dual-phase high-entropy alloy. Front. Mater. 2018, 5, 1–10. [Google Scholar] [CrossRef]
  19. Lu, W.; Liebscher, C.H.; Dehm, G.; Raabe, D.; Li, Z. Bidirectional Transformation Enables Hierarchical Nanolaminate Dual-Phase High-Entropy Alloys. Adv. Mater. 2018, 30, 1804727. [Google Scholar] [CrossRef]
  20. He, Z.F.; Jia, N.; Wang, H.W.; Liu, Y.; Li, D.Y.; Shen, Y.F. The effect of strain rate on mechanical properties and microstructure of a metastable FeMnCoCr high entropy alloy. Mater. Sci. Eng. A 2020, 776, 138982. [Google Scholar] [CrossRef]
  21. Li, Z.; Raabe, D. Influence of compositional inhomogeneity on mechanical behavior of an interstitial dual-phase high-entropy alloy. Mater. Chem. Phys. 2018, 210, 29–36. [Google Scholar] [CrossRef]
  22. Su, J.; Raabe, D.; Li, Z. Hierarchical microstructure design to tune the mechanical behavior of an interstitial TRIP-TWIP high-entropy alloy. Acta Mater. 2019, 163, 40–54. [Google Scholar] [CrossRef]
  23. Park, S.; Nam, H.; Na, Y.; Kim, H.; Moon, Y.; Kang, N. Effect of Initial Grain Size on Friction Stir Weldability for Rolled and Cast CoCrFeMnNi High-Entropy Alloys. Met. Mater. Int. 2020, 26, 641–649. [Google Scholar] [CrossRef]
  24. Park, S.; Nam, H.; Park, J.; Na, Y.; Kim, H.; Kang, N. Superior-tensile property of CoCrFeMnNi alloys achieved using friction-stir welding for cryogenic applications. Mater. Sci. Eng. A 2020, 788, 139547. [Google Scholar] [CrossRef]
  25. Filho, F.C.G.; Monteiro, S.N. Welding joints in high entropy alloys: A short-review on recent trends. Materials 2020, 13, 1411. [Google Scholar] [CrossRef] [Green Version]
  26. Lopes, J.G.; Oliveira, J.P. A short review on welding and joining of high entropy alloys. Metals 2020, 10, 212. [Google Scholar] [CrossRef] [Green Version]
  27. Qin, X.; Xu, Y.; Sun, Y.; Fujii, H.; Zhu, Z.; Shek, C.H. Effect of process parameters on microstructure and mechanical properties of friction stir welded CoCrFeNi high entropy alloy. Mater. Sci. Eng. A 2020, 782, 139277. [Google Scholar] [CrossRef]
  28. Shaysultanov, D.; Stepanov, N.; Malopheyev, S.; Vysotskiy, I.; Sanin, V.; Mironov, S.; Kaibyshev, R.; Salishchev, G.; Zherebtsov, S. Friction stir welding of a carbon-doped CoCrFeNiMn high-entropy alloy. Mater. Charact. 2018, 145, 353–361. [Google Scholar] [CrossRef] [Green Version]
  29. Shaysultanov, D.G.; Stepanov, N.D.; Vysotskiy, I.V.; Zherebtsov, S.V. Effect of friction stir welding on the structure and mechanical properties of the CoCrFeNiMn-0.9%C alloy. In AIP Conference Proceedings; AIP Publishing LLC.: Melville, NY, USA, 2019; Volume 2167, p. 4. [Google Scholar] [CrossRef]
  30. Mishra, R.S.; Ma, Z.Y. Friction stir welding and processing. Mater. Sci. Eng. R Rep. 2005, 50, 1–78. [Google Scholar] [CrossRef]
  31. Zhilyaev, A.P.; Shakhova, I.; Belyakov, A.; Kaibyshev, R.; Langdon, T.G. Wear resistance and electroconductivity in copper processed by severe plastic deformation. Wear 2013, 305, 89–99. [Google Scholar] [CrossRef]
  32. Zhu, Z.G.; Sun, Y.F.; Ng, F.L.; Goh, M.H.; Liaw, P.K.; Fujii, H.; Nguyen, Q.B.; Xu, Y.; Shek, C.H.; Nai, S.M.L.; et al. Friction-stir welding of a ductile high entropy alloy: Microstructural evolution and weld strength. Mater. Sci. Eng. A 2018, 711, 524–532. [Google Scholar] [CrossRef]
  33. Song, K.H.; Fujii, H.; Nakata, K. Effect of welding speed on microstructural and mechanical properties of friction stir welded Inconel 600. Mater. Des. 2009, 30, 3972–3978. [Google Scholar] [CrossRef]
  34. Zhu, Z.G.; Sun, Y.F.; Goh, M.H.; Ng, F.L.; Nguyen, Q.B.; Fujii, H.; Nai, S.M.L.; Wei, J.; Shek, C.H. Friction stir welding of a CoCrFeNiAl0.3 high entropy alloy. Mater. Lett. 2017, 205, 142–144. [Google Scholar] [CrossRef]
  35. Fonda, R.W.; Knipling, K.E. Texture development in friction stir welds. Sci. Technol. Weld. Join. 2011, 16, 288–294. [Google Scholar] [CrossRef]
  36. Mironov, S.; Sato, Y.S.; Kokawa, H.; Inoue, H.; Tsuge, S. Structural response of superaustenitic stainless steel to friction stir welding. Acta Mater. 2011, 59, 5472–5481. [Google Scholar] [CrossRef]
  37. Yang, Z.; Yan, D.; Lu, W.; Li, Z. A TWIP-TRIP quinary high-entropy alloy: Tuning phase stability and microstructure for enhanced mechanical properties. Mater. Sci. Eng. A 2021, 801, 140441. [Google Scholar] [CrossRef]
  38. Otto, F.; Dlouhý, A.; Somsen, C.; Bei, H.; Eggeler, G.; George, E.P. The influences of temperature and microstructure on the tensile properties of a CoCrFeMnNi high-entropy alloy. Acta Mater. 2013, 61, 5743–5755. [Google Scholar] [CrossRef] [Green Version]
  39. Chen, L.B.; Wei, R.; Tang, K.; Zhang, J.; Jiang, F.; He, L.; Sun, J. Heavy carbon alloyed FCC-structured high entropy alloy with excellent combination of strength and ductility. Mater. Sci. Eng. A 2018, 716, 150–156. [Google Scholar] [CrossRef]
  40. Wu, Z.; Bei, H.; Pharr, G.M.; George, E.P. Temperature dependence of the mechanical properties of equiatomic solid solution alloys with face-centered cubic crystal structures. Acta Mater. 2014, 81, 428–441. [Google Scholar] [CrossRef]
  41. Klimova, M.V.; Shaysultanov, D.G.; Chernichenko, R.S.; Sanin, V.N.; Stepanov, N.D.; Zherebtsov, S.V.; Belyakov, A.N. Recrystallized microstructures and mechanical properties of a C-containing CoCrFeNiMn-type high-entropy alloy. Mater. Sci. Eng. A 2019, 740–741. [Google Scholar] [CrossRef] [Green Version]
  42. Chen, L.B.; Wei, R.; Tang, K.; Zhang, J.; Jiang, F.; Sun, J. Ductile-brittle transition of carbon alloyed Fe40Mn40Co10Cr10 high entropy alloys. Mater. Lett. 2019, 236, 416–419. [Google Scholar] [CrossRef]
  43. Kashaev, N.; Ventzke, V.; Stepanov, N.; Shaysultanov, D.; Sanin, V.; Zherebtsov, S. Laser beam welding of a CoCrFeNiMn-type high entropy alloy produced by self-propagating high-temperature synthesis. Intermetallics 2018, 96, 63–71. [Google Scholar] [CrossRef]
Figure 1. Scheme of cutting the tensile specimens.
Metals 11 00066 g001
Figure 2. Inverse pole figure (IPF) electron back-scattered diffraction (EBSD) map (a), phase map (b), and bright field TEM image (c) of the initial microstructure of the Fe49Mn30Cr10Co10C1 alloy; selected area diffraction patterns taken from the fcc phase (1) and M23C6 carbides (2) are shown in (c). {111} pole figure is inserted in (a); the color scale is valid for all pole figures hereafter.
Metals 11 00066 g002
Figure 3. Cross-section of the weld in the 400-50 specimen (a); imperfections of the 600-100 (b) or 1000-100 (c) specimens in the area which approximately corresponded to the box #3 in (a). #1 box was located 0.3 mm below the upper surface of the specimen, and #2 box was located 1.3 mm below.
Metals 11 00066 g003
Figure 4. IPF EBSD maps and phase maps of #1 (a,d), #2 (b,e) and #3 (c,f) areas (see Figure 2) of the Fe49Mn30Co10Cr10C1 alloy after FSW: (ac) 400-50; (df) 1000-100.
Metals 11 00066 g004
Figure 5. XRD patterns of the stir zone after various parameters of FSW.
Metals 11 00066 g005
Figure 6. Bright-field TEM images of the stir zone obtained in the following specimens: (a) 400-50; (b) 400-100; (c,d) 600-100. Selected area diffraction patterns taken from a M23C6 carbide is inserted in (d).
Metals 11 00066 g006aMetals 11 00066 g006b
Figure 7. Mechanical properties of welds in the Fe49Mn30Co10Cr10C1 alloy produced by FSW at various parameters: microhardness profiles across the welds (a); engineering stress–engineering strain curves of the transversal (b) and longitudinal specimens (c) and strain hardening rate of the longitudinal specimens (d).
Metals 11 00066 g007aMetals 11 00066 g007b
Figure 8. EBSD phase map (a), and bright-field TEM image (b) of the Fe49Mn30Co10Cr10C1 alloy longitudinal 400-50 specimen tensioned to fracture. Selected area diffraction pattern indicating the presence of both γ and ε phases is inserted in (b). The applied load direction is indicated with the arrow in Figure 8b.
Metals 11 00066 g008
Figure 9. Hall–Petch relation of the yield strength (YS) on grain size in the Fe49Mn30Co10Cr10C1 alloy.
Metals 11 00066 g009
Table 1. Welding parameters and designations of the studied specimens.
Designationω, rpmν, mm/min
400-5040050
400-100400100
600-100600100
800-100800100
1000-1001000100
Table 2. Average grain sizes, hcp phase fraction, and GND density in areas #1–3 in Figure 3a for different parameters of FSW. The data for the initial alloy is shown for the comparison. In area #3, the size of coarse/fine grains is shown before/after slash symbol, respectively.
Specimen
Area #Structure parameter400-50400-100600-100800-1001000-100Initial
1d, µm1.6 ± 1.21.0 ± 0.62.3 ± 1.92.3 ± 1.02.0 ± 1.9d, µm7.0 ± 3.2
hcp fraction, %0.15.00.20.30.3hcp fraction, %4.9
GND density, ×1014 m27.686.075.75.03.94GND density, ×1014 m21.72
2d, µm2.3 ± 2.01.8 ± 1.54.9 ± 3.84.3 ± 3.55.4 ± 4.3-
hcp fraction, %0.23.00.20.20.2
GND density, ×1014 m27.723.714.733.12.4
3d, µm4.7 ± 3.7/1.7 ± 1.12.3 ± 1.6/1.0 ± 0.63.4 ± 2.3/1.2 ± 0.93.9 ± 3.0/1.5 ± 1.04.4 ± 4.1/1.9 ± 1.3
hcp fraction, %0.51.50.30.22.0
GND density, ×1014 m27.675.126.714.02.37
Table 4. ΔGfcc-hcp values obtained for the Fe50−xMn30Co10Cr10Cx (x = 0–1 at.%) high entropy alloys using the ThermoCalc software.
Carbon content, at.%00.10.20.30.40.50.60.70.80.91.0
ΔGfcc-hcp, kJ/mole0.10.390.40.40.410.420.420.430.440.450.47
Table 3. Mechanical properties of FSW welds in the Fe49Mn30Co10Cr10C1 alloy obtained using transversal or longitudinal specimens.
Condition:ω-νYS 1, MPaUTS 2, MPaTE 3, %
Transversalspecimens
Initial 385 ± 5874 ± 1781
400-50 390 ± 5879 ± 1731
400-100 385 ± 5706 ± 1312
600-100 390 ± 5809 ± 1525
800-100 388 ± 5818 ± 1630
1000-100 385 ± 5625 ± 1211
Longitudinal specimens
Initial360 ± 5870 ± 1770
400-50 565 ± 8962 ± 1860
400-100 610 ± 9884 ± 1725
600-100 465 ± 7865 ± 1668
800-100 480 ± 7785 ± 1535
1000-100 475 ± 7767 ± 1532
1 YS—yield stress, 2 UTS—ultimate tensile stress, 3 TE—total elongation.
Publisher’s Note: MDPI stays neutral with regard to jurisdictional claims in published maps and institutional affiliations.

