Abstract
Intercritically deformed steels present combinations of different types of ferrite, such as deformed ferrite (DF) and non-deformed ferrite (NDF) grains, which are transformed during the final deformation passes and final cooling step. Recently, a grain identification and correlation technique based on EBSD has been employed together with a discretization methodology, enabling a distinction to be drawn between different ferrite populations (NDF and DF grains). This paper presents a combination of interrupted tensile tests with crystallographic characterization performed by means of Electron Backscatter Diffraction (EBSD), by analyzing the evolution of an intercritically deformed micro-alloyed steel. In addition to this, and using the nanoindentation technique, both ferrite families were characterized micromechanically and the nanohardness was quantified for each population. NDF grains are softer than DF ones, which is related to the presence of a lower fraction of low-angle grain boundaries. The interrupted tensile tests show the different behavior of low- and high-angle grain boundary evolution as well as the strain partitioning in each ferrite family. NDF population accommodates most of the deformation at initial strain intervals, since strain reaches 10%. For higher strains, NDF and DF grains behave similarly to the strain applied.
1. Introduction
Intercritical rolling is usually applied in thick plate thermomechanical rolling in order to achieve tensile property improvement in plain carbon and micro-alloyed steels [1,2,3,4,5]. Intercritically deformed microstructures have a beneficial impact on both yield and tensile strength, although ductility is significantly impaired [1,4,5]. The formation of different ferrite populations (deformed and non-deformed ferrite) also contributes to a reduction in hardness properties [1,2,3]. Some research into the effect of rolling in the austenite–ferrite two-phase region on microstructural evolution and mechanical properties has recently been published [6,7,8], although the exact behavior of each ferrite population under deformation and the strain distribution in each family is still missing from the literature. Non-deformed ferrite is characterized by the lack of substructure, linked to a low dislocation density and high ductility, whereas knowledge concerning the behavior of intercritically deformed ferrite becomes crucial in understanding tensile property improvement. Therefore, further understanding of the deformation characteristics of an intercritically deformed microstructure will be useful in defining more robust processes in order to help ensure optimized mechanical properties.
In this context, nanoindentation would seem to be a suitable technique to evaluate the mechanical properties of a mixed microstructure and, to this end, nanohardness measurements were calculated in order to estimate the hardness of the non-deformed ferrite (NDF) and deformed ferrite (DF) populations separately in the work presented here. Nanoindentation has been widely used in multiphase steels in order to differentiate between phases and characterize each constituent mechanically [9,10,11,12,13]. Rodriguez et al. [10] measured the hardness of different phases and researched the influence of the indentation size effect. They observed that in the case of ferritic steel with 0.06% carbon content, hardness varies from about 2.5 to 3.3 GPa when indent depth decreases from 200 to 50 nm. Taboada et al. [13] used the nanoindentation technique for bainite matrix-based multiphase microstructures and analyzed differences between the different phases. They reported that the high-carbon martensite in the Martensite-Austenite (MA) phase is the hardest phase detected, while the bainite phase is the softest. Nanohardness has also been useful in the study of carbon enrichment in the MA phase and its tempering in dual-phase steels [14,15,16]. In addition, nanohardness measurements used to analyze the stability of retained austenite under strain can also be found in the literature [17,18], although in terms of hardness, there is a lack of information about the differences between non-deformed and deformed ferrite in an intercritically deformed microstructure. Therefore, the aim of the current work is to analyze the suitability of the nanoindentation technique when applied to intercritically deformed microstructures.
Similarly, several authors have employed the electron backscatter diffraction (EBSD) technique in conjunction with either interrupted or continuous (in situ) tensile testing, in order to analyze the deformation behavior and microstructural evolution of various steels [19,20,21,22,23]. Yvell et al. [19] analyzed evolution of the microstructure in both surface and bulk grains in a pure Fe-19Cr-12Ni alloy, combining electron backscatter diffraction (EBSD) and interrupted tensile tests. They concluded that the combination of a low ability for cross-slip and a reduced slip distance encouraged by twinning is related to the maintenance of a high strain-hardening rate up to strains close to necking. With the aim of understanding the deformation process of polycrystalline materials, Wright et al. [21] characterized deformed materials via measurements of local variations in orientations using EBSD. To this end, they coupled a uniaxial tensile deformation module to a scanning electron microscope (SEM) with EBSD, in order to perform an in situ characterization. Saeidi et al. [22] analyzed a dual-phase 780 (DP780) steel using the EBSD technique in conjunction with tensile tests, in order to study the micromechanisms involved in the high deformation ability of such steel. They found that substructure formation, grain rotation, void creation and evolution were responsible for the high deformation ability of DP steel during deformation. Recently, Tan et al. [23] researched the Transformation Induced Plasticity (TRIP) effect, analyzing strain partitioning among the different constituents by performing an EBSD during quasi-in-situ tensile testing. EBSD results showed that the balance between ferrite fraction and martensite morphology controls the TRIP effect and its efficiency in reaching a suitable combination of strength and ductility.
In the current work, the use of interrupted tensile tests together with EBSD-based microstructural characterization enables the deformation behavior of the different ferrite populations to be studied, while on the other hand, hardness values measured in the non-deformed and deformed ferrite family will provide quantitative information about the deformation behavior of each population and their correlation with final mechanical properties.
2. Materials and Methods
The chemical composition of the low-carbon Nb-V micro-alloyed steel selected to carry out the current study is shown in Table 1. The steel was laboratory cast and hot-rolled before starting with the laboratory tests.

Table 1.
Chemical composition of the NbV microalloyed steel (in weight %).
Several intercritically deformed microstructures with different austenite–ferrite balances were developed using plane strain compression tests, and microstructural characterization was undertaken, and tensile property measured from samples machined from the plane strain compression samples. The thermomechanical cycle performed using the plane strain compression machine is depicted schematically in Figure 1. In this case, the cycle started with a reheating step at 1250 °C for 15 min, in order to dissolve all the microalloying elements, after which a refinement deformation pass of 0.4 and a strain rate of 1 s−1 was applied at 1050 °C following reheating at 1050 °C for 3 min. The samples were then cooled down at 1 °C/s to two different deformation temperatures of 700 and 685 °C—Tdef25 and Tdef75, respectively—to ensure 25 and 75% ferrite prior to the last deformation. These temperatures were determined by quenching samples just before the intercritical deformation and confirming the volume fraction by metallographic measurements. At each intercritical temperature, a deformation of 0.4 at a rate of 1 s−1 was applied, and finally the specimens were cooled down to room temperature at 1 °C/s. In plane strain compression samples, strain distributes heterogeneously through the specimen section, due to friction and specimen/tool geometry [24]. Therefore, the samples obtained for nanoindentation purposes and the tensile test, as well as the ones obtained for microstructural characterization, were machined from the central part of the plane strain compression specimens in order to minimize strain gradients.
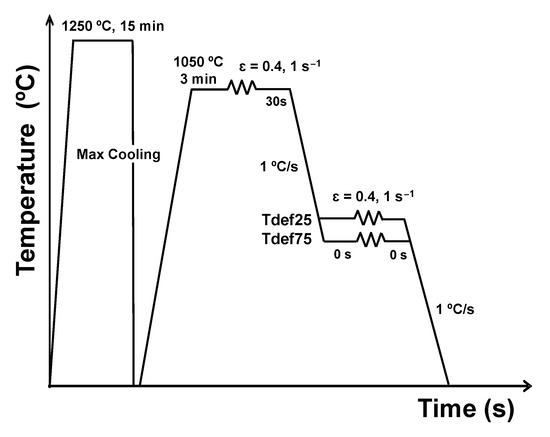
Figure 1.
Thermomechanical cycle applied in plane strain compression tests.
The microstructural evolution for both intercritical deformation temperatures was researched using electron backscatter diffraction technique (EBSD) after each tensile testing, interrupted at different strains. This kind of experiment enables the deformation of individual grains to be ascertained, with the evolution of both ferrite families (NDF and DF) being able to be analyzed separately. This was achieved via a quantitative comparison of successive EBSD maps, after applying the discretization methodology developed in Reference [6]. Once a distinction had been drawn between the ferrite populations, evolution of the crystallographic orientations was then tracked grain by grain. In the following sections, more details concerning each experimental methodology used are shown.
2.1. EBSD-Based Characterization Procedure
After each interruption in the tensile tests, an EBSD scan was performed in the same area for the purpose of evaluating the influence of deformation on each grain. EBSD scans were carried out with the JEOL JSM 7000F microscope (JEO Ltd., Tokyo, Japan) using HKL Channel 5 EBSD equipment. A step size of 0.2 μm, an operating voltage of 20 kV and an initial scan area of 90 × 90 μm2 were employed. In order to achieve the evolution of individual grains, the scanned area dimension varied from test to test due to the elongation of the grains following deformation.
The scans were analyzed using TSL OIM™ Analysis 5.31 software (EDAX, Mahwah, NJ, USA). Among the different clean-up routines provided by this software, three different clean-up methods were employed in the current work with the aim of preventing any artificial trends from being considered in the EBSD data. Firstly, a grain dilation step is applied, based on the definition of a grain tolerance angle of 5° and a minimum grain size of 0.91 μm (equivalent to three pixels). This clean-up step acts on points that do not belong to any grain, taking into account the tolerance defined. Another clean-up step is then applied by taking the grain Confidence Index (CI) standardization into consideration, and the CIs of all points in the same grain are changed to the maximum CI belonging to that grain. The neighbor CI correlation method is subsequently employed, and a minimum accepted value of 0.1 was determined in the current work. For points with a CI lower than 0.1, the orientation and CI of the particular point is reassigned to match the orientation and CI of the neighbor with the maximum CI. Following this clean-up procedure, the number of modified points ranges between 3.2 and 9% for the deformation conditions of 0% and 20%, respectively. For their part, the number of changed points in the scan increases with the deformation and complexity of the scanned microstructure, with 9% of redefined points being deemed acceptable in such cases.
To carry out the EBSD-based characterization, tensile specimens were prepared following the standard procedure, involving different steps. First, samples were mechanically grounded with SiC abrasive papers and then polished with diamond liquids down to 1 μm. Finally, specimens were manually polished with a 50 nm colloidal silica suspension for 30 min.
2.2. Nanoindentation Test
Nanoindentation tests were carried out using a TRIBO INDENTER machine (Bruker’s—Hysitron TI 950 TriboIndenter, Minneapolis, MN, USA), which comprises a computer-controlled indentation system that continuously records displacement of the tip of the indenter and the load applied on the sample during the test. The test was defined as a displacement-controlled trial, with maximum desired displacement being set at 113 nm based on experiences in similar ferritic microstructures [10]. The nanoindentation was performed using an indentation matrix with a total area of 70 × 145 μm2 and a spacing of 5 μm. The matrix consists of 15 columns and 30 rows of nanoindentations (in total, 450 indentations). Sample preparation for the nanoindentation test consists firstly of a conventional polishing procedure and ends with polishing to 50 nm in colloidal silica suspension over 10 min. Surface deformation and the roughness of the sample caused by polishing might affect the nanohardness measurements, while high surface deformation might lead to hardening of the surface, with the roughness resulting in major data dispersion. Correct sample preparation thus proves essential. The nanohardness analytical procedure itself was divided into three main steps. First, an EBSD scan needed to be performed on the unindented sample, and both ferrite populations were differentiated in each ESBD scan based on a recently developed discretization methodology used to distinguish deformed ferrite from non-deformed ferrite [6]. The nanoindentation matrix was subsequently performed in the previously scanned area and, lastly, each nanohardness value was analyzed individually and the location within both ferrite families determined one by one. The distinction made between each ferrite family enabled each nanohardness value to be assigned to the corresponding ferrite population. Finally, with the aim of validating the proposed methodology and ensuring that all the hardness values were assigned to the proper ferrite grains, the microstructure was characterized using FEG-SEM (following etching by 2% Nital). The nanohardness measurements were calculated based on the formulation put together by Oliver and Pharr [25], while the nanoindentations located at grain boundaries were not taken into account for statistical purposes. In the current study, nanoindentations located at grain boundaries and pearlite regions were not considered in the calculation and 22% of indentations were removed from the matrix (6% and 16%, due to pearlite and grain boundaries, respectively).
2.3. Interrupted Tensile Tests
Interrupted tensile tests were carried out on an INSTRON 5982 tensile machine (Instron, Grove City, PA, USA), in accordance with the ASTM E8M standard. A constant strain rate of 1.05 mm/min was imposed, with a load cell of 20 kN, and elongation being measured using a strain-gauge extensometer over a 12.5 mm gauge-length. Flat tensile specimens were machined from previously tested plane strain compression samples in order to carry out this particular experiment. Flat tensile specimens have a gauge length of 15 mm (total length of 55 mm), a width of 5.5 mm and a thickness of 0.8 mm. Each tensile test was interrupted at intervals with a predetermined strain value of 5%, with several tests being performed until the deformation applied reached the peak strain of the corresponding condition.
3. Results and Discussion
3.1. Initial Microstructures
Prior to conducting the tensile test, the NbV micro-alloyed steel shows a microstructure composed of non-deformed and deformed ferrite grains for both Tdef25 and Tdef75 conditions, as illustrated in the EBSD maps depicted in Figure 2. Depending on the deformation temperature (and, consequently, the ferrite content prior to deformation), the balance between the aforementioned constituents varies significantly, as shown in the Image Quality (IQ) maps corresponding to Tdef25 and Tdef75 conditions (see Figure 2a,c, respectively). Polygonal ferrite grains (NDF) with no appreciable substructure can be identified in the Tdef25 condition. On the other hand, when deformation temperature decreases to Tdef75, a microstructure composed predominantly of deformed ferrite grains is observed, reflected in the presence of elongated grains and a marked substructure. In addition, in Figure 2b,d, Inverse Pole Figure (IPF) maps are shown, in which low- and high-angle grain boundaries are included (drawn in fine and coarse black lines, respectively).
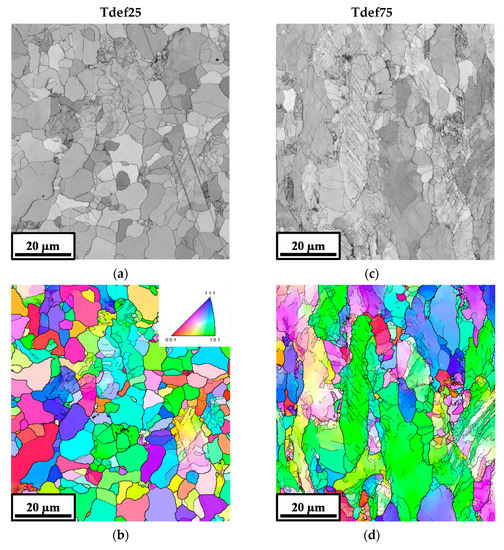
Figure 2.
(a,c) Image Quality (IQ) and (b,d) Inverse Pole Figure (IPF) maps corresponding to different deformation temperatures: (a,b) Tdef25 and (c,d) Tdef75.
Comparing both EBSD maps, it is evident that the reduction in deformation temperature (from Tdef25 to Tdef75) leads to a clear increment in the substructure within the deformed ferrite grains. Additionally, the morphology of the intercritically deformed ferrite grains changes depending on deformation temperature (see Figure 2). After the highest deformation temperature of Tdef25 was reached, subgrains could be appreciated inside the deformed ferrite grains, attributed to restoration activation during intercritical deformation at 700 °C. Conversely, the reduction in deformation temperature to 685 °C (Tdef75) delays or suppresses the restoration kinetics, leading to the formation of deformation bands inside the deformed ferrite population. Therefore, in the microstructure corresponding to Tdef75, deformation bands could also be distinguished in addition to subgrains. Similar trends have also been observed in a recently published work [7].
3.2. Nanoindentation Study
Nanohardness measurements were calculated for the Tdef25 condition prior to conducting the tensile tests. The main objective was to estimate the hardness of the NDF and DF population separately, and to correlate these measurements with differences in hardening behavior. Figure 3a shows an optical micrograph of the indented zone. Different NDF and DF balances (72% and 22%, respectively) are clearly observed, and Figure 3b likewise shows the nanohardness map obtained from the indented sample. The color intensity varies as a function of the hardness value, with the blue-colored grains being the ones with the lowest values (see the color scale shown in Figure 3b). Conversely, the red color is associated with the hardest zones. Comparing Figure 3a,b, it can be seen that the red color is mainly associated with the indentations made in pearlite, while the blue-yellow colored areas preferentially correspond to NDF and DF grains. Figure 3c shows the Grain Orientation Spread (GOS) map obtained in the same area in which the nanohardness matrix is performed. In this map, each grain is colored according to the color scale provided in Figure 3c. The GOS map suggests that the NDF family is characterized by low GOS values, colored mainly in blue, whereas deformed ferrite grains are associated with higher GOS values (more green-orange regions).
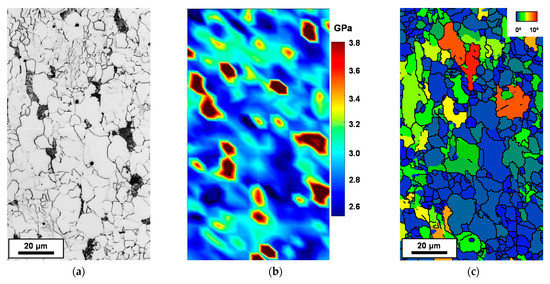
Figure 3.
Images related to the nanoindentation test performed in the Tdef25 sample: (a) Optical micrograph obtained following the nanoindentation test (b) Nano hardness map, and (c) Grain Orientation Spread (GOS) map.
In order to verify whether there are any differences between nanohardness values in each ferrite population, deformed ferrite must be distinguished from non-deformed ferrite and to do so, an EBSD-based discretization methodology was used in this case [6]. To summarize, the procedure draws a distinction between NDF and DF grains based on the Grain Orientation Spread (GOS) parameter. This parameter is defined as the mean deviation between the orientation of each point in the grain and the mean orientation of the grain, with DF grains being characterized by higher GOS values, mainly attributed to the substructure formed within the grains. The procedure involves two main steps. First, pearlite is removed from the microstructure using the IQ parameter, and second, by applying a previously defined GOS 2° criteria, both ferrite populations (NDF and DF) can be distinguished. Further details about the methodology pursued can be found in [6].
Figure 4a,b show GOS maps corresponding to NDF and DF populations, respectively. NDF grains are defined by the presence of equiaxed grains, with low GOS values (see Figure 4a). Conversely, DF grains have an elongated shape and are painted in yellow-orange colors, due to their high GOS values (see Figure 4b). When analyzing the nanohardness map shown in Figure 3b, it can be seen that the DF grains are also yellow colored in the hardness map, reflecting the fact that higher hardness values are measured. On the other hand, most NDF grains have low hardness values with regard to the non-deformed ferrite population (colored in blue in the hardness map shown in Figure 3b). Figure 4c shows how nanohardness distribution corresponding to NDF and DF populations is plotted together. Higher nanohardness values were measured in the case of intercritically deformed ferrite (DF) compared to the ferrite formed during the final air-cooling step (NDF), and mean hardness values of 2.6 and 2.8 GPa were quantified for NDF and DF grains, respectively.
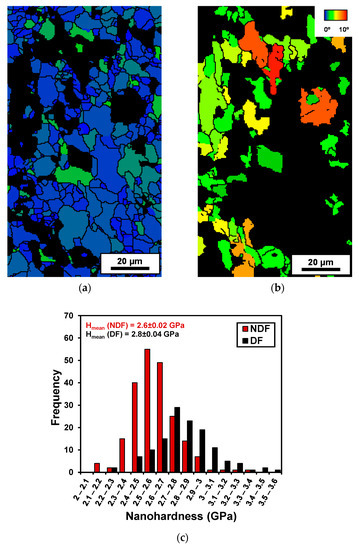
Figure 4.
Grain Orientation Spread (GOS) maps related to (a) NDF and (b) DF population corresponding to the Tdef25 condition (discretization between ferrite families taking the GOS 2° parameter into consideration). (c) Distribution of nanohardness values in both ferrite families.
3.3. Mechanical Behavior during the Interrupted Tensile Test
The effect of intercritical deformation temperature on tensile properties in NbV steel was previously reported in [8]. Elongation was significantly reduced in this case, even though an improvement in both yield and tensile strength was noticed as intercritical deformation temperature decreases. This could be mainly attributed to the formation of a higher deformed ferrite fraction for Tdef75. The results obtained in the frame of the INCROHSS project [26] show that completely different peak strain values are measured depending on deformation temperature. In NbV steel, a peak strain of 0.2 was obtained for Tdef25, whilst for Tdef75 a lower peak strain of 0.1 was measured. These results were established as a means for defining the number of interrupted tensile tests to be performed for each condition in order to reach the peak stress level. In the current work, 5%, 10%, 15% and 20% interrupted deformation stages were applied for Tdef25, while for Tdef75, deformation stages of 5% and 10% were defined. Figure 5a,b show the stress–strain curves obtained from the interrupted tensile tests for the Tdef25 and Tdef75 conditions, respectively.
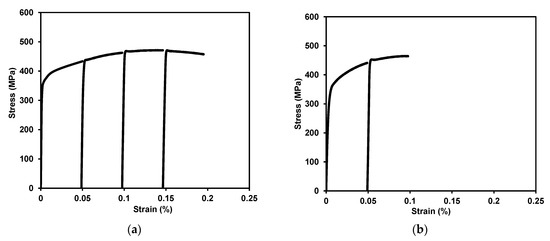
Figure 5.
Stress–strain curves obtained from interrupted tensile tests for (a) Tdef25 and (b) Tdef75 conditions.
3.4. Microstructural Evolution during Tensile Testing
Figure 6 and Figure 7 show the evolution of the microstructure as a function of the applied deformation level for Tdef25 and Tdef75 conditions, respectively. Kernel maps are also shown apart from the grain boundary maps (low- and high-angle boundaries are drawn in red and black, respectively). From this EBSD analysis, different microstructural parameters were quantified, such as the density of low- and high-angle boundaries (LAGB and HAGB densities), as well as the Kernel Average Misorientation (KAM) value for each strain level and both deformation temperatures. Table 2 summarizes both LAGB and HAGB densities, in addition to KAM values. In Figure 6a–e, where the grain boundary maps are depicted for the Tdef25 condition, ferrite morphology differences are clearly observed in the case of the different levels of deformation applied. Figure 6a shows the initial state of the microstructure, this being composed predominantly of non-deformed ferrite (72% and 22% of NDF and DF, respectively). Polygonal ferrite grains without substructure (NDF) can be observed, combined with elongated ferrite grains with a high density of low-angle grain boundaries (DF). As the applied amount of deformation increases up to 15% of deformation (see Figure 6c), the density of low-angle grain boundaries (LAGB) also increases. As shown in Table 2, the LAGB density increases from 0.23 to 0.43 for a strain level of 0% and 15%, respectively. By contrast, no clear difference in HAGB density is observed when increasing strain from 0 to 15% (0.38 and 0.42, respectively). From this point up to 20% of deformation (see Figure 6d,e), LAGB density remains almost constant (see Table 2).
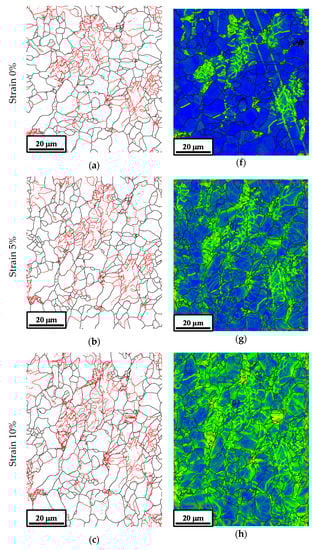
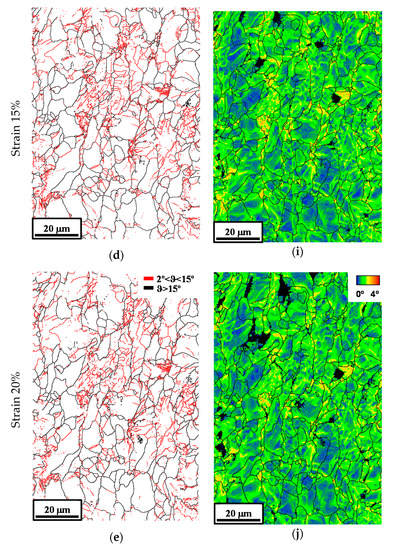
Figure 6.
(a–e) Grain Boundary maps and (f–j) KAM maps corresponding to the Tdef25 condition.
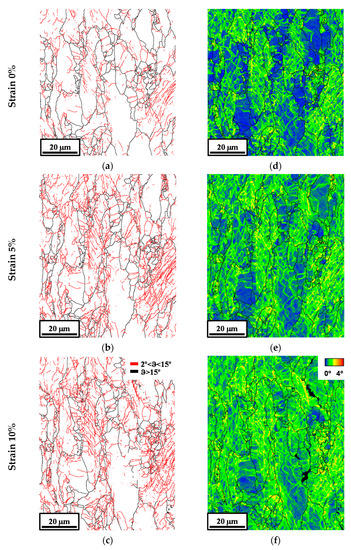
Figure 7.
(a–c) Grain Boundary maps and (d–f) KAM maps corresponding to the Tdef75 condition.
Table 2.
Electron backscatter diffraction (EBSD) scan area, low-angle grain boundary (LAGB) density, high-angle grain boundary (HAGB) density and Kernel Average Misorientation (KAM) value corresponding to the different deformation temperatures (Tdef25 and Tdef75) and different deformation conditions.
Similarly, Figure 6f–j shows the KAM map evolution for the entire range of tensile strain. In the current study, KAM is estimated by taking into consideration any misorientation lower than 4° in terms of the third neighbor. In the KAM map corresponding to deformation 0% (see Figure 6f), the NDF grains are colored in blue, while the DF grains are predominantly yellow and orange. As deformation continues to increase up to 15%, the NDF grains turn yellow and the DF grains show a more evident substructure. KAM increases from 0.3 to 1.1°, increasing strain level from 0% to 15%. Nevertheless, at the highest strain level (20%), a similar KAM value (compared to 15%) is obtained, of approximately 1.1° (see Table 2).
Figure 7 displays the grain boundary and KAM map evolution depending on the deformation applied for the Tdef75 condition. In this case, in its initial state (see Figure 7a), the microstructure is composed of 74% DF grains, 20% NDF grains and 6% pearlite by way of a secondary phase. Compared to Tdef25, similar trends were observed regarding the evolution of the microstructure. Prior to applying the strain (0% strain, see Figure 7a), a higher substructure was noticed than in the Tdef25 condition (see Figure 6a), this being reflected in a higher fraction of low-angle boundaries drawn in red. In addition, the effect of reducing deformation temperature on the Kernel Average Misorientation map is also clear. In the Kernel map showing Tdef75 (see Figure 7d), more regions colored in green-yellow can be distinguished compared to Tdef25 (see Figure 6f), showing that higher content of DF with higher dislocation density is formed at the lowest deformation temperature. As shown in Table 2, higher strain levels result in an increment in the density of low-angle boundaries and KAM values in both deformation temperatures. As for the influence of strain level, Figure 7 shows that as the strain increases, a greater presence of sub-boundaries (depicted in red in the grain boundary maps) and higher KAM values are obtained.
Grain boundary lengths per unit area for both low (LAGB) and high (HAGB) were estimated from the EBSD scans. Figure 8 shows the evolution of the grain boundary length per unit area, measured at 2° and 15°, for both deformation temperature conditions (Tdef25 and Tdef75) and different strain levels. As for the LAGB, at 0% of strain level, the fraction was initially higher for the Tdef75 condition compared to Tdef25, with values of 0.61 and 0.22 μm−1 being measured, respectively. This difference is related to a higher fraction of DF grains in the microstructure, with a considerable subgrain structure. In terms of the effect of strain level, different trends could be highlighted depending on intercritical deformation temperature.
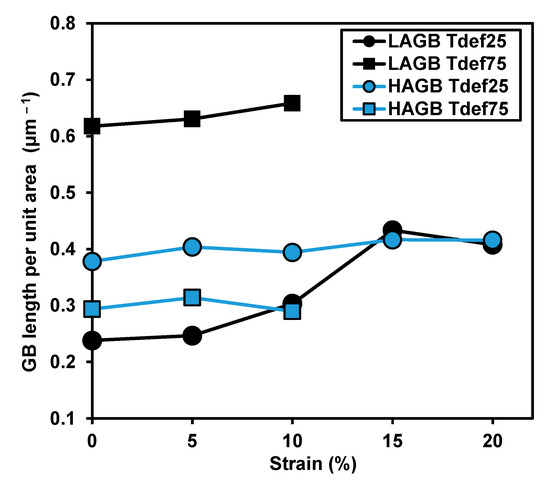
Figure 8.
Low- and High-Angle Grain Boundary length per unit area (LAGB and HAGB, respectively) measured for Tdef25 and Tdef75 conditions.
As previously denoted in the GB and KAM maps displayed in Figure 6, the impact of strain level on microstructure morphology evolution is more significant in the case of the Tdef25 condition. When the strain is varied from 0% to 10%, the Tdef25 GB fraction increases by 30.4%, while the GB fraction corresponding to Tdef75 only increases by 8.2%. Regarding the impact of strain applied on the HAGB length per unit area (with 15° misorientation), the value of the GB fraction remains almost constant for both deformation temperatures and, therefore, no considerable effect of strain on high-angle boundaries is noticed. For example, HAGBs of 0.38, 0.39 and 0.42 µm−1 were estimated for Tdef25, after applying 0%, 10% and 20% strain.
3.5. Evolution of the Microstructure in Individual Ferrite Populations (NDF and DF)
The aforementioned EBSD discretization methodology [6] was applied to the microstructures described in Figure 6, with the aim of studying microstructural evolution during interrupted tensile tests in the NDF and DF populations separately. In Figure 9a–c, KAM maps corresponding to the NDF population of the Tdef25 condition are displayed for different deformation levels of 0, 10 and 20%, respectively. The variation in NDF ferrite morphology as deformation advances becomes very evident. At 0% deformation, there is no substructure within the NDF grains (see Figure 9a), but as the sample becomes deformed, the NDF grains, in turn, become more elongated and the substructure (painted in yellow) is formed, reflected in a higher KAM value. The KAM value is usually associated with the accumulation of deformation within the grains, and consequently with dislocation density [27]. The variation in KAM value, however, would seem to be less relevant in the case of the DF family (see Figure 9d–f).
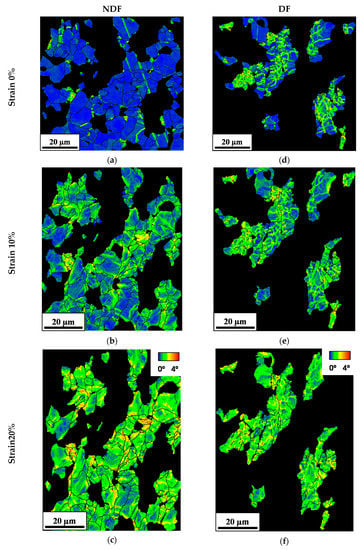
Figure 9.
KAM maps corresponding to the Tdef25 condition in (a–c) NDF and (d–f) DF populations.
3.6. Quantification of Microstructural Features
In Figure 10a,b, LAGB and HAGB length per unit area as a function of strain are plotted, for both NDF and DF populations and both deformation temperatures (Tdef25 and Tdef75). The effect of strain on grain boundary density (taking low and high misorientation criteria into consideration) is evaluated from the figure for each ferrite population. As shown in Figure 10a, the initial LAGB fraction is higher for DF than for NDF, due to differences in the subgrain structure. For Tdef25, a more significant increment in LAGB fraction is noticed in the NDF family compared to the DF one. For example, in the case of NDF, LAGB density increases drastically from 0.072 to 0.32 µm−1 (ΔLAGB 347%) as strain increases from 0% to 15%. However, in the case of the DF population, the increment in low angle boundaries is less evident. For example, the LAGB of 0.46 and 0.62 µm−1 (ΔLAGB 33%) is measured after applying deformations of 0% and 15%, respectively. This result indicates that strain is mainly partitioned in the NDF during such deformation for Tdef25. For Tdef75 condition, the LAGB density behavior shows some differences. DF LAGB starts at the same value as in the Tdef25 case, while LAGB for NDF is higher in the Tdef75 sample. This would reflect a higher degree of subgrain formation in the initial stage in the Tdef75 NDF grains formed during cooling due to the high DF volume fraction surrounding them. Once deformation is applied in the tensile test, the increase in subgrain substructure is faster in Tdef75 DF grains, reaching at 10% deformation, similar values to the 15–20% deformation in the Tdef25 sample. Substructure in the NDF grains for Tdef75 also evolves to higher values when tensile stress is applied, but with a lower slope than in the Tdef25. Taking into account high angle tolerance (see Figure 10b), no significant variation in GB fraction is observed in either NDF or DF families for both deformation temperatures (Tdef25 and Tdef75). Therefore, the impact of the strain applied is more relevant at the subgrain level.
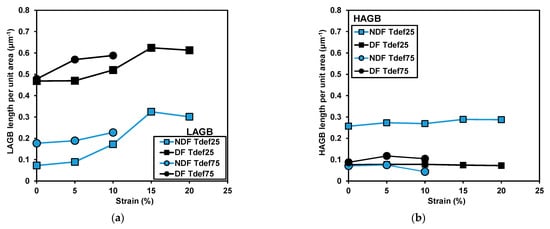
Figure 10.
(a) Low- and (b) High-Angle Grain Boundary length per unit area (LAGB and HAGB, respectively), measured for Tdef25 and Tdef75 conditions and both ferrite families (DF and NDF).
On the other hand, Figure 11 shows the variation in dislocation density (ρ) in both intercritical deformation conditions and both ferrite families. Dislocation density can be calculated by analyzing local misorientation gradients of a given region [27], while the density of geometrically necessary dislocation is estimated by Kernel Average Misorientation (KAM) obtained via EBSD and by applying the Kubin and Mortensen approach [28]. According to Figure 11, any clear differences in dislocation density are measured for both ferrite families (NDF and DF), and the lowest ρ is obtained for the NDF population with 0% deformation. Obviously, the initial ρ of the DF family is higher than the ρ measured for NDF, due to its internal substructure. In terms of the evolution of dislocation density with higher levels of deformation, the increment in ρ caused by the increment in strain is more evident in the case of NDF than in the DF family. For NDF grains, an increment in dislocation density (Δρ) of 230% is obtained when the deformation level is increased from 0% to 10%, while in the case of DF, the dislocation density increases by 65%. However, when the sample is strained up to 15%, dislocation density remains constant in both ferrite populations.
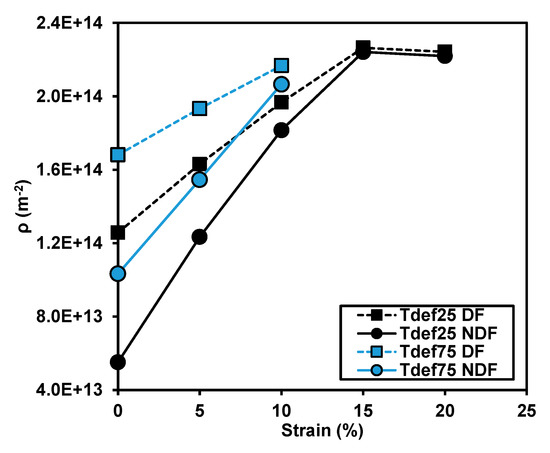
Figure 11.
Dislocation density measured in NDF and DF populations, both deformation temperatures and entire range of deformation.
3.7. Relation between Dislocation Density, Nanohardness and Strain Partitioning
From the above results, the relationship between the initial balance of intercritically deformed grains, their particular hardness and their evolution during the interrupted tensile tests is clearly addressed by different mechanisms. Basically, a region with a high dislocation density, i.e., a DF grain, is transformed into a subgrain-rich area via dislocation rearrangement. Consequently, a relationship between low-angle grain boundaries and dislocation densities is directly observed by subsequent EBSD scans. Indeed, if the grain boundary length measured at 2° corresponding to the DF population (see Figure 10) is compared to the evolution of the dislocation density plotted in Figure 11 in the same ferrite family, a similar progression in both parameters is then observed. On the other hand, the small differences in hardness observed in Figure 4c may be attributed to the formation of a substructure (high density of LAGB) within the deformed ferrite population, as hardness increases in the vicinities of the grain boundaries [12,13].
The difference in hardness among the different ferrite populations has a significant influence on strain partitioning. Figure 10 shows that the increment in low-angle grain boundaries in NDF grains is much higher than that in DF grains, mainly for Tdef25 condition. Thus, strain is mainly partitioned in NDF grains during the initial stages of deformation. These results quantitatively show the relevance of the deformability difference (or strain partitioning) between DF and NDF grains. Several authors have studied strain partitioning between two phases and concluded that in the first stages of deformation, the softer phase is responsible for accommodating most of the deformation inferred to in the sample [29,30,31,32]. Above a certain strain, the deformation is partitioned between both phases depending on their microstructural characteristics [30,31,33,34]. This trend can also be observed in Figure 11, where the NDF and DF population show a similar dislocation density in up to 10% deformation, this being related to an almost equal distribution of the strain applied in both ferrite families. However, when the sample is strained higher than 15%, dislocation density remains constant in both ferrite populations. Strain hardening of the materials is caused by dislocations interacting with each other, with barriers that impede their motion through the crystal lattice. As both ferrite populations have been hardened during deformation at the same level, the strain is partitioned equally, with similar dislocation densities being noted.
To summarize, by combining the results obtained from the microstructural characterization carried out on the interrupted tensile test samples with the results of the nanoindentation test, a link between dislocation density, nanohardness and strain partitioning can thus be established. As shown in Figure 11, in the softer phase NDF grains accommodate more strain via dislocation compared to the harder DF grains. Following 10% deformation, the NDF population hardens and from this point on, both ferrite populations accommodate the strain to an equal extent, with similar dislocation densities being obtained. Therefore, differences in the ability to accommodate the deformation are related to the initial hardness value measured in the corresponding ferrite population.
The fact that, after a certain deformation, both ferrite grain families deform with a similar strain distribution could provide some benefits regarding local damage concentration for high deformations. Typically, for dual phase steels, where the hardness difference between phases is higher, local damage concentration in the martensite/ferrite interfaces is a key factor to promote crack nucleation and trigger fracture mechanisms [35,36]. This effect is notably reduced for Ferrite–Bainite (FB) steels where hardness between phases is more similar [37]. In this context, intercritically deformed steels should behave better in terms of a lack of relevant damage nucleation points as the difference in hardness between phases is reduced for low plastic deformation levels.
4. Conclusions
Different characterization techniques, such as interrupted tensile tests, the EBSD technique and nanoindentation, have been combined in the current work in order to analyze the individual behavior of the different ferrite families shown in an intercritically deformed microstructure during a tensile test.
Nanoindentation performed in the Tdef25 condition without strain shows that NDF is softer than the DF family. The nanohardness values of 2.6 and 2.8 GPa were quantified in the NDF and DF population, respectively.
Regarding the effect of the intercritical deformation temperature on the evolution of the whole microstructure, the results suggest that the impact of strain level is more evident in the Tdef25 condition in which a high fraction of NDF is formed, linked to a greater capacity to accommodate deformation. The increment in low angle boundary density as well as Kernel Average Misorientation caused by strain increment is more significant in Tdef25 compared to Tdef75.
Furthermore, in terms of the exact behavior of each ferrite population, the conclusion has been drawn that the non-deformed ferrite population accommodates most of the deformation at early stages of the tensile test. For deformation levels higher than 10%, both NDF and DF populations behave similarly. When the DF population is deformed above 15%, the microstructure becomes saturated, and there is no more space to accommodate the deformation via dislocation, in turn resulting in a constant dislocation density value.
Differences in dislocation density converge from the initial differences for each family to similar values when the maximum stress values are achieved. This microstructural evolution is also observed in the LAGB variation, which gradually increase. The HAGB fraction though remains constant in all cases.
Author Contributions
U.M. carried out the experiments and wrote the manuscript; N.I. supervised the results, analyzed the data and wrote the manuscript; J.M.R.-I. contributed to the interpretation of the data and edited the manuscript; P.U. managed the project and edited the manuscript. All authors have read and agreed to the published version of the manuscript.
Funding
This research received funding by the Spanish Ministry of Economy and Competitiveness (MAT2015-69752) and the European Commission Research Fund for Coal and Steel (RFSR-CT-2015-00014).
Institutional Review Board Statement
Not applicable.
Informed Consent Statement
Not applicable.
Data Availability Statement
Data sharing not applicable.
Acknowledgments
The financial support of the Spanish Ministry of Economy and Competitiveness (MAT2015-69752) is gratefully acknowledged. The authors also acknowledge a research grant from the European Commission Research Fund for Coal and Steel (RFSR-CT-2015-00014).
Conflicts of Interest
The authors declare no conflict of interest.
References
- Gohda, S.; Watanabe, K.; Hashimoto, Y. Effects of the intercritical rolling on structure and properties of low carbon steel. ISIJ Int. 1981, 21, 6–15. [Google Scholar] [CrossRef]
- Speich, G.R.; Dabkowski, D.S. Effect of deformation in the austenite and austenite-ferrite regions on the strength and fracture behaviour of C, C-Mn-Cb and C-Mn-Mo-Cb steels. In The Hot Deformation of Austenite Conference; Ballance, J.B., Ed.; AIME: New York, NY, USA, 1979; pp. 557–597. [Google Scholar]
- Phillips, R.; Chapman, J.A. Influence of finish rolling temperature on mechanical properties of some commercial steels rolled to 13/16 in. diameter bars. J. Iron Steel Inst. 1966, 204, 615–622. [Google Scholar]
- Abbas, M.; Ismail, A.; Ghazaly, S.; Bitar, T. Intercritical deformation of low carbon steels. Can. Metall. Q. 2004, 43, 109–116. [Google Scholar] [CrossRef]
- Chabbi, L.; Lehnert, W. Microstructural formation, deformation behavior and deformability of heat treatment steels in the two-phase region. Rev. Met. Paris 2000, 97, 589–598. [Google Scholar] [CrossRef]
- Mayo, U.; Isasti, N.; Jorge, B.D.; Rodriguez, I.J.M.; Uranga, P. An EBSD-based methodology for the characterization of intercritically deformed low carbon steel. Mater. Charact. 2019, 147, 31–42. [Google Scholar] [CrossRef]
- Mayo, U.; Isasti, N.; Rodriguez, I.J.M.; Uranga, P. Interaction between Microalloying Additions and Phase Transformation during Intercritical Deformation in Low Carbon Steels. Metals 2019, 9, 1049. [Google Scholar] [CrossRef]
- Mayo, U.; Isasti, N.; Rodriguez, I.J.M.; Uranga, P. On the characterization procedure to quantify the contribution of microstructure on mechanical properties in intercritically deformed low carbon HSLA steels. Mater. Sci. Eng. A 2020, 792. [Google Scholar] [CrossRef]
- Furnemont, Q.; Kempf, M.; Jacques, J.; Goken, M.; Delannay, F. On the measurement of the nanohardness of the constitutive phases of TRIP-assisted multiphase steels. Mater. Sci. Eng. A 2002, 328, 26–32. [Google Scholar] [CrossRef]
- Rodriguez, R.; Gutierrez, I. Correlation between nanoindentation and tensile properties: Influence of the indentation size effect. Mater. Sci. Eng. A 2003, 361, 377–384. [Google Scholar] [CrossRef]
- He, B.B.; Zhu, K.; Huang, M.X. On the nanoindentation behaviour of complex ferritic phases. Philos. Mag. Lett. 2014, 94, 439–446. [Google Scholar] [CrossRef]
- Choi, B.W.; Seo, D.H.; Jang, J.I. A nanoindentation study on the micromechanical characteristics of API X100 pipeline steel. Met. Mater. Int. 2009, 15, 373–378. [Google Scholar] [CrossRef]
- Taboada, M.C.; Elizalde, M.R.; Jorge, B.D. Austempering in low-C steels: Microstructure development and nanohardness characterization. J. Mater. Sci. 2019, 54, 5044–5060. [Google Scholar] [CrossRef]
- Ghasemi, B.S.S.; Fereiduni, E. Effect of prior austenite carbon partitioning on martensite hardening variation in a low alloy ferrite–martensite dual phase steel. Mater. Sci. Eng. A 2014, 619, 129–136. [Google Scholar] [CrossRef]
- Mazaheri, Y.; Kermanpur, A.; Najafizadeh, A. Nanoindentation study of ferrite-martensite dual phase steels developed by a new thermomechanical processing. Mater. Sci. Eng. A 2015, 639, 8–14. [Google Scholar] [CrossRef]
- Li, H.; Gao, S.; Tian, Y.; Terada, D.; Shibata, A.; Tsuji, N. Influence of tempering on mechanical properties of ferrite and martensite dual phase steel. Mater. Today Proc. 2015, 2, 667–671. [Google Scholar] [CrossRef]
- He, B.B.; Huang, M.X.; Liang, Z.Y.; Ngan, A.H.W.; Luo, H.W.; Shi, J.; Cao, W.Q.; Dong, H. Nanoindentation investigation on the mechanical stability of individual austenite grains in a medium-Mn transformation-induced plasticity steel. Scr. Mater. 2013, 69, 215–218. [Google Scholar] [CrossRef]
- Hossain, R.; Pahlevani, F.; Quadir, M.Z.; Sahajwalla, V. Stability of retained austenite in high carbon steel under compressive stress: An investigation from macro to nano scale. Sci. Rep. 2016, 6, 1–11. [Google Scholar] [CrossRef]
- Yvell, K.; Grehk, T.M.; Hedström, P.; Borgenst, A.; Engberg, G. EBSD analysis of surface and bulk microstructure evolution during interrupted tensile testing of a Fe-19Cr-12Ni alloy. Mater. Charact. 2018, 141, 8–18. [Google Scholar] [CrossRef]
- Askari, P.M.; Shahverdi, H.R.; Miresmaeili, R.; Beladi, H. Analysis of tensile deformation behavior of AM2B® advanced high-strength steel using electron back-scattered diffraction technique. Mater. Charact. 2017, 130, 64–73. [Google Scholar] [CrossRef]
- Wright, S.I.; Suzuki, S.; Nowell, M.M. In situ EBSD observations of the evolution in crystallographic orientation with deformation. JOM 2016, 68, 2730–2736. [Google Scholar] [CrossRef]
- Saeidi, N.; Ashrafizadeh, F.; Niroumand, B.; Barlat, F. EBSD study of micromechanisms involved in high deformation ability of DP steels. Mater. Des. 2015, 87, 130–137. [Google Scholar] [CrossRef]
- Tan, X.; Ponge, D.; Lu, W.; Xu, Y.; Yang, X.; Rao, X.; Wu, D.; Raabe, D. Carbon and strain partitioning in a quenched and partitioned steel containing ferrite. Acta Mater. 2019, 165, 561–576. [Google Scholar] [CrossRef]
- Uranga, P.; Gutierrez, I.; Lopez, B. Determination of recrystallization kinetics from plane strain compression tests. Mater. Sci. Eng. A 2013, 578, 174–180. [Google Scholar] [CrossRef]
- Oliver, W.C.; Pharr, G.M. An improved technique for determining hardness and elastic modulus using load and displacement sensing indentation experiments. J. Mater. Res. 1992, 7, 1561–1583. [Google Scholar] [CrossRef]
- Mayo, U. Impact of intercritical deformation on microstructural evolution and mechanical properties in low carbon steels. Ph.D. Thesis, University of Navarra, San Sebastian, Spain, 2019. [Google Scholar]
- Calcagnotto, M.; Ponge, D.; Demir, E.; Raabe, D. Effect of grain refinement to 1μm on strength and toughness of dual-phase steels. Mater. Sci. Eng. A 2010, 257, 7832–7840. [Google Scholar] [CrossRef]
- Kubin, L.P.; Mortensen, A. Geometrically necessary dislocations and strain-gradient plasticity: A few critical issues. Scr. Mater. 2003, 48, 119–125. [Google Scholar] [CrossRef]
- Saito, Y. Mathematical model of hot deformation resistance in austenite-ferrite two phase region. ISIJ Int. 1987, 27, 419–424. [Google Scholar] [CrossRef]
- Luo, H.; Sietsma, J.; Zwaag, S. A novel observation of strain-induced ferrite to austenite retransformation after intercritical deformation of C-Mn steel. Metall. Mater. Trans. A 2004, 35, 2789–2797. [Google Scholar] [CrossRef]
- Mohamadizadeh, A.; Zarei, H.A.; Mehtonen, S. Correlation of strain accommodation factor with the state of microstructural components in a multiphase steel. ISIJ Int. 2015, 55, 2406–2415. [Google Scholar] [CrossRef]
- Sakai, T.; Ohashi, M. Static restoration after hot deformation of a 2.9% Si steel. ISIJ Int. 1984, 70, 2160–2167. [Google Scholar]
- Bodin, A. Intercritical Deformation of Low-Alloy Steels; Delft University of Technology: Delft, The Netherlands, 2002. [Google Scholar]
- Tomota, Y.; Minoru, U.; Nozomi, K.; Akifumi, H.; Norihiro, N.; Akio, M.; Tsutomu, W.; Shigenobu, N.; Goro, A.; Kazutoshi, K.; et al. Prediction of mechanical properties of multi-phase steels based on stress-strain curves. ISIJ Int. 1992, 32, 343–349. [Google Scholar] [CrossRef]
- Ashrafizadeh, N.F.; Niroumand, B.; Forouzan, M.R.; Barlat, F. Damage mechanism and modeling of void nucleation process in a ferrite–martensite dual phase steel. Eng. Frac. Mech. 2014, 127, 97–103. [Google Scholar] [CrossRef]
- Scott, C.P.; Shalchi, A.B.; Pushkareva, I.; Fazeli, F.; Allain, S.Y.P.; Azizi, H. New insights into martensite strength and the damage behaviour of dual phase steels. Acta Mater. 2018, 159, 112–122. [Google Scholar] [CrossRef]
- Choi, S.H.; Kim, E.Y.; Kim, S.I. The micromechanical deformation behaviors of hot-rolled 590FB steel during hole-expansion test. Int. J. Plast. 2014, 58, 184–200. [Google Scholar] [CrossRef]


Publisher’s Note: MDPI stays neutral with regard to jurisdictional claims in published maps and institutional affiliations. |
© 2021 by the authors. Licensee MDPI, Basel, Switzerland. This article is an open access article distributed under the terms and conditions of the Creative Commons Attribution (CC BY) license (http://creativecommons.org/licenses/by/4.0/).