Article

Effect of Strain Rate on the Deformation Behaviour of A356-T7 Cast Aluminium Alloys at Elevated Temperatures

1
Department of Industrial and Materials Science, Chalmers University of Technology, 412 96 Gothenburg, Sweden
2
Analysis and Verification, Volvo Car Corporation, 405 31 Gothenburg, Sweden
*
Author to whom correspondence should be addressed.
Metals 2020, 10(9), 1239; https://doi.org/10.3390/met10091239
Submission received: 21 August 2020 / Revised: 11 September 2020 / Accepted: 13 September 2020 / Published: 15 September 2020
(This article belongs to the Special Issue Microstructure, Deformation, and Fatigue Behavior in Metals)

Abstract

:
Internal combustion engine downsizing and powertrain electrification trends in recent years have led to higher thermal loads on the cylinder head materials with an increased number of engine start–stop thermal load cycles. This requires designing cylinder heads that are resilient against thermomechanical fatigue damage. To reduce the developmental costs, reliable numerical models for use in computer-aided design approaches are required. Thus, a comprehensive understanding of the material deformation behaviour under loads mimicking in-service conditions is desired to make better engineering decisions. This study examines the effect of strain rate on the cyclic deformation behaviour of the A356-T7 + 0.5% Cu aluminium alloy commonly used in modern internal combustion engine cylinder heads. Samples extracted from the valve bridge areas of the cylinder heads are tested in strain-controlled fatigue tests. Samples are tested at strain rates of 1% s−1 and 10% s−1 at room temperature, 150 and 200 °C. The material exhibits increased isotropic hardening and softening rates and an increased number of cycles to failure at 10% s−1. The strain rate has a dramatic influence on the mean stress development at room temperature. The role of silicon particles in the fracture mechanism is investigated using electron microscopy techniques.

1. Introduction

Cylinder heads are a crucial part of the internal combustion engines and serve to house the channels and valves for the gases flowing through the system, besides sealing the combustion chambers. Owing to their intricate geometry because of the presence of complex flow channels for the engine coolant, lubricating fluid, and the combustion gas, they are often produced by gravity die-casting methods [1]. In the last few decades, aluminium has gradually replaced cast iron in engine cylinder heads. In addition to aluminium cylinder heads being lighter, aluminium alloys in cylinder heads also offer the advantage of high thermal conductivity and increased corrosion resistance compared to their cast iron counterparts [1,2]. As the drive to advance the engine efficiency increases, the operating temperatures have kept increasing with the engine peak temperature reported well above 200 °C in recent times [3,4,5]. Cylinder heads undergo thermomechanical fatigue cycles associated with the engine start–stop cycle, leading to possible failure of thin sections in the cylinder heads that are exposed to steep thermal gradients such as the valve bridge area [3,6,7]. This problem is further aggravated with hybrid powertrains, as the number of such engine start–stop thermomechanical cycles are considerably increased. Reliable numerical models to predict both the structural deformation and thermomechanical fatigue durability of cylinder heads are essential to shorten the development times and reduce developmental costs with the computer-aided engineering (CAE) approach [6,8]. Thus, to develop a better understanding of the continuum deformation and fatigue behaviour of the alloy, it is essential to investigate the effect of strain rate on the deformation and fatigue behaviour. Owing to the significant plasticity associated with the thermomechanical loads in cylinder heads, a strain-based approach is often favoured for application in the industry [9,10].
While pure aluminium is soft, it is often alloyed with elements such as magnesium, zinc, manganese, etc., in various amounts to improve its strength [11]. The castability of the alloy is improved with additions of silicon [1]. A356 primary aluminium alloy (AlSi7Mg0.3) has been used for casting engine cylinder heads owing to its high toughness and good fatigue properties. However, the material exhibits reduced high-temperature strength and creep resistance [12]. Copper additions have been used in recent years to improve the high-temperature strength and the creep properties of the A356 alloy [1,13,14]. The A356 + 0.5 wt % Cu alloy is commonly used in recent generations of cylinder heads [3,4,15]. The alloy is often heat-treated to an over-aged condition (T7) to improve the microstructural and dimensional stability of the component. Phase transformation can otherwise induce dimensional changes in the as-cast structure [1,3].
There are numerous works highlighting the effects of strain rate on the cyclic deformation and fatigue behaviour of different commercially used aluminium alloys in the literature. Pinto et al. [3] made a comparative study on the fatigue behaviour of three aluminium alloys including AS7GU alloy (that was similar in composition to the A356 + 0.5 wt % Cu alloy of interest in this study) and observed that it exhibited a superior ductility and high cycle fatigue behaviour compared to the other tested aluminium alloys along with a lower scatter in the number of cycles to failure owing to the lower copper content in the alloy (0.5%). Azadi [16] studied the effect of strain rates and mean strains on the cyclic deformation behaviour of two different aluminium-silicon-magnesium alloys, A356 and A357. The author observed that for low cycle fatigue tests at 200 °C and a strain amplitude of 0.4%, the mean strains had no influence on the number of cycles to failure of the A356 alloy. The study also highlights the similar number of cycles to failure for high temperature–low cycle fatigue tests and out-of-phase thermomechanical fatigue tests for similar test strain rates in A357 alloys and suggests isothermal low cycle fatigue tests as an alternative for the more expensive thermomechanical fatigue tests for use in cylinder head design. Fan et al. [17] studied the effect of strain rate on the cyclic deformation behaviour of 333 aluminium alloy (AlSi9Cu3) at room temperature and observed that the cyclic hardening ratio increased with increasing strain rates up to strain rates of 0.25 min−1 and decreased when the strain rate was increased further. Furthermore, characterization of the dislocation structures by the authors using a transmission electron microscope indicate the role of differing dislocation structures and mechanisms in determining the cyclic hardening behaviour of the alloy at various strain rates.
The effect of strain rate on the monotonic deformation behaviour of various alloys has also been extensively documented. Manish et al. [18] studied the effect of strain rate on the compressive deformation behaviour of A356 cast aluminium alloy employing strain rates varying from 10−4 s−1 to 4.9 · 103 s−1. The authors observed increasing yield strength and a decreasing work hardening rate with the increase in strain rates. The lower work hardening rates at higher strain rates are attributed to the higher specimen deformation temperature during the tests associated with the adiabatic nature of the process. On the contrary, they observed that the fraction of damaged silicon particles and their average size were insensitive to strain rates and showed similar patterns throughout. Mi et al. [19] studied the effect of strain rate and temperature on the tensile deformation behaviour of Al-Zn-Mg-Cu alloy. The material was deformed at 340, 380, 420, and 460 °C with three different strain rates of 0.1, 0.3, and 1% s−1. The authors concluded that the flow stresses decreased with decreasing strain rates and increasing temperatures. They quote the longer times available for energy accumulation at lower strain rates and the improved thermal activation of the dislocation motion and annihilation at elevated temperatures as contributing factors for such behaviour. However, they saw no clear trends on the effects of strain rate on the ductility of the material. Korbel et al. [20] studied the effect of strain rate on the dislocation structures of pure polycrystalline aluminium under monotonic loading and concluded that increasing the strain rate increased the flow stress and reduced the size of the dislocation cell structures. This effect was attributed to the reduced thermally activated relaxation processes associated with the higher strain rates. Consequently, they observed reduced dislocation density at lower test strain rates, and therefore, lower flow stresses. Numerous studies draw attention to the strain rate sensitivity of the deformation behaviour of some of the commercially used aluminium alloys [21,22,23], highlighting the importance of taking such rate-dependent behaviour into account for developing reliable numerical models.
While several studies investigate the strain rate effects on the monotonic deformation behaviour of the A356 family of alloys, there is a dearth of relevant information when it comes to studying the strain rate effects on the cyclic deformation behaviour of the newer generation of increased copper containing A356-T7 + 0.5% Cu alloys at both elevated temperatures and with different relevant strain rates. One expects relatively low deformation rates associated with the thermal load cycles in a cylinder head and long accumulated dwell times, thus involving the influential role of time-dependent processes such as creep/relaxation and ageing phenomena in determining the deformation behaviour of the material [6,24]. This study aims to bridge the knowledge gap by investigating the effect of strain rate on the cyclic deformation behaviour of the A356-T7 + 0.5% Cu alloy at elevated temperatures, as it provides crucial material deformation and fatigue life data to make informed engineering decisions to reliably design a cylinder head using CAE methods. The study employs material extracted directly from the valve bridge areas of the cylinder heads of internal combustion engines (ICE), offering an accurate representation of the complex microstructure observed in cylinder heads and that which is difficult to replicate in custom cast test specimens [24]. However, this study does not consider the effect of variation in the manufacturing processes and the associated changes in microstructure, which could in turn affect the deformation and fatigue behaviour of the alloy. Instead, the microstructure from a constant set of process parameters and manufacturing conditions are considered for investigation to minimize the influence of microstructural variations on the strain rate effects.

2. Materials and Methods

2.1. Sample Extraction for Testing

A cylinder has a complex microstructure owing to the variations arising from different cooling rates at different sections of the cylinder head structure and the differences arising from the industrial cylinder head production process [24,25]. It is difficult to replicate such complex variations of the microstructure in lab cast specimens for testing [26]. To study the strain effects on the deformation behaviour of the A356-T7 + 0.5% Cu alloy used in the cylinder heads with a representative microstructure, samples for testing are extracted directly from Volvo Cars’ inline VEP4 4-cylinder (Volvo Cars, Gothenburg, Sweden) petrol engine cylinder heads. The samples for testing are extracted from the valve bridge areas that are susceptible to thermomechanical fatigue failures [6,27], as illustrated in Figure 1. Four test specimens are extracted from each cylinder head as the samples are located such that the test volume corresponds to the central valve bridge areas of the fire deck of the individual cylinders.

2.2. Material and Microstructure

The cylinder head is cast with A356-T7 + 0.5% Cu aluminium alloy, and the average chemical composition of the alloy from two measurements made employing a modified ASTM E1251 [28] measurement method is summarized with the most significant alloying elements in Table 1. The method used an optical emission spectroscopy-based analysis to determine the chemical composition of the aluminium alloy. The average secondary dendrite arm spacing (SDAS) was measured at 31 µm using the mean linear intercept method on multiple groups of aligned secondary cells. The dendritic nature of the microstructure of the material can be observed in the optical microscope image presented in Figure 2. The variation of the SDAS was within 5%, with the spacing lower in regions closer to the mould wall where the cooling rates are higher. The phase composition in the alloy can be broadly classified into primary α-aluminium, the silicon-rich eutectic phase, and the secondary phase precipitates. A scanning electron micrographic image indicating the different phases in the alloy is presented in Figure 3.

3. Test Methods

3.1. Sample Geometry and Test Setup

The samples for testing are machined following the ASTM E606/E606M standard for strain-controlled fatigue testing [29], and the geometry of the samples used for testing is as shown in Figure 4. The samples are ground and polished to obtain a mirror surface finish.
The strain-controlled fatigue tests were performed using an Instron 8501 servo-hydraulic machine (Instron, Norwood, MA, USA) equipped with an Instron 3119-407 forced convection-based temperature chamber. Two K-type thermocouples in the temperature chamber were used together with a Eurotherm 2408 controller to achieve and sustain the target test temperatures. The sample temperature during the tests was monitored using an additional K-type thermocouple mounted on the specimen surface. Before the commencement of the high-temperature isothermal tests, samples were heated to the target temperatures, and the samples were held at a zero load condition using force control for a stabilization dwell-time of 3 hours to enable the test setup to reach thermal equilibrium, as illustrated in Figure 5. This rigorous thermal stabilization procedure allows us to minimize the interference between the equipment thermal expansion associated with the heat-up procedure and the experimental measurements. The strain in the test material was measured using an Instron 2620-603 axial clip-on dynamic extensometer (Instron, Norwood, MA, USA) mounted in the gauge section of the test samples. Further aspects of the test method and setup are detailed in our previous research work [30].

3.2. Test Plan

To study the effect of strain rate on the deformation behaviour of the A356-T7 + 0.5% Cu alloy, two series of tests were run, all at a total strain amplitude of εamp: 0.4% and a strain ratio Rε = −1, with two different strain rates of 1% s−1 and 10% s−1. All the tests in this study were run with a “total strain” control and a constant test frequency calculated to impose the prescribed strain rates. The tests were run at room temperature (RT), 150 and 200 °C with two replicas at each temperature. The test plan is summarized in Table 2. A triangular load waveform is used to apply the loads, and the tests are run to failure. A sample is considered to have failed when the stress amplitude drops below 75% of the peak stress developed during the 25th strain load cycling when “stabilization” is considered to have occurred. The results are visualized as averaged stress response between the two replicas using normalized lifetime, Ni/Nf, where Ni is the cycle number and Nf is the number of cycles to failure.
The tests with the lower strain rate of 1% s−1 were run continuously until failure without any pauses in between. The tests with the higher strain rate of 10% s−1 were run with a 120 s pause with a ‘no load’ force control after every 15 strain load cycles to dissipate the heat generation associated with the high-frequency loading and are illustrated in Figure 6. Previous studies on the alloy have shown that the effect of dwell times on continued test results is insignificant [31].

4. Results

4.1. Peak and Trough Cyclic Stress Evolution

The effect of strain rate on the tensile and compressive peak stress evolution for the various tested temperatures and strain rates is presented in Figure 7 using the averaged data from two test replicas. The material exhibits a peak stress asymmetry between the peak tensile and compressive stress for each load cycle at all temperatures and strain rates. The peak stresses developed in compression are higher than the peak tensile stresses for the completely reversed strain-controlled tests except for the higher strain rate tests at the room temperature. The room temperature tests with the strain rate of 10% s−1 start with the peak compressive stress being higher than the peak tensile stress for the strain load cycling. As the load cycling progresses, we observe a gradual increase of the peak tensile stress with the mean stress moving from compression to tension. This gradual increase of the peak tensile stress and the corresponding reduction in magnitude of the compressive peak stress is more pronounced after about 100 strain load cycles. This shift in the peak stress asymmetry continues up until failure of the test specimen.

4.2. Cyclic Stress Amplitude Evolution

The effect of strain rate and temperature on the true stress amplitude development is presented in Figure 8 using the averaged data from two test replicas. The material exhibits cyclic hardening at room temperature and cyclic softening at elevated temperatures. The cyclic softening rate at the elevated temperatures is stronger with increasing temperatures. While the stress response is higher for lower strain rates at room temperature, the stress response at the highest tested temperature, 200 °C, shows a higher stress response at higher strain rates. This could be an effect of stress relaxation in the material at higher temperatures, which become more significant at lower strain rates.

4.3. Mean Stress Evolution

The effect of the strain rate on the mean stress evolution in cyclic loading for various temperatures is summarized in Figure 9 using the averaged data from two test replicas. The stress asymmetry is biased towards compression, giving a compressive mean stress when the cyclic loading commences for all the temperatures and strain rates. The mean stress evolves towards 0 MPa with subsequent strain load cycles, indicating a movement towards symmetric tensile and compressive peak stress development. The mean stress skews towards tension for the room temperature tests for the tested strain rates. A steep increase in the mean stress by 2 MPa at about 25% of the life of the specimen is observed for the room temperature tests with the strain rate of 1% s−1, but it stabilizes rapidly and remains stable below +5 MPa up until specimen fracture. However, the higher tested strain rate of 10% s−1 gives a dramatic effect on the evolution of the mean stress at room temperature with the magnitude of mean stress reaching values above 25 MPa. While this does not affect the number of cycles to failure of the two tested samples at 10% s−1, more tests are required to draw a definitive conclusion on the effect of increased tensile cyclic stress on the number of cycles to failure.

4.4. Cyclic Yield Strength Evolution

The effect of strain rate on the evolution of cyclic tensile yield strength for the various tested temperatures is summarized in Figure 10 using the averaged data from two test replicas. The yield strength was determined using a plastic strain offset of 0.02%. The material exhibits cyclic isotropic hardening at room temperature for both the tested strain rates. The isotropic hardening or softening is negligible at 150 °C with the change in tensile yield strength limited to ±5 MPa. At the highest tested temperature of 200 °C, the material exhibits isotropic softening with strain load cycling for both the tested strain rates. The lower yield at the higher strain rates could partially be attributed to the higher heat accumulation for the tests with a strain rate of 10% s−1 compared to the tests at 1% s−1.

4.5. Effect of Strain Rate on Yield Strength Asymmetry

Strain rate is observed to have a profound influence on the nature of the yield strength asymmetry in A356-T7 + 0.5% Cu aluminium alloys, especially at room temperature, as can be observed in Figure 11 and Figure 12. The yield strength for all the cyclic loads has been determined using an offset of 0.02% plastic strain. For the tests with a strain rate of 1% s−1, the yield in compression is higher than the yield in tension through the number of cycles until failure for all the temperatures. For the room temperature tests with the strain rate of 10% s−1, this characteristic is not observed. Here, the cyclic yield in tension is higher than in compression through most of the life. Figure 12 presents the yield strength asymmetry for all the room temperature tests in more detail. It can be observed that for the test with a strain rate of 10% s−1, initially, the yield in compression is higher than in tension as with all the other tests. After about 100 strain load cycles, this stress asymmetry gradually changes, with the yield in tension increasing at a steeper rate and being higher in magnitude than the yield in compression. However, this effect is not observed at elevated temperatures of the higher strain rate test of 10% s−1.

4.6. Effect of Strain Rate on Cyclic Plastic Strain Evolution

An alternate way to evaluate the isotropic hardening is to consider the plastic strain amplitude evolution with the cyclic loading. Figure 13 presents the evolution of plastic strain amplitude averaged between replicas for the tested strain rates and temperatures. Here, the plastic strain amplitude is estimated to be half the width of the hysteresis loop measured at zero stress. The plastic strain amplitude decreases with successive strain load cycles at room temperature for both the tested strain rates. The room temperature tests with a strain rate of 10% s−1 exhibit a higher isotropic hardening rate and do not stabilize after the initial cycles in contrast to the room temperature tests with a strain rate of 1% s−1, which stabilize after about 30% of their lifetime and up until failure. For the tests at 150 °C, the material exhibits insignificant isotropic hardening for both the tested strain rates, with a mild hardening observed for the both the tested strain rate and followed subsequently by cyclic softening up until failure. However, the isotropic softening behaviour is quite apparent for the tests at 200 °C. The tests at 200 °C with the strain rate of 10% s−1 exhibit a significantly higher softening rate compared to the tests with a strain rate of 1% s−1.

4.7. Effect of Strain Rate on the Number of Cycles to Failure
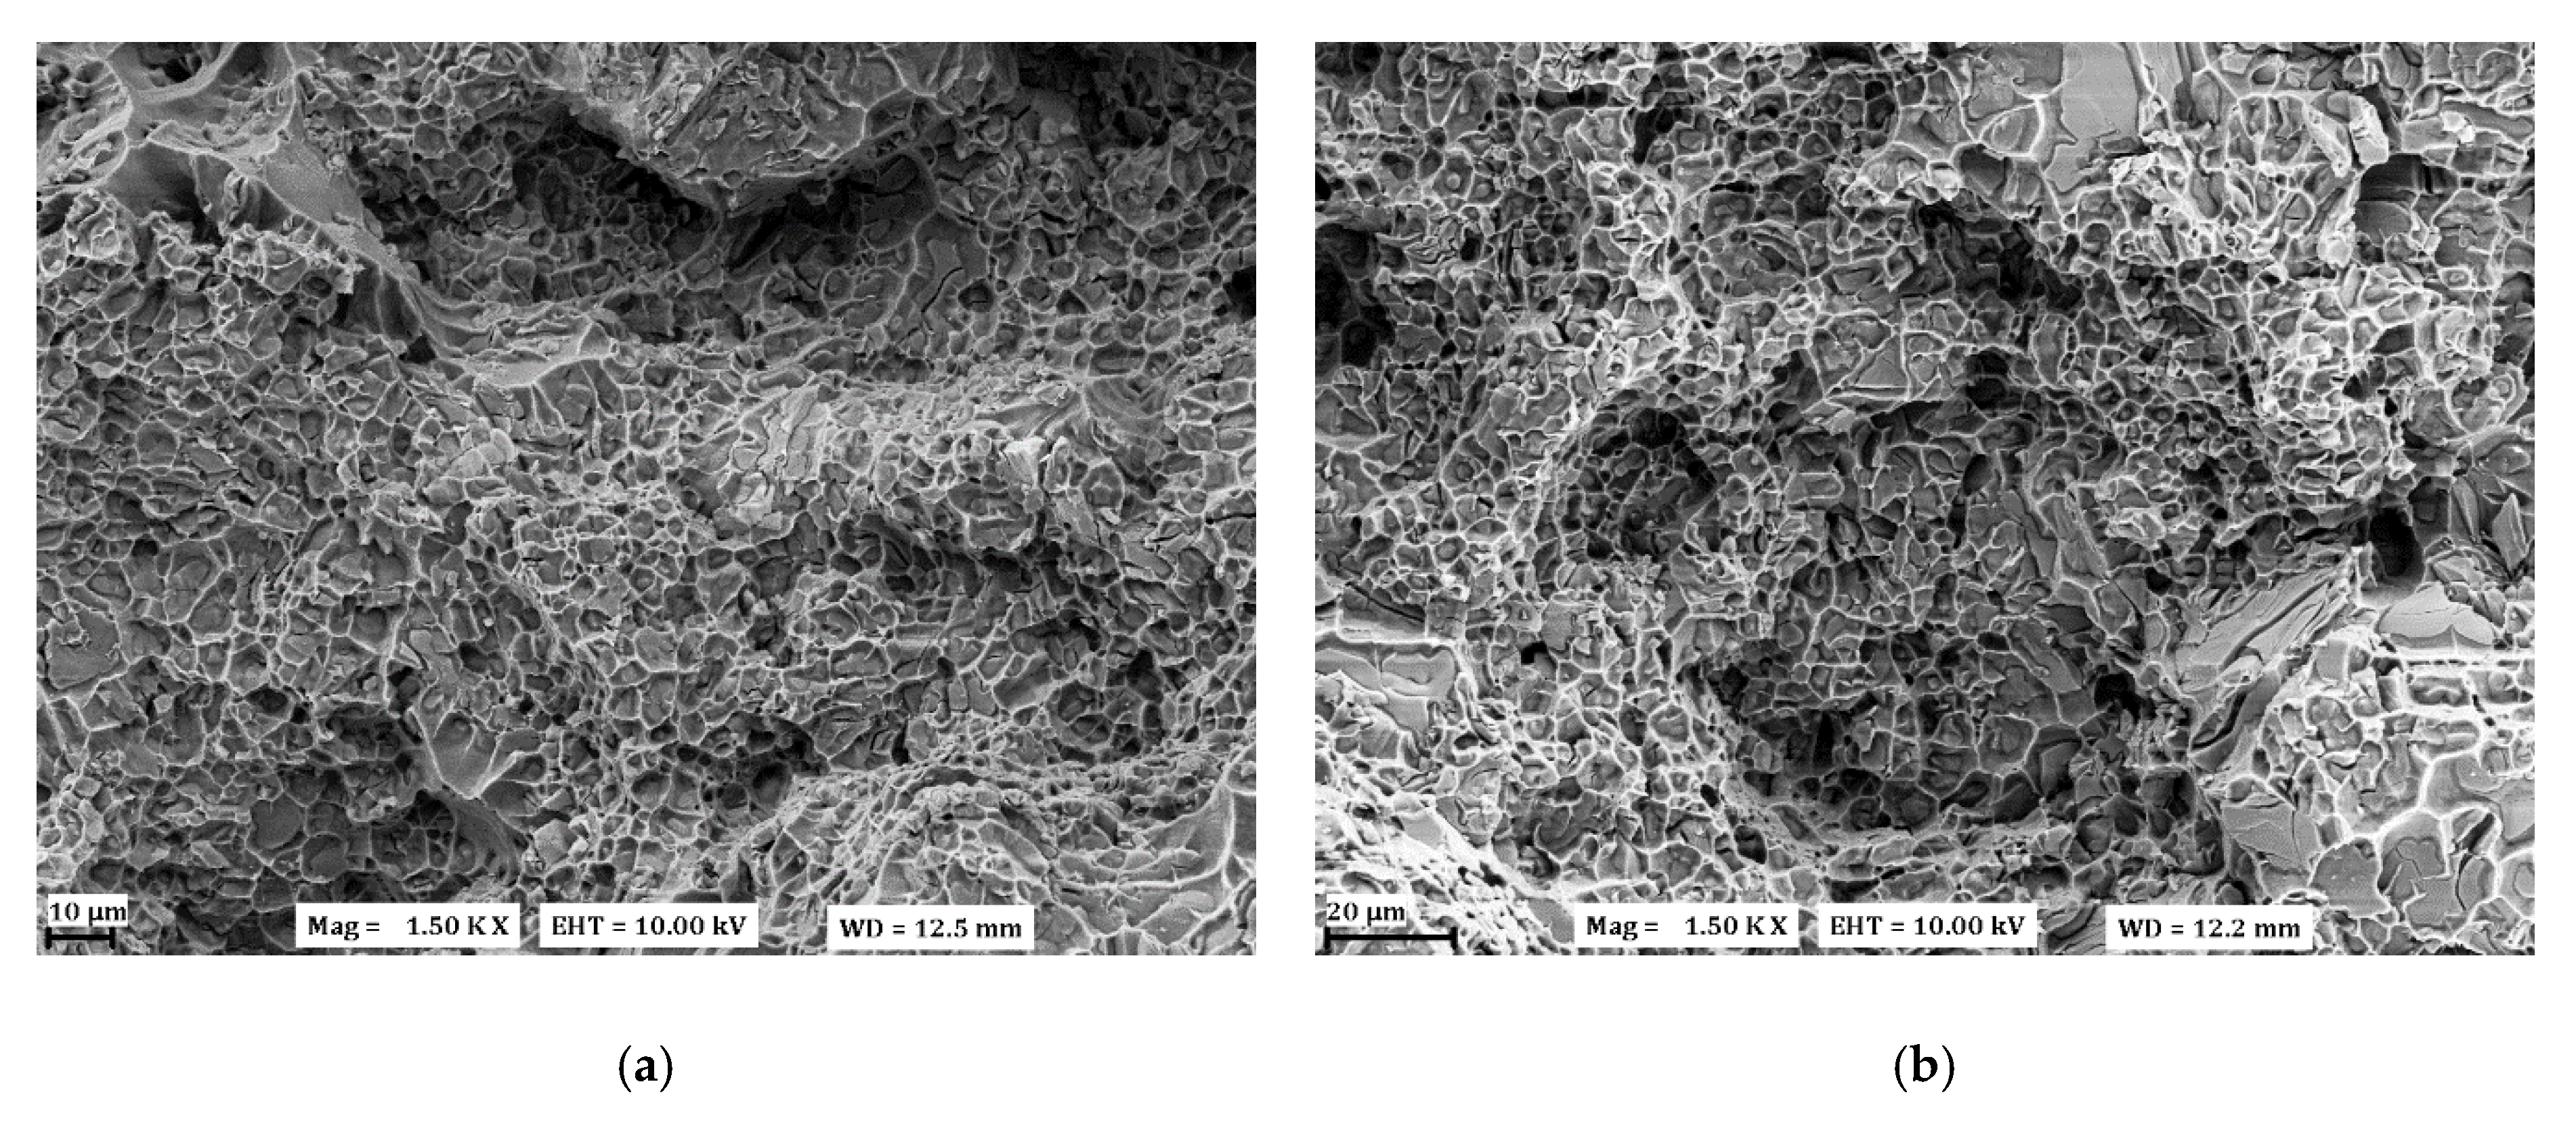
The number of cycles to failure for the tested replicas at various strain rates and temperatures is summarized in Figure 14. On average, the number of cycles is higher for the tests with the higher strain rate of 10% s−1. The lower number of cycles to failure at the lower strain rate at the different tested temperatures exhibits a correlation to the increased plastic strains for the corresponding tests, as can be observed in Figure 13. The difference in the number of cycles to failure is lower at room temperature than at the highest tested temperature of 200 °C, where the samples show a marked difference in the durability of the material with the change in strain rates.

4.8. Fractography

Electron microscope images of the fracture for the various tested strain rates at room temperature (RT) and at 200 °C are presented in Figure 15. The images were taken from the ‘unstable’ crack growth regions of the fracture surface away from the crack initiation point and the fatigue striations. No significant differences in the fracture morphology were observed when comparing the extremes regarding tested temperatures and the strain rates. The rapid crack growth region exhibited the typical ductile type fracture morphology, as can be observed in the presented figures below.

5. Discussion

The variation in the amount of heat dissipation associated with the deformation of the material at various strain rates can play a meaningful role in influencing the flow stresses in the material [9,32]. The overall temperature variation during testing was measured using a K-type thermocouple and was observed to be within the limits of the error of the measuring thermocouple (±2.5 °C) with respect to the target test temperature for the low strain rate tests (1% s−1), and the temperature deviation was measured to a maximum of +5 °C of the target temperature for the higher strain rate tests (10% s−1). At higher strain rates, there is insufficient time for the heat generated to dissipate, leading to an adiabatic thermal state during the strain cycling, which leads to an increase in the temperature of the test volume and can be viewed as a minor source of error.
The strain rate has a profound influence on the cyclic stress response of the A356-T7 + 0.5% Cu aluminium alloy at room temperature. The most notable effect is the material exhibiting a significant increase in the mean stress development through the life of the component for a higher strain rate of 10% s−1 at room temperature. Begum et al. [33] observe a similar phenomenon in AZ31 magnesium alloy samples that were extruded, but with the alloy having a hexagonal close packed (HCP) crystal structure unlike the tested A356 aluminium alloy. The AZ31 alloy exhibited a rapid increase in the mean stress development at higher strain rates of 8 ∙ 10−2 s−1 and 1 ∙ 10−2 s−1 in comparison with the lower tested strain rate of 1 ∙ 10−3 s−1. The authors observed that the differences in both the mean stress development rate and magnitude were large in the initial phases of the strain load cycling at between 10% and 20% of the total life of the respective samples. Upon further cyclic loading, the mean stress development rate stabilized for all tested strain rates, all the while retaining the differences in the mean stress magnitudes. A similar phenomenon is observed here with the tested A356-T7 + 0.5% Cu alloy where the mean stress development rate is higher at higher strain rates in the initial phases of the strain load cycling, but stabilization is observed after about 40% of the recorded life for both the lower and higher strain rates while retaining the differences in the magnitudes of the mean stress development through the life of the samples. A more detailed electron microscopic investigation is needed to understand the changes in the microstructure or dislocation structure that induce such behaviour. The strain rate also has an effect on the isotropic hardening/softening behaviour, with the material exhibiting a higher isotropic hardening rate at room temperature and a higher isotropic softening rate at 200 °C for the tests with a strain rate of 10% s−1, as can be observed from the change in plastic strain amplitudes with cyclic loading as presented in Figure 13. High-temperature fatigue tests of A356 alloy at 200 °C by Azadi [16] indicated a similar increased softening behaviour of the alloy for the completely reversed tests. At 150 °C, the material exhibits insignificant isotropic hardening at both tested strain rates. Manish et al. [18] observe in their studies the higher flow stresses in A356 aluminium alloy with lower strain rates. This behaviour is associated with the higher rate of dislocation generation at lower strain rates. However, reduced yield strength is observed at lower strain rates. Although similarly higher flow stresses are observed in the A356-T7 + 0.5% Cu alloy tested at lower strain rates, the cyclic yield strength at higher strain rates is not necessarily higher in magnitude than the corresponding lower strain rate tests, as can be observed in Figure 8 and Figure 10.
The fracture surface microscopic examination revealed typical dimpled features away from the crack initiation points, where unstable crack growth is expected. Fan et al. [17] observe a similar dimple morphology in the fatigue fracture surface of 333 aluminium alloys. Tucker et al. [34] observed that the number of such void features increased with the increasing strain rate while examining the fracture surface of A356-T6 alloy that was deformed monotonically with strain rates ranging from 0.1% s−1 to 1 ∙ 105% s−1. The authors also report a reduction in ductility of the A356-T6 aluminium alloy with increasing strain rates. However, for the tested A356-T7 + 0.5% Cu alloy under cyclic loading, we do not observe any significant differences in the fracture morphology for the strain rates tested (1% s−1 to 10% s−1).

5.1. Effect on Number of Cycles to Failure

Studies by Azadi [16] showed that for A356 cast aluminium alloys, the strain ratio had no significant influence on the low cycle fatigue (LCF) lifetime of the alloy. For completely reversed fatigue tests at 200 °C, the material had an LCF lifetime of 2317 ± 663 cycles at a loading frequency of 1% s−1. For the A356-T7 + 0.5% Cu alloy investigated in this study, at the identical temperature, strain amplitude, strain ratio (Rε = −1), and strain rate (1% s−1), we get an average fatigue life of 984 ± 84, and when the strain rate is increased to 10% s−1, we get an increased number of cycles to failure, with a fatigue life of 1672 ± 78 cycles. The number of cycles to failure of each sample for the tested conditions is summarized in Figure 14. The tested material exhibits a clear increase in the number of cycles to failure at higher strain rates for identical load and test temperature conditions. The study by Azadi [16] showed an increase in the fatigue lifetime of A357 alloy with increasing strain rates owing to reduced cyclic plastic strain amplitudes. A similar behaviour is observed for the tested A356-T7 + 0.5% Cu alloy, as we observe higher plastic strain amplitudes at lower strain rates, as can be observed in Figure 13. The reduced plastic strains and the amplified heat generation in the test volume at the higher strain rates could potentially explain the increased number of cycles to failure exhibited by the tested A356-T7 + 0.5% Cu alloy at the higher test strain rates.

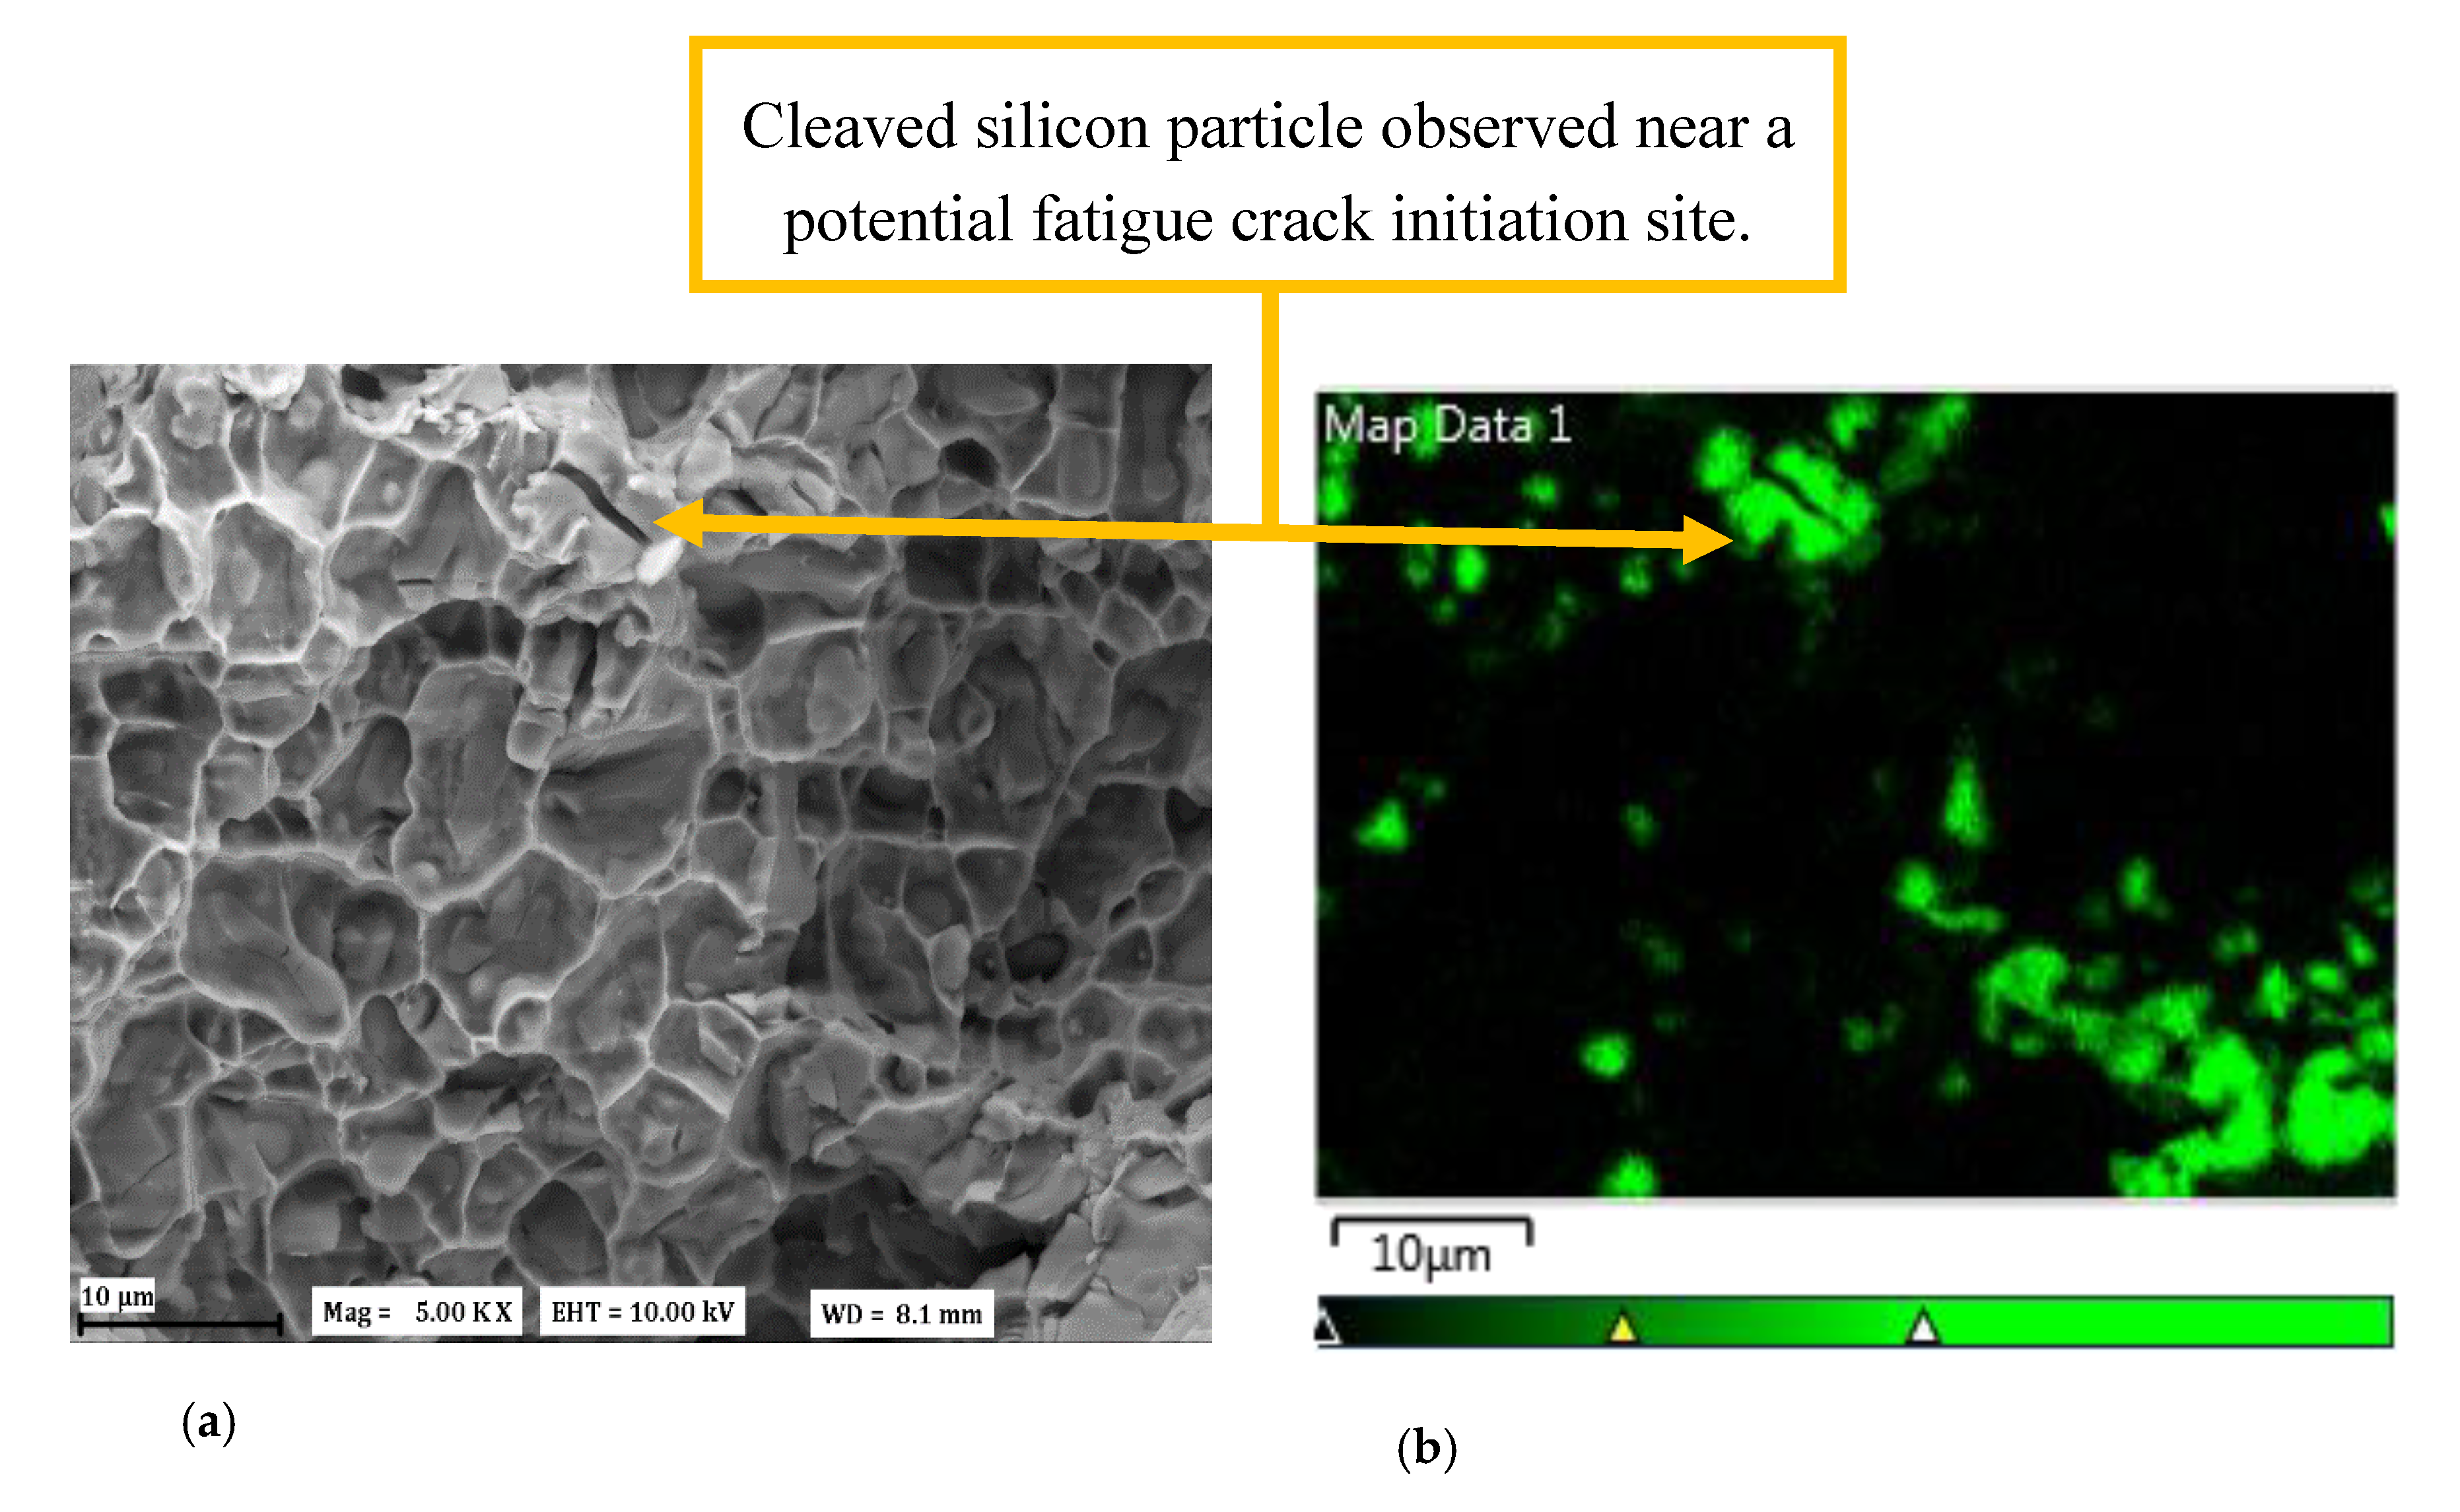
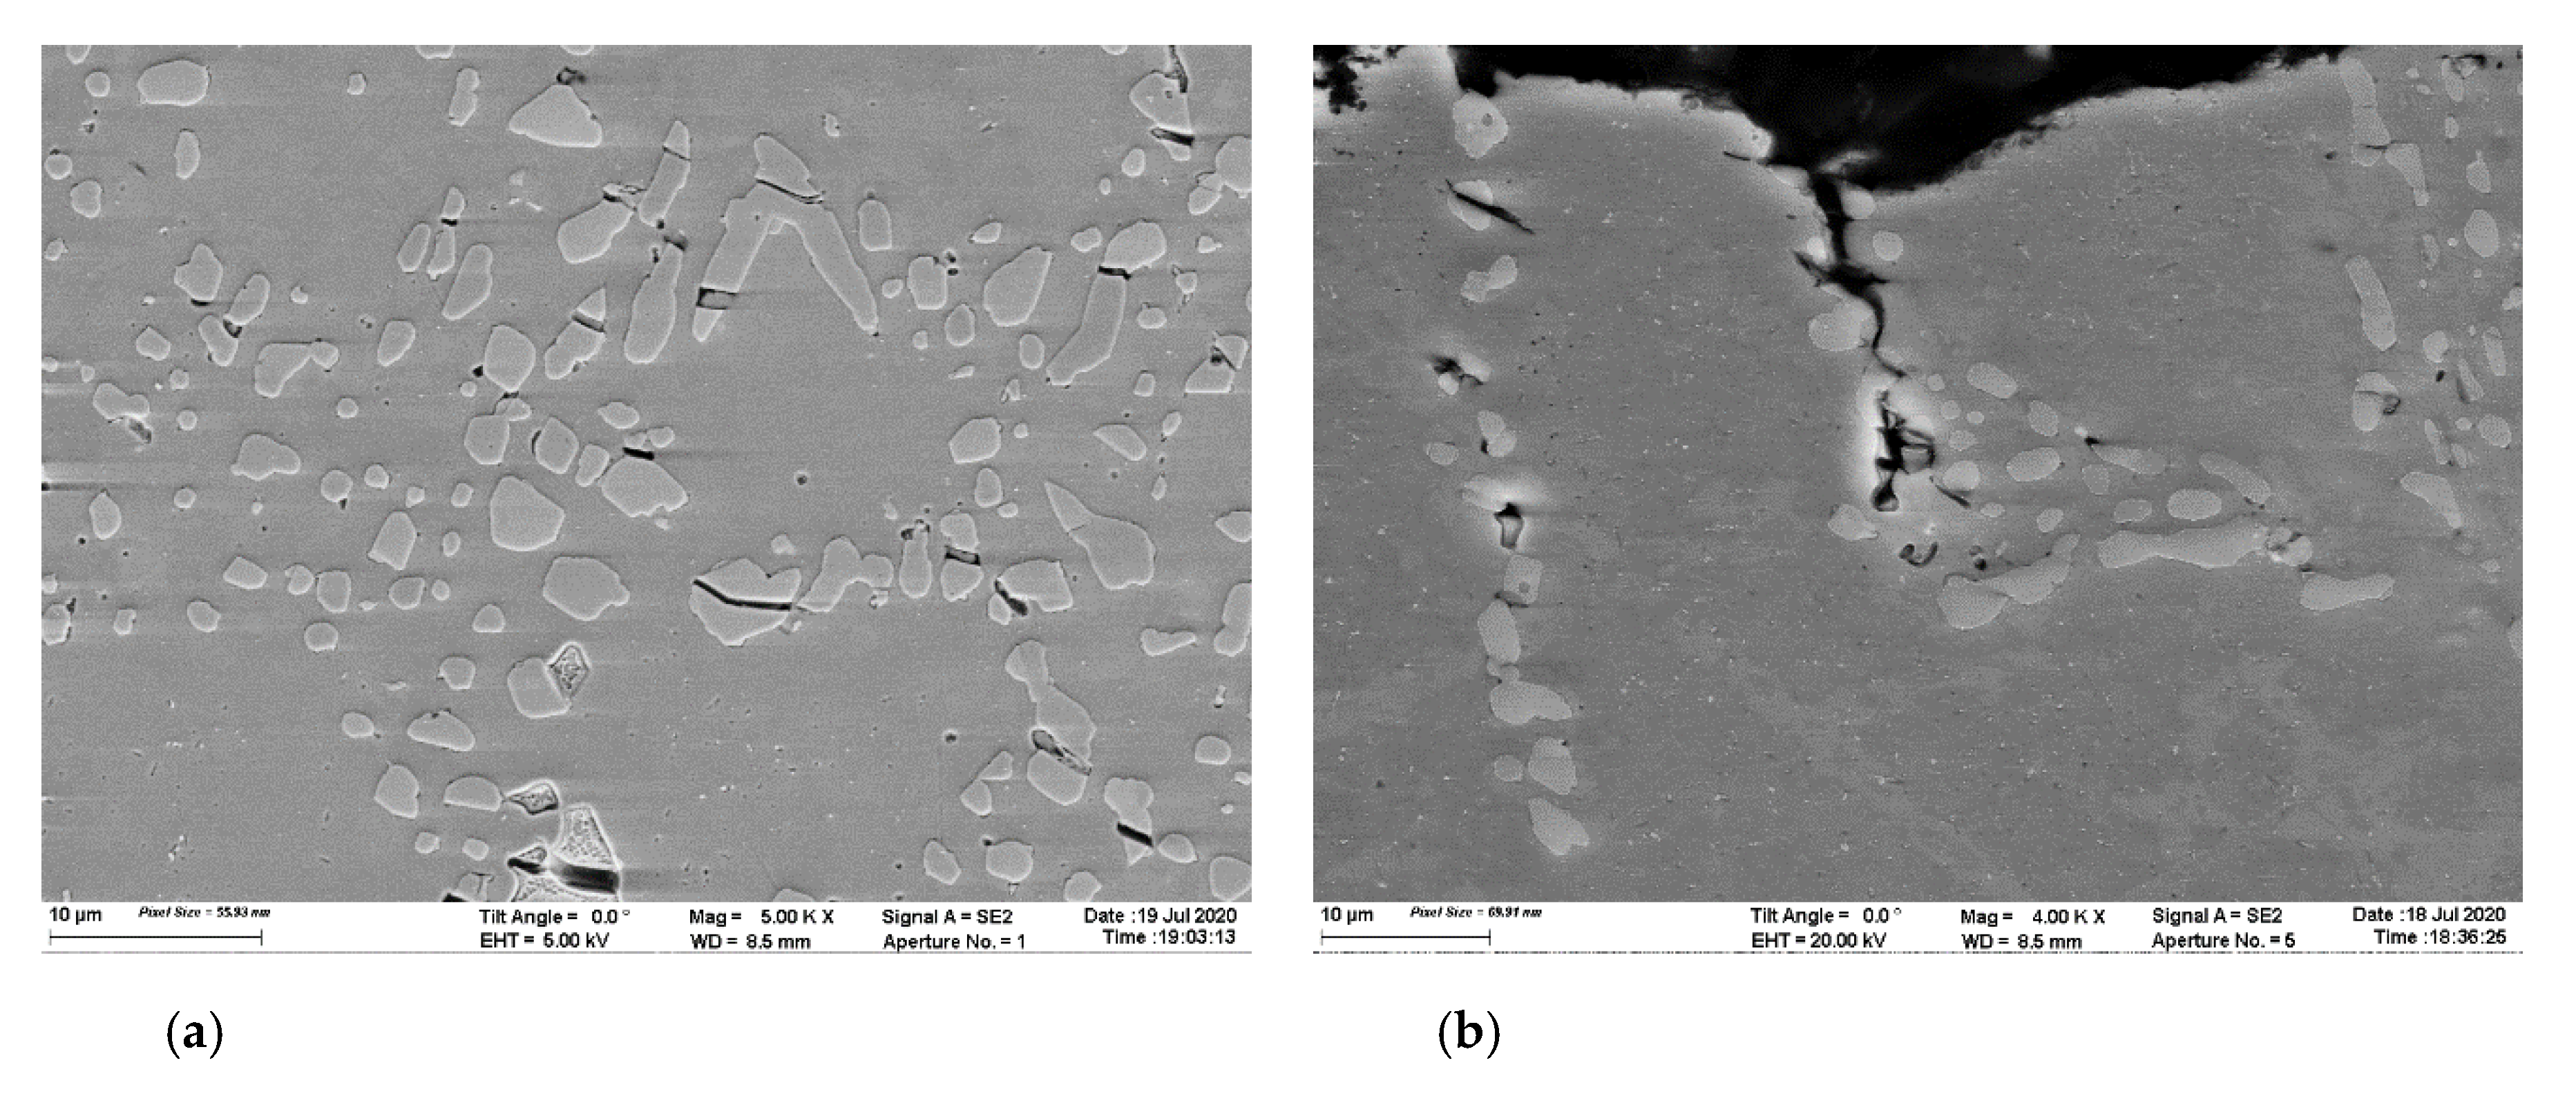
5.2. Fractography—Role of Shrinkage Porosity and Cleaved Silicon Particles in Fatigue Crack Initiation

Fatigue cracks in cast aluminium alloys often tend to initiate from shrinkage or gas porosities [17,35]. Furthermore, the damage evolution in cast aluminium alloys such as A356 is also dictated by the size and shape of the silicon particles and secondary phase precipitates [36]. In such cases, the damage process is often strongly governed by the fracture and debonding of the complexly shaped silicon precipitates in the alloy [37,38,39]. Silicon particles fracture, and voids form and grow around these fractured Si particles; when they subsequently coalesce, cracks form and propagate, leading to eventual material failure under deformation [36]. Fan et al. [17] observed that fatigue cracks often initiated from pores, cracked silicon particles, or iron-based intermetallics, causing fatigue failure in 333 aluminium alloys. The role of porosities in fatigue crack initiation in the tested A356-T7 + 0.5% Cu cast aluminium alloy is highlighted in our prior research work [35]. In this study, the role of cracked silicon and intermetallic particles, in cases where the fatigue fracture process does not visibly initiate from such pores, is investigated in detail to highlight the potential role that such cracking of silicon and intermetallic particles could play in the fatigue crack initiation process. A scanning electron microscope image of the fracture surface, taken near a potential crack initiation point of a test at room temperature conducted with a strain rate of 10% s−1 is shown in Figure 16a, and the corresponding energy dispersive X-ray spectrometer (EDS) map showing the distribution of silicon in the alloy system is presented in Figure 16b. Further examination of the fracture surfaces indicates that the crack originated from either the shrinkage porosities or, in some cases, from cleaved, large silicon particles, highlighting the importance of refining the silicon particle size and minimizing the shrinkage porosity in the cast structure. Further investigations of crack networks from sections perpendicular to potential crack initiation sites are highlighted in Figure 17 below.
Similar observations are made by Manish et al. [18] in their study, where they observe the crucial role that the size of the silicon particles plays in the fracture process. The study also demonstrates the strain rate insensitivity of the damage initiation mechanisms, where the cracks invariably initiate from large silicon particles in the microstructure under deformation. Identical behaviour in the tested A356-T7 + 0.5% Cu alloy with the presence of a number of such cracked “large” silicon particles can be observed in Figure 17a, a scanning electron microscope (SEM) image taken from a vertically sectioned test volume near the fracture surface of a room temperature test with the strain rate of 10% s−1. This cracking of silicon particles is often attributed to the deformation incompatibility of the plastically deforming α-Al phase and the hard, brittle silicon and other intermetallic phases in the microstructure. Often, a decohesion of the interface between the silicon phases and the soft matrix material was also observed in 333 aluminum alloys that, in addition, led to the creation of microcracks. These microcracks from different sources that are adjacent to each other coalesce with continued loading and accumulate damage in the plastically loaded material section [17]. A similar behaviour is observed upon the fractographic examination of the tested A356-T7 + 0.5% Cu alloy, indicating the prevalence of similar mechanisms even at lower silicon and copper contents. Figure 17b shows an additional SEM image from a polished cross-section close to a potential crack initiation point observed in the fracture surface and sliced perpendicular to the loading direction, showing the coalescence of the micro-cracks around the eutectic silicon network and secondary phase precipitates of the tested A356-T7 + 0.5% Cu alloy at room temperature test with a strain rate of 1% s−1.

6. Conclusions

The effect of strain rate at various temperatures on the cyclic strain-controlled fatigue tests of A356-T7 + 0.5% Cu alloy used in internal combustion engine cylinder heads was studied, and the following conclusions can be drawn:
  • The influence of the strain rate on the cyclic peak stress development is minimal and exhibits no specific pattern at the tested temperatures and strain rates.
  • The strain rate has a significant influence on the development of cyclic mean stress, especially at room temperature, with the mean stress changing by over 30 MPa, moving from compression initially to tension with subsequent cycling for the tests at 10% s−1.
  • The higher strain rate has a similar influence on the yield strength asymmetry, with the yield in tension showing an increase over the yield in compression at room temperature. For all the other tested temperatures, the yield in compression is higher than the yield in tension for both the tested strain rates of 1% s−1 and 10% s−1.
  • The material exhibits steeper isotropic hardening changes at higher strain rates, with the material hardening at room temperature and softening isotropically at 200 °C. The material exhibits insignificant changes to its yield surface at 150 °C for both the tested strain rates.
  • The material exhibits an increased number of cycles to failure at higher strain rates, which could be explained partially by the adiabatic nature of the high strain rate tests and the associated higher heat accumulation in the material during deformation.
  • Fractographic investigation of the fracture cross-section highlights the potential role of eutectic silicon particles and hard intermetallic phases on the crack initiation process besides the porosities, which tend to play a more dominant role in fatigue crack initiation in cast aluminium alloys [35]. The larger precipitates are preferentially cracked, highlighting the importance of refining the silicon particles and minimizing the shrinkage porosity.

Author Contributions

Conceptualization, E.N., J.A., S.E. and C.P.; methodology, E.N., J.A., S.K.M., S.E. and C.P.; software, E.N.; validation, S.E.; investigation, E.N., S.K.M.; resources, J.A., S.E. and C.P.; data curation, E.N.; writing—review and editing, E.N. and J.A.; visualization, E.N.; supervision, J.A. and C.P.; project administration, S.E.; funding acquisition, S.E. All authors have read and agreed to the published version of the manuscript.

Funding

This research was funded by Sweden’s Statens Energimyndighet—Energi och Miljö under the project: Utveckling av Analysmodeller för Termomekanisk Utmattning, Energimyndigheten: 37807-1, and the cylinder heads for testing were provided by Volvo Car Corporation.

Acknowledgments

The authors would like to gratefully acknowledge the experimental help provided by Lic. Eng. Adrianna Lozinko, Chalmers University of Technology, Sweden, with the fractographic analysis. The equipment for testing and research was provided by Chalmers University of Technology, Gothenburg, Sweden.

Conflicts of Interest

The authors declare no conflict of interest and the funders had no role in the design of the study; in the collection, analyses, or interpretation of data; in the writing of the manuscript; or in the decision to publish the results.

Data Statement

The raw/processed data required to reproduce these findings cannot be shared at this time as the data also forms part of an ongoing study.

References

  1. European Aluminium. Aluminium Automotive Manual. Available online: https://www.european-aluminium.eu/resource-hub/aluminium-automotive-manual/ (accessed on 12 March 2020).
  2. Garat, M.; Laslaz, G. Improved aluminium alloys for common rail diesel cylinder heads. Trans. Am. Foundry Soc. 2007, 115, 1–8. [Google Scholar]
  3. Engler-Pinto, C.C.; Lasecki, J.V.; Boileau, J.M.; Allison, J.E. A comparative investigation on the high temperature fatigue of three cast aluminum alloys. In Proceedings of the SAE 2004 World Congress & Exhibition, Detroit, MI, USA, 8–11 March 2004. [Google Scholar]
  4. Fuchs, H.; Wappelhorst, M. Light metal materialsLeichtmetallwerkstoffe für hochbelastete Motorblöcke und Zylinderköpfe. MTZ Worldw. 2003, 64, 36–39. [Google Scholar] [CrossRef]
  5. Smith, T.J.; Maier, H.J.; Sehitoglu, H.; Fleury, E.; Allison, J. Modeling high-temperature stress-strain behavior of cast aluminum alloys. Metall. Mater. Trans. A Phys. Metall. Mater. Sci. 1999, 30, 133–146. [Google Scholar] [CrossRef]
  6. Thomas, J.J.; Verger, L.; Bignonnet, A.; Charkaluk, E. Thermomechanical design in the automotive industry. Fatigue Fract. Eng. Mater. Struct. 2004, 27, 887–895. [Google Scholar] [CrossRef] [Green Version]
  7. Tabibian, S.; Charkaluk, E.; Constantinescu, A.; Szmytka, F.; Oudin, A. TMF-LCF life assessment of a lost foam casting A319 aluminum alloy. Int. J. Fatigue 2013, 53, 75–81. [Google Scholar] [CrossRef] [Green Version]
  8. Eichlseder, W.; Winter, G.; Köberl, H. Material and fatigue life models for thermomechanical loaded components. Mater. Werkst. 2008, 39, 777–782. [Google Scholar] [CrossRef]
  9. Dowling, N.E. Mechanical Behavior of Materials, 4th ed.; Pearson: London, UK, 2013; ISBN 978-0273764557. [Google Scholar]
  10. Charkaluk, E.; Bignonnet, A.; Constantinescu, A.; Dang Van, K. Fatigue design of structures under thermomechanical loadings. Fatigue Fract. Eng. Mater. Struct. 2002, 25, 1199–1206. [Google Scholar] [CrossRef]
  11. Callister, W.D., Jr. Materials Science and Engineering: An Introduction, 7th ed.; Wiley Publishers: Hoboken, NJ, USA, 2006; ISBN 978-0006970118. [Google Scholar]
  12. Koch, F.; Maassen, F.; Deuster, U.; Loeprecht, M.; Marckwardt, H. Low cycle fatigue of aluminum cylinder heads—Calculation and measurement of strain under fired operation. J. Engines 1999. [Google Scholar] [CrossRef]
  13. Farkoosh, A.R.; Pekguleryuz, M. Enhanced mechanical properties of an Al–Si–Cu–Mg alloy at 300 °C: Effects of Mg and the Q-precipitate phase. Mater. Sci. Eng. A 2015, 621, 277–286. [Google Scholar] [CrossRef]
  14. Farkoosh, A.R.; Javidani, M.; Hoseini, M.; Larouche, D.; Pekguleryuz, M. Phase formation in as-solidified and heat-treated Al–Si–Cu–Mg–Ni alloys: Thermodynamic assessment and experimental investigation for alloy design. J. Alloys Compd. 2013, 551, 596–606. [Google Scholar] [CrossRef]
  15. Seifeddine, S.; Sjölander, E.; Bogdanoff, T. On the role of copper and cooling rates on the microstructure, defect formations and mechanical properties of Al-Si-Mg alloys. Mater. Sci. Appl. 2013, 4, 171–178. [Google Scholar] [CrossRef] [Green Version]
  16. Azadi, M. Effects of strain rate and mean strain on cyclic behavior of aluminum alloys under isothermal and thermo-mechanical fatigue loadings. Int. J. Fatigue 2013, 47, 148–153. [Google Scholar] [CrossRef]
  17. Fan, K.L.; Liu, X.S.; He, G.Q.; Cheng, H.; Zhang, Z. Influences of strain rate on the low cycle fatigue behavior of gravity casting Al alloys. Mater. Charact. 2015. [Google Scholar] [CrossRef]
  18. Dighe, M.D.; Gokhale, A.M.; Horstemeyer, M.F.; Mosher, D.A. Effect of strain rate on damage evolution in a cast Al-Si-Mg base alloy. Metall. Mater. Trans. A 2000, 31, 1725–1731. [Google Scholar] [CrossRef]
  19. Zhou, M.; Lin, Y.C.; Deng, J.; Jiang, Y.Q. Hot tensile deformation behaviors and constitutive model of an Al-Zn-Mg-Cu alloy. Mater. Des. 2014. [Google Scholar] [CrossRef]
  20. Korbel, A.; Swiatkowski, K. The role of strain rate in the formation of dislocation structure and its influence on the mechanical properties of aluminium. Met. Sci. J. 1972. [Google Scholar] [CrossRef]
  21. Chen, Y.; Clausen, A.H.; Hopperstad, O.S.; Langseth, M. Stress-strain behaviour of aluminium alloys at a wide range of strain rates. Int. J. Solids Struct. 2009. [Google Scholar] [CrossRef] [Green Version]
  22. Reyes, A.; Hopperstad, O.S.; Lademo, O.G.; Langseth, M. Modeling of textured aluminum alloys used in a bumper system: Material tests and characterization. Comput. Mater. Sci. 2006. [Google Scholar] [CrossRef]
  23. Djapic Oosterkamp, L.; Ivankovic, A.; Venizelos, G. High strain rate properties of selected aluminium alloys. Mater. Sci. Eng. A 2000. [Google Scholar] [CrossRef]
  24. Megel, M.C.; Bailey, G.E. Material and Process Selection-Cylinder Blocks and Heads. In Encyclopedia of Automotive Engineering; John Wiley & Sons, Ltd.: Hoboken, NJ, USA, 2014; pp. 1–10. [Google Scholar]
  25. Oberreiter, M.; Pomberger, S.; Leitner, M.; Stoschka, M. Validation Study on the Statistical Size Effect in Cast Aluminium. Metals (Basel) 2020, 10, 710. [Google Scholar] [CrossRef]
  26. Koutiri, I.; Bellett, D.; Morel, F.; Augustins, L.; Adrien, J. High cycle fatigue damage mechanisms in cast aluminium subject to complex loads. Int. J. Fatigue 2013, 47, 44–57. [Google Scholar] [CrossRef] [Green Version]
  27. Grieb, M.B.; Christ, H.J.; Plege, B. Thermomechanical fatigue of cast aluminium alloys for cylinder head applications experimental characterization and life prediction. In Proceedings of the Procedia Engineering, Prague, Czech Republic, 6–11 June 2010; Volume 2, pp. 1767–1776. [Google Scholar]
  28. ASTM E1251-17a. Standard Test Method for Analysis of Aluminum and Aluminum Alloys by Spark Atomic Emission Spectrometry; ASTM International: West Conshohocken, PA, USA, 2017. [Google Scholar]
  29. ASTM. ASTM E606/E606M—12: Standard Test Method for Strain-Controlled Fatigue Testing. In ASTM Standards; ASTM International: West Conshohocken, PA, USA, 2019; ISBN 5935522004. [Google Scholar]
  30. Natesan, E.; Eriksson, S.; Ahlström, J.; Persson, C. Effect of temperature on deformation and fatigue behaviour of A356–T7 cast aluminium alloys used in high specific power IC engine cylinder heads. Materials (Basel) 2020, 13, 1202. [Google Scholar] [CrossRef] [PubMed] [Green Version]
  31. Natesan, E.; Meyer, K.A.; Eriksson, S.; Ahlström, J.; Persson, C. Effects of dwell time on the deformation and fatigue behaviour of A356-T7 cast aluminium alloys used in high specific power IC engine cylinder heads. Materials (Basel) 2020, 13, 2727. [Google Scholar] [CrossRef]
  32. Meyers, M.A.; Chawla, K.K. Mechanical Behavior of Materials; Cambridge University Press: Cambridge, UK, 2008; ISBN 9780511810947. [Google Scholar]
  33. Begum, S.; Chen, D.L.; Xu, S.; Luo, A.A. Effect of strain ratio and strain rate on low cycle fatigue behavior of AZ31 wrought magnesium alloy. Mater. Sci. Eng. A 2009, 517, 334–343. [Google Scholar] [CrossRef]
  34. Tucker, M.T.; Horstemeyer, M.F.; Whittington, W.R.; Solanki, K.N.; Gullett, P.M. The effect of varying strain rates and stress states on the plasticity, damage, and fracture of aluminum alloys. Mech. Mater. 2010. [Google Scholar] [CrossRef]
  35. Natesan, E.; Eriksson, S.; Ahlström, J.; Persson, C. Deformation and fatigue behaviour of A356-T7 cast aluminium alloys used in high specific power IC engines. Materials (Basel) 2019, 12, 3033. [Google Scholar] [CrossRef] [Green Version]
  36. Yeh, J.W.; Liu, W.P. The cracking mechanism of silicon particles in an A357 aluminum alloy. Metall. Mater. Trans. A Phys. Metall. Mater. Sci. 1996. [Google Scholar] [CrossRef]
  37. Dighe, M.D.; Gokhale, A.M. Relationship between microstructural extremum and fracture path in a cast Al-Si-Mg alloy. Scr. Mater. 1997. [Google Scholar] [CrossRef]
  38. Lee, F.T.; Major, J.F.; Samuel, F.H. Effect of silicon particles on the fatigue crack growth characteristics of Al-12 Wt Pct Si-0.35 Wt Pct Mg-(0 to 0.02) Wt Pct Sr casting alloys. Metall. Mater. Trans. A 1995, 26, 1553–1570. [Google Scholar] [CrossRef]
  39. Samuel, A.M.; Samuel, F.H. A metallographic study of porosity and fracture behavior in relation to the tensile properties in 319.2 end chill castings. Metall. Mater. Trans. A 1995, 26, 2359–2372. [Google Scholar] [CrossRef]
Figure 1. Illustration of sample extraction from the valve bridge regions of the cylinder heads for fatigue testing.
Metals 10 01239 g001
Figure 2. Optical micrograph of the A356-T7 + 0.5% Cu alloy showing the dendritic nature of the microstructure.
Metals 10 01239 g002
Figure 3. A Scanning Electron Microscopic image revealing the various phases observed in the A356-T7 + 0.5% Cu alloy. The bright region is the primary aluminium matrix, the darker precipitates are the silicon particles in the eutectic regions, while the secondary phase precipitates can be seen as bright “islands” in the microstructure.
Metals 10 01239 g003
Figure 4. Geometry of test bars for mechanical testing prepared in agreement with ASTM standards. (All dimensions are in mm).
Metals 10 01239 g004
Figure 5. Illustration of the high-temperature thermal stabilization of the test equipment.
Metals 10 01239 g005
Figure 6. Strain load cycling with the strain rate 10% s−1 with interspersed ‘no load’ dwell for heat dissipation.
Metals 10 01239 g006
Figure 7. Effect of strain rate on the evolution of peak and trough stress.
Metals 10 01239 g007
Figure 8. Effect of strain rate on the evolution of true stress amplitude.
Metals 10 01239 g008
Figure 9. Effect of strain rate on the evolution of cyclic mean stress.
Metals 10 01239 g009
Figure 10. Evolution of tensile yield strength (RP0.02%) with cyclic loading.
Metals 10 01239 g010
Figure 11. Effect of strain rate on yield strength (RP0.02%) asymmetry in cyclic loading.
Metals 10 01239 g011
Figure 12. Effect of strain rate on yield strength (RP0.02%) asymmetry at room temperature.
Metals 10 01239 g012
Figure 13. Effect of strain rate on the evolution of plastic strain amplitude.
Metals 10 01239 g013
Figure 14. Effect of strain rate on fatigue life, εamp: 0.4%, Rε = −1.
Metals 10 01239 g014
Figure 15. Scanning electron microscope images of the fracture surface taken from regions of unstable crack growth for various test temperatures and strain rates: (a) Room temperature, 1% s−1; (b) Room temperature, 10% s−1; (c) 200 °C, 1% s−1; (d) 200 °C, 10% s−1.
Metals 10 01239 g015aMetals 10 01239 g015b
Figure 16. Analysis of an area near a potential crack initiation site with: (a) A scanning electron microscope image showing a cleaved silicon particle; (b) The corresponding energy dispersive X ray spectroscopy (EDS) map showing the distribution of silicon in the area.
Metals 10 01239 g016
Figure 17. Scanning electron microscope images from perpendicularly sectioned material near a potential crack initiation site showing: (a) Cracked silicon particles; (b) Coalescence of cracks along the silicon rich particles in the eutectic region.
Metals 10 01239 g017
Table 1. Chemical composition of the tested A356-T7 + 0.5% Cu aluminium alloy used to cast the cylinder heads in wt %.
SiCuMgTiFeMnBOthersAl
6.80.530.350.120.100.070.0012<0.05Bal
Table 2. Summary of the test plan (RT, room temperature).
Test SeriesTest TemperaturesLoad LevelsReplicas
Strain rate: 1% s−1RT, 150 and 200 °CεTotAmp: 0.4%
Rε = −1
2
Strain Rate: 10% s1RT, 150 and 200 °CεTotAmp: 0.4%
Rε = −1
2

