Article

Effect of Weld and Surface Defects on the Corrosion Behavior of Nickel Aluminum Bronze in 3.5% NaCl Solution

Department of Materials Science and Engineering, Dalian Maritime University, Dalian 116026, China
*
Author to whom correspondence should be addressed.
Metals 2020, 10(9), 1227; https://doi.org/10.3390/met10091227
Submission received: 7 August 2020 / Revised: 6 September 2020 / Accepted: 10 September 2020 / Published: 11 September 2020
(This article belongs to the Section Corrosion and Protection)

Abstract

:
To study the effect of weld and defects on the corrosion behavior of nickel aluminum bronze (UNS C95810) in 3.5% NaCl solution, the weight loss, X-ray diffraction, optical microscope, scanning electron microscope and electrochemical test of the specimen with weld and defects were investigated. The results show that the presence of weld and defects increases the corrosion rate of bronze. Weld does not change the structure of the corrosion product film, but defects induce a lack of the protective outermost corrosion product in bronze. Weld makes the corrosion product film in the early stage more porous. Defects always produce an increase in the dissolution rate of the bronze.

1. Introduction

Nickel–aluminum bronze (NAB) alloys containing 9–12% (wt.%) aluminum with additions of up to 6% (wt.%) of iron and nickel are among the most important groups of commercial bronze [1]. Aluminum provides higher strength and improves the corrosion resistance and castings/hot working properties [1]. Nickel improves corrosion resistance, strength and stabilizes the microstructure while iron refines grains and enhances the alloy tensile strength [2,3]. A combination of mechanical properties and corrosion resistance is offered by cast aluminum bronzes. Consequently, aluminum bronzes have been widely used for a variety of applications including valves, fittings, ship propellers, pump castings, pump shafts, valve stems and heat exchanger water boxes [3,4,5]. Since aluminum bronzes used for ship propellers, pump, etc., are large enough, some defects are inevitably induced by casting processes. After long exposure times to seawater, some defects and cracks can also be induced by de-alloying, cavitation, stress corrosion cracking, pitting and erosion–corrosion mechanisms [6,7,8,9,10]. For large and clustered defects, they can be repaired in various ways. Ji et al. [11] used the precision pulsed plasma powder surfacing to repair 9-4-4-2 nickel–aluminum bronze, and the repaired bronze could meet production requirements. Keshavarz and Abbasi-Khazaei [12] used friction stir processing to fabricate a layer of nano-sized aluminum oxide on the surface of the nickel–aluminum bronze alloy, thereby significantly improving the corrosion resistance of the alloy. Davoodi et al. [1] applied a multi-pass gas tungsten arc welding on nickel aluminum bronze, showing that the corrosion resistance of weld parts in the marine environment could not be weakened. Tang et al. [13,14] applied laser surface melting and alloying for as-cast manganese nickel aluminum bronze, resulting in the refinement and homogenization of as-cast microstructure, repairing cast defects. Li et al. [15] used TIG welding for as-cast NAB to refine the microstructure for better corrosion performance. Furthermore, for NAB, it may suffer from surface damage under conditions of extreme flow velocity or fluid turbulence [16]. Since the replacement of these parts with exactly the same material is very expensive, welding repair could be an economical method for the restoration of NAB parts [1]. Meanwhile, this method may lead to increased corrosion due to the occurrence of galvanic couples between the weld and base alloy. However, there have been few studies dedicated to the corrosion investigation of weld-repaired NAB alloys.
For small and dispersed defects, they are unavoidable and difficult to repair. Therefore, some NAB parts with small cast defects are put in service, and the effect of the defects on the corrosion behavior of NAB in practical applications should be studied. Unfortunately, there is little literature available on this issue. Therefore, the effect of weld as well as small cast defects on the corrosion behavior of UNS C95810 will be investigated in this paper.

2. Experiment

2.1. Materials

The studied bronze is UNS C95810. For simplicity, the welding repair, casting defect and defect-free specimens were designated by WRS, CDS and DFS, respectively. The measured composition of DFS, WRS, CDS and welding wire used in this investigation are shown in Table 1. For large and clustered defects, two samples of 20 × 25 × 20 mm3 were taken from a large cast ingot and then they were welded, and three specimens of 10 × 10 × 10 mm3 were taken from the welding position, as shown in Figure 1. For small and dispersed defects, three specimens of 10 × 10 × 10 mm3 were taken from the cast ingot (Figure 1) and observed under an optical microscope to determine the presence of defects. For comparison, three defect-free specimens of 10 × 10 × 10 mm3 were also taken from the cast ingot (Figure 1) and observed under an optical microscope to confirm no defects. The microstructures of DFS, WRS and CDS are shown in Figure 2. The microstructures of DFS include α, κII, κIII and κIV phases. In addition to the above phases, there are also β’ phase in WRS. In CDS, there are casting defects with oxide inclusions (copper and aluminum oxide) and pores as the main microstructure [17]. Moreover, the 3.5% NaCl solution was replaced every 7 days to keep it fresh. The solution was not oxygenated and its pH value was 6.9.

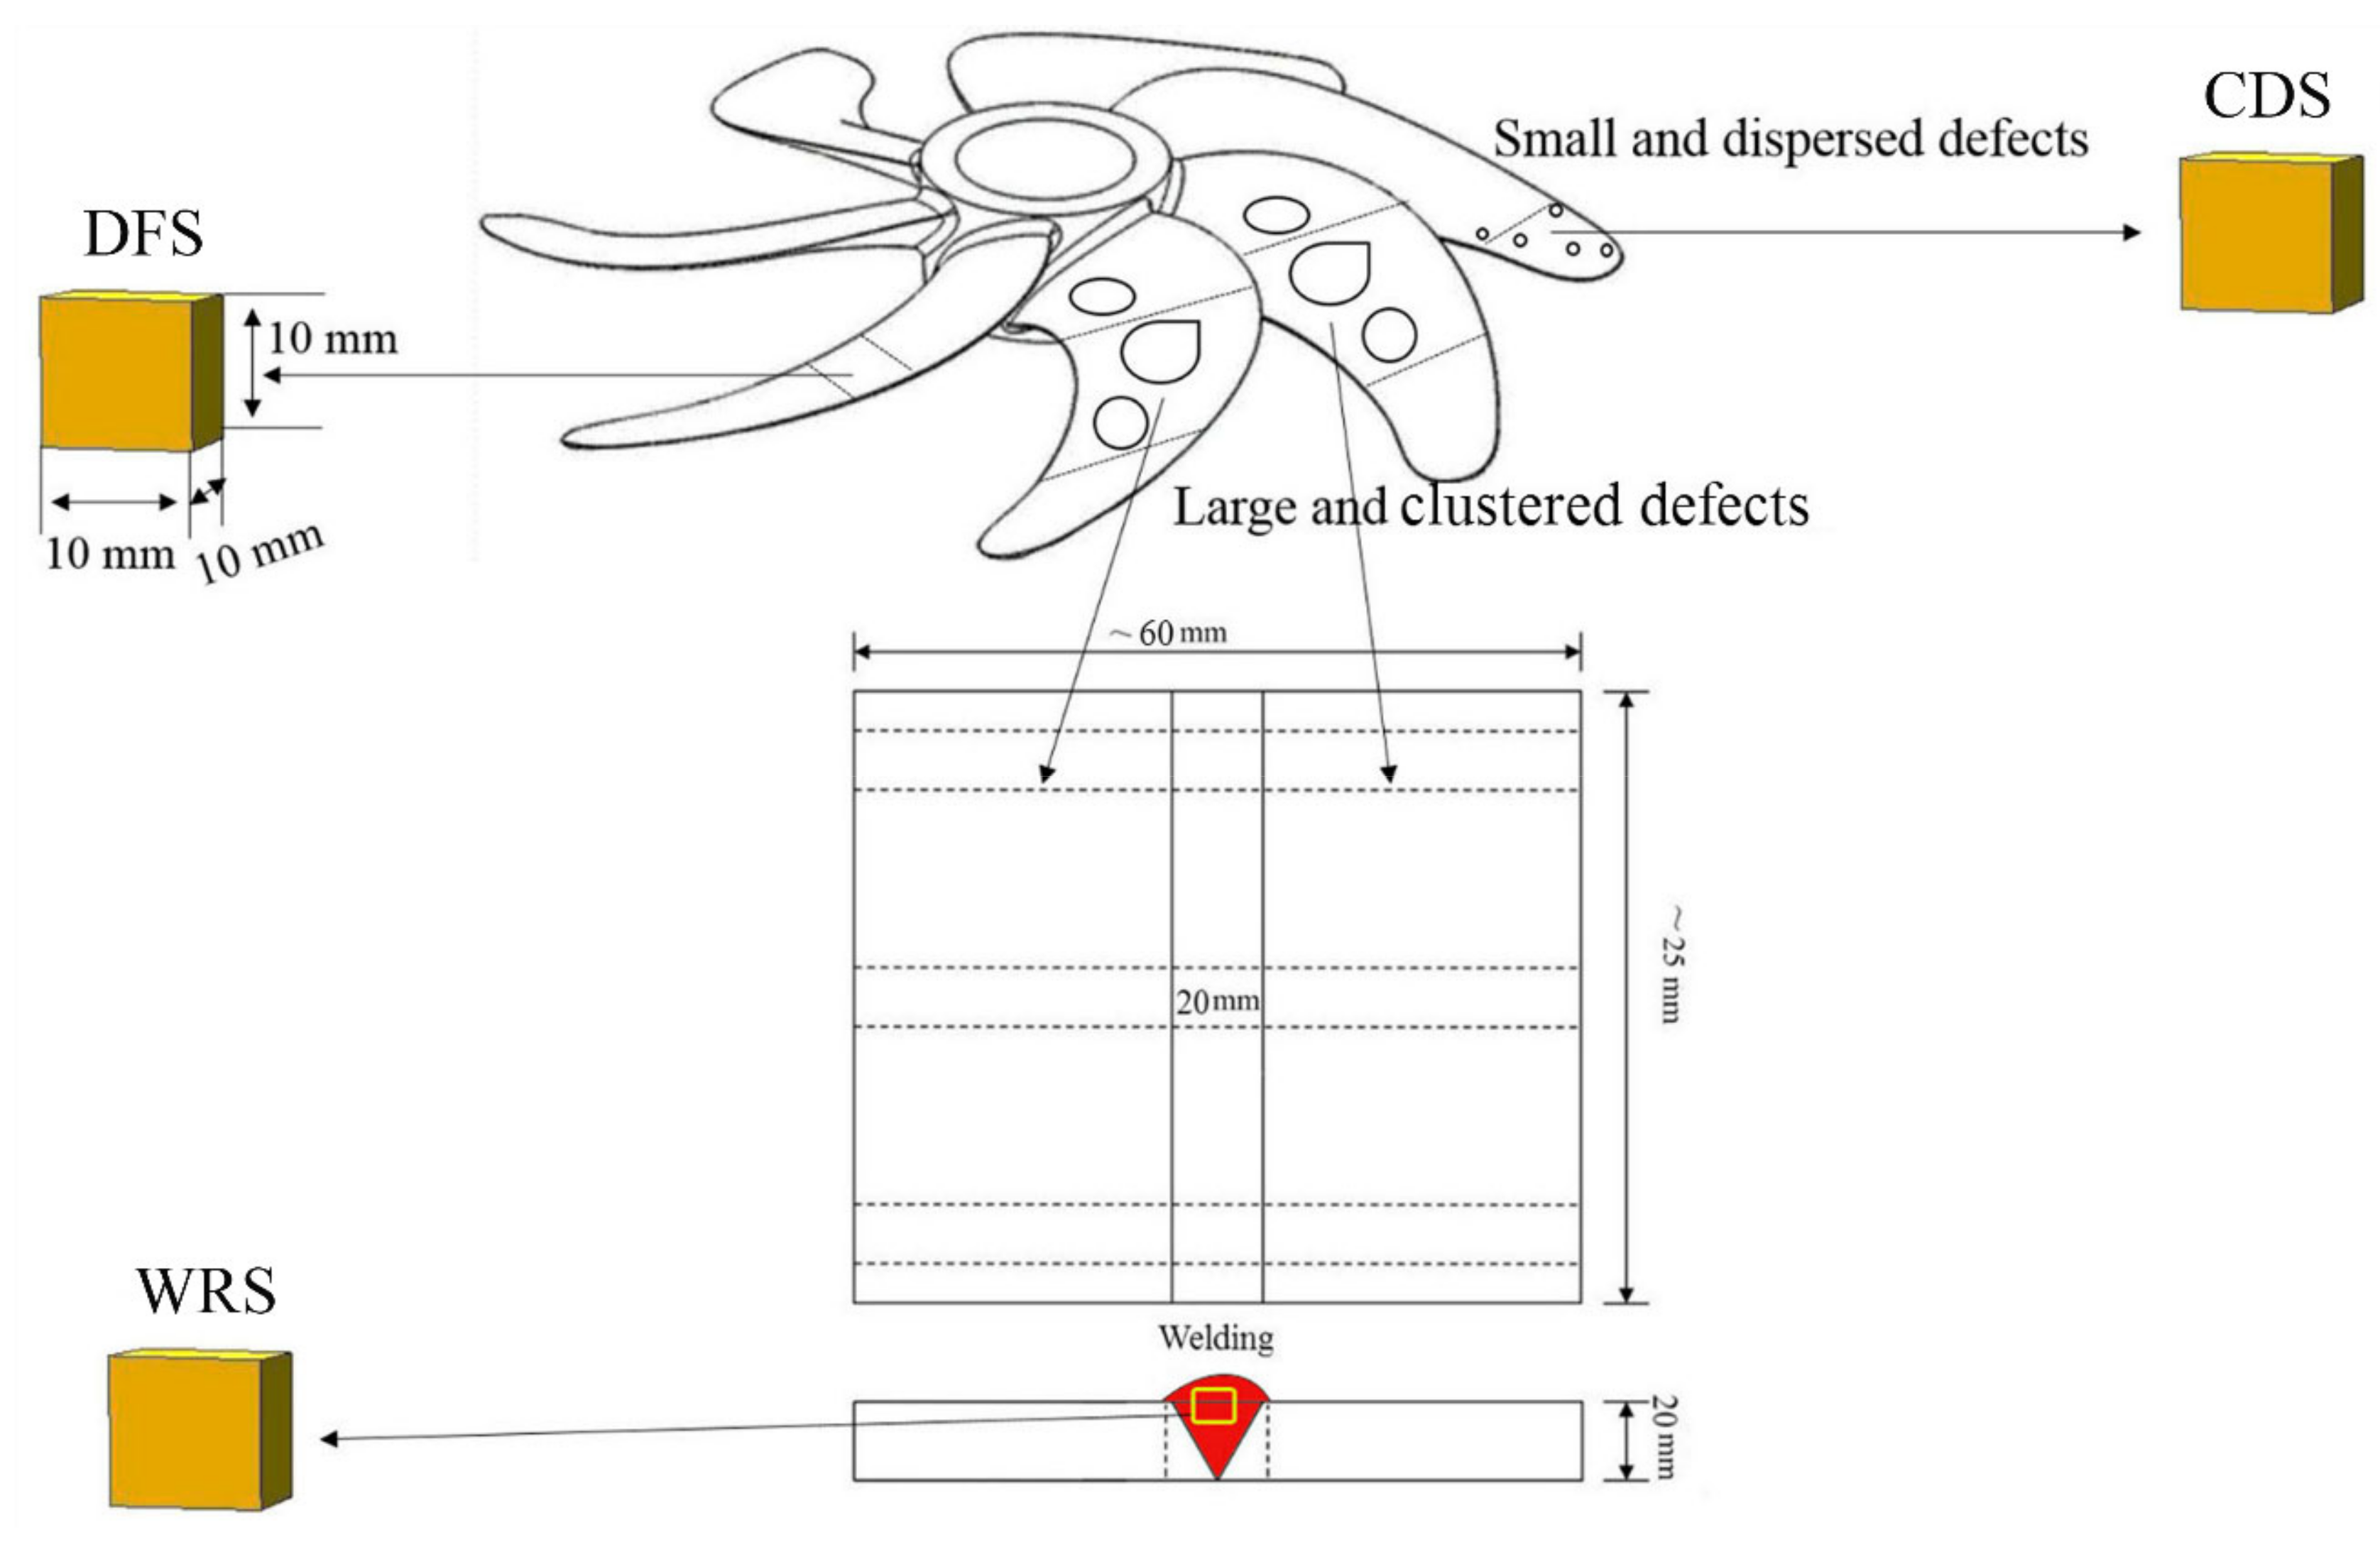
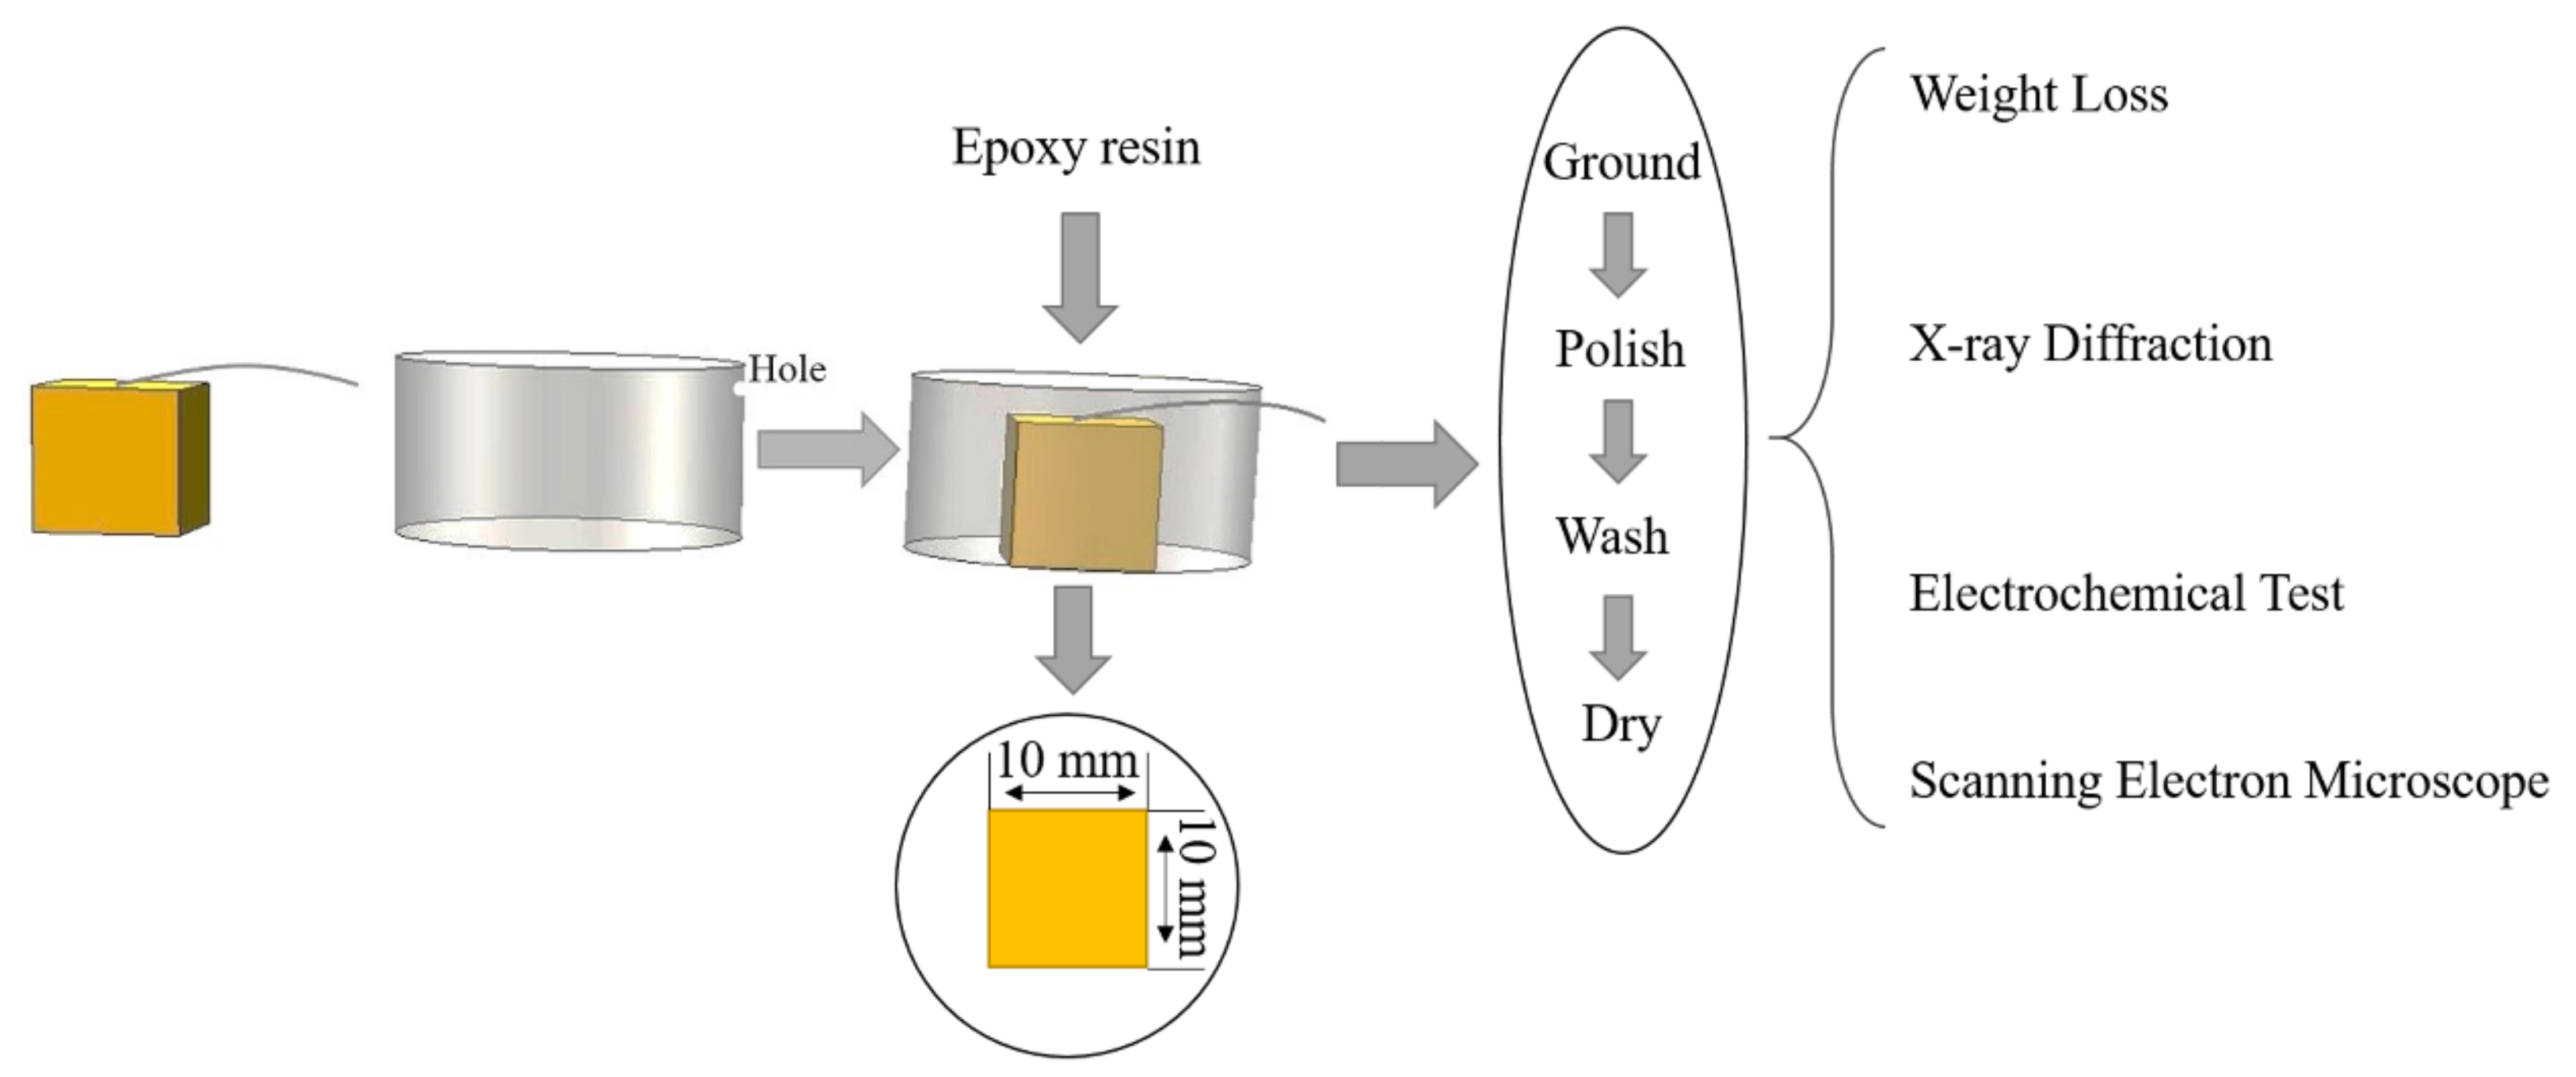
2.2. Preparation of Specimens

The preparations of each specimen used for weight loss, X-ray diffraction, optical microscope, scanning electron microscope and electrochemical test are shown in Figure 3. The specimens were mounted in plastic tubes by two-component epoxy resin (WSR618, Nantong Xingchen Synthetic Material Co., Ltd., Nantong, China), leaving an area of 1 cm2 to contact the 3.5% NaCl solution. Its surface was ground to 1000 grit by silicon carbide abrasive paper and polished, then was cleaned with absolute ethanol and dried in a vacuum at 60 °C before immersion testing.

2.3. Measurement and Characterization

2.3.1. Electrochemical Test

The polarization curve and electrochemical impedance spectroscopy (EIS) were conducted in a typical three-electrode cell using ZAHNER IM6ex Electrochemical Workstation (IM6ex, ZAHNER, Kronach, Germany). The working electrode was the bronze specimen prepared in 2.2 and the contact area with 3.5% NaCl solution was 0.38 cm2. A platinum mesh and a saturated calomel electrode served as the counter and reference electrode, respectively. The polarization curves were recorded at a sweep rate of 1 mV/s from −300 mV to 300 mV vs. the open circuit potential. The signal amplitude of EIS was 10 mV relative to the open circuit potential and the frequency ranged from 1 Hz to 100 kHz. Three specimens for each type of material were tested to ensure reproducibility. The detailed test operation can be found in the literature [18]. The test results were analyzed using Z2.03 USB and ZSimpWin3.2.1 software.

2.3.2. Weight Loss

The weight of the corrosion products and weight loss rate are noted as m2 − m3 and m 1 m 3 S t , where m1 means the mass of a specimen obtained by the first weighing before immersion; m2 means the mass of a specimen obtained by the second weighing, which was immersed in 3.5% NaCl solution for a period of time at room temperature, and taken out, rinsed with deionized water, dried in the air; m3 means the mass of a specimen obtained by the third weighing, which was immersed in HCl solution (containing 500 mL of commercially available 32% HCl and 500 mL of deionized water) for 2 min to remove the corrosion products, and after ultrasonically cleaned and dried in the air; S is the surface area (1 cm2) of a specimen in contact with 3.5% NaCl solution; and t is the immersion time. Three specimens for each type of material were tested to ensure reproducibility.

2.3.3. Scanning Electron Microscope (SEM) and X-ray Diffraction (XRD)

The DFS, WRS and CDS specimens prepared in 2.2 were immersed in 3.5% NaCl solution at room temperature. After immersion for each period of 3, 72, 168 and 432 h, they were taken out, rinsed with deionized water and dried. Energy dispersive spectrometer analysis was carried out at 3 h and 72 h. SEM (Supra-55-sapphire, Carl Zeiss AG, Jena, Germany) was tested at 3, 72, 168, 432 h and XRD (D/MAX-Ultima, Rigaku, Tokyo, Japan) with Co Kα radiation was tested at 432 h.

3. Result and Discussion

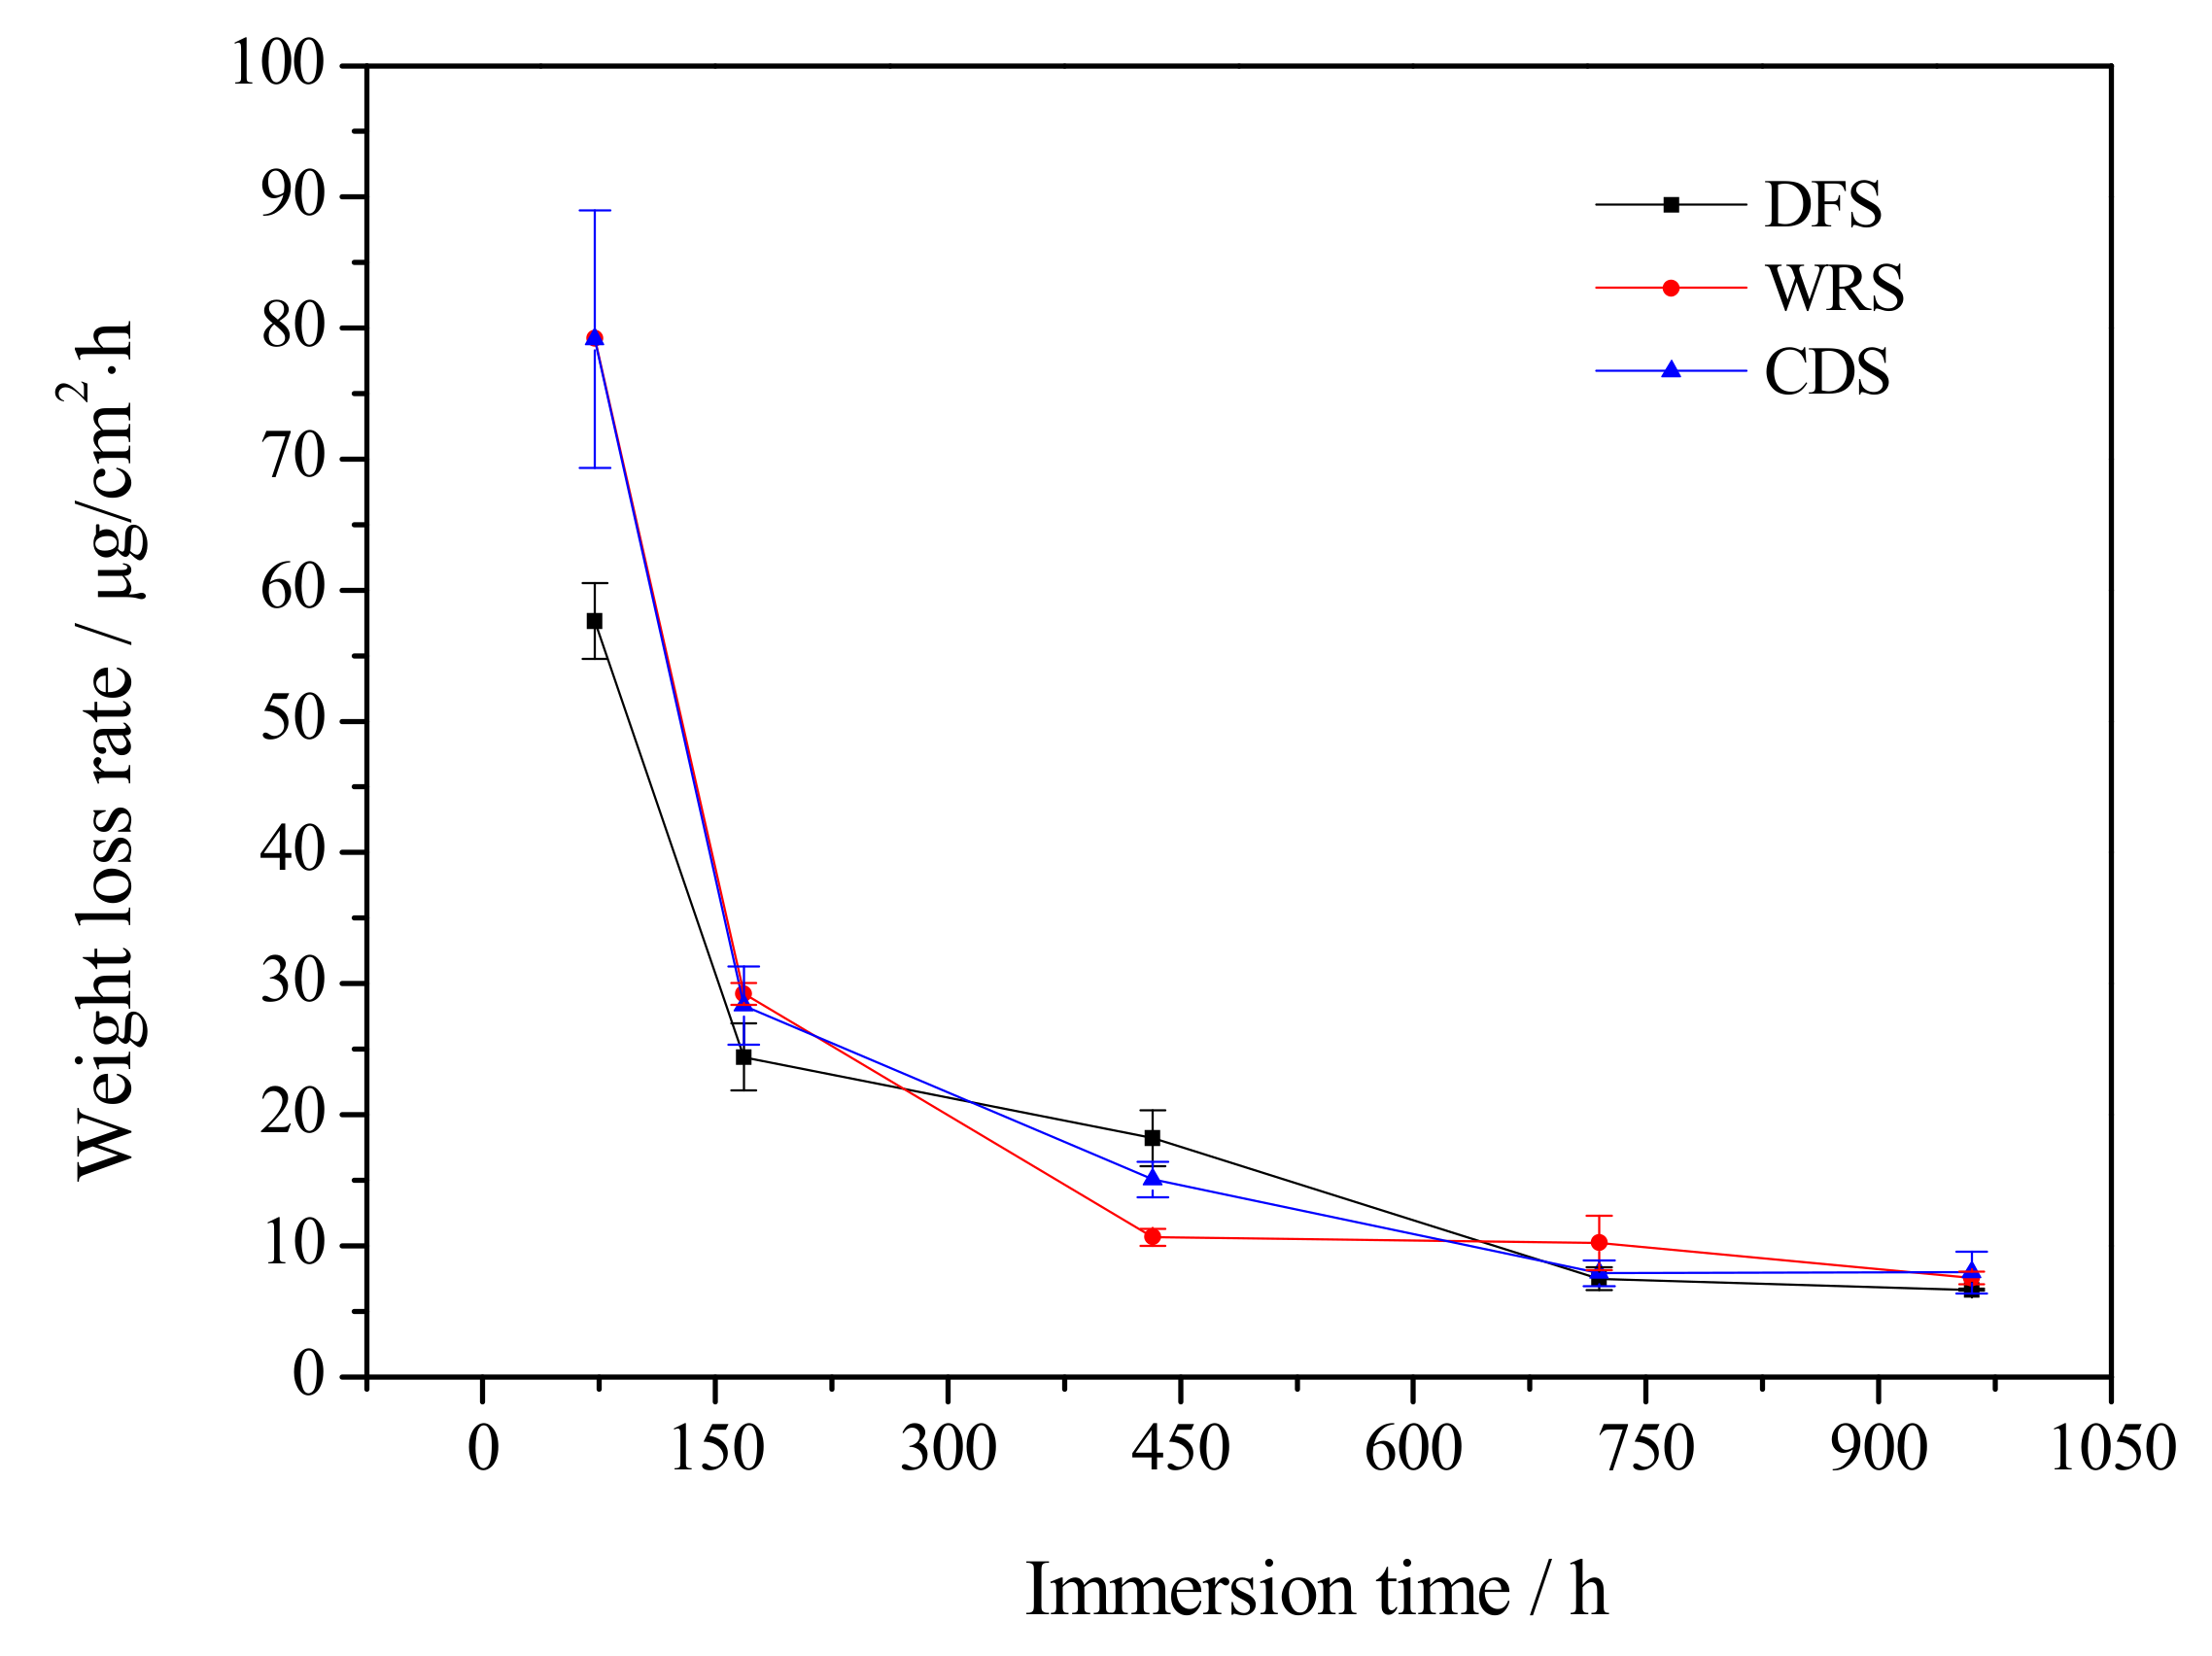
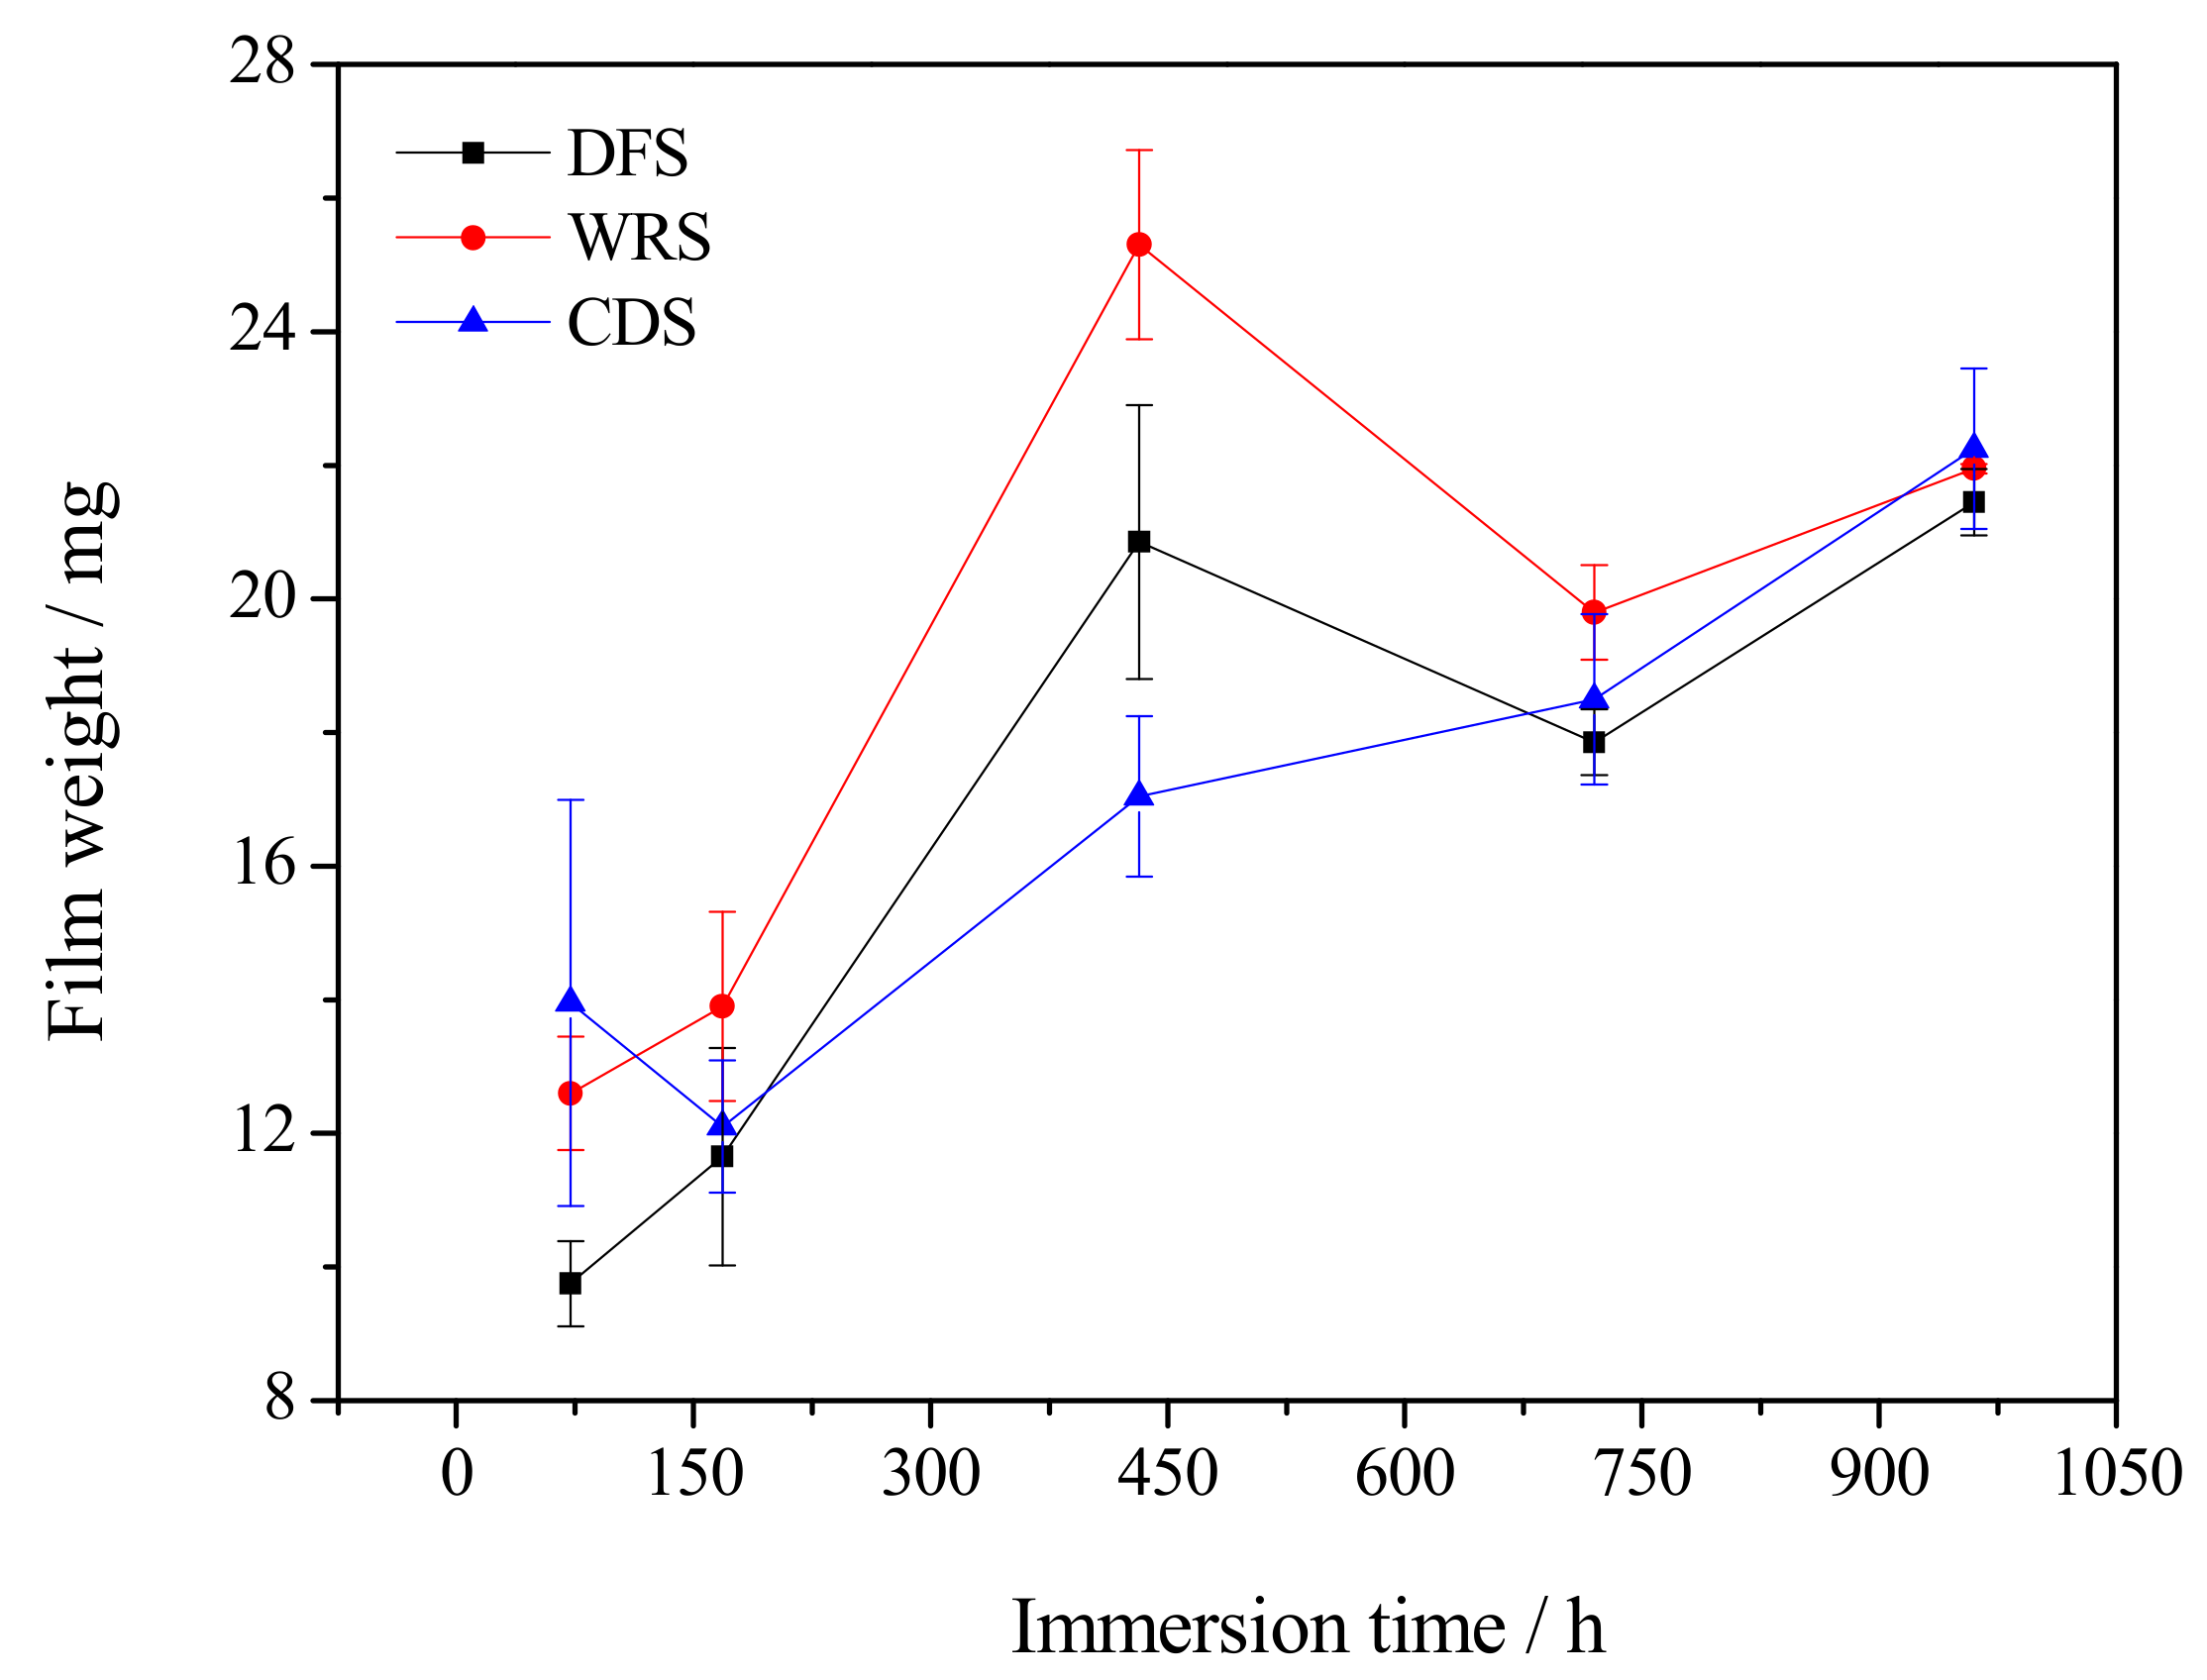
3.1. Weight Loss Analysis

Due to the introduction of welding consumables and heat treatment in the welding repair process, an increase in the inhomogeneity of the WRS microstructures resulted, which increased its tendency of galvanic corrosion. Therefore, compared with DFS, WRS had a faster corrosion rate (Figure 4). Since the anodic dissolution rate of WRS is faster, more metal changed to ions participate in the formation of a corrosion product film, resulting in a thick corrosion product film (Figure 5). Therefore, WRS had a fast corrosion rate and thick corrosion product film (Figure 4 and Figure 5). The microstructure of defects is mainly of copper and aluminum oxide [17]. Since copper and aluminum oxide are more stable with respect to the metal phase, they can form a small anode (the microstructures around the defects) and large cathode (casting defects with copper and aluminum oxide as the main microstructure) corrosion galvanic couple, thus accelerating the corrosion of the microstructures around the defects, making the surrounding microstructure of the defects preferentially form a corrosion hole. The formation of the corrosion hole will cause the local surface near the corrosion hole to remain in the anodic dissolution state at all times. The presence of defects not only causes the local surface to be dissolved but also results in an increase in the growth stress of the corrosion product film, thereby causing the film to be loose and easily peeled off. Therefore, CDS has thin corrosion product film and a fast corrosion rate (Figure 4 and Figure 5).

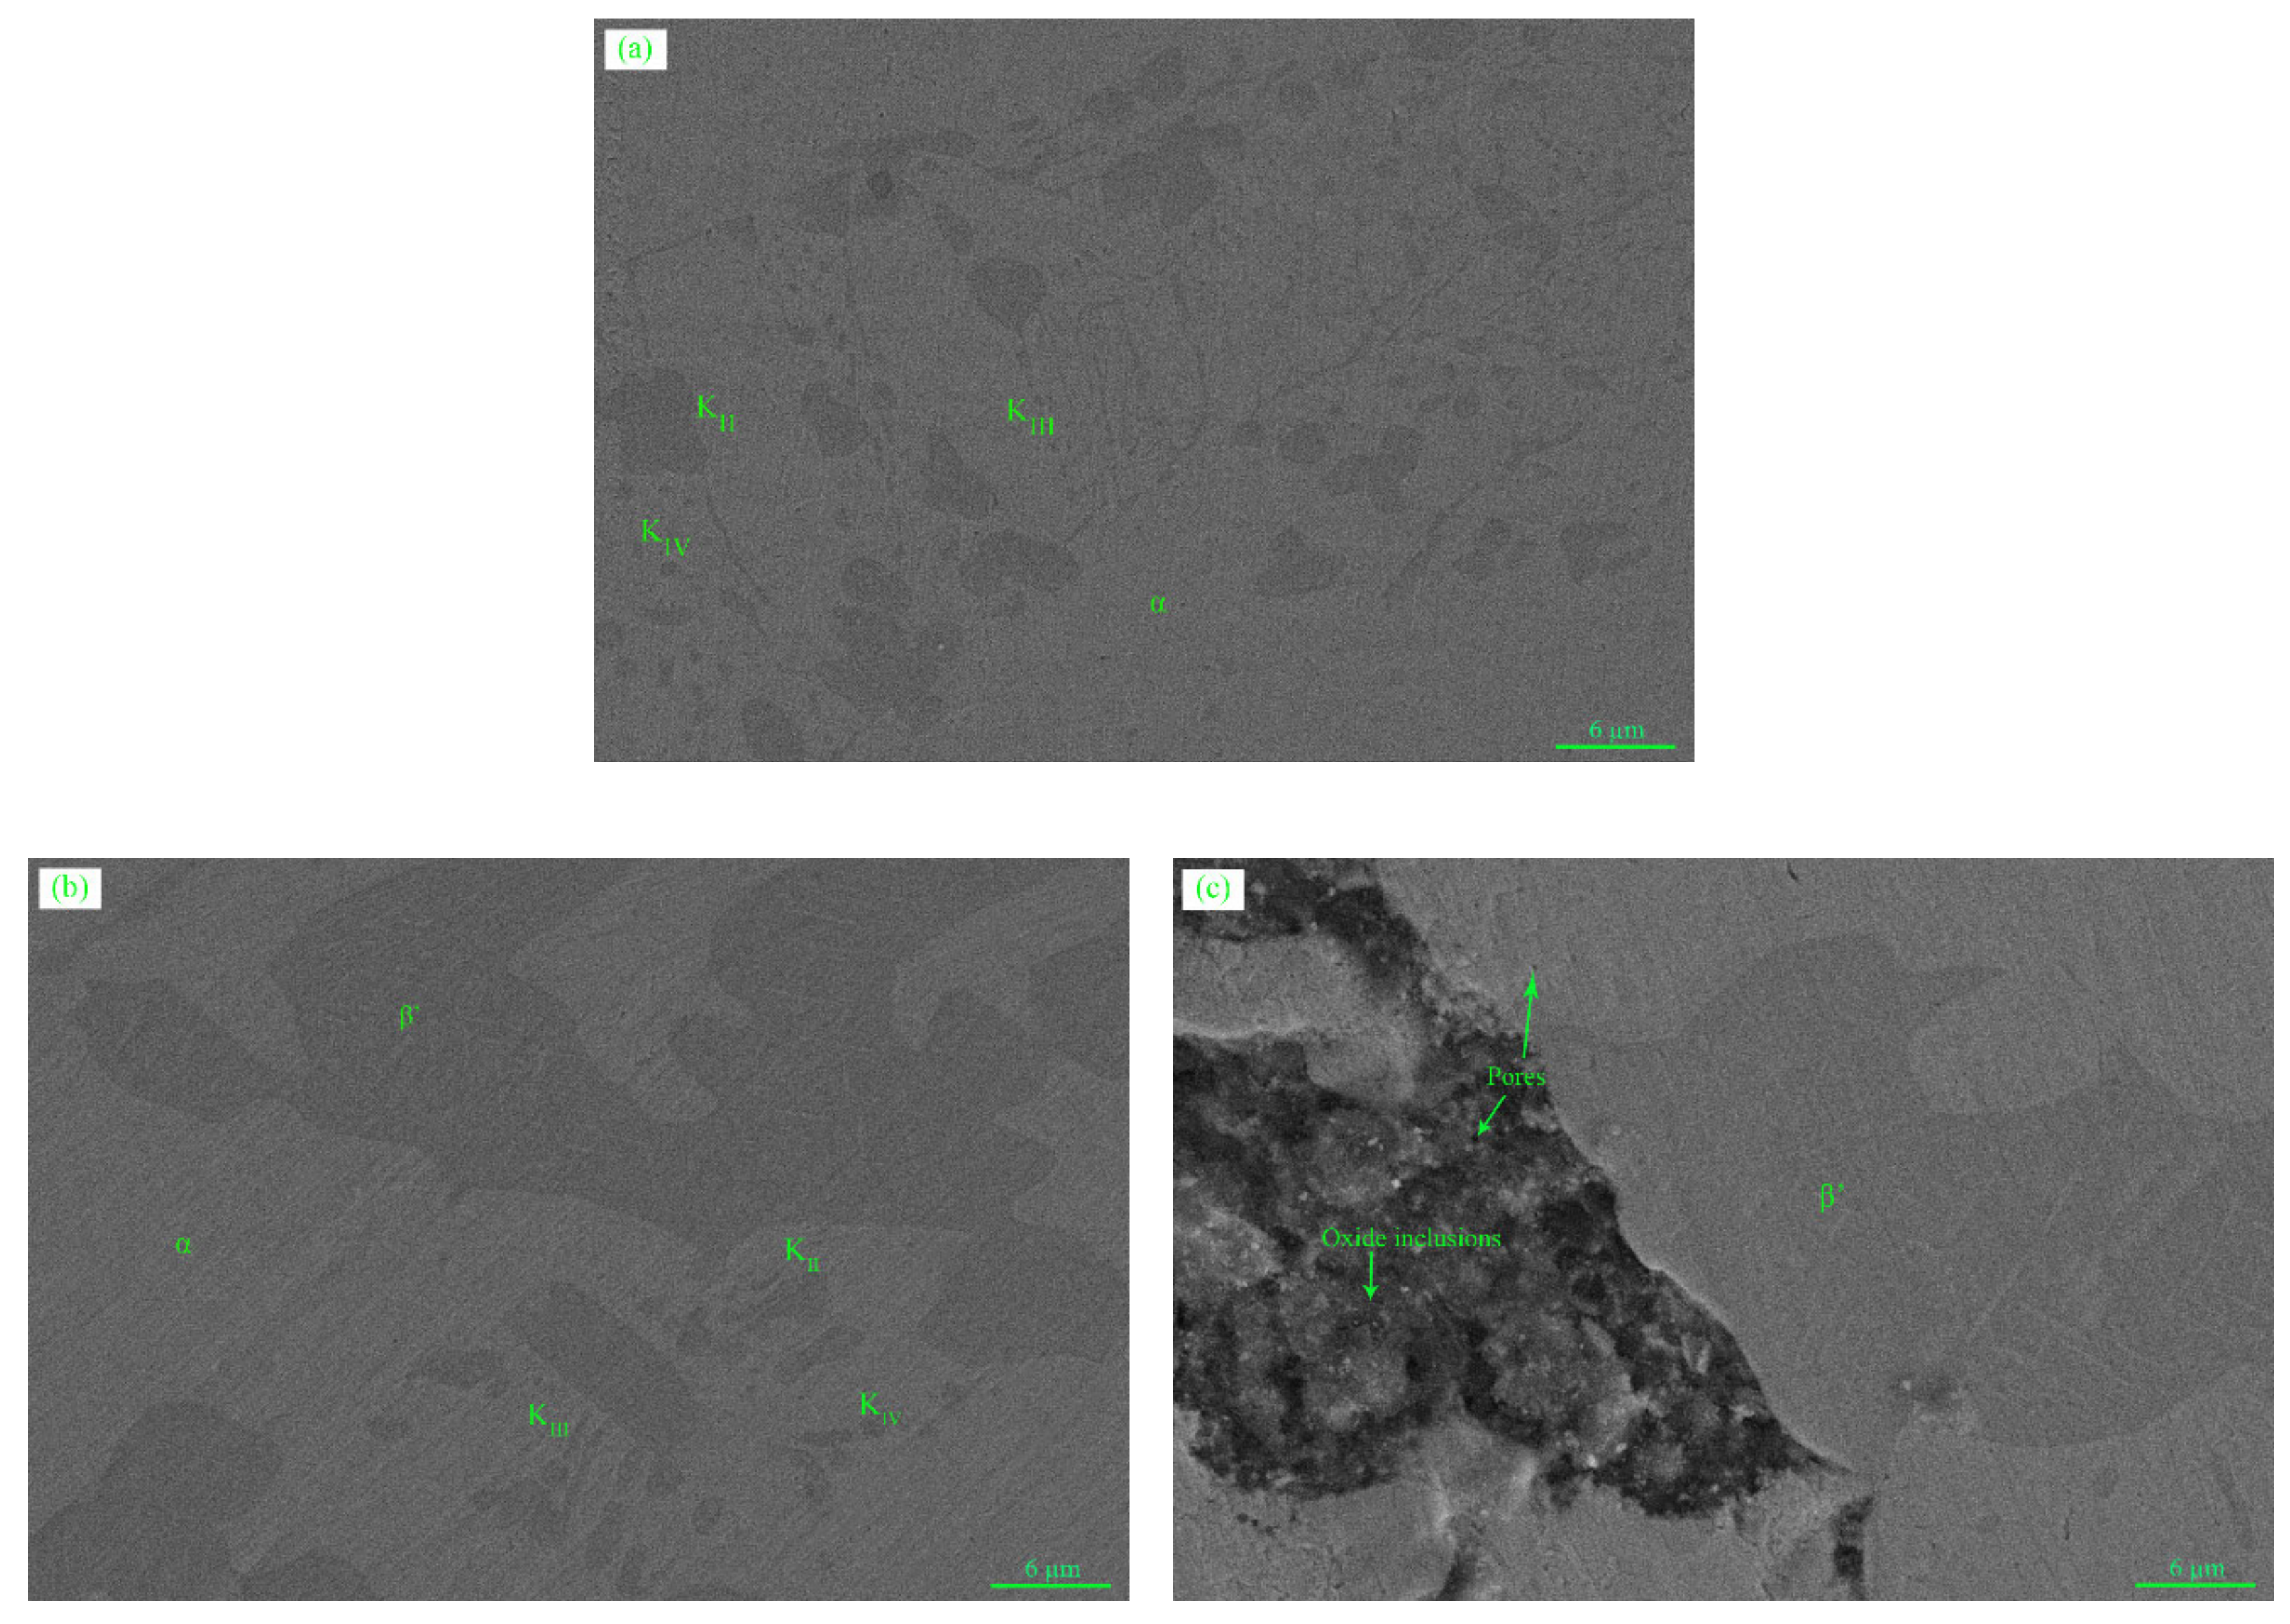
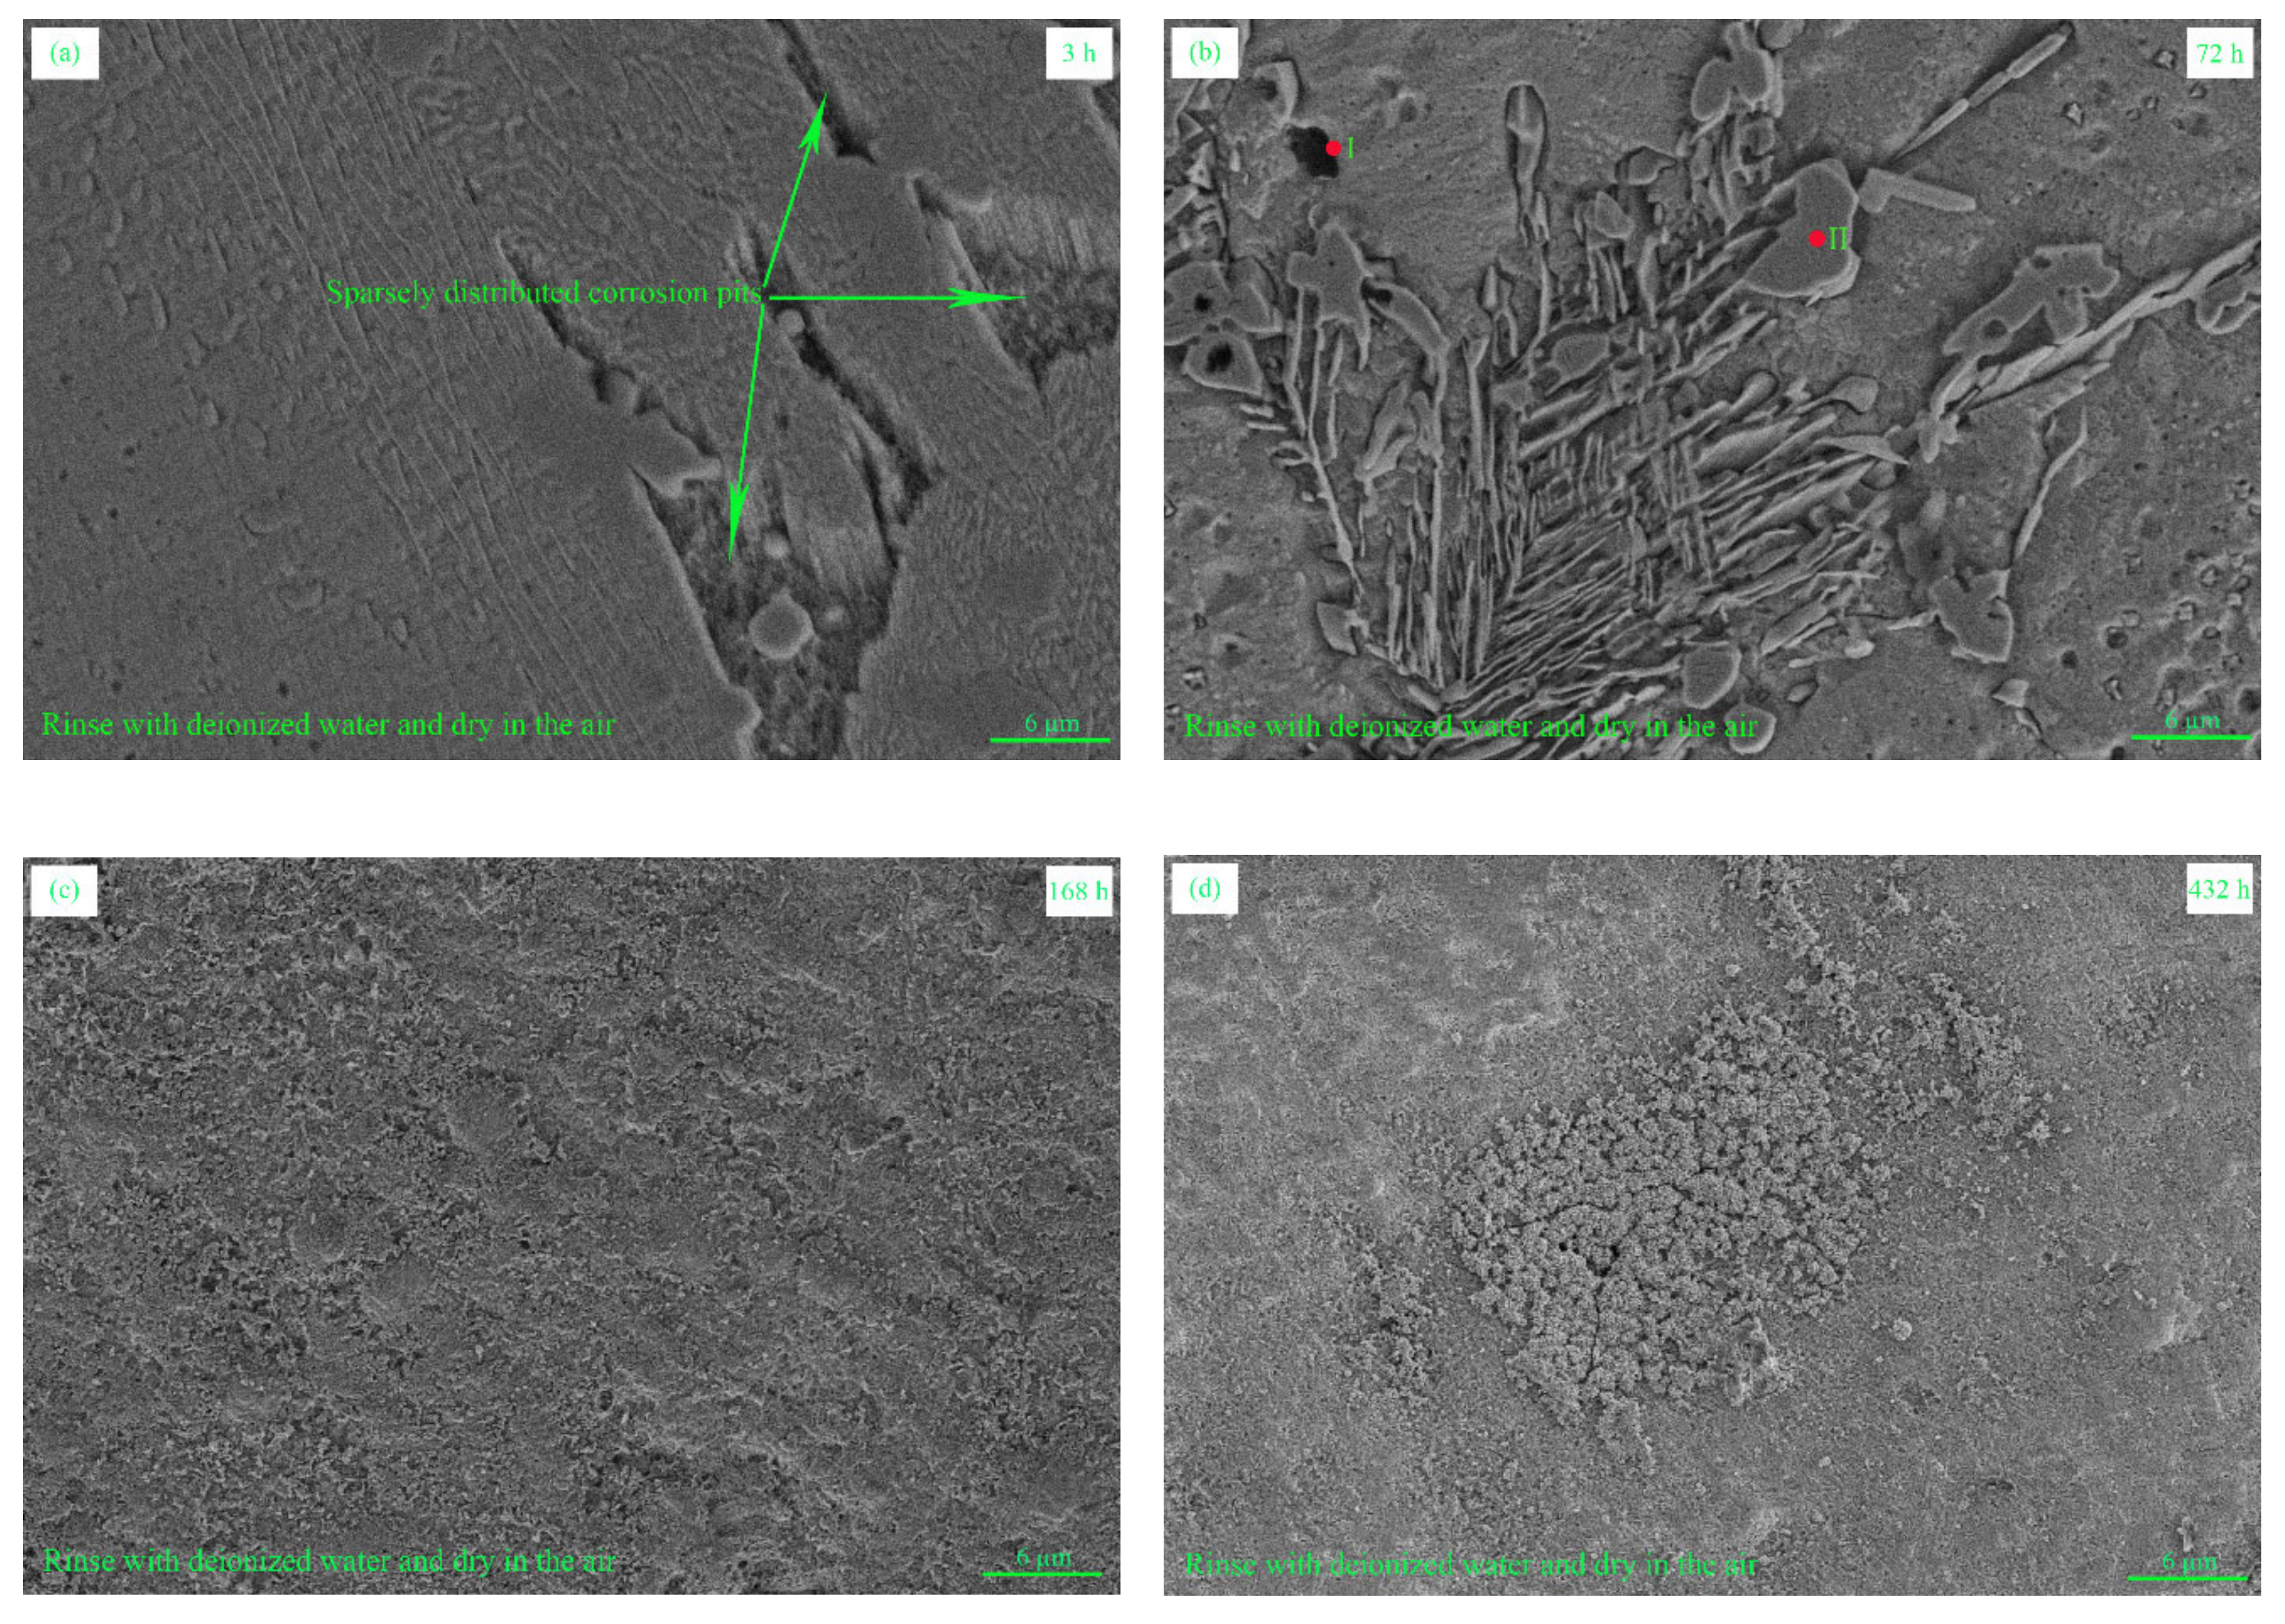
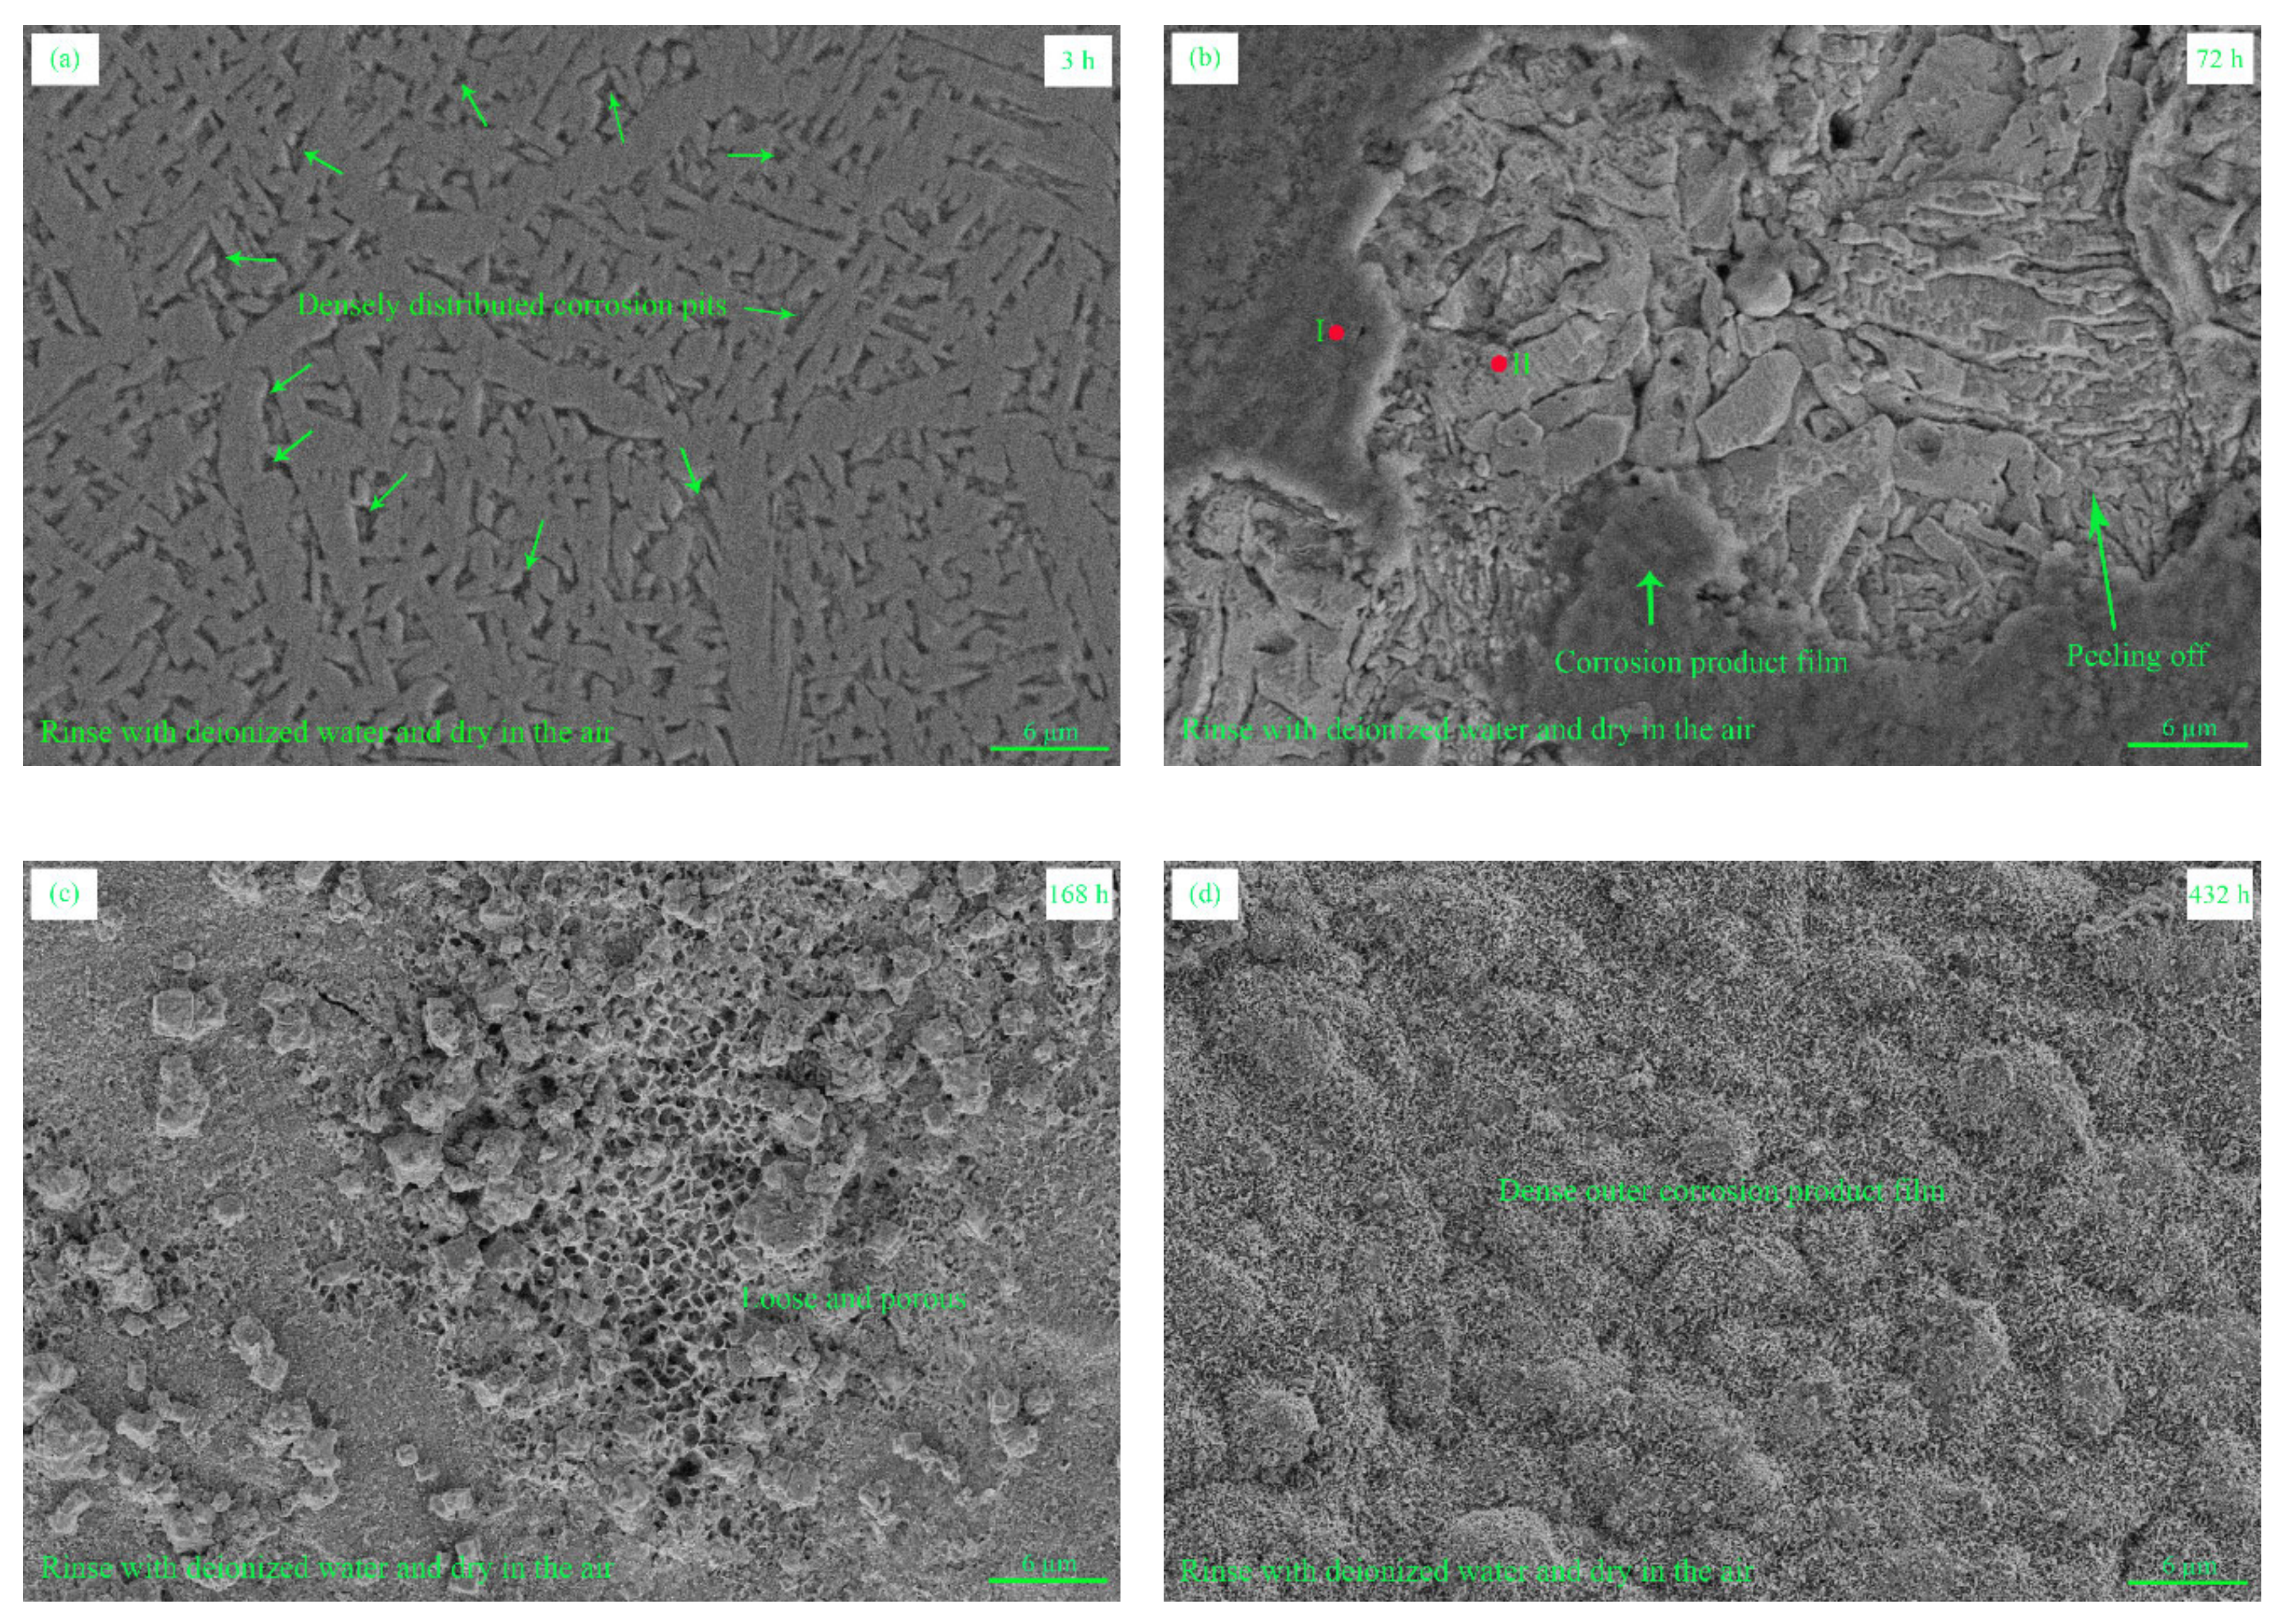
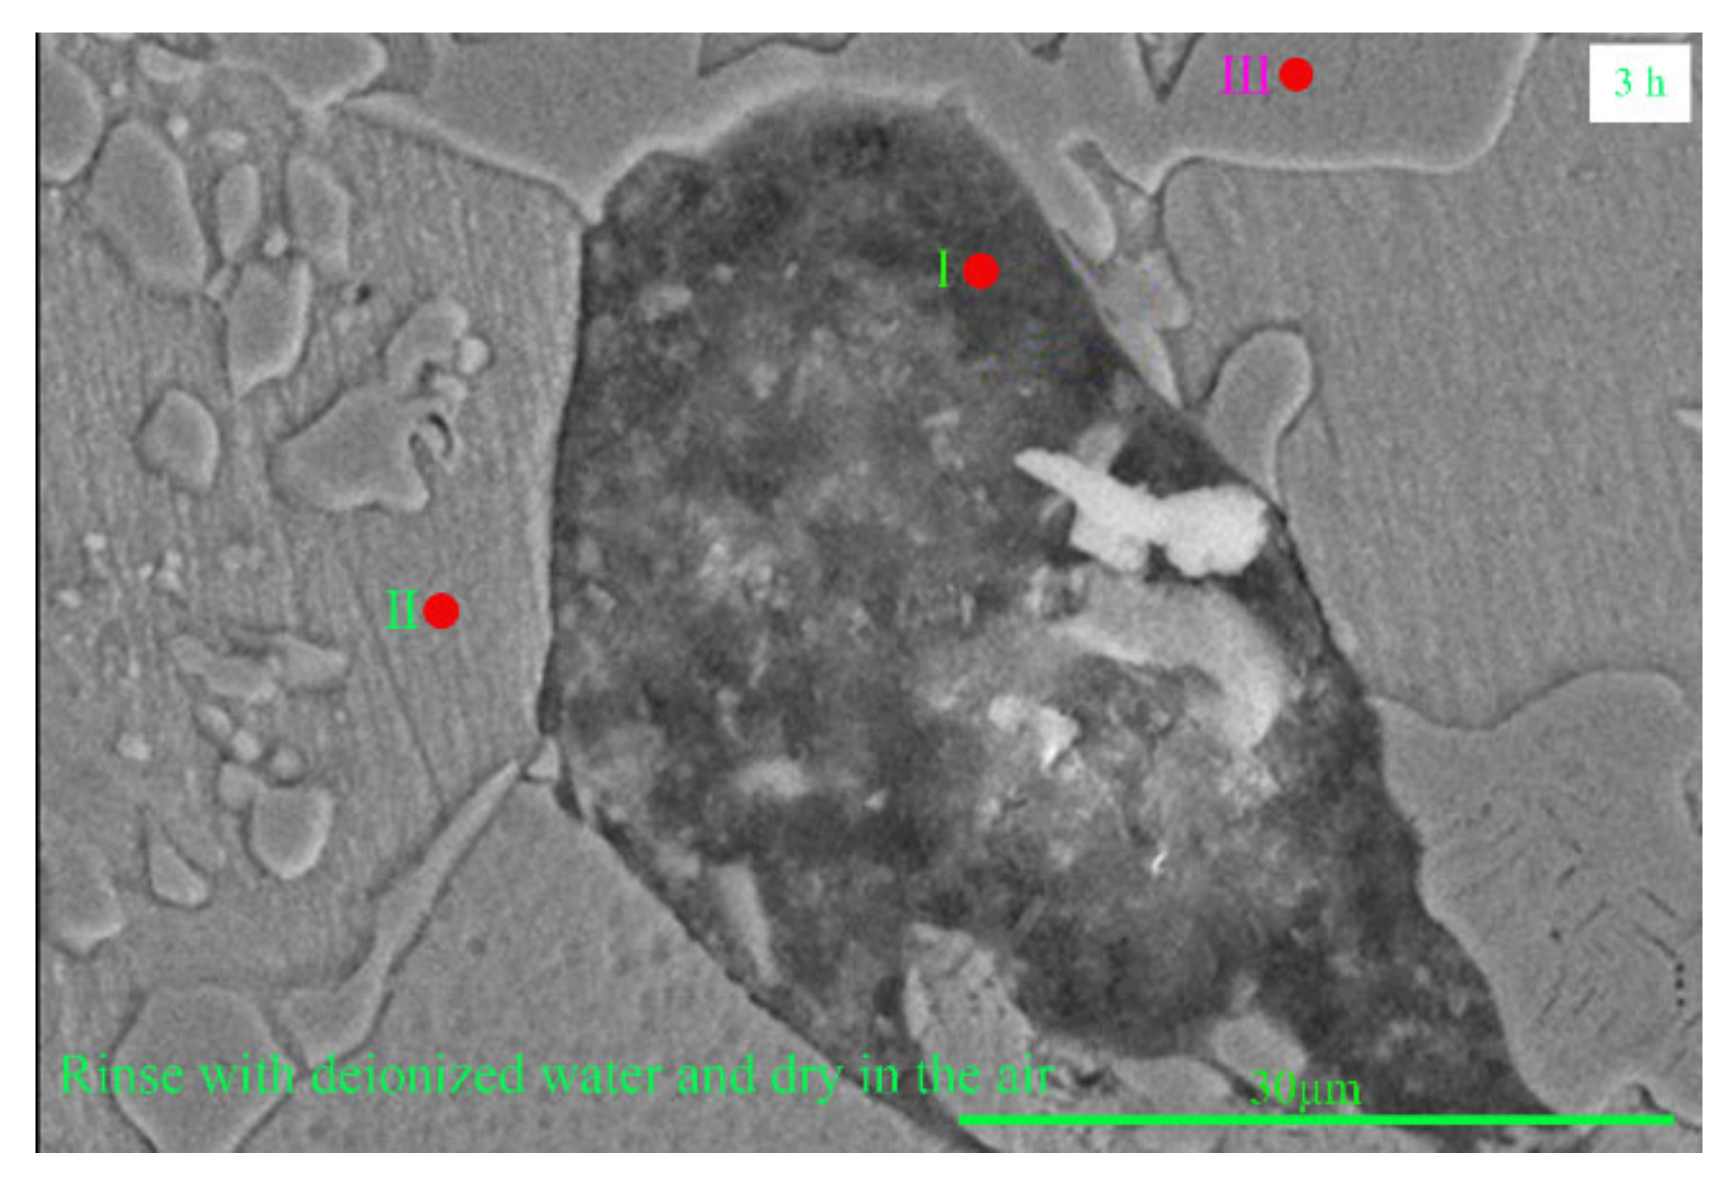
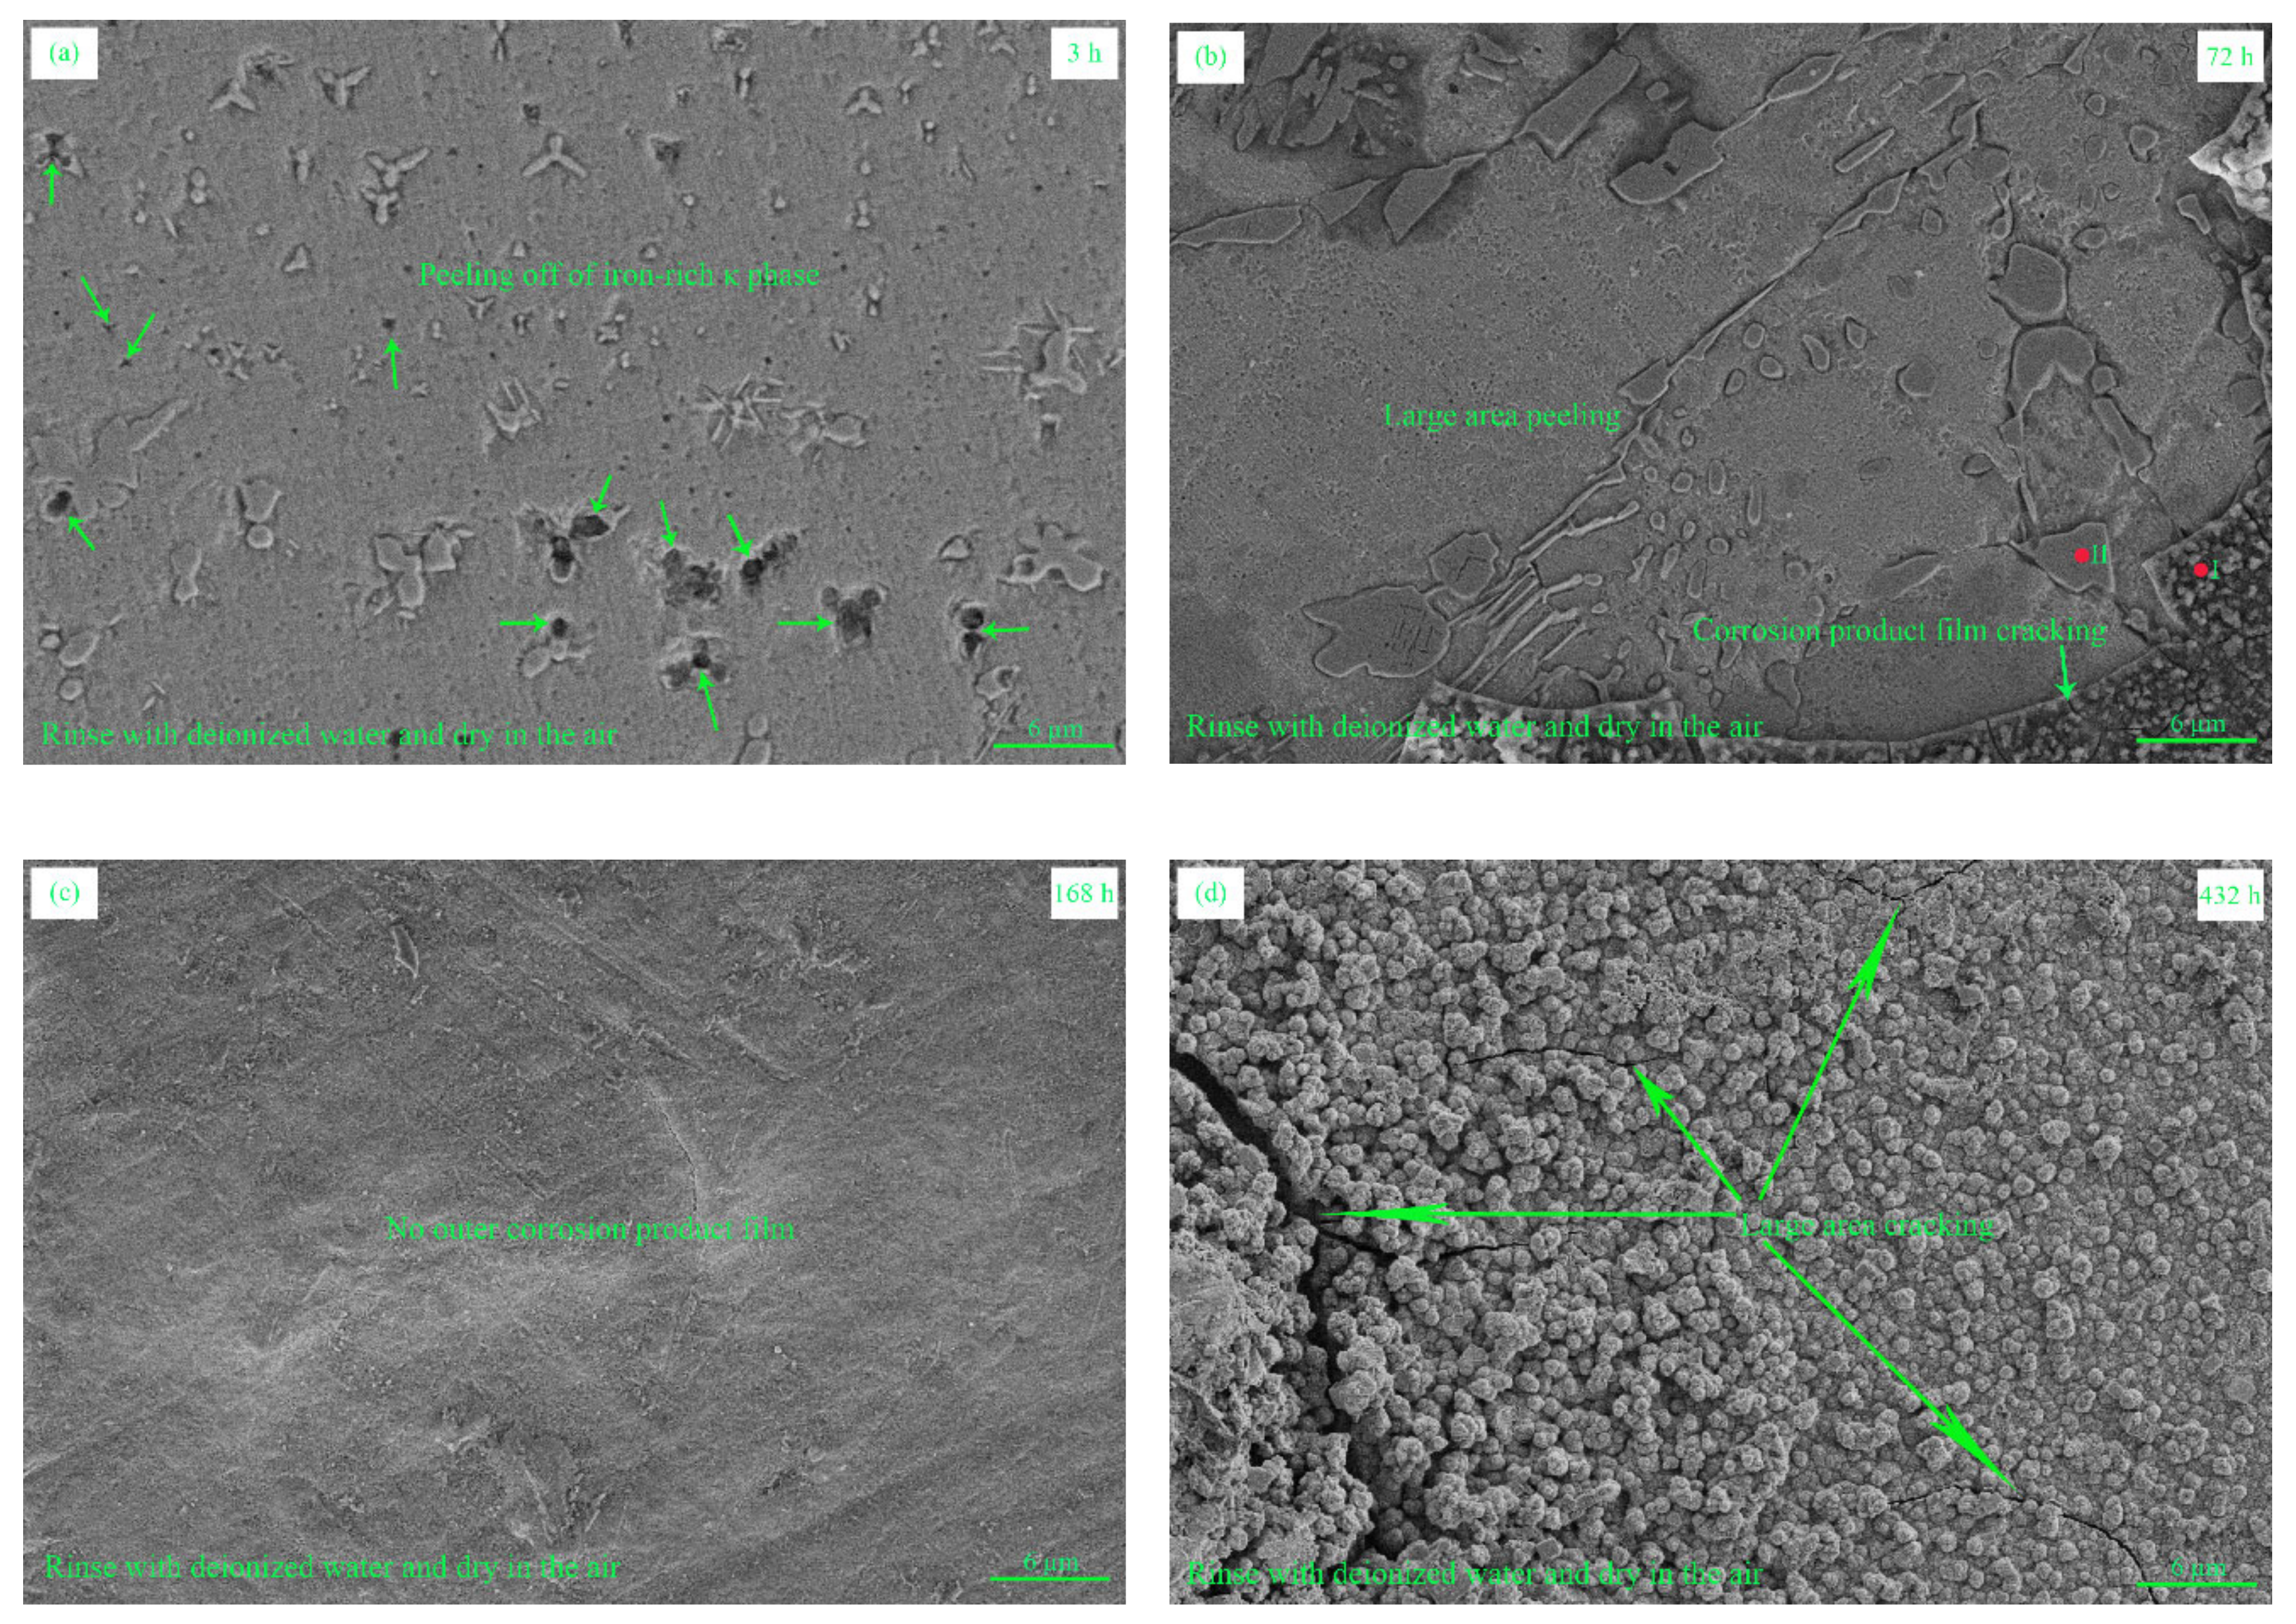
3.2. Corrosion Morphology and Microstructure

DFS, WRS and CDS exhibit different corrosion behaviors during corrosion due to differences in their microstructures (Figure 6, Figure 7, Figure 8 and Figure 9). For WRS, it has an increased tendency for galvanic corrosion due to the introduction of welding consumables and heat treatment, accelerating corrosion (Figure 6a vs. Figure 7a). Due to greater microstructure inhomogeneity (Figure 2a vs. Figure 2b), WRS corrosion product film produces greater stress during the growth process. Therefore, the corrosion product film will peel off (Figure 6b vs. Figure 7b). The EDS analysis (Table 2) also supports the peeling of the corrosion product film in WRS. When the corrosion time is less than 168 h, since the internal stress of WRS corrosion product film is larger, the corrosion product film is more loose (Figure 6c vs. Figure 7c). This is also verified in the later electrochemical corrosion analysis. Since WRS has a high corrosion rate (Figure 4), the formation rate of the corrosion product film is also fast (Figure 5). In the case of corrosion time greater than 168 h, the loose problem due to the stress in the film is gradually improved (Figure 7c vs. Figure 7d) as the film formation speed is accelerated. For CDS, since the main microstructure of the defect is copper and aluminum oxide [17], it can form a corrosion galvanic couple with the surrounding α phase to accelerate the α phase corrosion. This can be seen from the EDS analysis (Table 3) of CDS corroded for 3 h (Figure 8). Some corrosion holes also appeared on the surface of Figure 9a. Judging from their shape and location, it should be caused by the preferential corrosion and peeling off of iron-rich κ phase [19]. Defects not only affect the uniformity of a microstructure of the alloy, increasing the internal stress of the film, but also destroy the continuity of the film, eventually leading to the cracking and large area peeling of corrosion products (Figure 7b vs. Figure 9b). Due to the cracking and large area peeling of corrosion products, CDS cannot form a stable outer corrosion product film even if it is corroded for a long time (Figure 9c,d vs. Figure 6c,d).

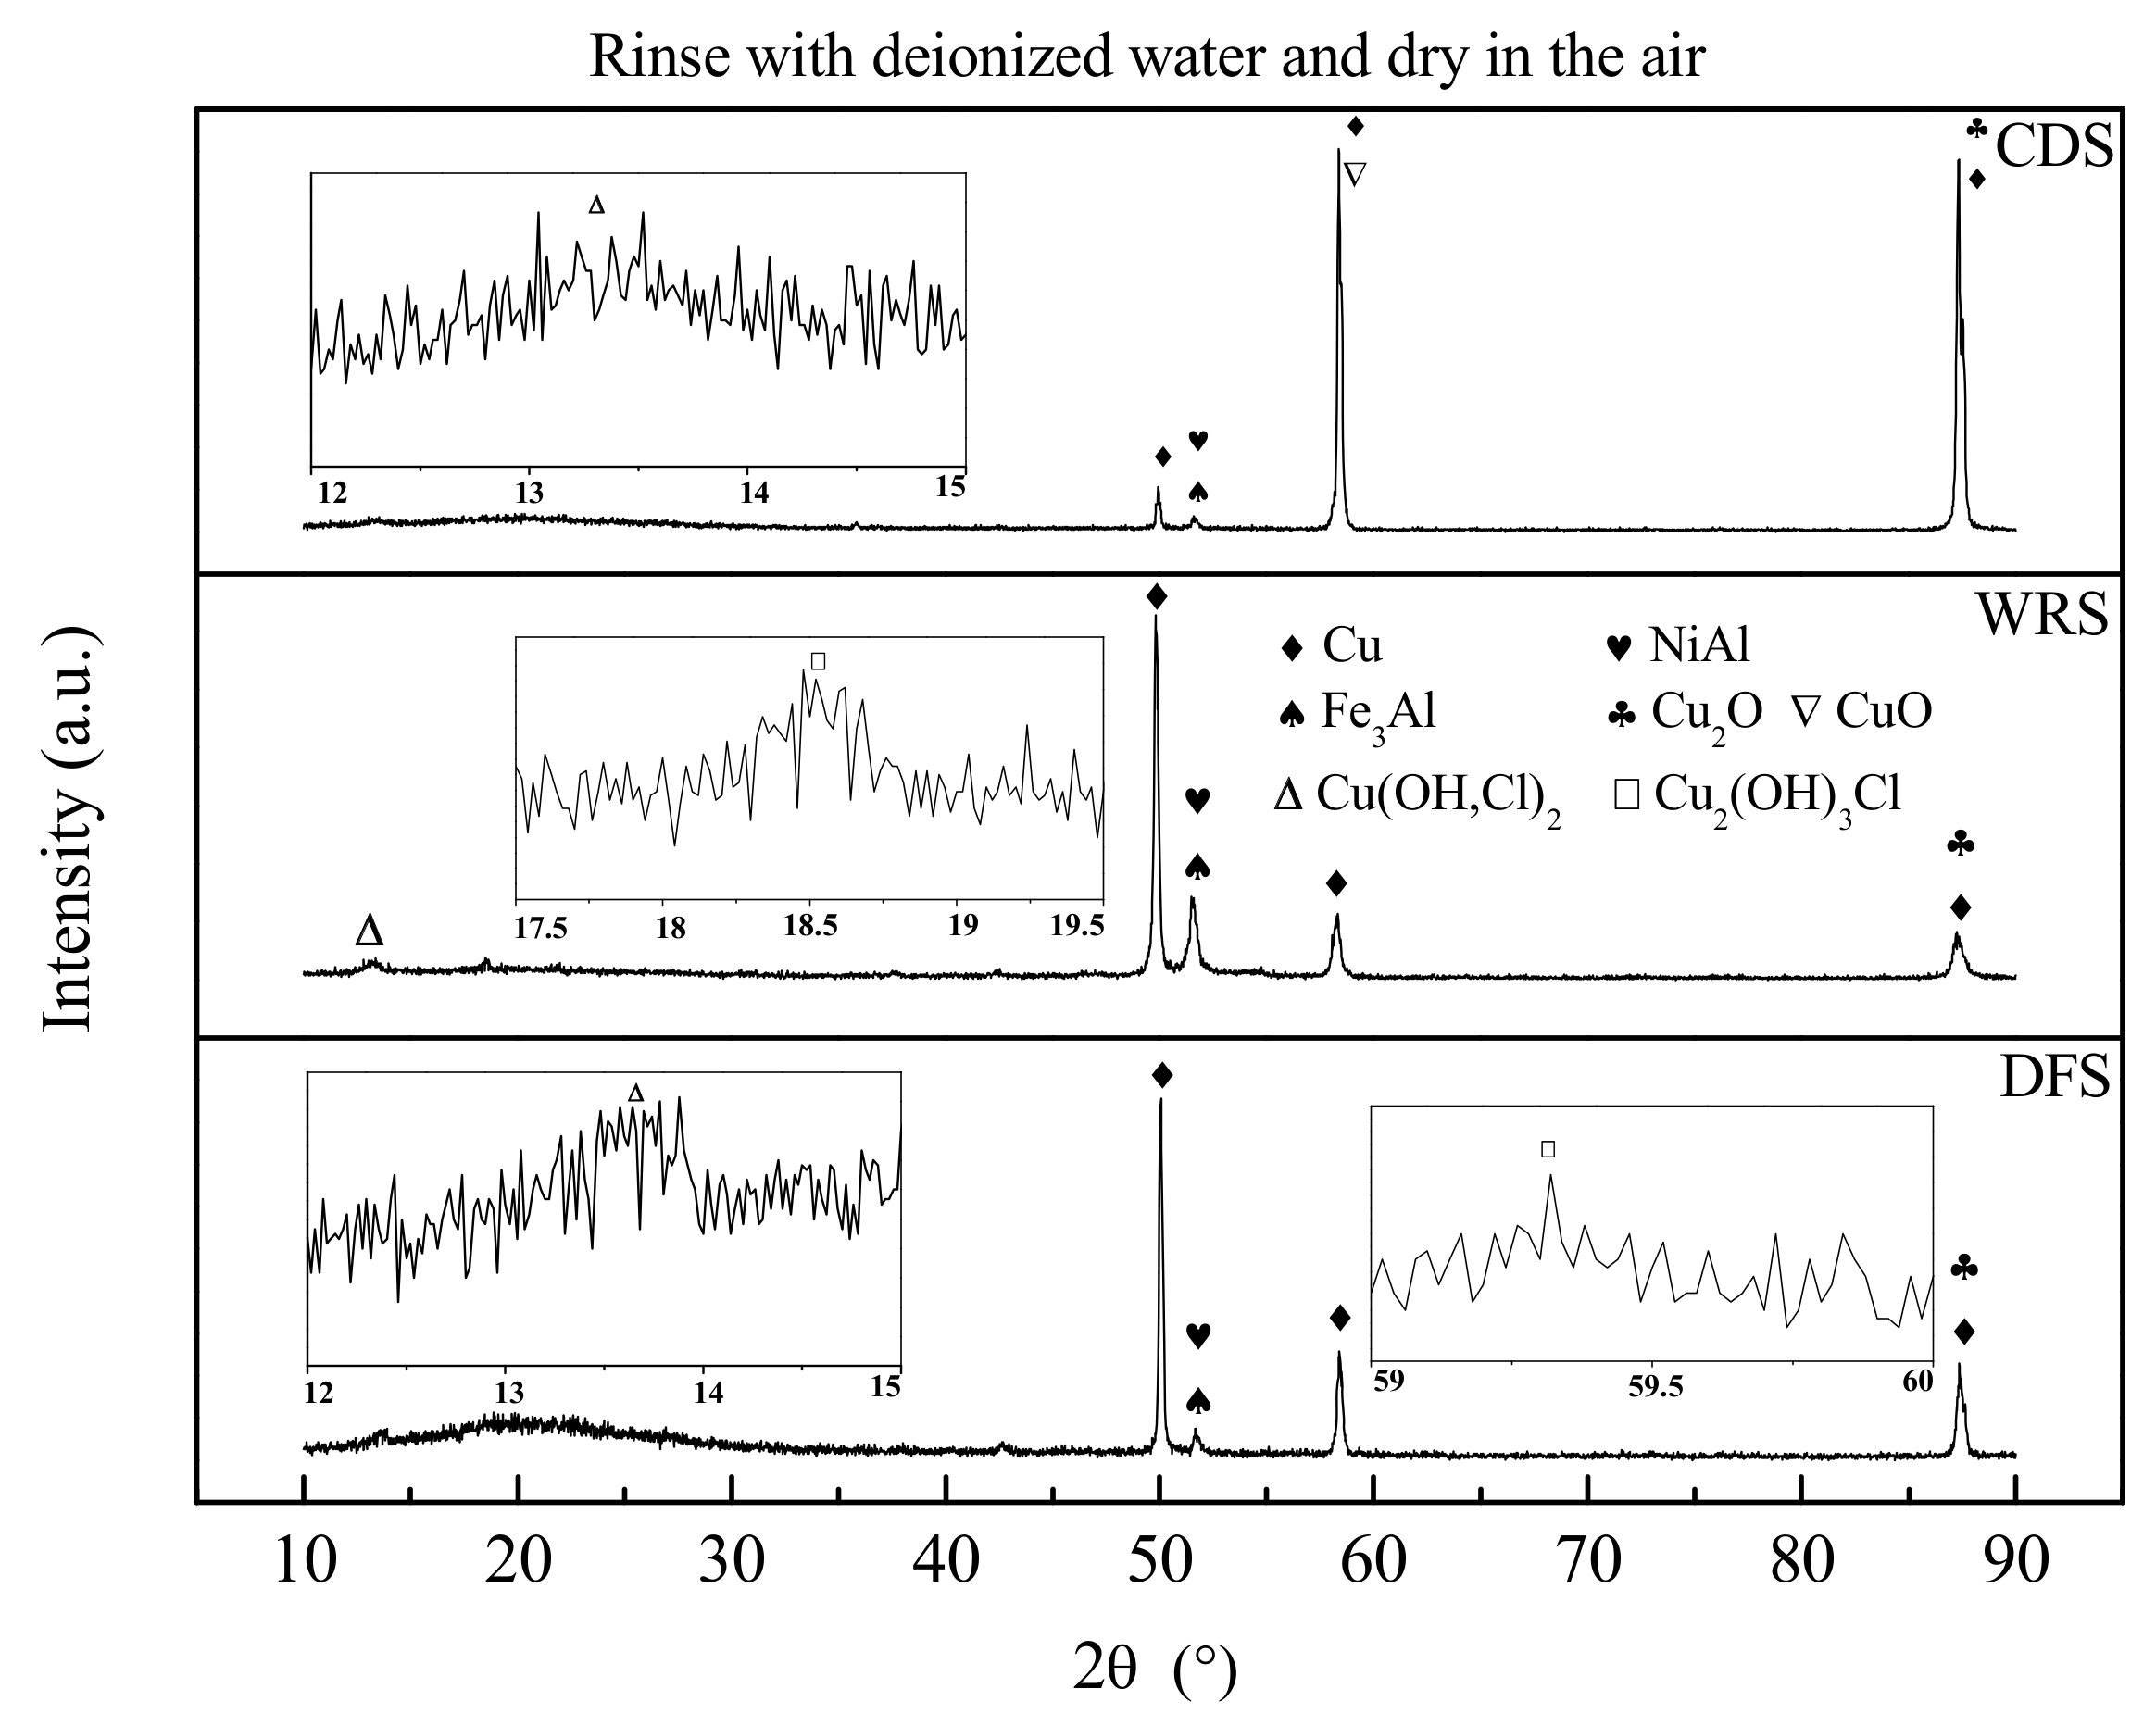
3.3. Corrosion Product Film Structure

When as-cast UNS C95810 is corroded in seawater, Al2O3, Cu2O, Cu(OH)2, CuO and Cu2(OH)3Cl are formed on the surface [17,19,20]. Since weld and defects can affect the corrosion behavior of UNS C95810, they can also affect the corrosion product of UNS C95810. To explore this effect, the XRD test of DFS, WRS and CDS was performed. The results are shown in Figure 10. Figure 10 shows that the composition of the corrosion products of DFS and WRS is the same. However, due to the difference in the film weight of the DFS and CDS (Figure 5), the corrosion product film of DFS and WRS has the same structure but the amount of the specific composition is different. Cu2(OH)3Cl is not found in the XRD test result (Figure 10) of CDS, which is different from the result in the literature [17]. This may be due to the fact that Cu2(OH)3Cl is located in the outermost layer of the NAB corrosion product film [19] and defects also make the film loose and easy to peel off (Figure 9b–d), thus causing Cu2(OH)3Cl not to be detected in the XRD result (Figure 10) of CDS. Based on previous research [17], it can be known that the as-cast NAB corrosion product film is in order from the inside to the outside: Al2O3, Cu2O with the incorporation of Fe and Ni, Cu(OH)2 or CuO and Cu2(OH)3Cl. Therefore, the corrosion product film of WRS should be from the inside to the outside: Al2O3, Cu2O with the incorporation of Fe and Ni, Cu(OH)2 or CuO and Cu2(OH)3Cl. Since Cu2(OH)3Cl is not present in the corrosion product film of CDS, it is one layer less than the corrosion product film of DFS.

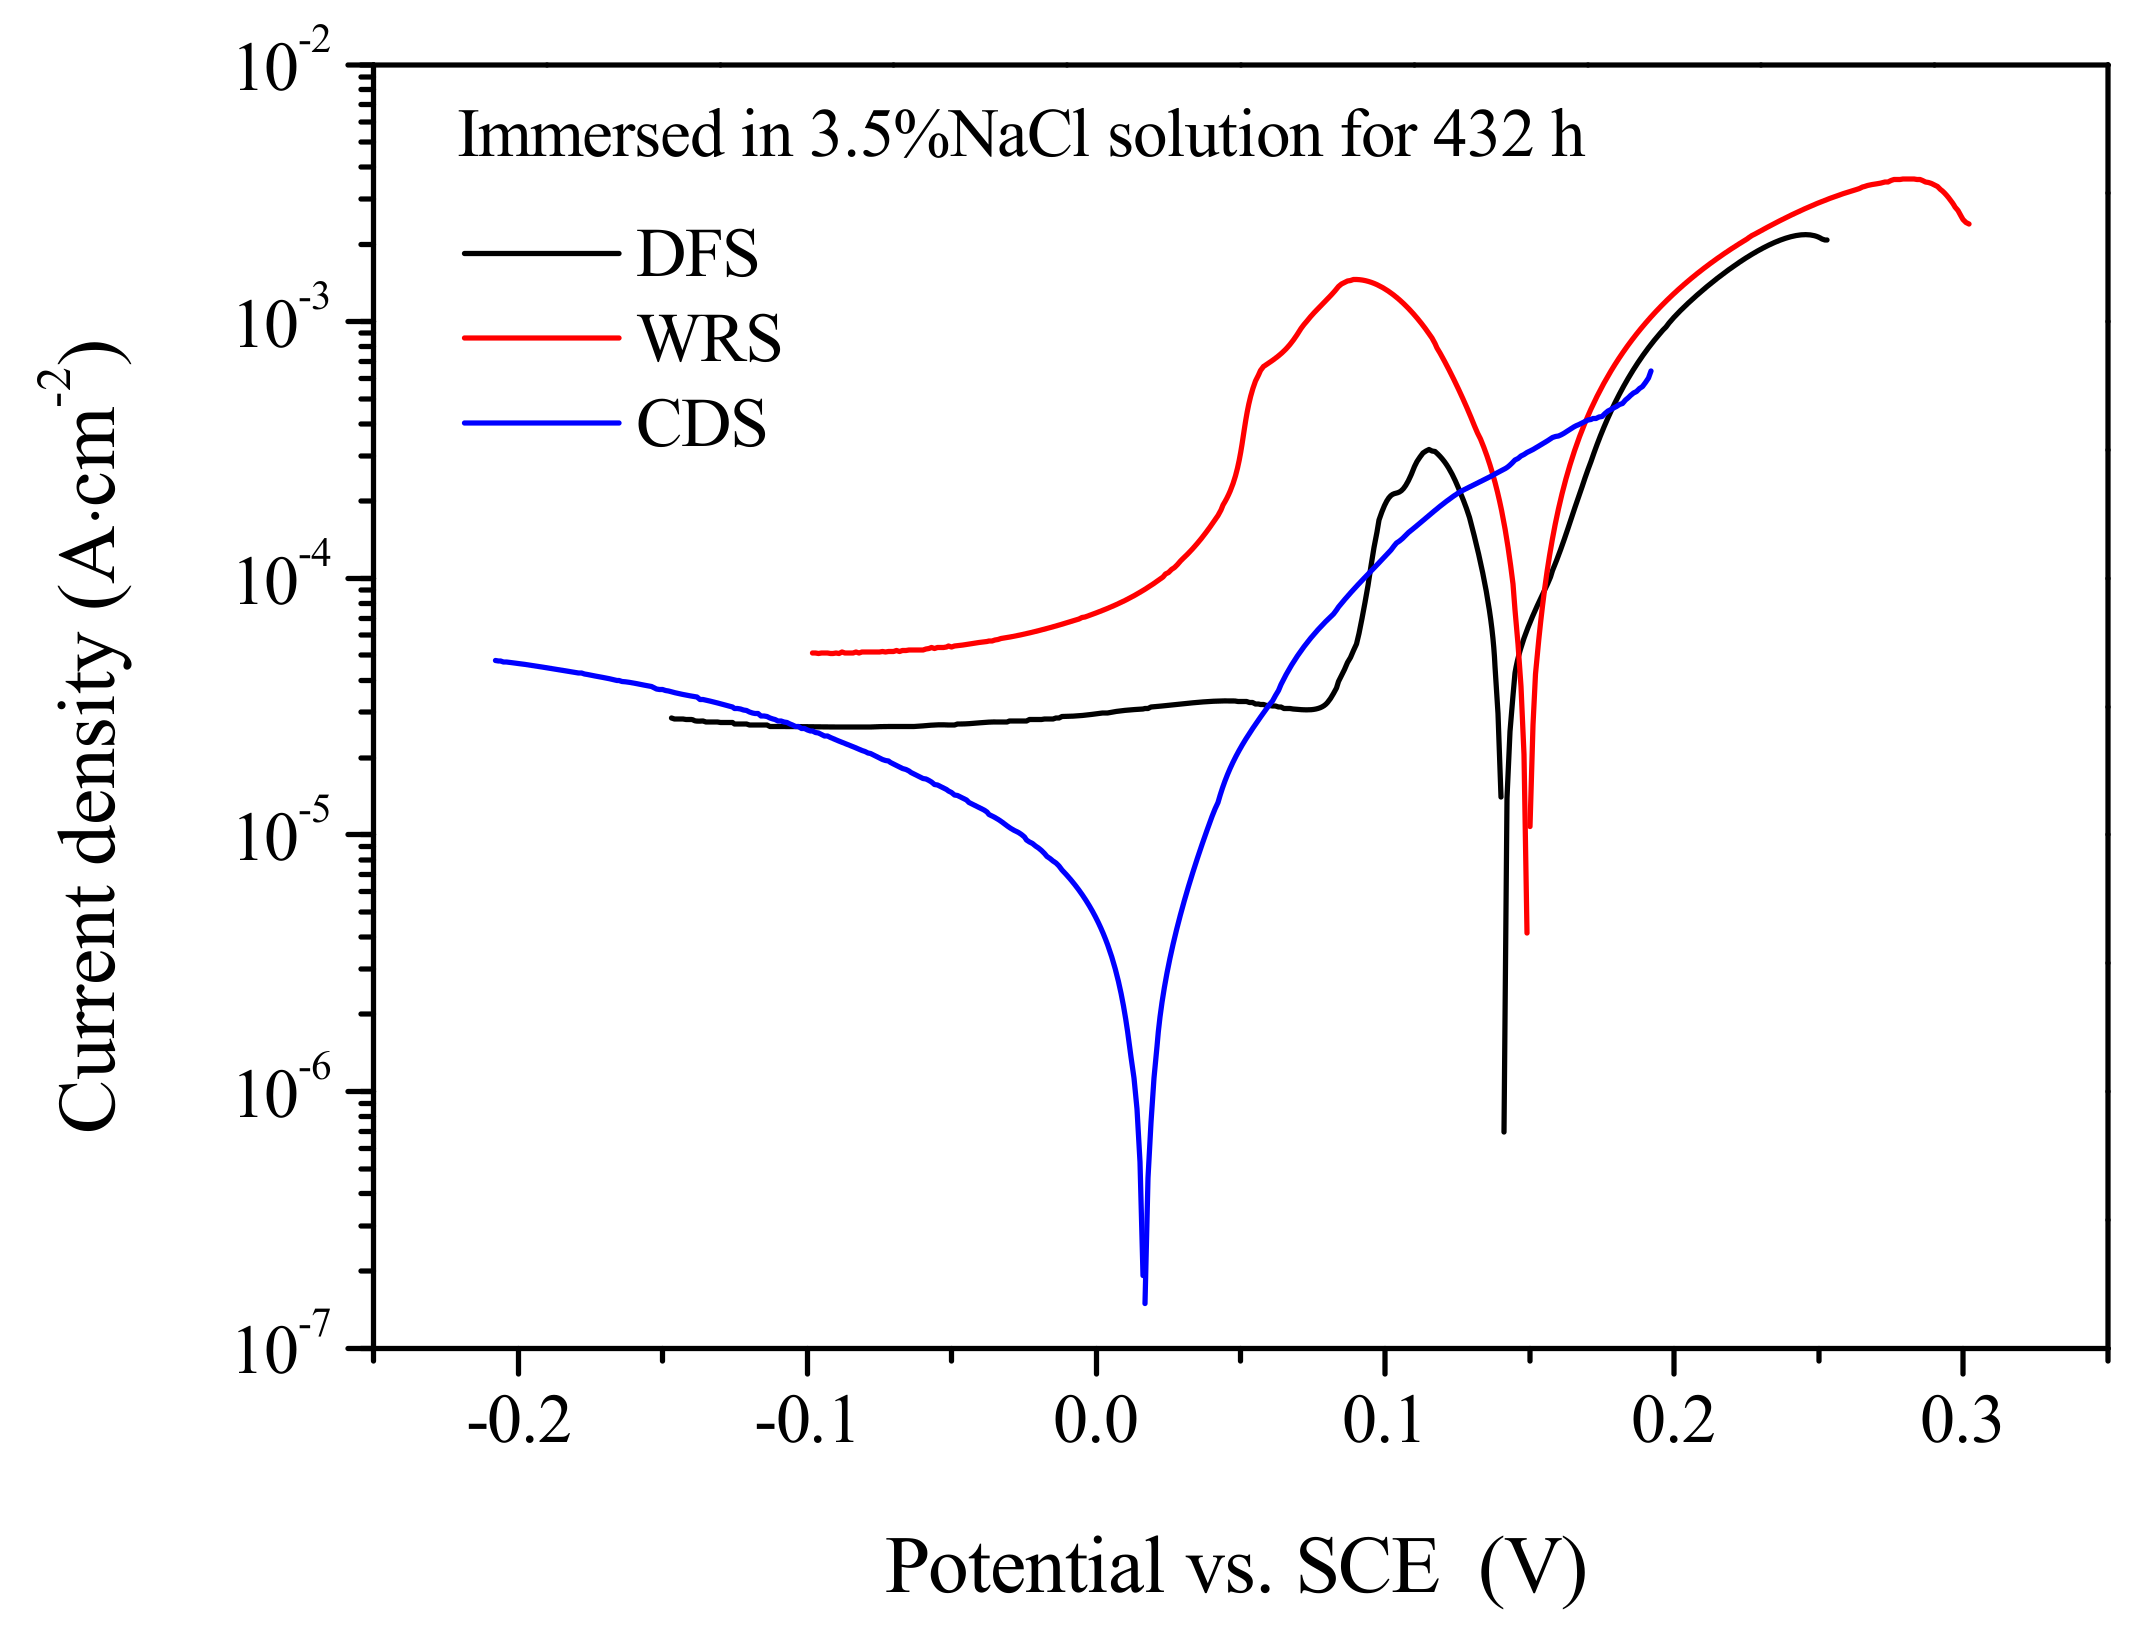
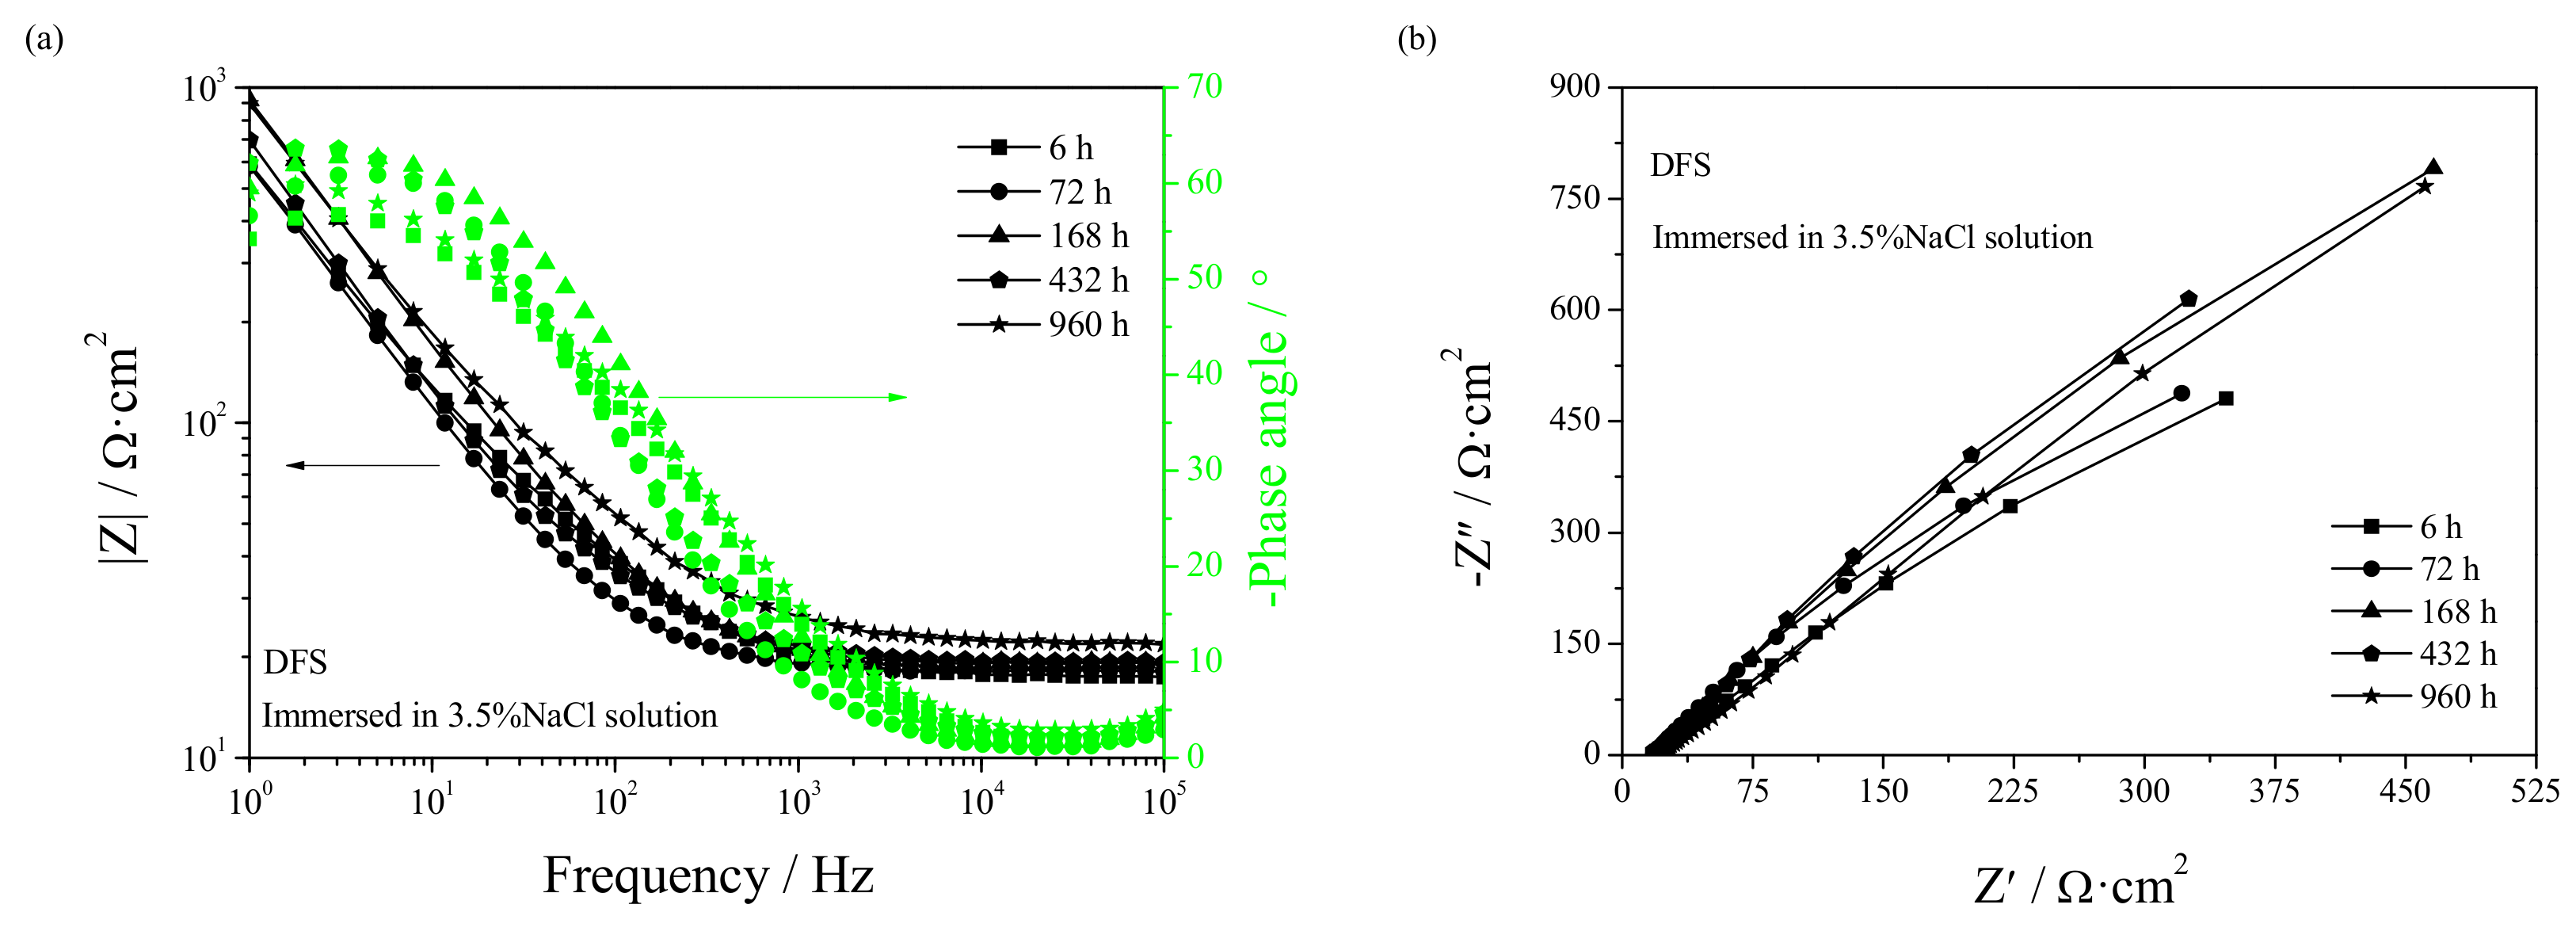
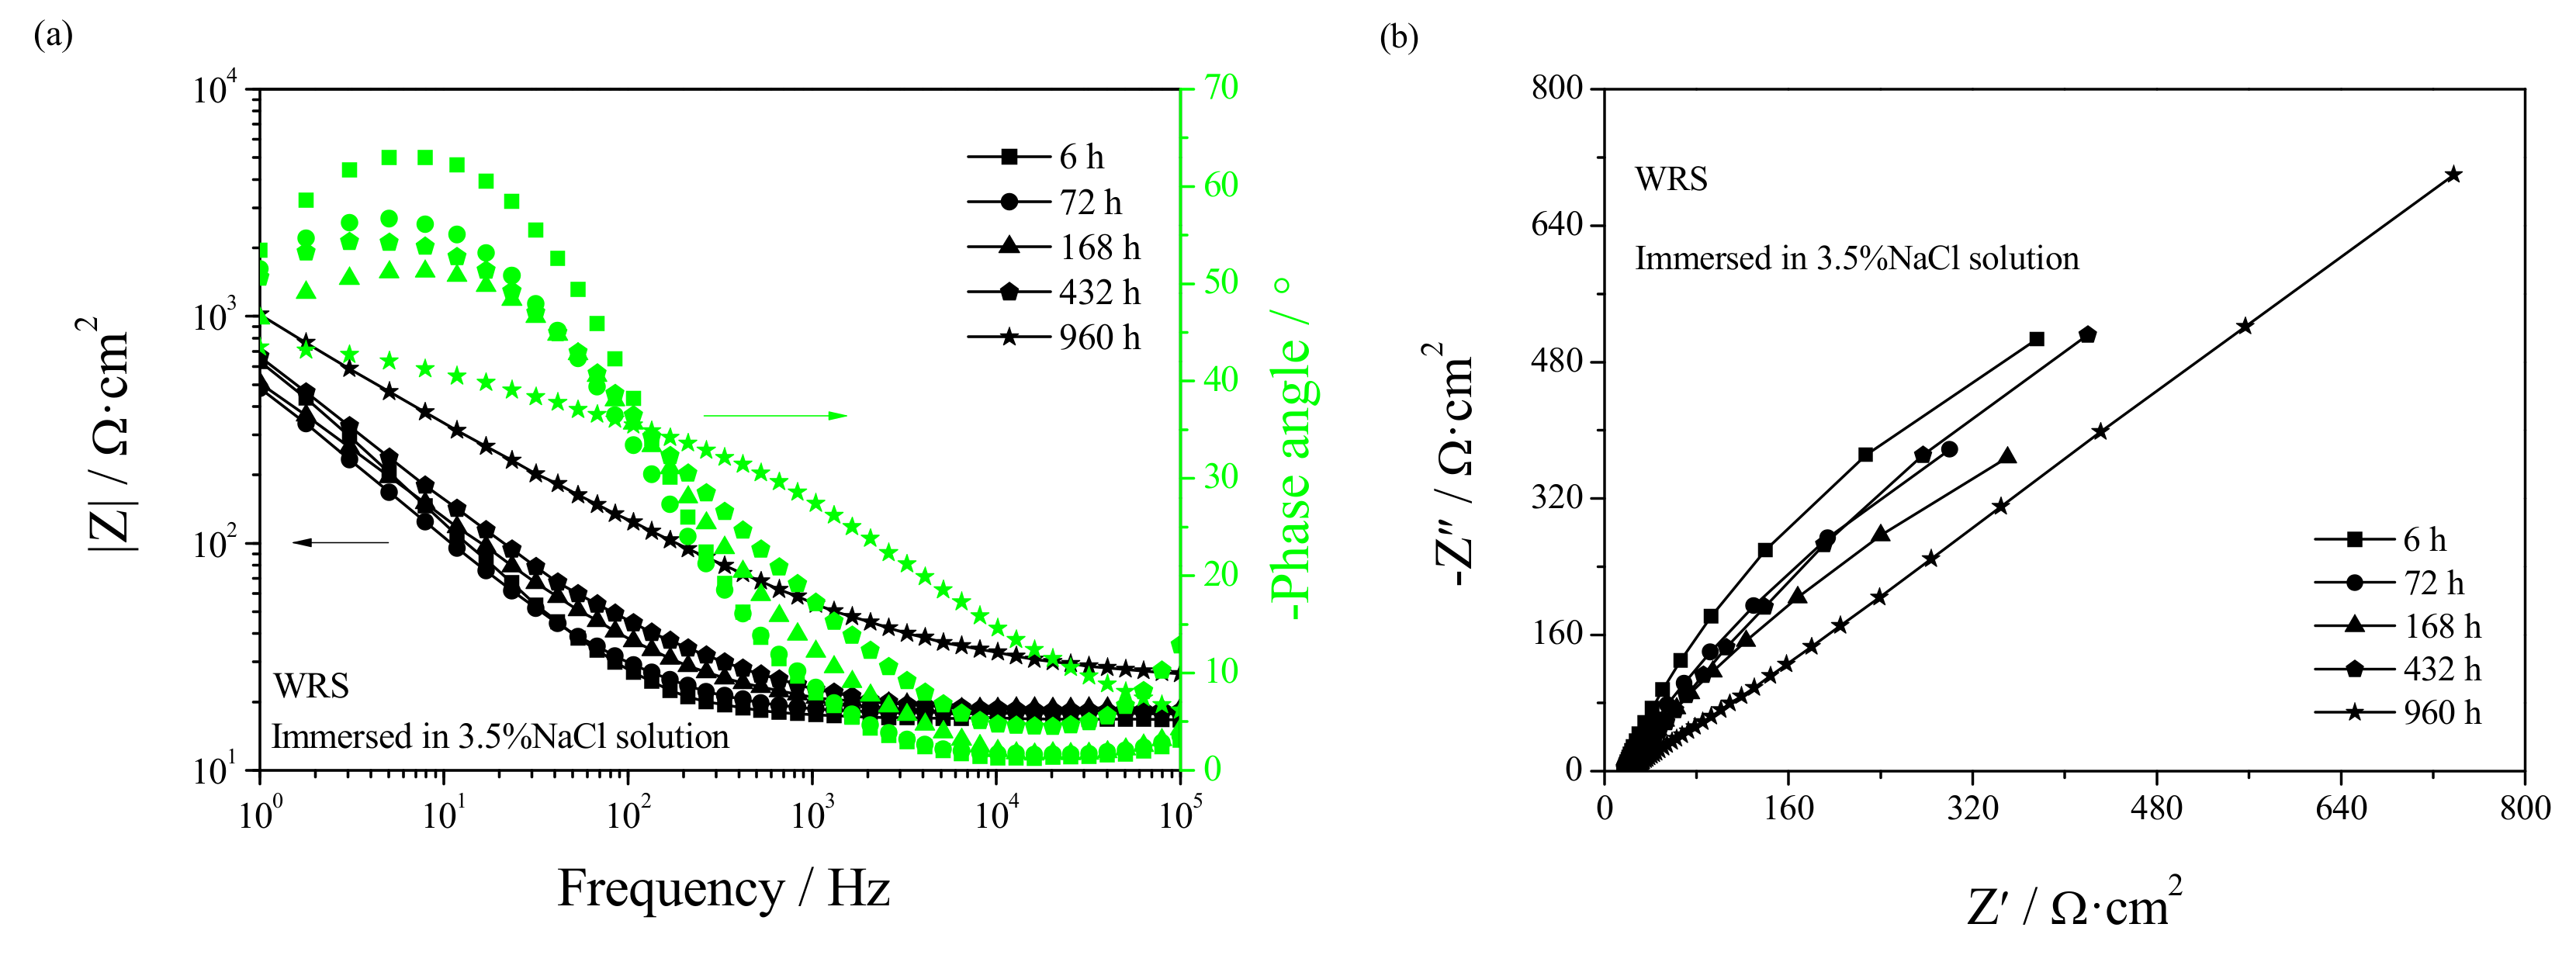
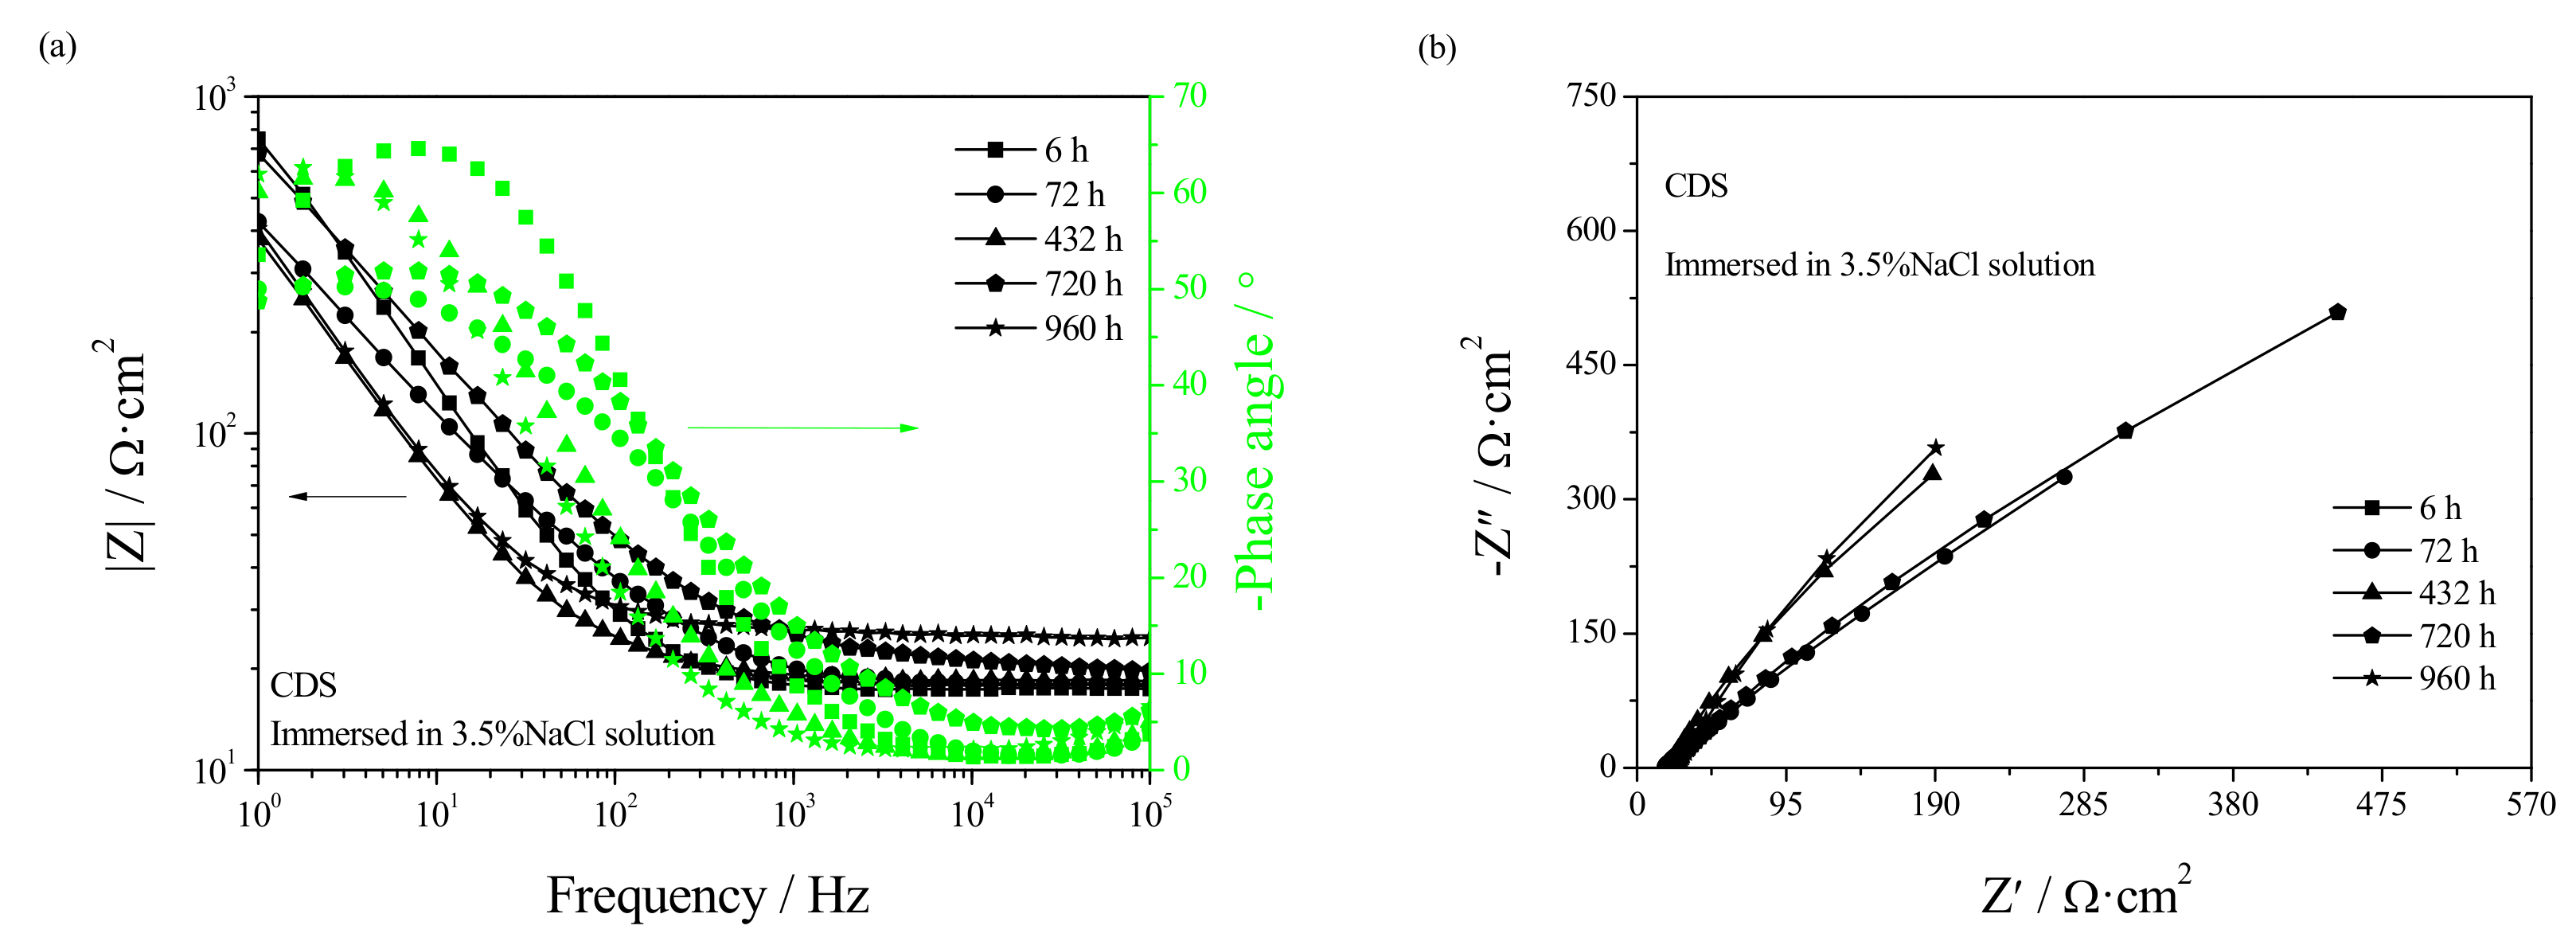
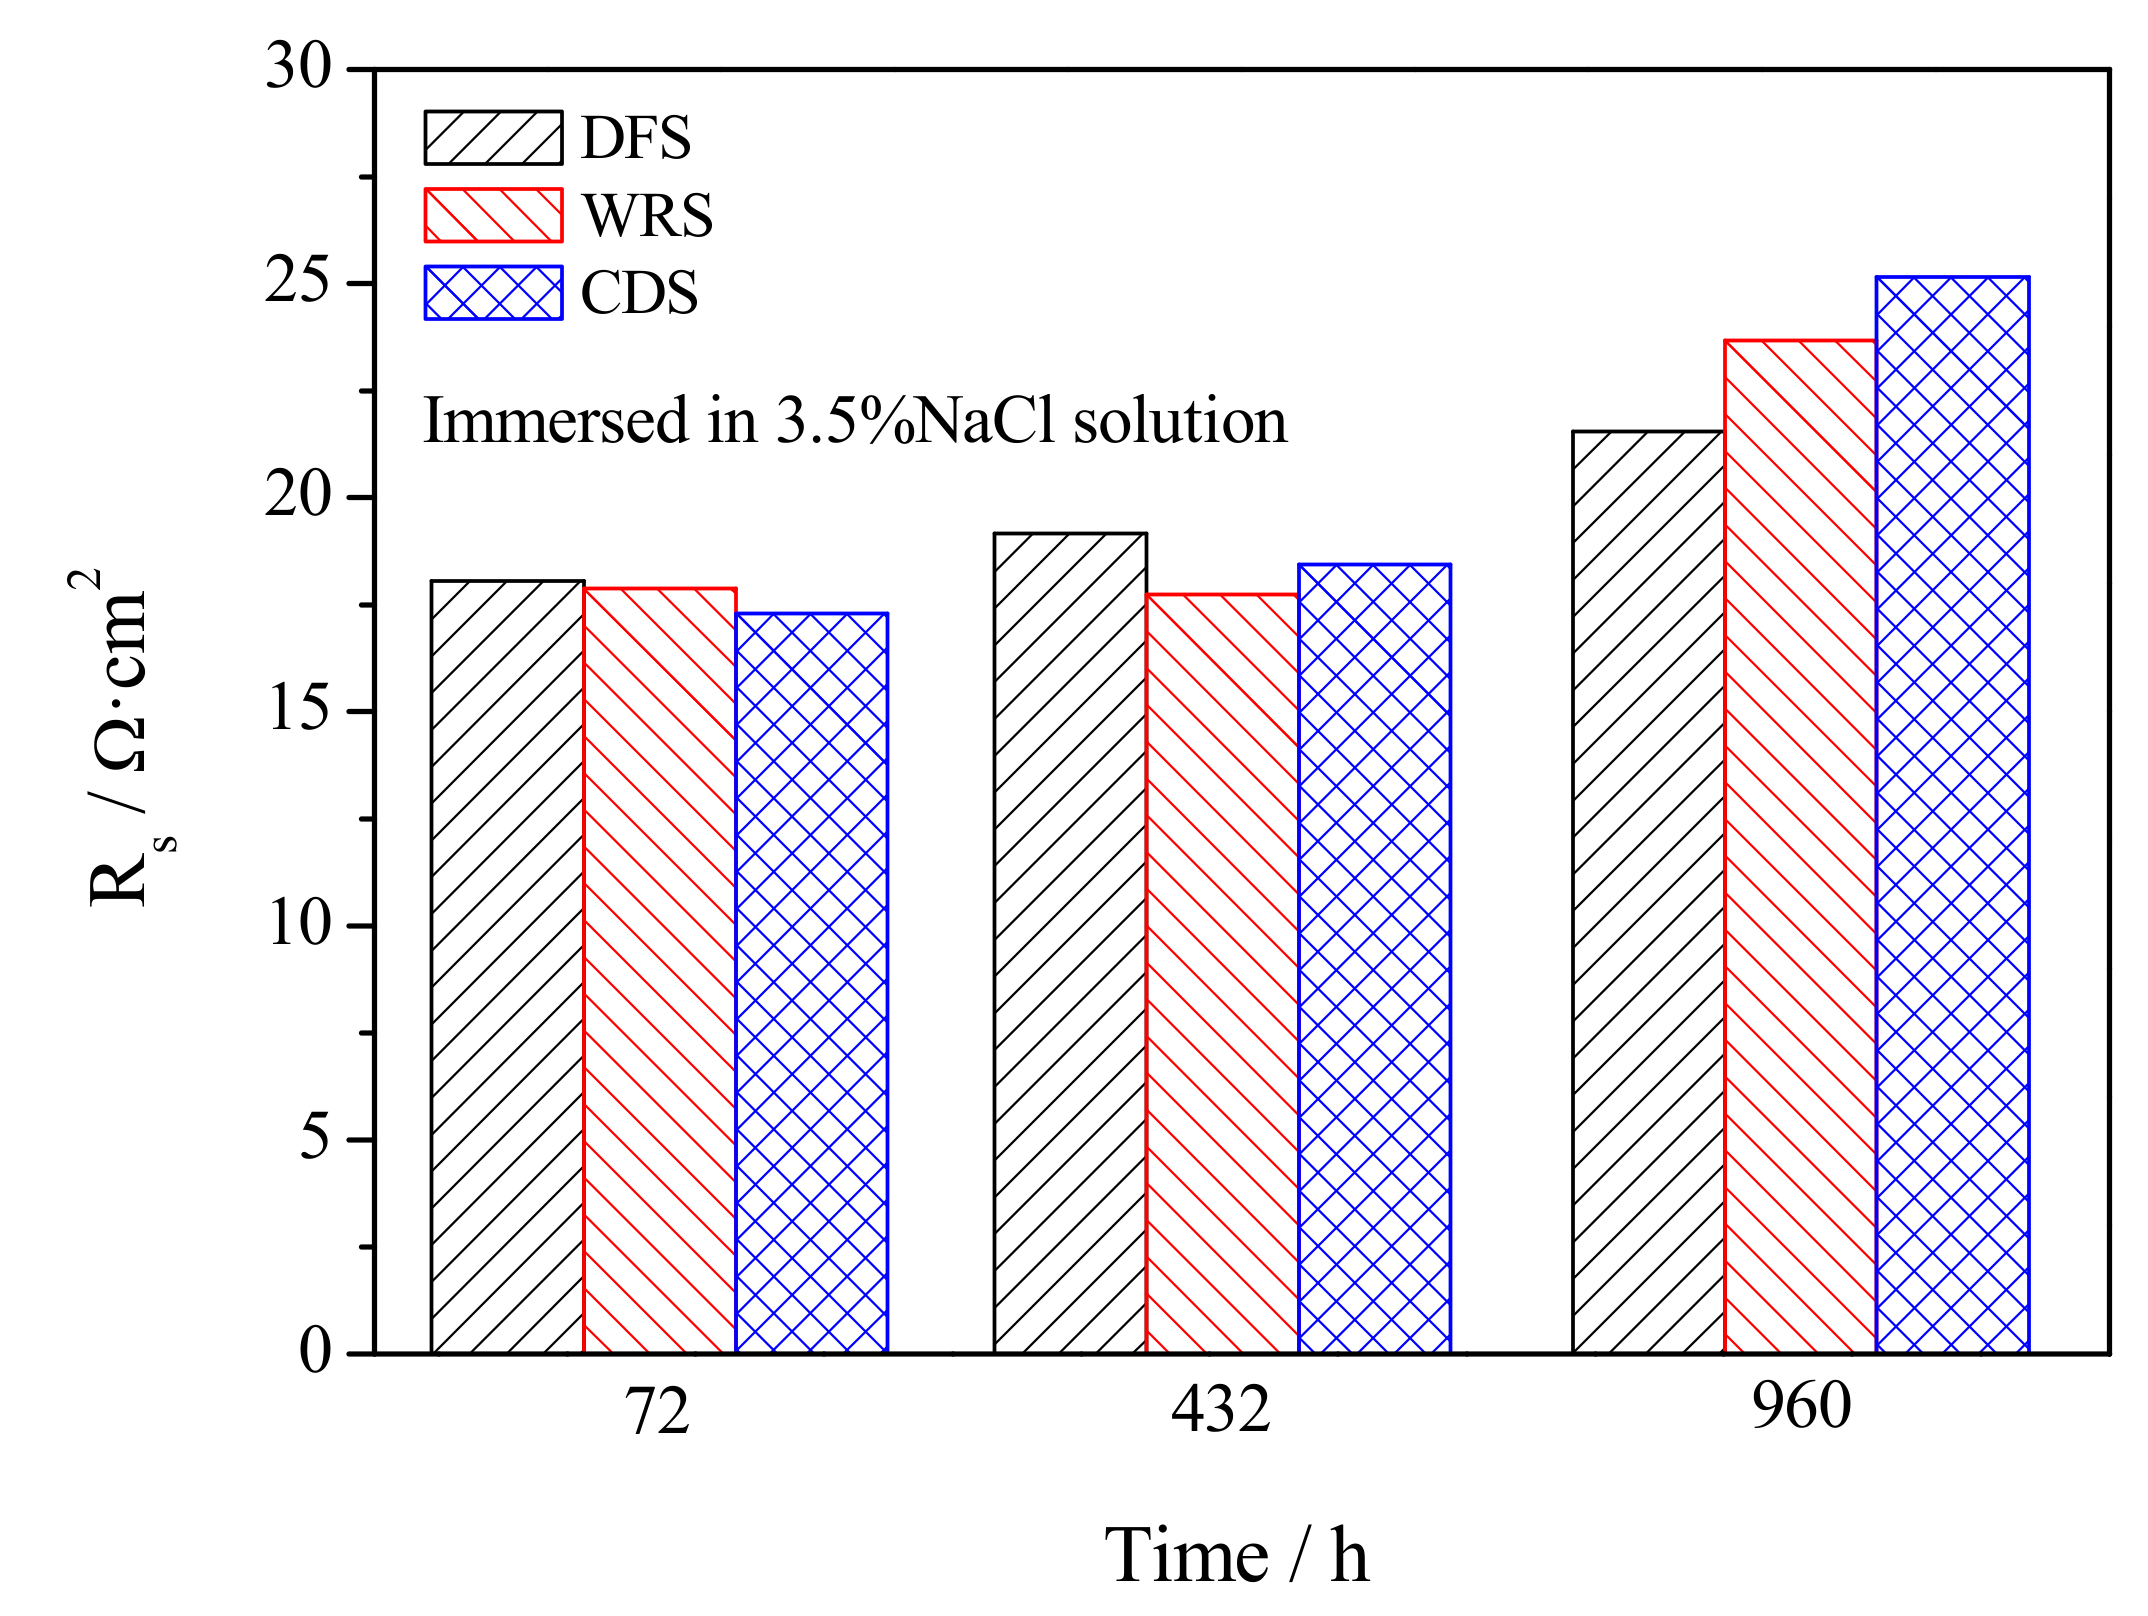
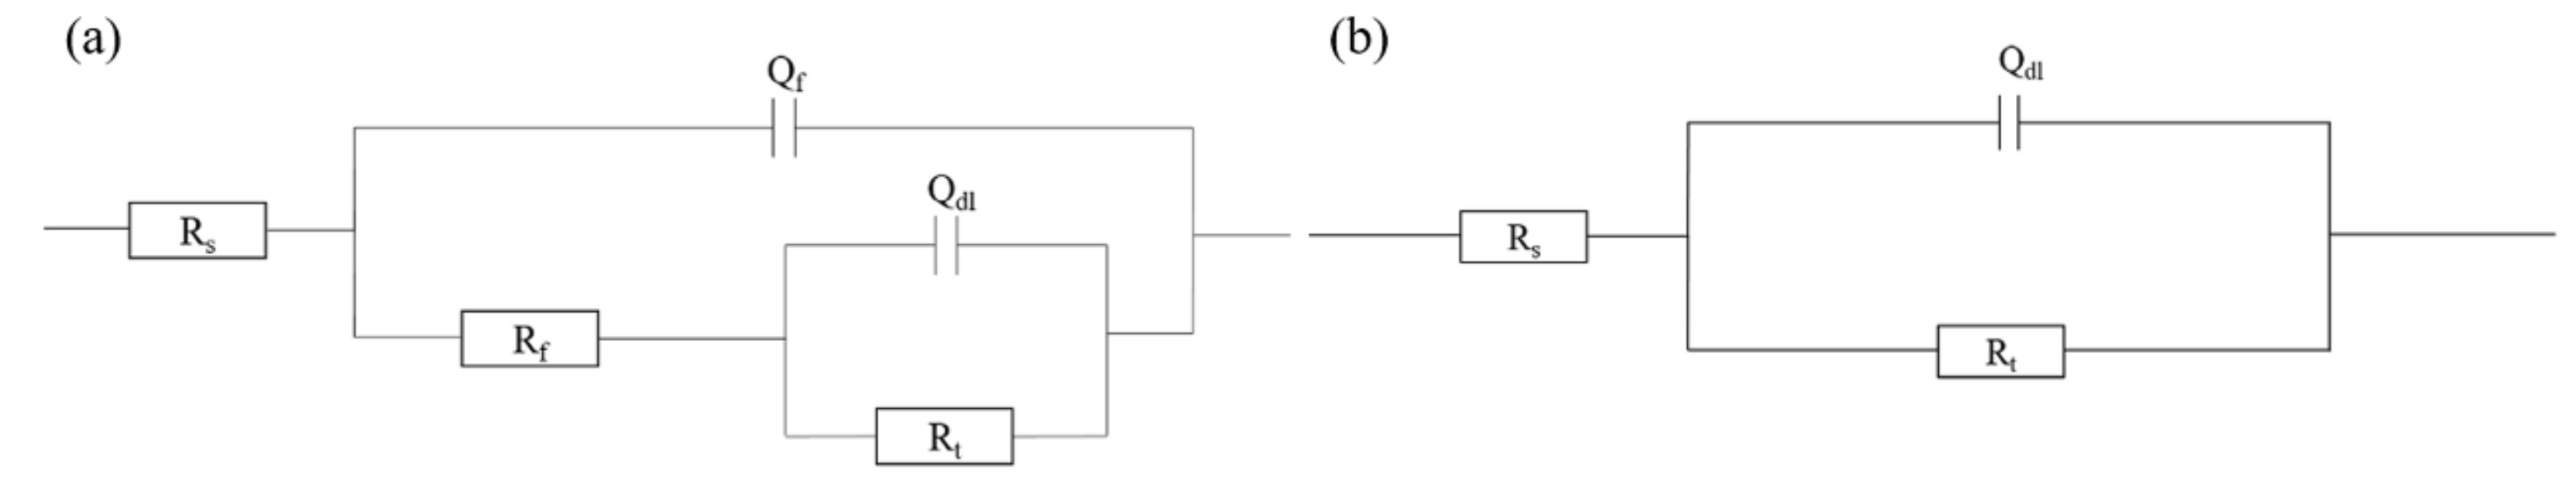
3.4. Electrochemical Corrosion Mechanism

The corrosion rate, corrosion morphology and corrosion product of as-cast UNS C95810 are decided by the corrosion mechanism. To study the effect of weld and defects on the corrosion mechanism of as-cast UNS C95810, the polarization curves (Figure 11) and EIS (Figure 12, Figure 13 and Figure 14) of DFS, WRS and CDS were measured. The polarization curve (Figure 11) of DFS and WRS present the same trend: the anodic polarization current density increases with potential but decreases with time while the cathodic polarization current density increases with the potential firstly and then decreases, and moreover, the cathodic polarization current density of WRS is larger than that of DFS (Figure 11). The anodic dissolution of the as-cast UNS C95810 is ongoing during the immersion process. Since a larger and thicker passivation film can be formed as the immersion time is extended, the anode dissolution current density increases with potential but decreases with time. Because a passivation film is loose, it is easy to be damaged. After being damaged, a fresh metal substrate is exposed. Its corrosion causes the current density to gradually increase. However, the oxygen absorbing, the metal displacement and the passivation film formation reaction are also progressing. Therefore, after the cathodic polarization current density is increased to a certain extent, it gradually decreases and tends to be stable. After the as-cast UNS C95810 is welded, its microstructure is inhomogeneous due to the introduction of welding consumables and heat treatment, resulting in an increase in the unevenness of the corrosion product film grown on the surface, which leads to producing greater growth stress [20]. An increase in growth stress will make the film more loose (Figure 6c vs. Figure 7c), causing it to be damaged more easily. Therefore, the cathodic polarization current density (Figure 11) of WRS is higher than that of DFS.
The cathodic polarization curve (Figure 11) of CDS is different from that of DFS and WRS. The cathodic polarization current density of CDS increases with potential. This means that CDS is in a corrosion state for 432 h. This is mainly due to the fact that the microstructures at defects mainly include the α phase, the κ phase and an oxide of copper and aluminum [17]. Therefore, defects can form a small anode and large cathode corrosion galvanic couple with the surrounding microstructures, thereby accelerating the corrosion of the microstructures around the defects, causing their anodic current density to always be higher than the rest of the metal surface, finally leading to the preferential forming of a corrosion hole around the defects. Once the corrosion hole is formed, the local surface near the corrosion hole becomes concave. It becomes difficult for Cl− in a solution layer adjacent to the local surface to diffuse outwards, resulting in that the solution layer is more and more different from other solution layers adjacent to the remaining surface of the metal. Since the local surface state and the local solution composition are changed, the local surface is still in the active anodic dissolution state when the remaining surface is in a passive state. In addition to the introduction of additional galvanic corrosion, defects can cause discontinuities in the corrosion product film. Therefore, CDS will be in a corrosive state for 432 h.
From the polarization curve of DFS, WRS and CDS, it can be known that after corrosion, DFS and WRS are in a passive state while CDS is in an anodic dissolution state. Since the anodic dissolution and passivation process of metals can be investigated by EIS [21], the corrosion mechanism of WRS and CDS can be studied by comparing the EIS of DFS, WRS and CDS. DFS and WRS are in passivation state, and as a result their electrochemical impedance, their spectroscopies should exhibit two time constants, as can be seen in Figure 12a and Figure 13a. CDS is different from DFS and WRS in that it is in the state of anodic dissolution, showing a one-time constant, as shown in Figure 14a. In general, when a metal that can be passivated is corroded in a corrosive medium, the composition of the solution, the composition of the passivation film and the reaction at the metal interface change with the corrosion time [22]. In EIS, the change corresponds to the evolution of solution resistance (Rs), passivation film resistance (Rf) and charge transfer resistance (Rt) over time. In this paper, Cl destroys the passivation film composed of Al2O3 and Cu2O in the early stage of corrosion and participates in the formation process of the outer passivation film in the later stage of corrosion. Therefore, the Cl concentration in the corrosive medium will slightly decrease with the corrosion time, as can be in Figure 15 (obtained by fitting using Figure 16). The composition of UNS C95810 mainly includes four elements: Cu, Al, Fe and Ni. The electrode potentials of the four elements from low to high are Al, Fe, Ni, Cu [19]. Therefore, the oxide firstly formed on the surface of UNS C95810 should be Al2O3, which can be seen from Table 4. Cl acts as a nucleophile to attack the high charge and small radius Al3+ in the Al2O3 crystal, weakening the electrostatic interaction between Al3+ and O2−, making Cl replace O2− to combine with Al3+ to form a coordination complex ion (AlCl4) to dissolve. In addition to reacting with Al2O3, Cl can also react with Cu2O to convert Cu2O into Cu2(OH)3Cl and CuCl2 [23], thereby destroying the compactness of the passivation film in the early stage of corrosion. In the later stage of corrosion, as more and more Cu2(OH)3Cl and CuCl2 are produced, one or two layers of corrosion product films are formed on the outside of Cu2O, thereby enhancing the protective performance. Therefore, from the overall process of corrosion, the corrosion product film undergoes a process of formation–destruction–reconstruction, which can be seen from Figure 17. With the corrosion progress, since the area of the corrosion product film gradually increases and the metal participating in the anodic dissolution reaction is continuously reduced, the reaction at the metal interface is gradually slowed down, which can be seen from Figure 18. Moreover, two phenomena can be seen from Figure 17 and Figure 18: the Rf and Rt of DFS is larger before 432 h but the situation is reversed after 432 h; the Rt of CDS is always small during corrosion. This is mainly due to the following two reasons: compared with DFS, WRS has a loose passivation film when the corrosion time is less than 168 h (Figure 7c vs. Figure 6c), but the corrosion product film becomes thicker due to the faster formation of corrosion products when the corrosion time is greater than 168 h (Figure 5), thereby improving the looseness of the film (Figure 7c vs. Figure 7d); compared with DFS and WRS, CDS is always in the anodic dissolution state (Figure 11), therefore, its reaction at the metal interface is faster (Figure 18).

4. Conclusions

In this paper, the effect of welding repair and casting defect on the corrosion behavior of UNS C95810 in 3.5% NaCl solution was studied. The conclusions are as follows:
(1)
Both welding repair and casting defects increase the corrosion rate of UNS C95810.
(2)
Welding repair does not affect the composition of the corrosion product of UNS C95810, but it has an effect on the amount of the specific composition. Casting defects affect the composition of the corrosion product of UNS C95810, making it lack the outermost layer of Cu2(OH)3Cl.
(3)
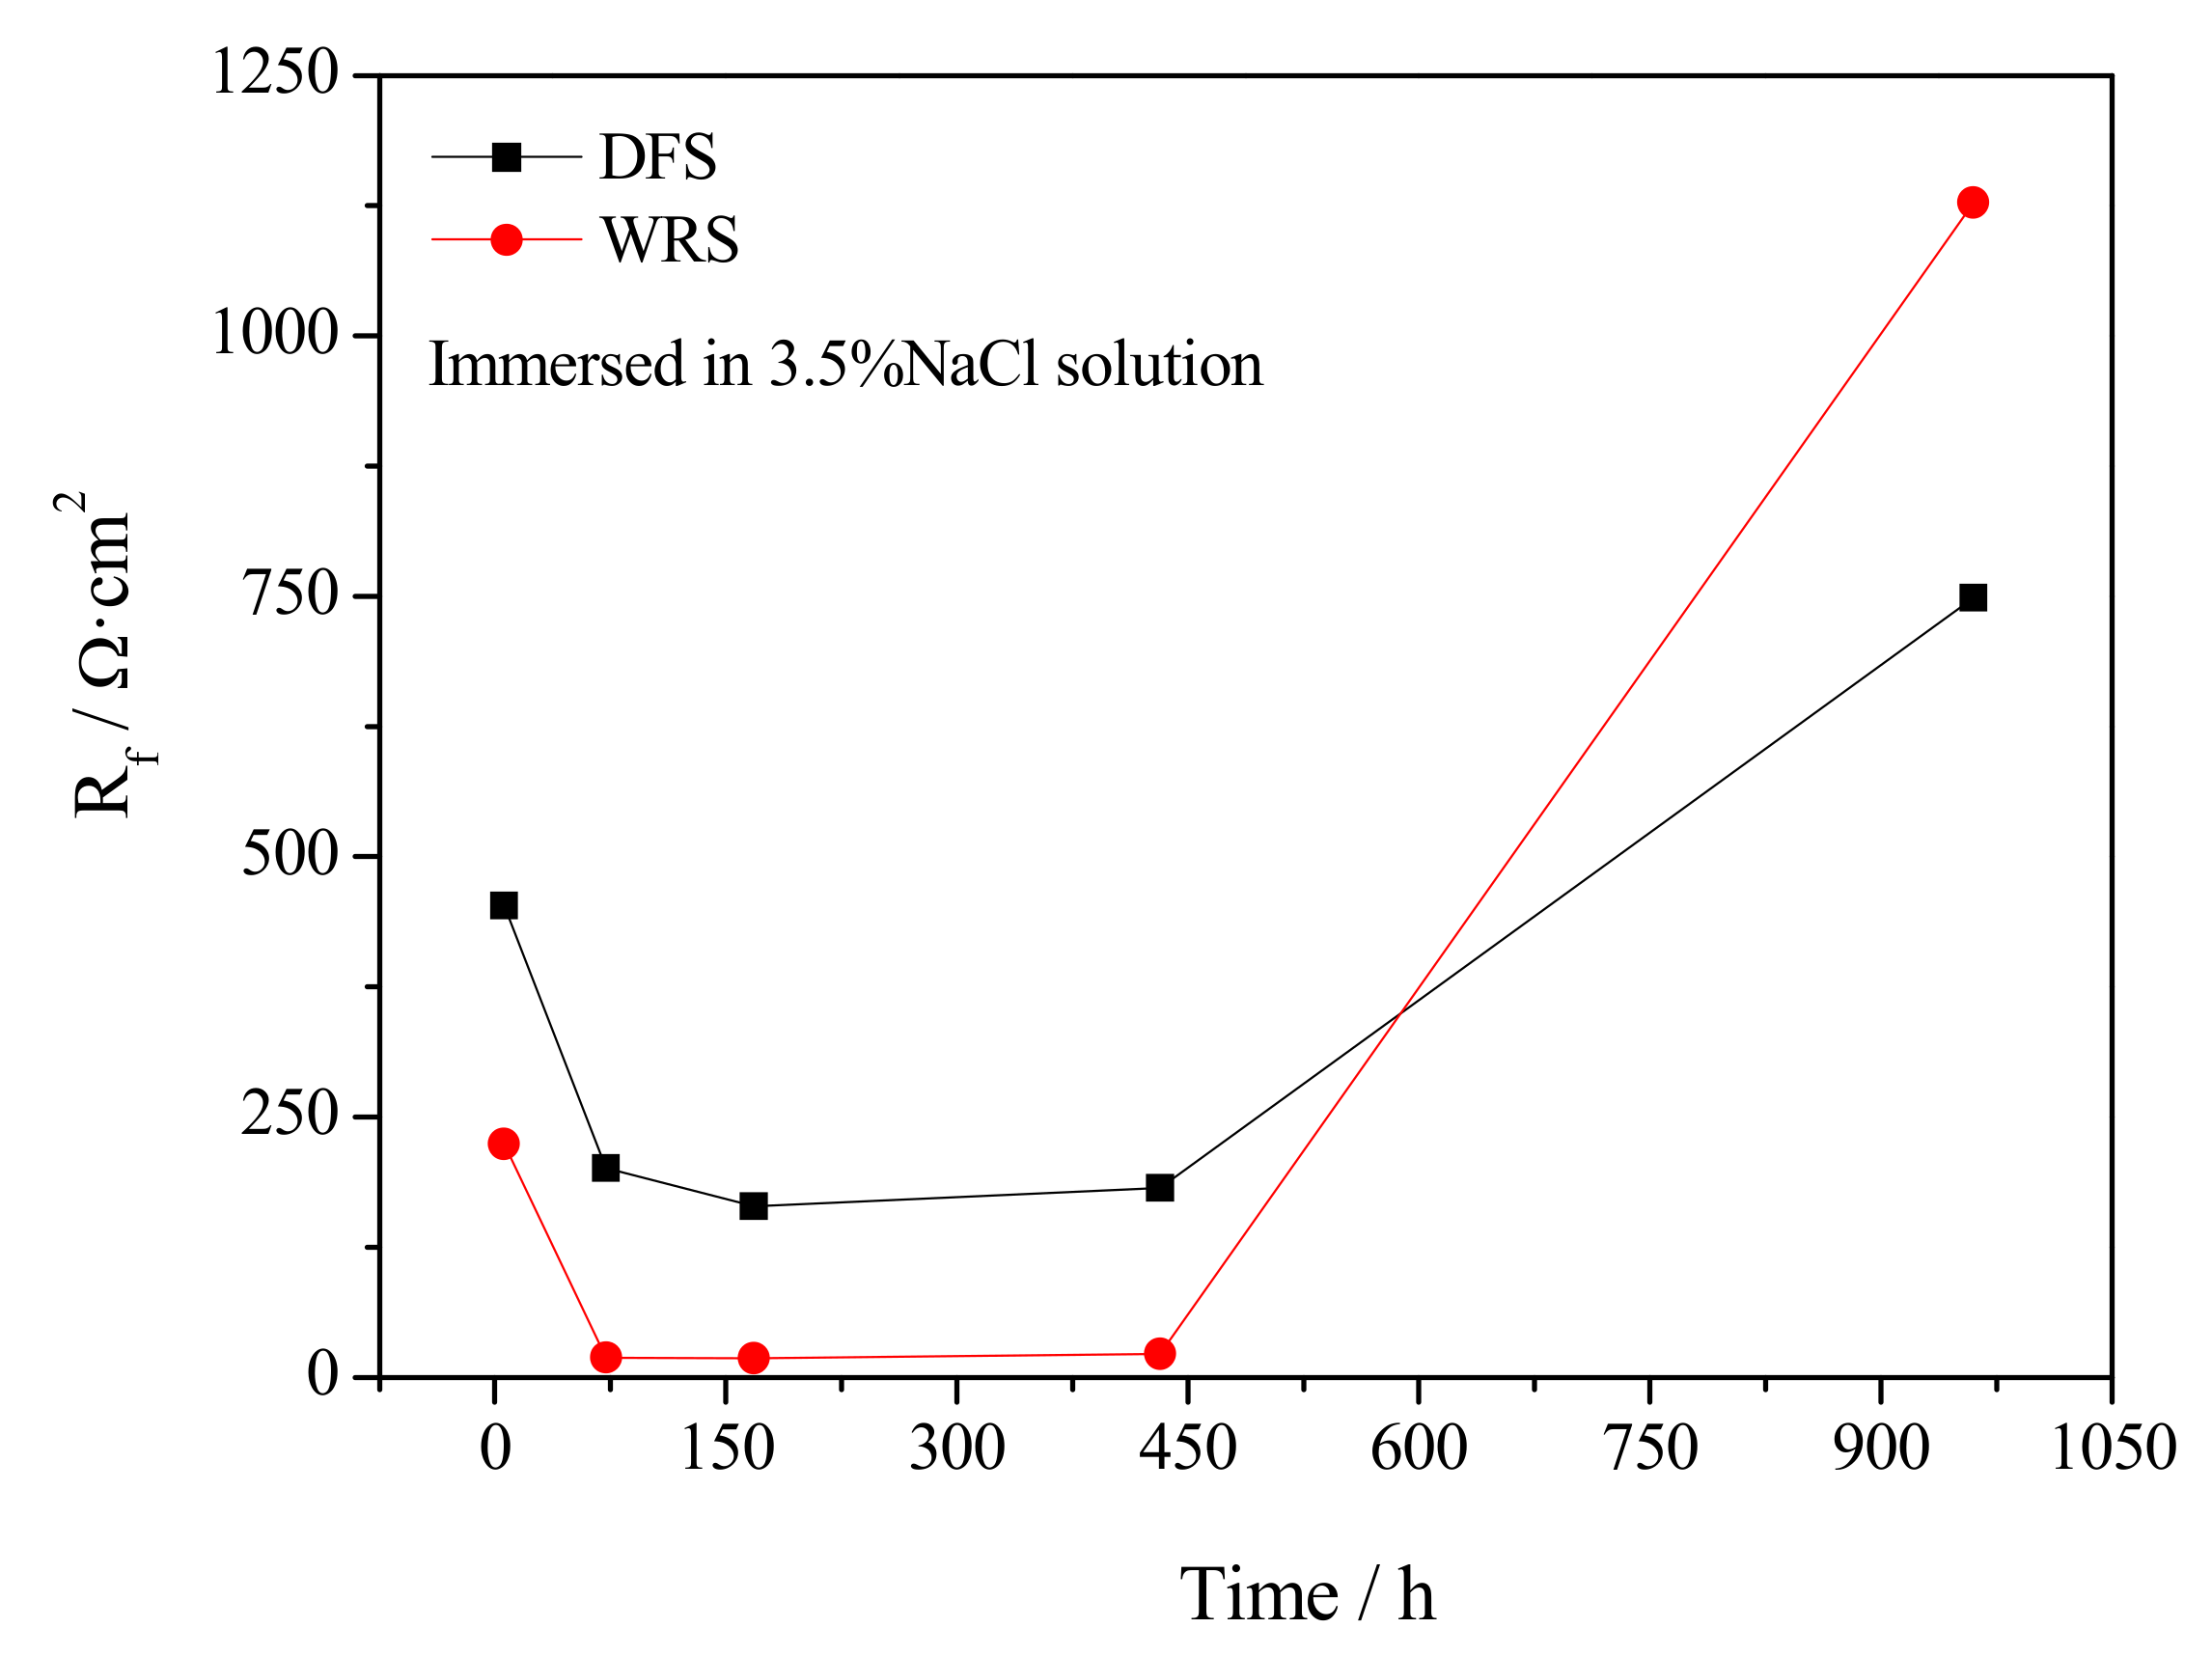
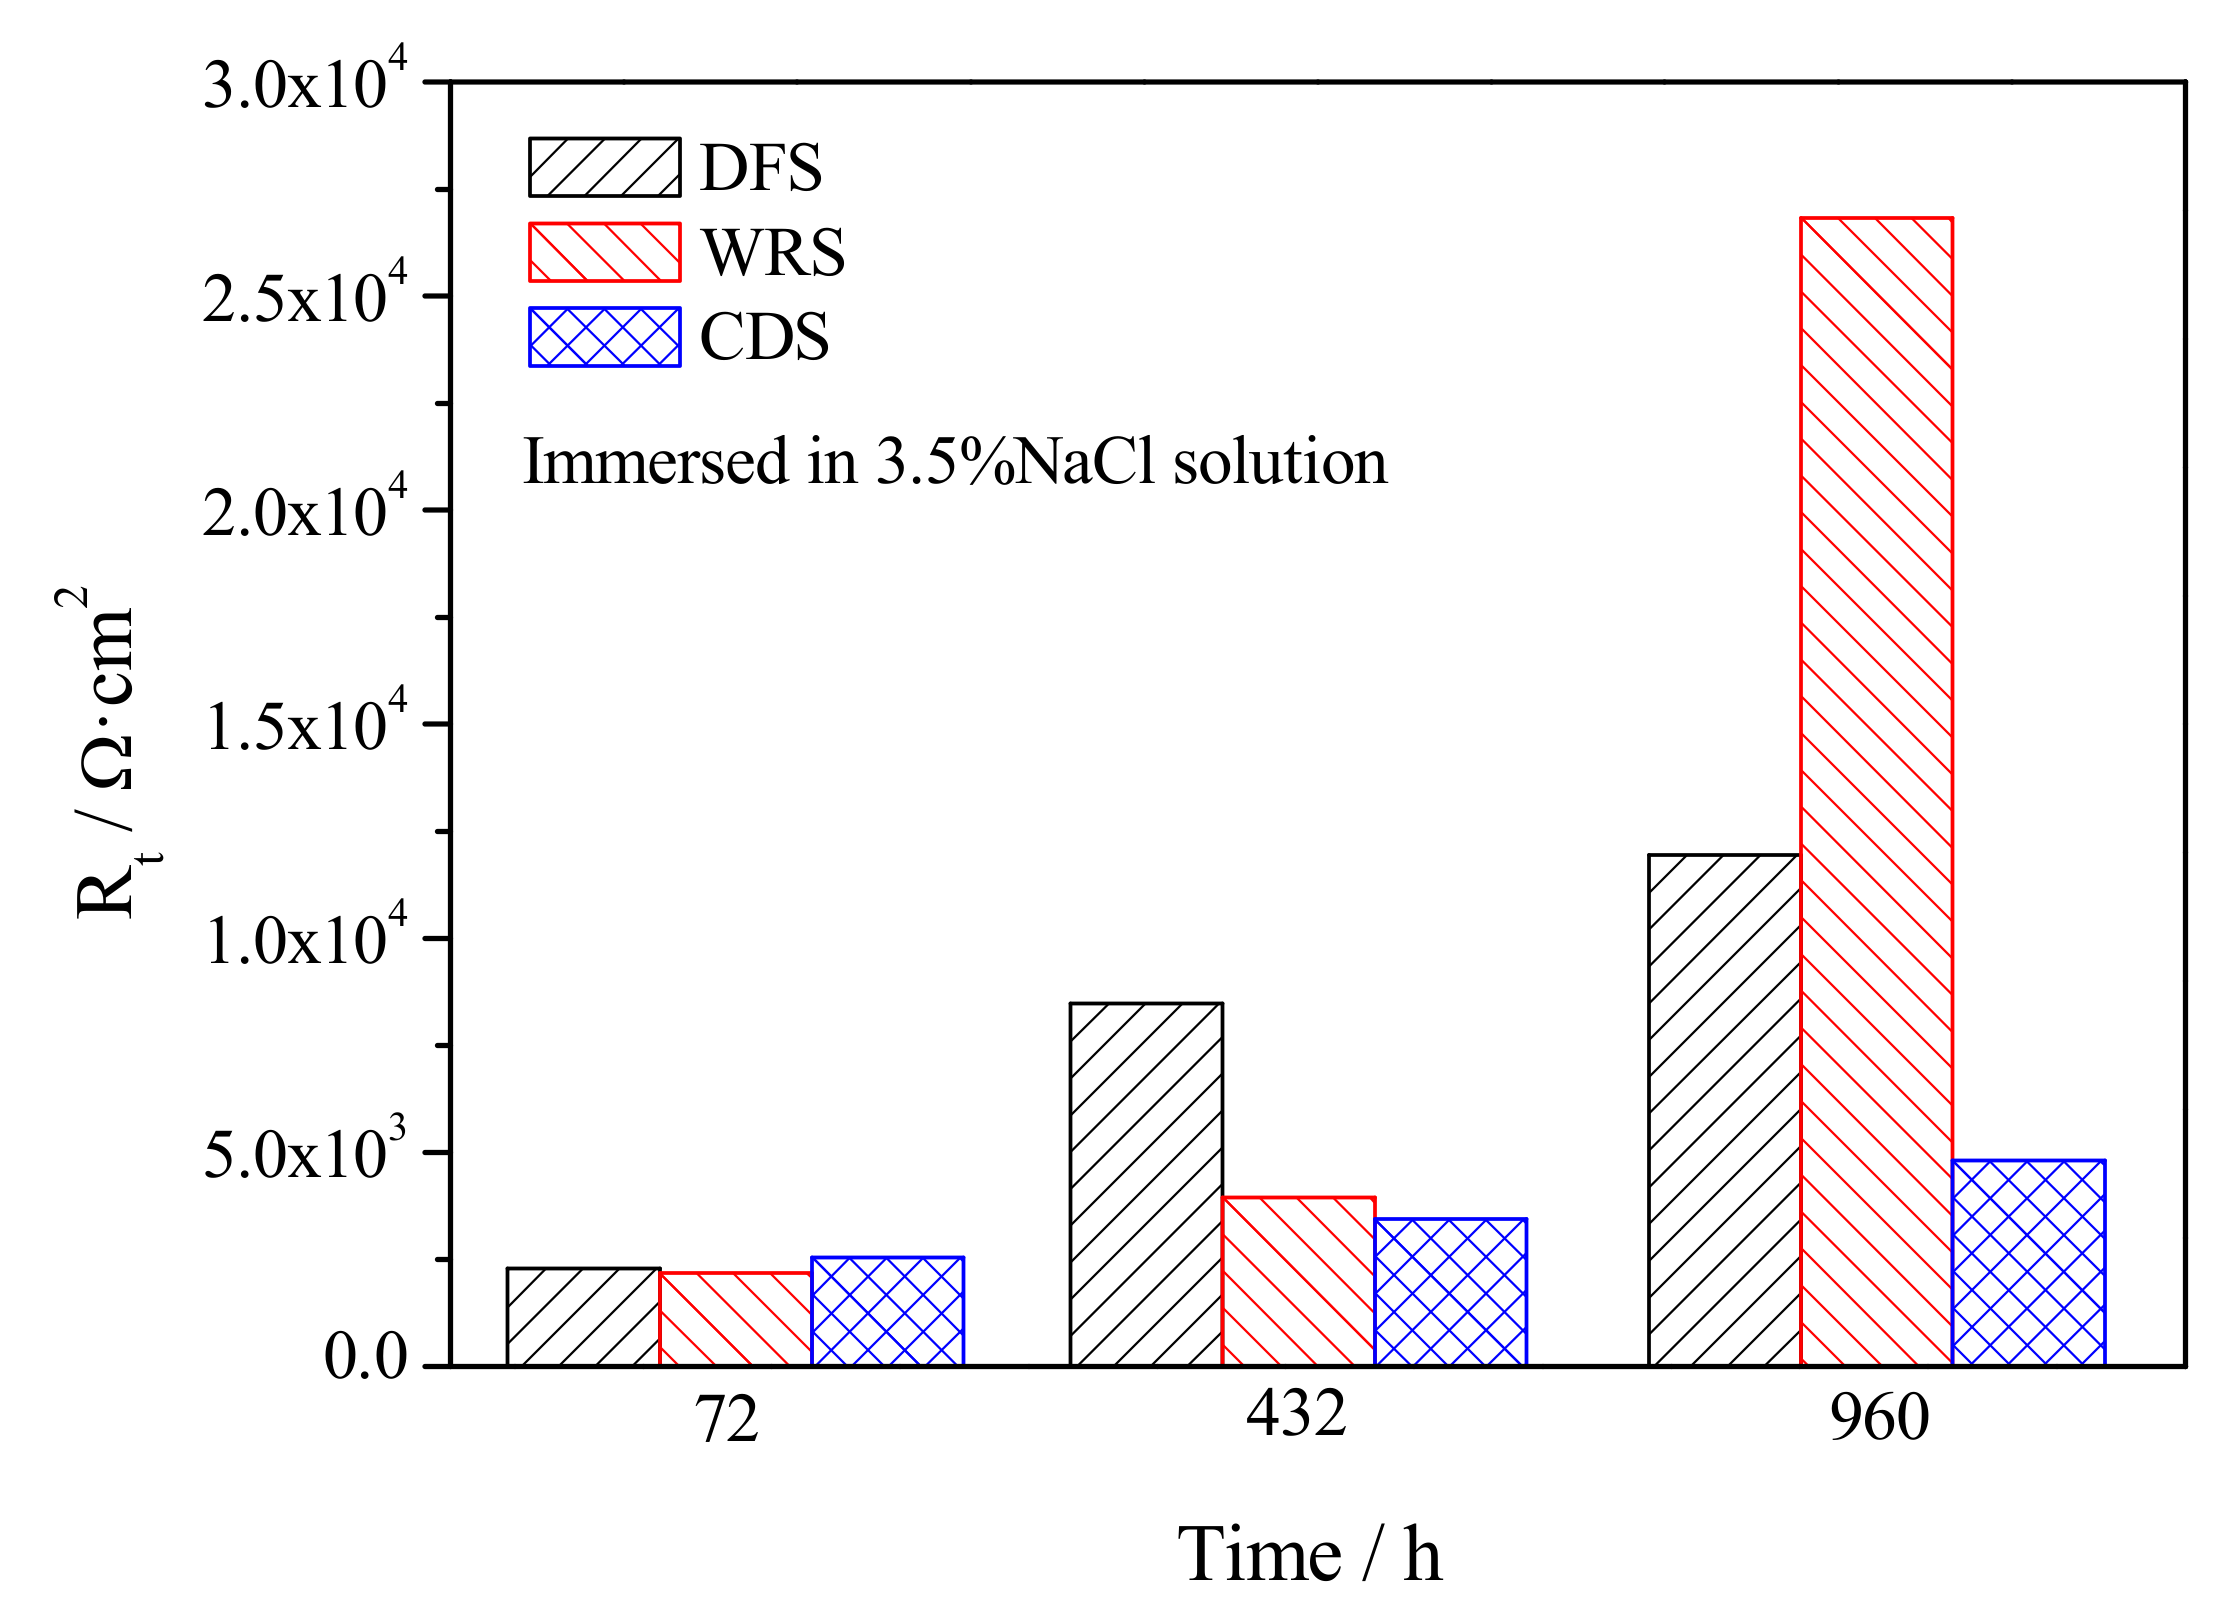
Welding repair makes the Rf and Rt in the early stage of corrosion smaller while making the Rf and Rt in the later stage of corrosion larger. Casting defects always produce an increase in the dissolution rate of UNS C95810.

Author Contributions

X.Z., Y.Q. and Z.Z., conceptualization; X.Z., Y.Q. and Z.Z., methodology; T.P., software; K.L. and J.W., validation; X.Z. and Z.Z., formal analysis; X.Z. and Z.Z. investigation; Y.Q. and Z.Z., resources; X.Z. and T.P., data curation; X.Z., writing—original draft preparation; X.Z., Z.Z. and Y.Q., writing—review and editing; X.Z., K.L., T.P. and J.W., visualization; Z.Z. and Y.Q., supervision; Z.Z. and Y.Q., project administration; Z.Z. and Y.Q., funding acquisition. All authors have read and agreed to the published version of the manuscript.

Funding

This research was funded by the National Natural Science Foundation of China [51879021], Project of Equipment Pre-research Field Fund [61409220304], Equipment Pre-research Sharing Technology Project [41404010306, 41423060314] and Dalian Maritime University’s “Double First Class” Special Construction Project (“Innovation Project”) [BSCXXM019].

Acknowledgments

Thanks to Jing Zhu, Linlin Quan and Dachuan He for preparing the specimens used in this investigation.

Conflicts of Interest

The authors declare no conflict of interest.

References

  1. Sabbaghzadeh, B.; Parvizi, R.; Davoodi, A.; Moayed, M.H. Corrosion evaluation of multi-pass welded nickel–aluminum bronze alloy in 3.5% sodium chloride solution: A restorative application of gas tungsten arc welding process. Mater. Des. 2014, 58, 346–356. [Google Scholar] [CrossRef]
  2. Wharton, J.A.; Barik, R.C.; Kear, G.; Wood, R.J.K.; Stokes, K.R.; Walsh, F.C. The corrosion of nickel–aluminium bronze in seawater. Corros. Sci. 2005, 47, 3336–3367. [Google Scholar] [CrossRef]
  3. Alfantazi, A.M.; Ahmed, T.M.; Tromans, D. Corrosion behavior of copper alloys in chloride media. Mater. Des. 2009, 30, 2425–2430. [Google Scholar] [CrossRef]
  4. Schüssler, A.; Exner, H.E. The corrosion of nickel-aluminium bronzes in seawater—II. The corrosion mechanism in the presence of sulphide pollution. Corros. Sci. 1993, 34, 1803–1811. [Google Scholar] [CrossRef]
  5. Young-Gab, C.; Su-Il, P.; Chang-Ha, K. Effect of aluminium content on the anodic behaviour of copper-aluminium alloys in 3.5 wt% NaCl solution. Mater. Lett. 1994, 20, 265–270. [Google Scholar] [CrossRef]
  6. Al-Hashem, A.; Riad, W. The role of microstructure of nickel–aluminium–bronze alloy on its cavitation corrosion behavior in natural seawater. Mater. Charact. 2002, 48, 37–41. [Google Scholar] [CrossRef]
  7. Fonlupt, S.; Bayle, B.; Delafosse, D.; Heuze, J.L. Role of second phases in the stress corrosion cracking of a nickel–aluminium bronze in saline water. Corros. Sci. 2005, 47, 2792–2806. [Google Scholar] [CrossRef]
  8. Pidaparti, R.M.; Aghazadeh, B.S.; Whitfield, A.; Rao, A.S.; Merrier, G.P. Classification of corrosion defects in NiAl bronze through image analysis. Corros. Sci. 2010, 52, 3661–3666. [Google Scholar] [CrossRef]
  9. Barik, R.C.; Wharton, J.A.; Wood, R.J.K.; Tan, K.S.; Stokes, K.R. Erosion and erosion–corrosion performance of cast and thermally sprayed nickel–aluminium bronze. Wear 2005, 259, 230–242. [Google Scholar] [CrossRef]
  10. Olszewski, A.M. Dealloying of a Nickel–Aluminum Bronze Impeller. J. Fail. Anal. Prev. 2008, 8, 505–508. [Google Scholar] [CrossRef]
  11. Ji, W.X.; Sun, X.F.; Li, Z.M.; Song, W. Repair Feasibility Research of Nickel Aluminum Bronze Surface Corrosion Damage with Precision Pulsed Plasma Powder Surfacing. Hot Work. Technol. 2018, 47, 218–226. [Google Scholar]
  12. Abbasi-Khazaei, B.; Keshavarz, S. Nickel-aluminum-bronze/Al2O3 surface nanocomposite produced by friction-stir processing: Corrosion properties and microstructure. Mater. Corros. 2017, 68, 883–891. [Google Scholar] [CrossRef]
  13. Tang, C.H.; Cheng, F.T.; Man, H.C. Effect of laser surface melting on the corrosion and cavitation erosion behaviors of a manganese-nickel-aluminium bronze. Mater. Sci. Eng. A 2004, 373, 195–203. [Google Scholar] [CrossRef]
  14. Tang, C.H.; Cheng, F.T.; Man, H.C. Laser surface alloying of a marine propeller bronze using aluminium powder Part II: Corrosion and erosion-corrosion synergism. Surf. Coat. Technol. 2006, 200, 2594–2601. [Google Scholar] [CrossRef]
  15. Li, X.Y.; Yan, Y.G.; Ma, L.; Xu, Z.M.; Li, J.G. Cavitation erosion and corrosion resistance of as-welded nickel aluminum bronze. J. Shanghai Jiaotong Univ. 2004, 38, 1464–1467. [Google Scholar]
  16. Kear, G.; Barker, B.D.; Stokes, K.; Walsh, F.C. Flow influenced electrochemical corrosion of nickel aluminium bronze–Part I. Cathodic polarisation. J. Appl. Electrochem. 2004, 34, 1235–1240. [Google Scholar] [CrossRef]
  17. Zhao, X.; Qi, Y.H.; Wang, J.T.; Zhang, Z.P.; Zhu, J.; Quan, L.L.; He, D.C. Effect of cast defects on corrosion behavior and mechanism of UNS C95810 in artificial seawater. Materials 2020, 13, 1790. [Google Scholar] [CrossRef] [Green Version]
  18. Qi, Y.H.; Zhang, Z.P.; Miao, M.; Zhang, X.Z. Studies on estimating methods of polarization performance for coated steel in seawater. Mater. Sci. Forum 2010, 654, 2418–2421. [Google Scholar] [CrossRef]
  19. Du, C.Y. Research on Corrosion Resistance of the Nickel-Aluminum Bronze and the Surface Treatment on It. Master’s Thesis, Jiangsu University of Science and Technology, Zhenjiang, China, 2014. [Google Scholar]
  20. Song, Q.N. Effect of Friction Stir Processing on the Cavitation Erosion and Corrosion Behaviors of As-Cast Ni-Al Bronze. Ph.D. Thesis, Institute of metal research, Chinese Academy of Sciences, Shenyang, China, 2015. [Google Scholar]
  21. Cao, C.N.; Zhang, J.Q. Introduction to Electrochemical Impedance Spectroscopy; Science Press: Beijing, China, 2002. [Google Scholar]
  22. Cao, C.N. Principles of Electrochemistry of Corrosion, 3rd ed.; Chemical Industry Press: Beijing, China, 2008. [Google Scholar]
  23. Li, X.G. Corrosion Behaviors and Mechanisms of Marine Engineering Materials; Chemical Industry Press: Beijing, China, 2017. [Google Scholar]
Figure 1. The fabrication mode of DFS, WRS and CDS.
Metals 10 01227 g001
Figure 2. The microstructures before the corrosion of (a) DFS, (b) WRS and (c) CDS.
Metals 10 01227 g002
Figure 3. Specimen preparation processes.
Metals 10 01227 g003
Figure 4. The weight loss rate of DFS, WRS and CDS immersed in 3.5% NaCl solution for different times.
Metals 10 01227 g004
Figure 5. The film weight of DFS, WRS and CDS immersed in 3.5% NaCl solution for different times.
Metals 10 01227 g005
Figure 6. SEM images of DFS immersed in 3.5% NaCl solution at different times: (a) 3 h; (b) 72 h; (c) 168 h; (d) 432 h.
Metals 10 01227 g006
Figure 7. SEM images of WRS immersed in 3.5% NaCl solution at different times: (a) 3 h; (b) 72 h; (c) 168 h; (d) 432 h.
Metals 10 01227 g007
Figure 8. SEM image of CDS immersed in 3.5% NaCl solution for 3 h [17].
Metals 10 01227 g008
Figure 9. SEM images of CDS immersed in 3.5% NaCl solution at different times: (a) 3 h; (b) 72 h; (c)168 h; and (d) 432 h.
Metals 10 01227 g009
Figure 10. The XRD patterns of DFS, WRS and CDS immersed in 3.5% NaCl solution for 432 h.
Metals 10 01227 g010
Figure 11. The polarization curves of DFS, WRS and CDS immersed in 3.5% NaCl solution for 432 h.
Metals 10 01227 g011
Figure 12. Bode (a) and Nyquist (b) plot of DFS immersed at different times in 3.5% NaCl solution.
Metals 10 01227 g012
Figure 13. Bode (a) and Nyquist (b) plot of WRS immersed at different times in 3.5% NaCl solution.
Metals 10 01227 g013
Figure 14. Bode (a) and Nyquist (b) plot of CDS immersed at different times in 3.5% NaCl solution.
Metals 10 01227 g014
Figure 15. The Rs evolution of different specimens with immersion time.
Metals 10 01227 g015
Figure 16. Equivalent circuit for fitting (a) DFS/WRS and (b) CDS.
Metals 10 01227 g016
Figure 17. The Rf evolution of DFS and WRS specimens with immersion time.
Metals 10 01227 g017
Figure 18. The Rt evolution of different specimens with immersion time.
Metals 10 01227 g018
Table 1. Composition of DFS, WRS, CDS and welding wire (wt.%).
ElementsCuMnFeAlNiZnSnPbCSi
DFS79.91.394.89.244.430.0050.0230.018<0.00050.002
WRS81.91.523.48.664.20.0190.0110.015<0.00050.062
CDS79.81.754.69.254.40.0750.0210.017 0.029
Welding Wire85.661.851.98.52.060.003<0.0025<0.0025<0.00250.045
Table 2. The composition of DFS, WRS and CDS immersed in 3.5% NaCl solution for 72 h.
PositionElement Content (atom.%)
OAlMnClFeNiCu
I (II)DFS45.96 (0)9.45 (34.12)0 (2.61)13.78 (0)10.78 (26.77)0 (19.73)20.03 (16.77)
WRS53.05 (0)11.68 (0)0.71 (0)3.14 (0)4.06 (1.62) 3.8 (0)23.56 (98.38)
CDS60.71 (0)8.87 (35.61)0.49 (2.11)2.71 (0)3.76 (28.82)1.49 (22.21)21.97 (11.25)
Table 3. The composition of CDS immersed in 3.5% NaCl solution for 3 h [17].
Element Content (atom.%)
CDSOAlMnClFeNiCu
Position I73.303.33-2.132.901.4416.90
Position II-15.071.41-2.652.3378.54
Position III-29.272.6-46.3512.968.82
Table 4. The composition of DFS and WRS immersed in 3.5% NaCl solution for 3 h (atom.%).
ElementOAlClMnFeNiCu
DFS41.0512.193.511.512.058.1221.58
WRS18.2914.4200.964.144.0358.16

