Abstract
With superior flexible manufacturing capability, selective laser melting (SLM) has attracted more and more attention in the aerospace, medical, and automotive industries. However, the poor quality of the lower surface in overhanging structures is still one of the factors that limits the wide application of SLM. In this work, the influence of process parameters and scanning strategy on the lower surface quality of SLMed TA15 (Ti-6Al-2Zr-1Mo-1V) titanium alloy parts were studied. The results showed that the laser surface energy density (EF) had a significant influence on the quality of the lower surface. Excessive EF led to obvious sinking of the molten pool and a serious slag hanging phenomenon. However, the too low EF easily contributed to the insufficient powder fusion in the lower surface area, which led to the agglomeration of a molten pool during core processing, resulting in slag hanging, pores, and powder spalling that reduced the quality of the lower surface. Moreover, the cross-remelting strategy and non-remelting strategy gained better surface quality at the low EF and high EF, respectively. In addition, it was found that the quality of the lower surface could be quickly and accurately evaluated by the cooling time of the molten pool during the processing of the lower surface. This research can increase the understanding of the forming mechanism of the lower surface and has certain guiding significance for the process optimization of the lower surface.
1. Introduction
Although selective laser melting (SLM) has many significant advantages, such as capability of producing complex designs, effective material usage, short total manufacturing time, etc., it cannot be ignored that the surface quality of SLMed parts is generally poor and difficult to control, which is also one of main factors that restricts the development and application of SLM [,]. Poor surface roughness not only affects the dimensional accuracy of parts [], but also causes cracks in parts, thus seriously affecting the service life of parts []. At present, the surface quality of parts fabricated by SLM is mostly improved by post-processing, but the structure of SLM parts is generally complex, especially for the parts with curved surfaces and inner holes, which are difficult to be polished by traditional means. Recently, some researchers used abrasive flow machining (AFM) and magnetic abrasive finishing (MAF) to polish the complex surface of SLMed parts and obtained satisfactory results. Mohammadian et al. [] developed a combined-chemical abrasive flow polishing method for Inconel 625 parts prepared by SLM, and the surface roughness (Ra) with an inclination of 15° was improved by 43% after polishing for 1 h. Zhang et al. [] used magnetic abrasives to polish SLMed 316L stainless steel, with the surface roughness (Ra) decreased by 75.7% at most. Although it has been proved that these subsequent polishing methods have positive effects on improving the surface quality, these subsequent processing steps further extend the manufacturing cycle and significantly increase production costs. Therefore, improving the surface quality of parts by optimizing SLM process parameters is of great significance to reduce post-treatment steps and production costs.
According to the technical characteristics of SLM layer-by-layer manufacturing, the surface of SLMed parts can be divided into several categories, as shown in Figure 1. The surface parallel to the substrate and facing up is referred to as the top surface [], and the plane perpendicular to the substrate is called the vertical surface []. In addition, according to the inclination angle between the targeted surface and substrate, the inclined surface can be divided into the upskin (>90°) and the downskin (<90°) []. Finally, the suspended surface that is parallel to the substrate and directly in contact with powders is referred to as the lower surface []. The processing of top surface and lower surface belongs to core scanning, which is related to the laser power, laser scanning speed, and hatch spacing. The vertical surface is superposed by the edge of each layer, and its quality is only related to the process parameters of the contour. However, for the upskin and downskin, both core and contour process parameter make a difference to the surface quality, among which the contour process parameter is more influential. Furthermore, owing to the stair step-effect [], the inclination angle also can impact the surface quality of the upskin and downskin.
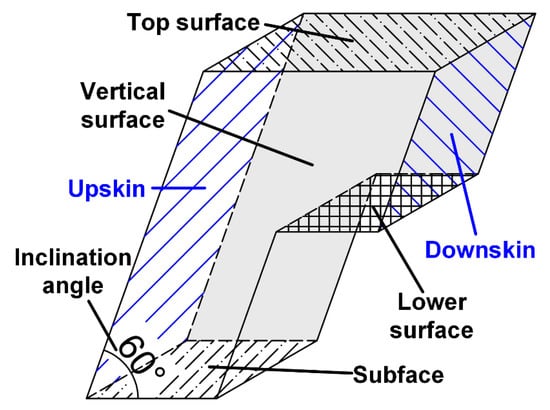
Figure 1.
Schematic diagram of different surface types of parts fabricated by selective laser melting (SLM).
In recent years, many investigations related with the surface of SLMed parts were reported. The relatively flat top surface is manufactured mainly by selecting a continuous, straight single track with appropriate hatch spacing. In addition, the laser remelting process is generally used to greatly improve the quality of the top surface [,,,,]. With regard to the vertical surface, Mumtaz et al. [] achieved the desired surface roughness by increasing the scanning speed of the contour to limit the thermal variation in the molten pool and control the stability of the scanning. Tao Yang et al. [] studied the effect of linear energy density of the contour on the vertical roughness of AlSi10Mg parts fabricated by SLM. The results showed that the low linear energy density tends to cause spheroidization, and the high linear energy density would give rise to the instability of the molten pool, resulting in a “fluctuating” structure. The roughness of vertical surface was reduced from 15 μm to 4 μm by process optimization. With respect to of the upskin and downskin surface, Tian et al. [] investigated the impact of process parameters of the contour on the roughness of Hastelloy X alloy parts built by SLM. Their conclusions indicated that the laser power and scanning speed have little effect on the upskin roughness, whereas the downskin roughness will dramatically increase with increasing laser power or decreasing scanning speed due to the fact that a larger melt pool will protrude outward and entrain surrounded powders. Xiang et al. [] found that the quality of the downskin is significantly worse than that of the upskin in SLMed parts of 316L stainless steel, and its roughness noticeably increased with the decrease of the inclination angle. Wang et al. [] reported that increasing the scanning speed can suppress the slag hanging on the downskin of SLMed 316L parts, thus enhancing the formability of overhanging structures.
The downskin with an inclination angle of 0° is the lower surface. Because it is formed on a complete powder bed, the thermophysical process is more complicated, and the process parameter optimization is more difficult. Thus, the research on the lower surface is very limited at present. Mertens et al. [] investigated the influence of laser power on the quality of AlSi10Mg overhanging structures manufactured by SLM. Their results revealed that the lower laser power could avoid the formation of large agglomerations and improve the quality of the lower surface but would lead to more pores in the lower surface area and a density reduction of parts. Saunders [] concluded that the parts manufactured by SLM include bulk regions and different types of surfaces. High density, high efficiency, and good material properties should be pursued when manufacturing the bulk regions, but surface manufacturing is different, in that it is necessary to consider avoiding distortion and dross. Therefore, it is necessary to further study how to not only maintain the density of parts, but also improve the quality of the lower surface. In addition, the influence of the scanning strategies (e.g., the effective remelting strategy to improve the quality of the top surface) on the quality of the lower surface is also noteworthy.
This work mainly focuses on the quality of the lower surface of TA15 titanium alloy fabricated by SLM. As a common titanium alloy used in aerospace, TA15 has excellent mechanical properties at room and high temperatures. Furthermore, the aerospace field has relatively stringent requirements on the surface quality of parts; therefore it is necessary to optimize the lower surface quality of TA15 fabricated by SLM. In this paper, the influence of process parameters and scanning strategies on the quality of the lower surface in SLMed TA15 parts is investigated by measuring the roughness of the lower surface, recording the cooling time of the molten pool during the lower surface manufacturing process, and observing the lower surface morphology. The results obtained in this study can increase the understanding of the manufacturing mechanism of the lower surface and have certain guiding significance for optimizing the quality of the lower surface of SLM manufacturing parts.
2. Experimental Procedures
2.1. Materials and SLM Equipment
The raw TA15 powder used in this experiment was supplied by AMC (Beijing AMC Powder Metallurgy Technology Co., Ltd., Beijing, China) and was fabricated by the electrode induction melting gas atomization (EIGA) technique, with the chemical composition shown in Table 1. Figure 2a,b shows the morphology and particle size distribution of TA15 powder, respectively, from which it can be seen that the powders had a good sphericity, and only a small amount of satellite powder existed. The particle size of powders basically conformed to a normal distribution, with the particle size ranging from 11.2 μm to 76 μm and a median particle size of 34.3 μm. The chemical composition and particle size distribution of TA15 powder were provided by the supplier. The SLM processing was carried out on a SLM commercial apparatus (EOSINT M280, EOS GmbH, Krailling, Germany) equipped with an Yb-fiber laser with laser wavelength of 1070 nm and maximum output power of 200 W.

Table 1.
Chemical composition of TA15 powder used in the experiment.
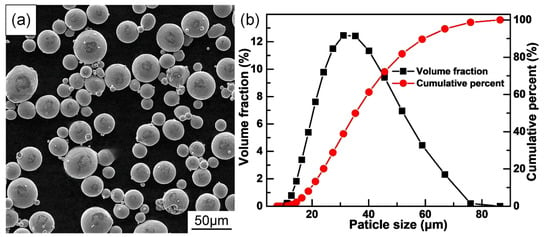
Figure 2.
(a) Morphology and (b) particle size distribution of TA15 powder.
2.2. SLM Process
Specimens with overhanging structures were designed for the lower surface forming experiment, and their dimensions are displayed in Figure 3a. The manufacturing process parameters of the parts core were optimized by the author’s previous research []. It has been confirmed by research [] that too many layers of lower surface forming will affect the density of parts, but considering the thermal influence of core processing on the lower surface area, the number of layers of lower surface forming was set to three. Two scanning strategies were used for the processing of the lower surface, namely cross-remelting (strategy I) and non-remelting (strategy II), as shown in Figure 3b. The cross-remelting strategy means that after a single scan on the same layer of powder, the scanning direction is rotated by 90° and then scanned again, which is equivalent to a single layer of powder scanning twice. This strategy can improve the forming quality of single layer [], which has been proved to play a positive role in improving the top surface of SLMed parts. This study focused on the influence of this remelting strategy and the opposite strategy of scanning each layer only once without remelting on the lower surface quality. In addition, based on the previous research results that high energy density will cause agglomeration and slag hanging [,], the process parameters of the lower surface were set according to the laser surface energy density and decreasing in sequence, as shown in Table 2, in which No. 1 was the core forming process parameter. The concept of laser surface energy density (EF) has been proposed in previous studies [], which can be used to express the laser energy density of a single layer with a certain layer thickness. The laser surface energy density of process parameters 1 to 10 is discretely distributed between 1.8 and 0.3. Based on the previous experimental results, the laser surface energy density was rapidly reduced by simultaneously reducing the laser power (P) and increasing the scanning speed (V). The hatch spacing (H) was set according to the width of a single track, which ensured that there was sufficient overlap between the cladding tracks. This study did not analyze the effect of a single process parameter on the quality of the lower surface. The thickness of the lower surface and core forming layer was 30 μm, and the scanning line of each layer was rotated by 67°. All samples were manufactured once. Samples with different process parameters and scanning strategies were marked as process parameter serial number-scanning strategy in this paper; for example, 1-I was the sample with No.1 process parameter and scanning strategy I. The equation of the laser surface energy density is as follows:
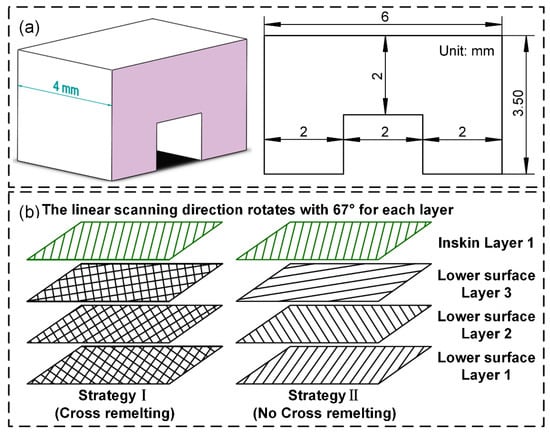
Figure 3.
Schematic diagram of (a) the dimensions of overhanging structure parts and (b) the scanning strategy of lower surface.

Table 2.
Process parameters of lower surface.
2.3. Characterization Methods
After samples were built, the dimension of the overhanging section was measured by a high-precision Vernier caliper with a resolution of 0.01 mm. Each sample was measured three times and the average value was calculated. The lower surface morphology was observed by a digital microscope (VHX-1000, Keyence (China) Co., Ltd., Shanghai, China) and a field emission scanning electron microscope (TESCAN MIRA3, TESCAN (China) Co., Ltd., Shanghai, China). The roughness was tested by a confocal laser scanning microscope (LEXT OLS4100, Olympus (China) Co., Ltd., Beijing, China) with the laser non-contact measuring method. According to the international standard ISO 25178-6 [], the laser microscope is included in the measuring instruments of the three-dimensional surface structure; therefore, the same as the conventional contact type measuring method, the non-contact measurement for roughness is also recognized as a common evaluation standard. The non-contact surface roughness measurement method can measure areal roughness. At present, some studies [,,,] have adopted areal roughness as the evaluation method of surface roughness. Compared to profile roughness [], the areal roughness can better evaluate the flatness level of the entire testing surface, so in this study we chose to measure the areal roughness of the lower surface. Since the whole area of the lower surface could be selected for the areal roughness test, the areal roughness of each sample was tested once to obtain Sa and Sz. The international standard ISO 25178-2 [] stipulates the concept of areal roughness; Sa is used to express the arithmetic mean of the absolute value of ordinate in area A, and Sz is the peak to valley height of the areal surface. The calculation formula is as follows.
where A is the sampling area, and Sp and Sv are the peak and valley values of the areal surface roughness, respectively.
3. Results
The macroscopic morphology of all overhanging structure samples is shown in Figure 4. From Figure 4 it can be seen that the formation qualities of the overhanging structure varied greatly with different process parameters of the lower surface. When the core processing parameters and scanning strategy I were used to manufacture the lower surface of the overhanging parts, the slag hanging on the lower surface of 1-I sample was very serious, and the overhanging feature was almost invisible. This serious slag hanging also appeared on the 2-I sample. Compared with 1-I and 2-I, the slag hanging condition of 1-II and 2-II samples with strategy II were reduced, and the overhanging feature of these two samples could be seen. With the decrease of the laser energy density, the amount of slag hanging on the lower surface of the samples manufactured by the two scanning strategies gradually decreased, and the overhanging structure feature became more and more obvious. In addition, it could be seen that the lower surface of the sample gradually became flatter from the inclined and irregular surface. Among all the samples, the overhanging surface of the 8-I sample was the smoothest without obvious slag hanging. However, it is worth noting that, contrary to the phenomenon that the slag hanging on the lower surface of sample No. 1 would decrease when the scanning strategy II was adopted, the slag hanging on the lower surface of sample No. 8 appeared clearly when the scanning strategy II was adopted. With the continuous decreasing of laser energy density, the slag hanging on the lower surface of No. 9 and No. 10 samples with the two scanning strategies became more pronounced.
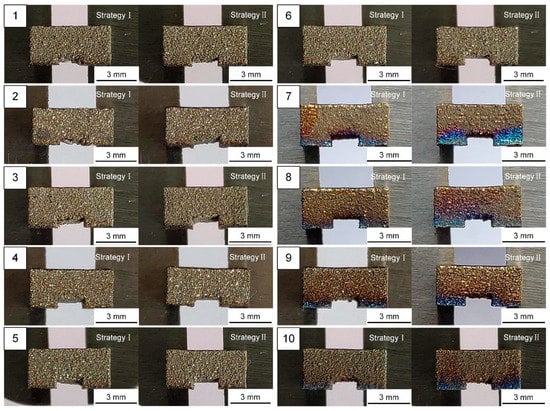
Figure 4.
Macroscopic morphology of all overhanging structure samples.
Figure 5 shows the variation trend of the overhanging section thickness and the lower surface roughness of all samples with the laser surface energy density, respectively. The thickness of the overhanging section reflected the slag hanging on the lower surface of the samples. The greater the thickness, the more serious the slag hanging was. The lower surface roughness Sa and Sz directly reflected the quality of the lower surface of the sample. In Figure 5, it can be seen that the overhanging section thickness and the lower surface roughness Sa and Sz showed the same trend, which decreased first and then increased with reduction of the EF. In the case of scanning strategy I, the sample with the maximum thickness and roughness was the sample 1-I with almost invisible overhanging features. However, in the case of scanning strategy II, the sample with the largest thickness was sample 1-II, while the sample with the largest roughness was sample 10-II. This indicated that in the case of scanning strategy II, the EF of lower surface reduction was likely to obtain a worse surface than when the core process was directly used to form the lower surface. The minimum thickness and roughness of the strategy I and strategy II appeared near the EF of 0.6 J/mm2 and 1.1 J/mm2, respectively. The corresponding samples were 8-I and 6-II respectively. These two samples were also samples with less slag hanging on the lower surface and relatively flat lower surface. It is worth noting that the thickness and roughness of strategy II was lower than that of strategy I at high EF, but when EF went down to about 1.0 J/mm2, the variation trend of the thickness and roughness was converse. This shows that the influence of scanning strategy on the quality of the lower surface was dynamic. When the EF was different, the scanning strategy played a different role. The thickness of the overhanging section and the roughness of the lower surface showed a similar trend with the change of EF, indicating that there was a certain positive correlation between them. However, it can be seen from the Figure 5 that the roughness varied more widely than the thickness.
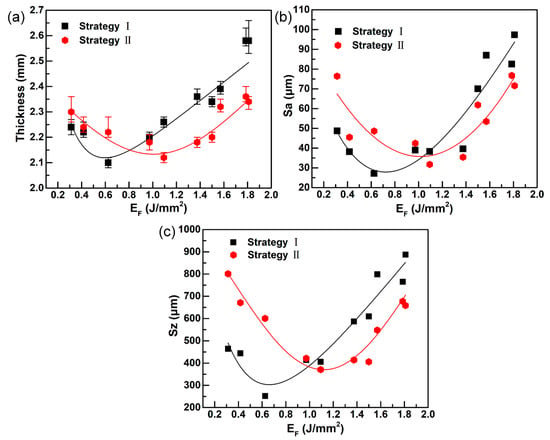
Figure 5.
The variation trend of the overhanging section thickness (a) and the lower surface roughness Sa (b) and Sz (c) of all samples with the laser surface energy density, respectively.
In order to further analyze the influence of process parameters and scanning strategies on the quality of the lower surface, the lower surface morphology of samples with highest and lowest EF was observed. Figure 6 shows the morphology of the lower surface of sample 1 and 10 with two different scanning strategies. The white arrow in the figure represents the building direction, and the groove area between the red edges is the lower surface of the overhanging structures. In Figure 6a, the “valley-like” characteristics can be seen around the entire surface, and the lower surface of sample 1-I is very rough with the roughness Sa and Sz reaching to 97.33 μm and 887.38 μm, respectively. In comparison, the lower surface quality of sample 1-II without cross-melting was significantly improved with the “valley-like” features disappearing, but the surface fluctuations were still obvious with an Sa of 71.56 μm and Sz of 658.5 μm. As seen in Figure 6c,d, it is clear that sample 10 with the smallest EF had a more distinct and clear overhanging structure outline compared to the sample 1-I. The lower surface of sample10-I was flatter, with an Sa of 48.72 μm, and only included some slight fluctuations. However, the lower surface of sample 10-II was more rough and had a huge pit, as shown in the red square line in Figure 6d. Therefore, the roughness Sa and Sz of sample 10-II reached 76.41 μm and 801.2 μm, respectively, which were the maximum values of all the samples adopted in strategy II. In conclusion, strategy II can indeed improve the quality of the lower surface to some extend at high EF; however, with low EF applied, this strategy conversely deteriorates the lower surface quality.
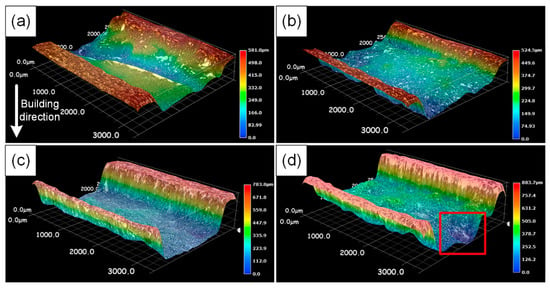
Figure 6.
Morphology of lower surface of sample 1-I (a); 1-II (b); 10-I (c) and 10-II (d).
Figure 7 shows the lower surface morphology of sample 8-I (a,c) and 6-II (b,d). The two samples were the samples with best lower surface quality when the scanning strategy I and II were adopted, respectively. It was found that the lower surfaces of both samples were relatively flat without obvious fluctuations (Figure 7a,b), and the corresponding roughness Sa was 27.17 μm and 31.71 μm, respectively. By observing the SEM images (Figure 7c,d), the difference between the two surfaces can be seen more clearly. There are a large number of powder particles adhering to the lower surface of both samples. In comparison, the surface of the 6-II sample had some protruding molten pool tracks and pits, while the surface of the 8-I sample was smoother. This is also the reason why the Sz value (370.68 μm) of sample 6-II was significantly higher than that of sample 8-I (251.82 μm).
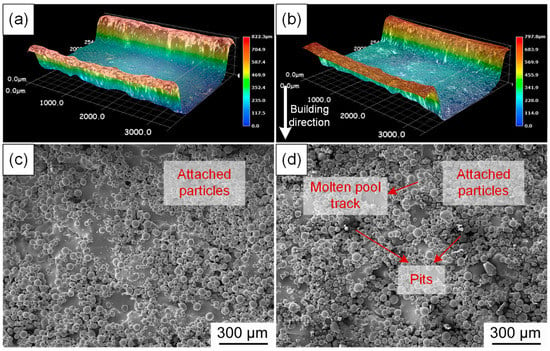
Figure 7.
Morphology diagram of lower surface of sample 8-I (a,c) and 6-II (b,d).
4. Discussion
The processing of the lower surface is carried out on a powder bed made up entirely of loose powder. On the one hand, the change of processing parameters will inevitably affect the melting of the powder, which will lead to the different quality of the lower surface. On the other hand, the difference of the thermal conduction mechanism between the powder bed and the solidified part will also have additional influence on the lower surface. As is well-known, the thermal conductivity of metal powder is much lower than that of metal solid [,], so the heat generated by laser dissipates slowly on the powder bed, which will easily lead to the heat accumulation, thus causing the cooling rate of the molten pool to slow down. The cooling process of the molten pool can be clearly displayed by the video recording during the processing of the lower surface.
As seen in Figure 8a–d, the cooling process of the molten pool was recorded at 30 fps by an Mi8-phone (Beijing Xiaomi Technology Co. LTD, Beijing, China) when the first layers of the lower surfaces of samples 1-I, 1-II, 10-I, and 10-II were processed, respectively. Each figure consists of several frames. Each frame represents a time of 1/30 s, which means that the cooling time of the molten pool can be estimated by the number of frames. It can be seen from Figure 8 that the heat dissipation on the powder bed is a slow and continuous process. The cooling process of the molten pool of the 1-I sample with the highest EF takes about 0.43 s. The cooling time of the molten pool will be significantly shortened by reducing the laser energy input density. The cooling time of the molten pool of sample 10-I is only 0.17 s. Different scanning strategies will also cause changes in the cooling time of the molten pool. Compared with the cross-remelting strategy, the cooling times of sample 1-II and 10-II without remelting are reduced to 0.3 s and 0.1 s, respectively, due to the reduction of additional heat accumulation caused by remelting.
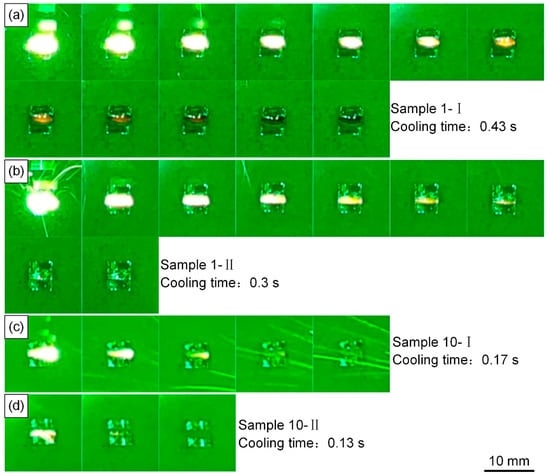
Figure 8.
Pictures of the process of the first layer of the lower surface of the sample 1-I (a); 1-II (b); 10-I (c); and 10-II (d).
The cooling time of the molten pool during the processing of the first layer of the lower surface and the first layer of the core of all the samples is shown in Table 3. As can be seen from Table 3, when the first layer of the lower surface is processed, the cooling time of the molten pool is gradually shortened with the reduction of the EF. However, when the first layer of core is processed after the processing of the lower surface, the cooling time of the molten pool of the core gradually increases with the decrease of the EF of the lower surface. This is due to the decrease of EF, which leads to the increase of unmelted powders and pores in the lower surface area, resulting in the decrease of density and the gradual decrease of heat dissipation performance from metal solid to metal powders.

Table 3.
The cooling time of the molten pool during the processing of different samples in Lower surface layer 1 and Core layer 1.
The forming process of the lower surface can be described more clearly by the cooling time of the molten pool. When the EF for lower surface processing is relatively high, such as in the 1-I sample, the laser can fully melt the metal powder and the volume of the molten pool gets large. In addition, the heat accumulation caused by slow heat dissipation in the powder layer further increases the volume of the molten pool. Under the action of gravity and capillary forces [], the molten pool continuously sinks on the powder bed, forming the “valley-like” features as displayed in Figure 6a. This phenomenon can be seen more obviously from the cross-sectional pictures of the overhanging structures. Figure 9a–f shows the cross-sectional pictures of some representative overhanging structural parts. The large-sized agglomerate can be observed distinctly on the lower surface in sample 1-I (Figure 9a), which leads to poor surface quality. The schematic diagram of the molten pool sinking is described in Figure 10a.
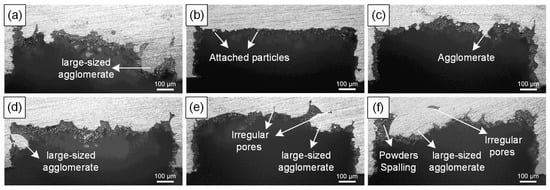
Figure 9.
Section of overhanging structure parts of lower surface: (a) 1-I; (b) 8-I; (c) 10-I; (d) 1-II; (e) 8-II; (f) 10-II.

Figure 10.
Forming schematic diagram of lower surface: (a) high EF; (b) moderate EF; (c) lower EF.
The reduction of the EF will decrease the maximum temperature of the molten pool [] and its cooling time, so that the volume of the molten pool is effectively diminished and the molten pool subsidence is retrained to some extent, which ultimately improves the dimensional deviation and poor lower surface quality. However, when the EF is too low, it will lead to the lack of powder fusion or incomplete powder melting []. A large amount of unmelted powder cannot provide a good support and heat dissipation platform for the subsequent core forming. Taking sample 10-II as an example, it can be seen from Table 3 that the cooling time of the molten pool reached 0.2 s when the first layer of the core was processed. Due to the accumulation of heat, a similar phenomenon of molten pool sinking occurs compared to the case of the lower surface forming of sample 1-I, resulting in the large-scale slag hanging as shown in Figure 9f. At the same time, due to the lack of powder fusion in the lower surface area and the molten pool generated by the core not being enough to fill the entire lower surface area, the result is the occurrence of irregular pores and the large-sized pits after the powder spalling. This forming process can be described as shown in Figure 10c. The forming quality of the lower surface can be effectively judged by the cooling time of the molten pool when the first layer of the core is processed. The shorter the cooling time of the molten pool is, the higher the density of the lower surface region is.
The moderate EF is beneficial to the forming of the lower surface. For the sample 8-I with moderate EF on the lower surface, the volume of molten pool is small, which will not cause serious sinking. At the same time, sufficient EF ensures the necessary metallurgical bonding, which results in a relatively dense metal solid in the lower surface region and provides a good heat dissipation platform for core forming. This can be proven by the fact that the cooling time of the molten pool is only 0.07 s when the first layer of the core is processed. By this way, the negative impact of the core forming on the quality of the lower surface can be avoided, which ultimately results in a smooth lower surface with optimal roughness and relatively best forming accuracy, as shown in Figure 9b. Inevitably, due to the thermal influence of the molten pool, a large number of powder particles will adhere to the lower surface, which is displayed in Figure 10b.
In addition, the different scanning strategies will also have a direct impact on the forming of the lower surface. Rashid et al. [] found that the strategy of scanning the same layer twice resulted in a very high amount of heat energy accumulation. Therefore, when a high EF is applied, the strategy II with non-remelting can effectively reduce the density of laser energy input, decrease the cooling time of molten pool, and suppress the agglomeration phenomenon, thus improving the quality of the lower surface of parts. As revealed in Figure 9a,d, the agglomeration size on the lower surface of sample 1-II is significantly smaller than that of sample 1-I, which is the reason why the lower surface roughness of sample 1-II is better than that of sample 1-I. However, when the EF is low, the strategy I with cross-remelting can help reduce the metallurgical defects and improve the quality of the lower surface of the parts. As shown in Figure 9b,c,e,f, compared with sample 8-II, the agglomeration size of the lower surface of sample 8-I is greatly reduced with metallurgical defects almost disappeared, and the surface quality is improved. The same is true of sample 10-I as compared with sample 10-II.
5. Conclusions
In this work, the influence of process parameters and scanning strategies on the roughness of lower surface of SLMed TA15 overhanging structure parts is investigated. In addition, an innovative method is proposed to evaluate the forming quality of the lower surface by recording the cooling time of the molten pool during the processing of the lower surface. The main conclusions are as follows:
1. With the decrease of the laser surface energy density (EF), the lower surface quality of the SLMed TA15 overhanging structure parts show a trend of improving first and then worsening.
2. Owing to the fact that the heat dissipation ability of powder is far lower than that of metal solid, when EF gets too high, heat accumulation on the powder bed is more likely to bring about obvious sinking of the molten pool and severe slag hanging. However, when EF gets too low, the lack of fusion in the lower surface region cannot provide a fine heat dissipation platform for core forming, which leads to the sinking of the core molten pool into the lower surface region, thus resulting in slag hanging and large-sized pits.
3. The influence of scanning strategy on the lower surface roughness of SLMed TA15 overhanging structure parts is dynamic. The cross-remelting strategy and non-remelting strategy gain better surface quality when EF is lower and higher, respectively.
4. Based on the process parameters (laser power of 50 W, laser scanning speed of 2000 mm/s, hatch spacing of 40 μm) and cross-remelting strategy, the lower surface roughness Sa and Sz of SLMed TA15 overhanging structure parts is optimized to 27.17 μm and 251.82 μm, respectively.
Author Contributions
Conceptualization, J.J.; formal analysis, J.J. and Z.M.; investigation, J.J. and X.M.; resources, J.J.; supervision, D.Z.Z.; writing—original draft, J.J. and J.C.; writing—review and editing, J.J. and Z.R. All authors have read and agreed to the published version of the manuscript.
Funding
This work was supported by the National High-Tech R&D Program of China (863 Program: 2015AA042501).
Acknowledgments
The author J.J. is particularly grateful to his wife Yuanchao Chen for her support and encouragement during the study.
Conflicts of Interest
The authors declare no conflict of interest.
References
- Strano, G.; Hao, L.; Everson, R.M.; Evans, K.E. Surface roughness analysis, modelling and prediction in selective laser melting. J. Mater. Process. Technol. 2013, 213, 589–597. [Google Scholar] [CrossRef]
- Boschetto, A.; Bottini, L.; Veniali, F. Roughness modeling of AlSi10Mg parts fabricated by selective laser melting. J. Mater. Process. Technol. 2017, 241, 154–163. [Google Scholar] [CrossRef]
- Wang, D.; Liu, Y.; Yang, Y.; Xiao, D. Theoretical and experimental study on surface roughness of 316L stainless steel metal parts obtained through selective laser melting. Rapid Prototyp. J. 2016, 22, 706–716. [Google Scholar] [CrossRef]
- Yang, T.; Liu, T.; Liao, W.; MacDonald, E.; Wei, H.; Chen, X.; Jiang, L. The influence of process parameters on vertical surface roughness of the AlSi10Mg parts fabricated by selective laser melting. J. Mater. Process. Technol. 2019, 266, 26–36. [Google Scholar] [CrossRef]
- Mohammadian, N.; Turenne, S.; Brailovski, V. Surface finish control of additively-manufactured Inconel 625 components using combined chemical-abrasive flow polishing. J. Mater. Process. Technol. 2018, 252, 728–738. [Google Scholar] [CrossRef]
- Zhang, J.; Chaudhari, A.; Wang, H. Surface quality and material removal in magnetic abrasive finishing of selective laser melted 316L stainless steel. J. Manuf. Process. 2019, 45, 710–719. [Google Scholar] [CrossRef]
- Yadroitsev, I.; Smurov, I. Surface morphology in selective laser melting of metal powders. Phys. Procedia 2011, 12, 264–270. [Google Scholar] [CrossRef]
- Mumtaz, K.; Hopkinson, N. Top surface and side roughness of Inconel 625 parts processed using selective laser melting. Rapid Prototyp. J. 2009, 15, 96–103. [Google Scholar] [CrossRef]
- Chen, Z.; Wu, X.; Tomus, D.; Davies, C.H.J. Surface roughness of Selective Laser Melted Ti-6Al-4V alloy components. Addit. Manuf. 2018, 21, 91–103. [Google Scholar] [CrossRef]
- Mertens, R.; Clijsters, S.; Kempen, K.; Kruth, J.-P. Optimization of scan strategies in selective laser melting of Aluminum parts with downfacing areas. J. Manuf. Sci. Eng. 2014, 136. [Google Scholar] [CrossRef]
- Vandenbroucke, B.; Kruth, J.-P. Selective laser melting of biocompatible metals for rapid manufacturing of medical parts. Rapid Prototyp. J. 2007, 13, 196–203. [Google Scholar] [CrossRef]
- Yasa, E.; Deckers, J.; Kruth, J.-P. The investigation of the influence of laser re-melting on density, surface quality and microstructure of selective laser melting parts. Rapid Prototyp. J. 2011, 17, 312–327. [Google Scholar] [CrossRef]
- Vaithilingam, J.; Goodridge, R.D.; Hague, R.J.M.; Christie, S.D.R.; Edmondson, S. The effect of laser remelting on the surface chemistry of Ti6al4V components fabricated by selective laser melting. J. Mater. Process. Technol. 2016, 232, 1–8. [Google Scholar] [CrossRef]
- Yu, W.; Sing, S.L.; Chua, C.K.; Tian, X. Influence of re-melting on surface roughness and porosity of AlSi10Mg parts fabricated by selective laser melting. J. Alloys Compd. 2019, 792, 574–581. [Google Scholar] [CrossRef]
- Pupo, Y.; Monroy, K.P.; Ciurana, J. Influence of process parameters on surface quality of CoCrMo produced by selective laser melting. Int. J. Adv. Manuf. Technol. 2015, 80, 985–995. [Google Scholar] [CrossRef]
- Tian, Y.; Tomus, D.; Rometsch, P.; Wu, X. Influences of processing parameters on surface roughness of Hastelloy X produced by selective laser melting. Addit. Manuf. 2017, 13, 103–112. [Google Scholar] [CrossRef]
- Xiang, Z.; Wang, L.; Yang, C.; Yin, M.; Yin, G. Analysis of the quality of slope surface in selective laser melting process by simulation and experiments. Optik 2019, 176, 68–77. [Google Scholar] [CrossRef]
- Wang, D.; Yang, Y.; Yi, Z.; Su, X. Research on the fabricating quality optimization of the overhanging surface in SLM process. Int. J. Adv. Manuf. Technol. 2012, 65, 1471–1484. [Google Scholar] [CrossRef]
- Saunders, M. X marks the spot-find ideal process parameters for your metal AM parts. White Papers Collection–Renishaw Plc. 2017. Available online: https://resources.renishaw.com/en/details/--106810 (accessed on 31 August 2020).
- Jiang, J.; Ren, Z.; Ma, Z.; Zhang, T.; Zhang, P.; Zhang, D.Z.; Mao, Z. Mechanical properties and microstructural evolution of TA15 Ti alloy processed by selective laser melting before and after annealing. Mater. Sci. Eng. A 2020, 772. [Google Scholar] [CrossRef]
- Rashid, R.; Masood, S.H.; Ruan, D.; Palanisamy, S.; Rashid, R.A.R.; Brandt, M. Effect of scan strategy on density and metallurgical properties of 17-4PH parts printed by Selective Laser Melting (SLM). J. Mater. Process. Technol. 2017, 249, 502–511. [Google Scholar] [CrossRef]
- Rashid, R.; Masood, S.H.; Ruan, D.; Palanisamy, S.; Rashid, R.A.R.; Elambasseril, J.; Brandt, M. Effect of energy per layer on the anisotropy of selective laser melted AlSi12 aluminium alloy. Addit. Manuf. 2018, 22, 426–439. [Google Scholar] [CrossRef]
- ISO 25178-6:2010. Geometrical Product Specifications (GPS)—Surface Texture: Areal—Part 6: Classification of Methods for Measuring Surface Texture; ISO International: Geneva, Switzerland, 2010. [Google Scholar]
- Gao, H.; Ma, B.; Singh, R.P.; Yang, H. Areal Surface Roughness of AZ31B magnesium alloy processed by dry face turning: An experimental framework combined with regression analysis. Materials 2020, 13, 2303. [Google Scholar] [CrossRef] [PubMed]
- Soady, K.A.; Mellor, B.G.; West, G.D.; Harrison, G.; Morris, A.; Reed, P.A.S. Evaluating surface deformation and near surface strain hardening resulting from shot peening a tempered martensitic steel and application to low cycle fatigue. Int. J. Fatigue 2013, 54, 106–117. [Google Scholar] [CrossRef]
- Librera, E.; Riva, G.; Safarzadeh, H.; Previtali, B. On the use of areal roughness parameters to assess surface quality in laser cutting of stainless steel with CO2 and fiber sources. Procedia Cirp 2015, 33, 532–537. [Google Scholar] [CrossRef][Green Version]
- Moon, J.; Yi, G.; Oh, C.; Lee, M.; Lee, Y.; Kim, M. A new technique for three-dimensional measurements of skin surface contours: Evaluation of skin surface contours according to the ageing process using a stereo image optical topometer. Physiol. Meas. 2002, 23, 247–259. [Google Scholar] [CrossRef]
- ISO 25178-2:2012. Geometrical Product Specifications (GPS)—Surface Texture: Areal—Part 2: Terms, Definitions and Surface Texture Parameters; ISO International: Geneva, Switzerland, 2012. [Google Scholar]
- Sih, S.S.; Barlow, J.W. The prediction of the emissivity and thermal conductivity of powder beds. Part. Sci. Technol. 2004, 22, 427–440. [Google Scholar] [CrossRef]
- Chen, H.; Gu, D.; Xiong, J.; Xia, M. Improving additive manufacturing processability of hard-to-process overhanging structure by selective laser melting. J. Mater. Process. Technol. 2017, 250, 99–108. [Google Scholar] [CrossRef]
- Rashid, R.A.R.; Mallavarapu, J.; Palanisamy, S.; Masood, S.H. A comparative study of flexural properties of additively manufactured aluminium lattice structures. Mater. Today Proc. 2017, 4, 8597–8604. [Google Scholar] [CrossRef]
© 2020 by the authors. Licensee MDPI, Basel, Switzerland. This article is an open access article distributed under the terms and conditions of the Creative Commons Attribution (CC BY) license (http://creativecommons.org/licenses/by/4.0/).