Interface Formation during Collision Welding of Aluminum

 , , , ,
  and
and
Abstract
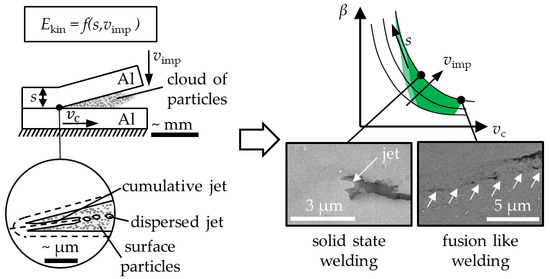
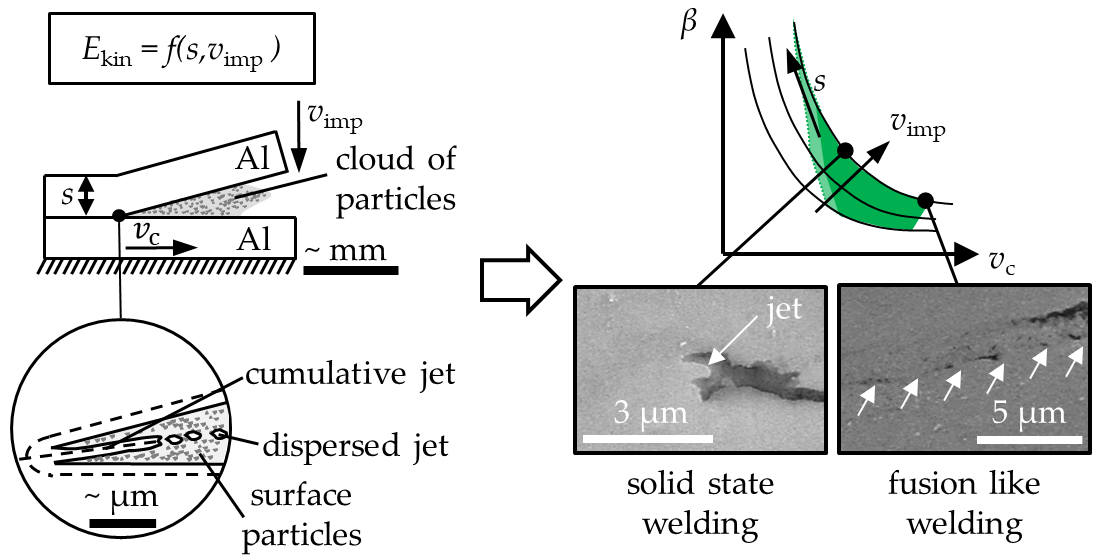
1. Introduction
- (1)
- How does the kinetic impact energy of the flyer influence the collision process and the formation of the weld interface and how is the welding window affected?
- (2)
- Do the collision kinetics influence the governing phenomena, the resulting bond mechanism and thus the weld interface’s properties, e.g., mechanical strength?
- (3)
- Can the formation and properties of the weld interface be predicted with respect to location, shape and strength, and how can these properties be controlled by the process parameters?
2. Materials and Methods
2.1. Description of the Series of Experiments
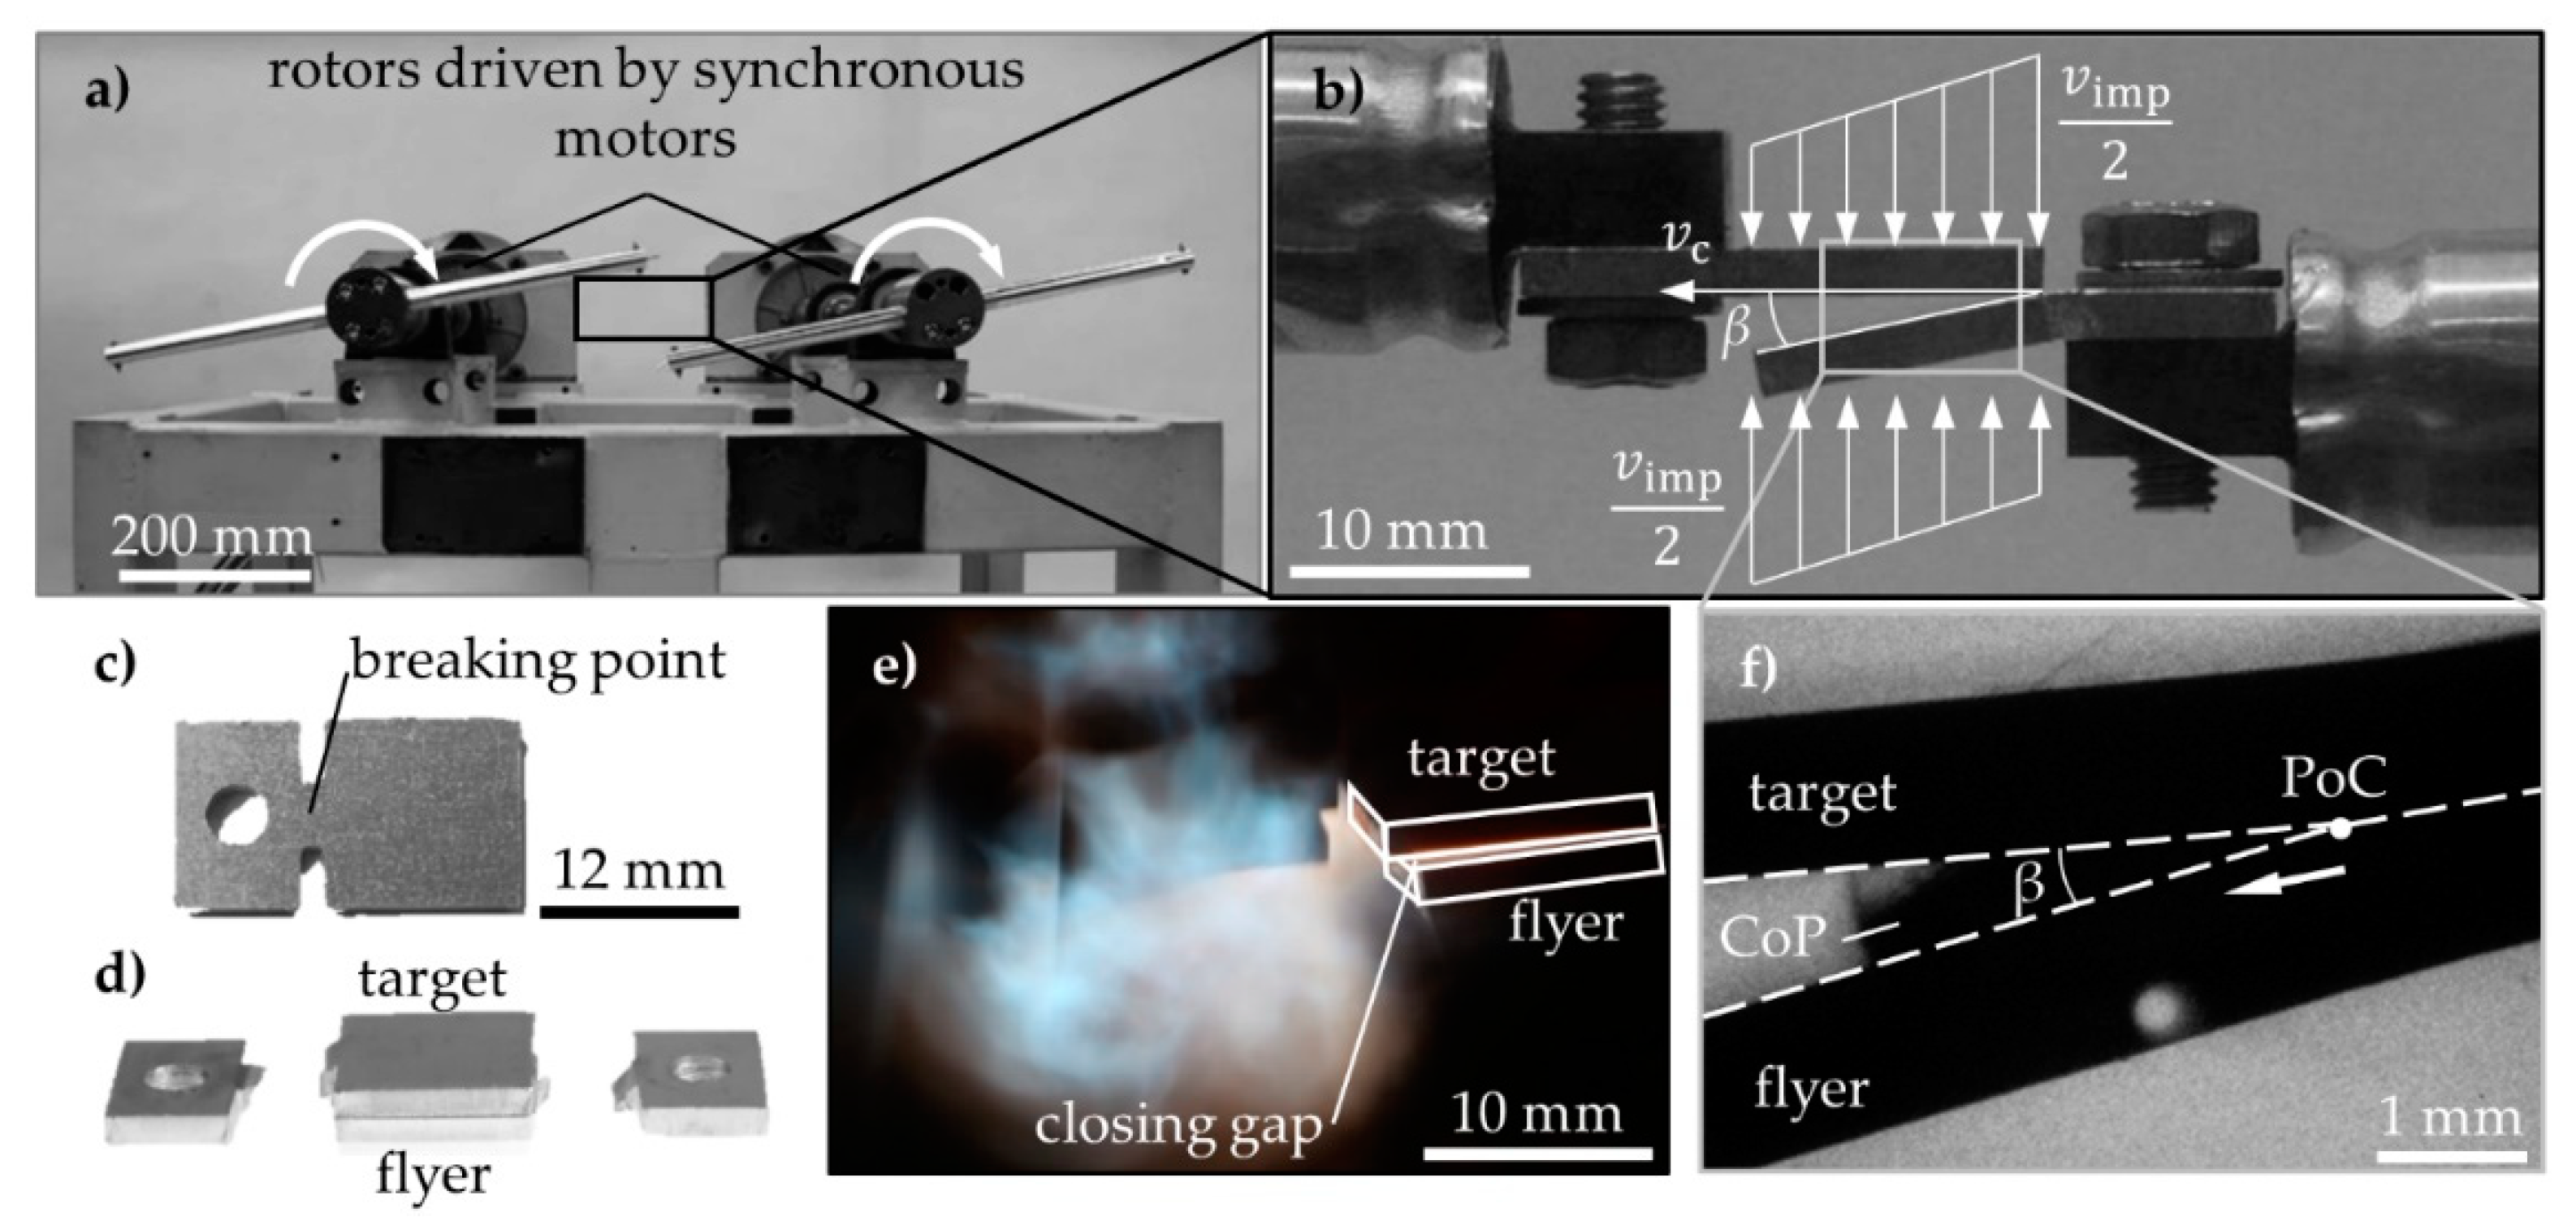
2.2. Model Test Rig
2.3. MPW Setup
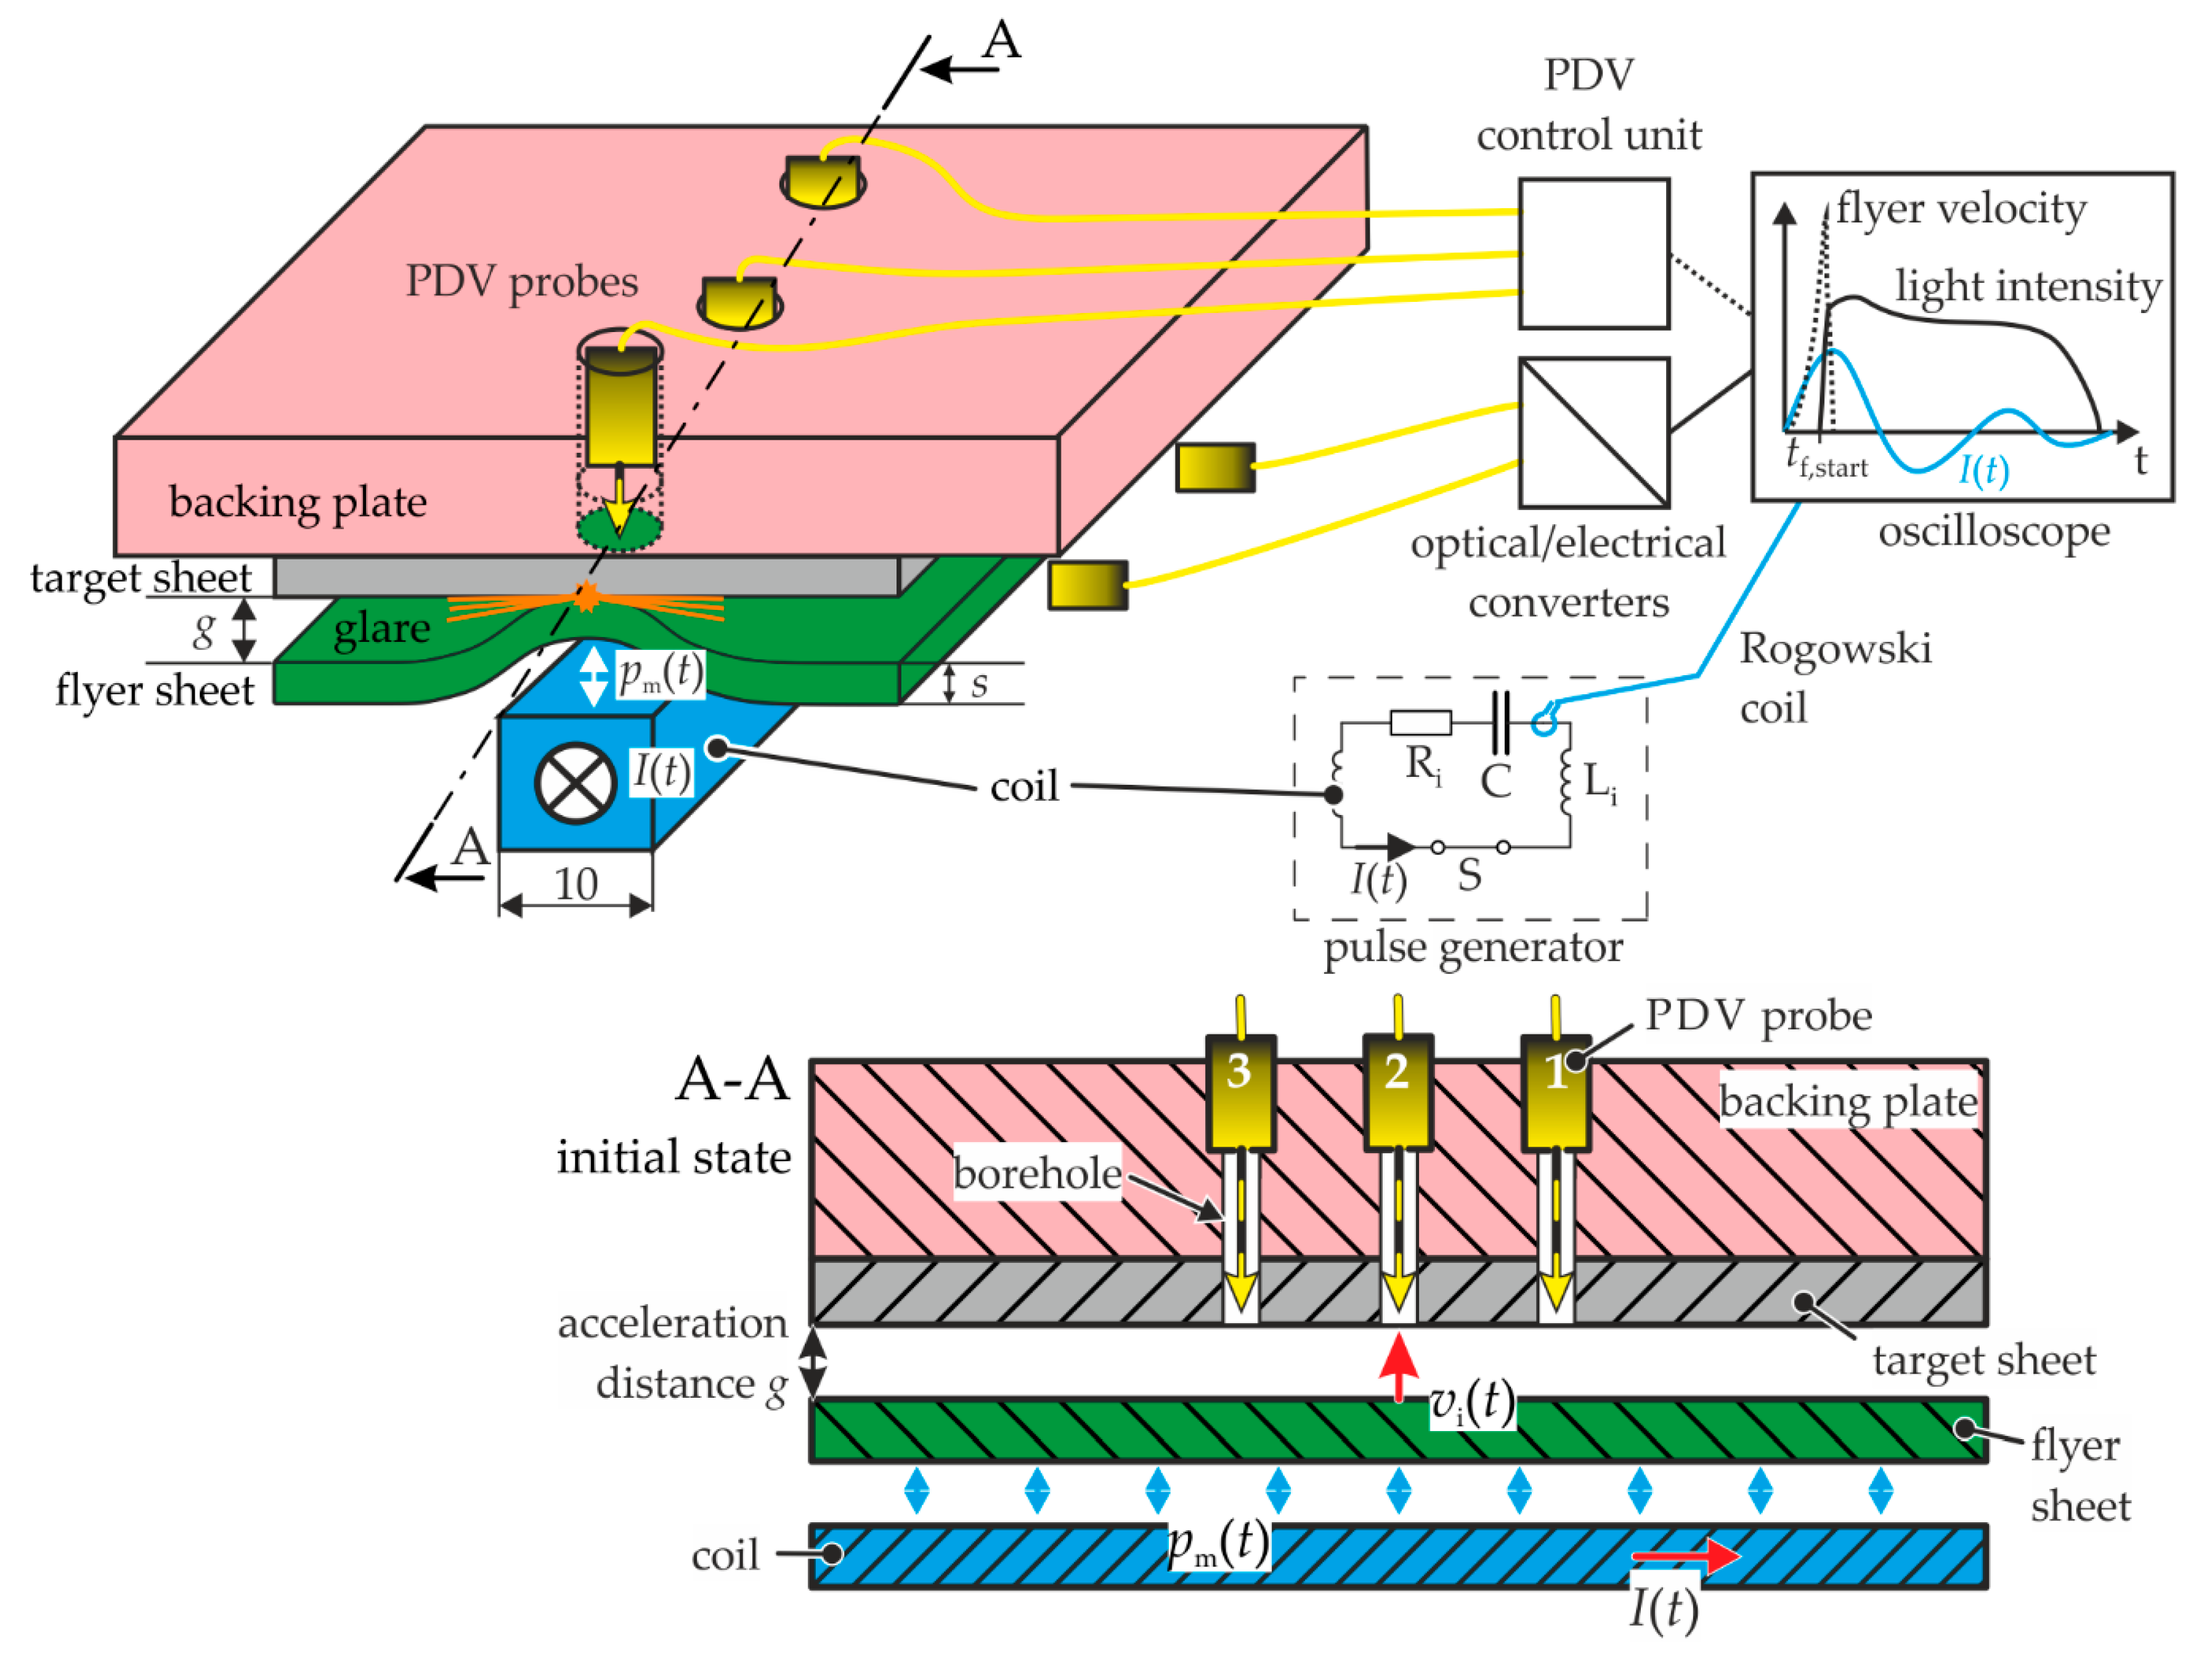
2.4. Methods of Process Observation
2.4.1. Process Observation in the Model Test Rig
2.4.2. Rogowski Coil
2.4.3. Photonic Doppler Velocimetry
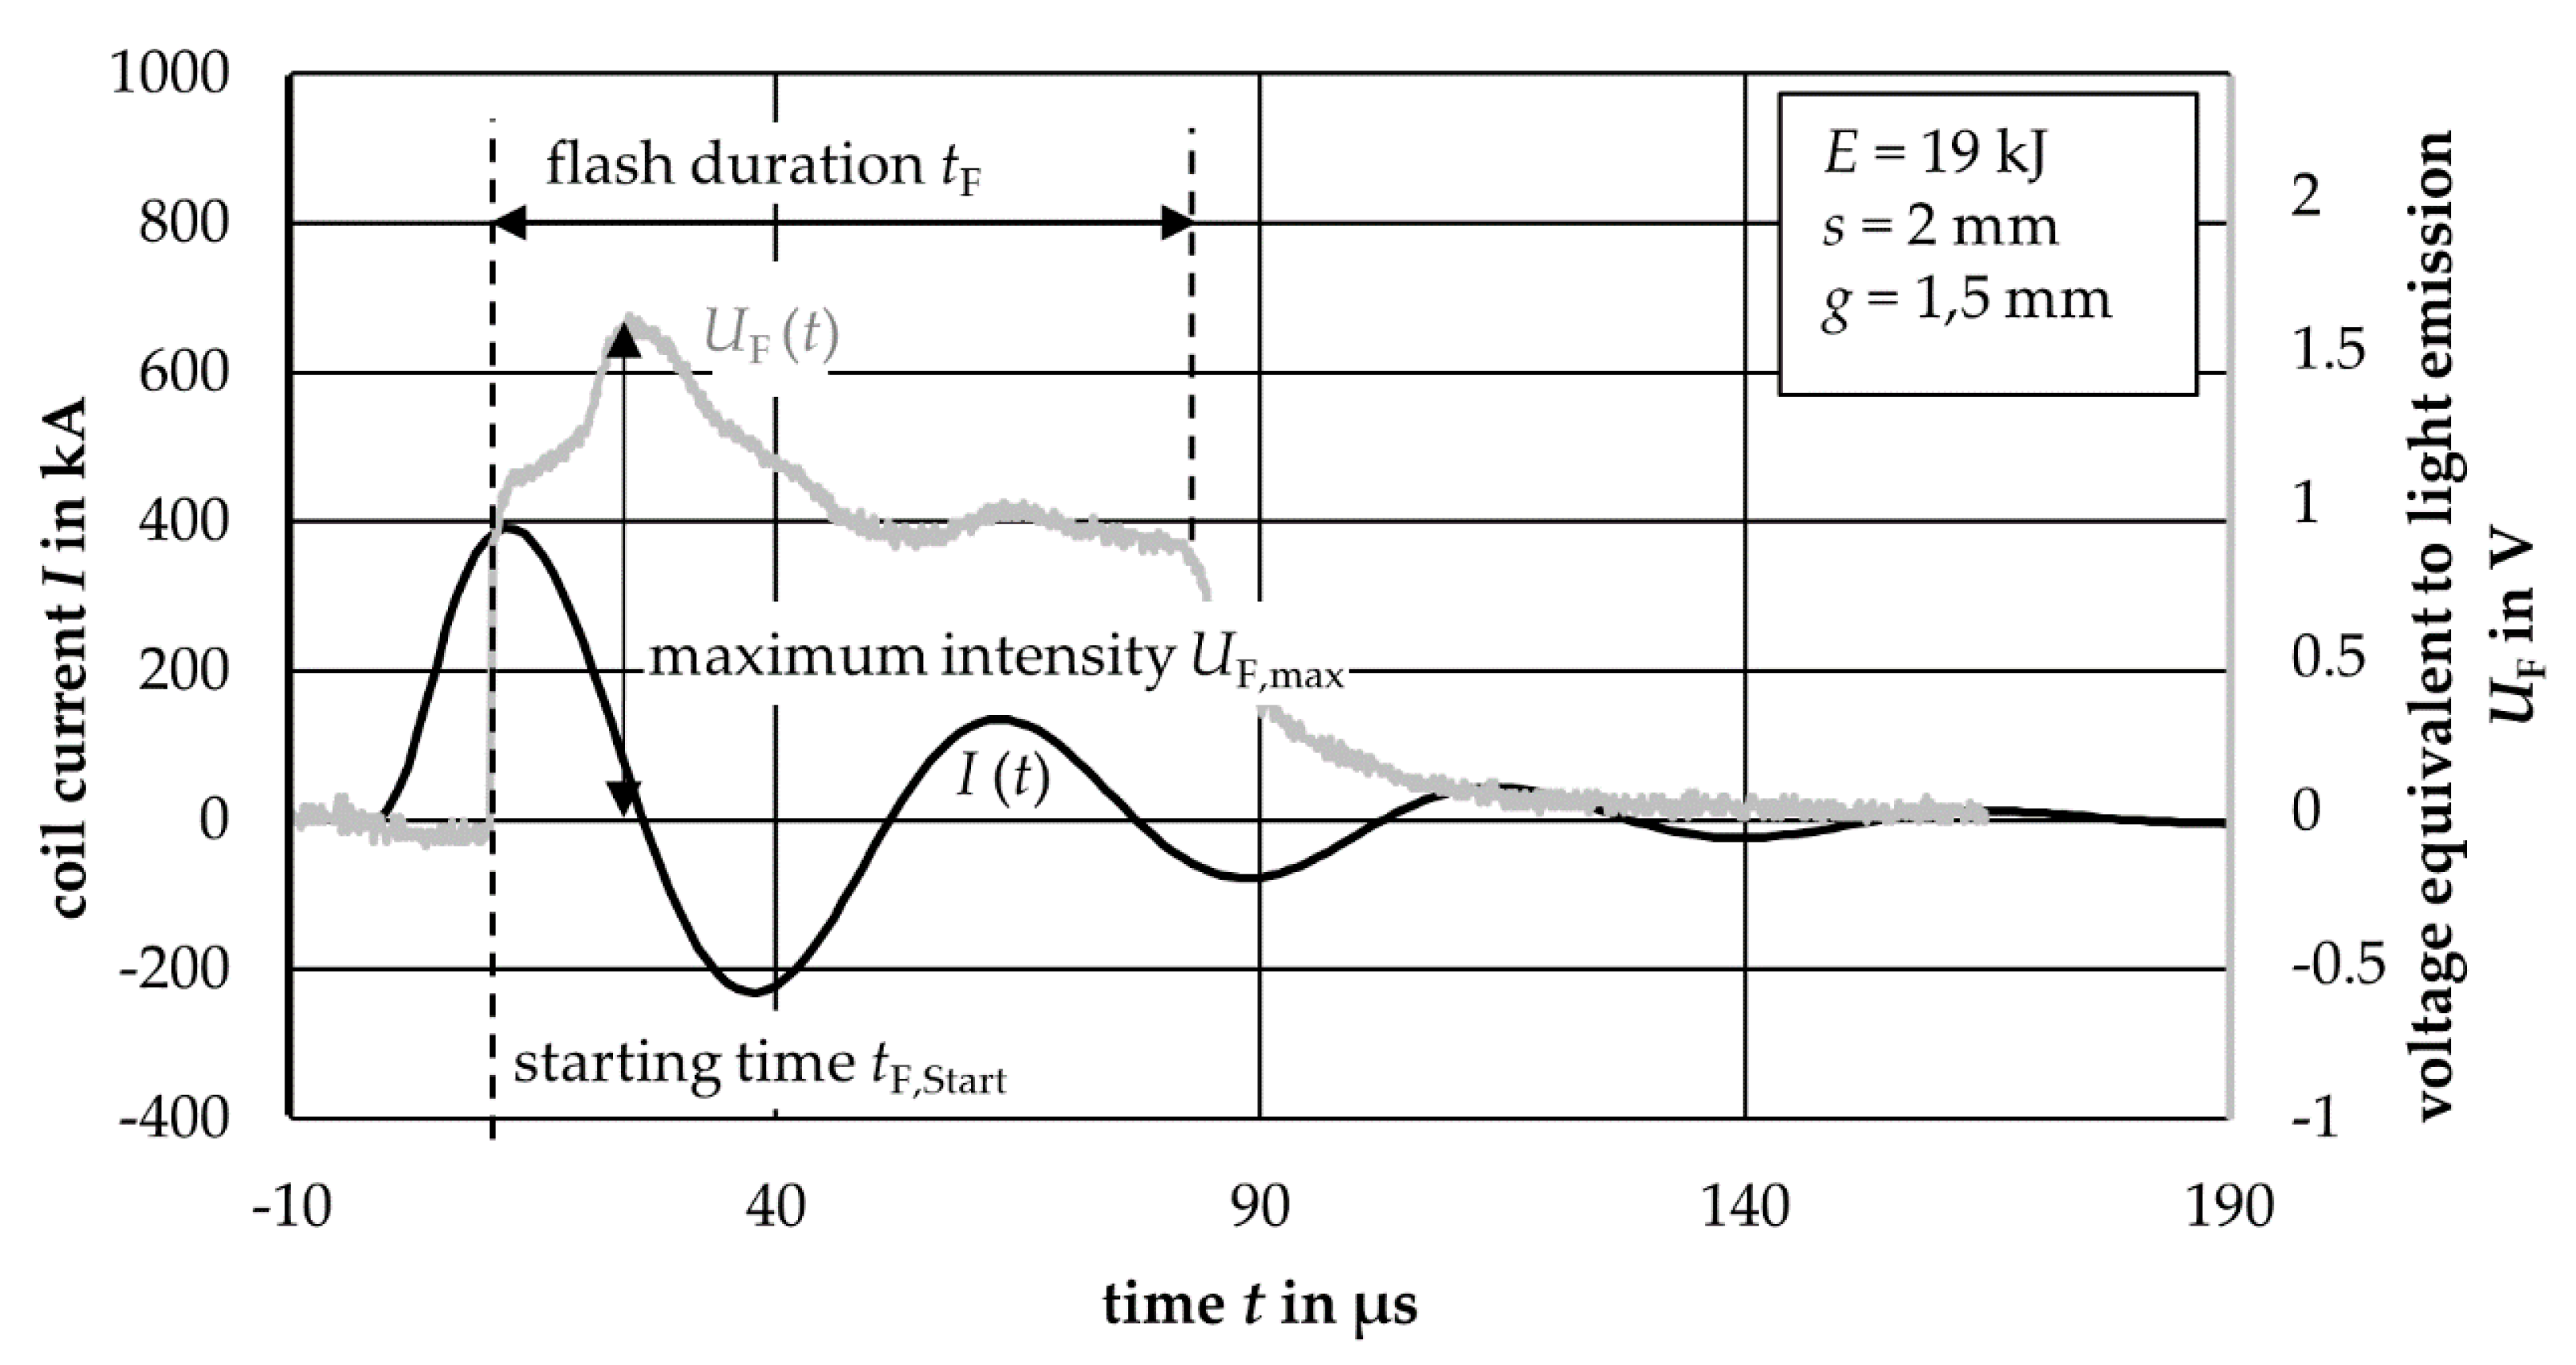
2.4.4. Flash Detection
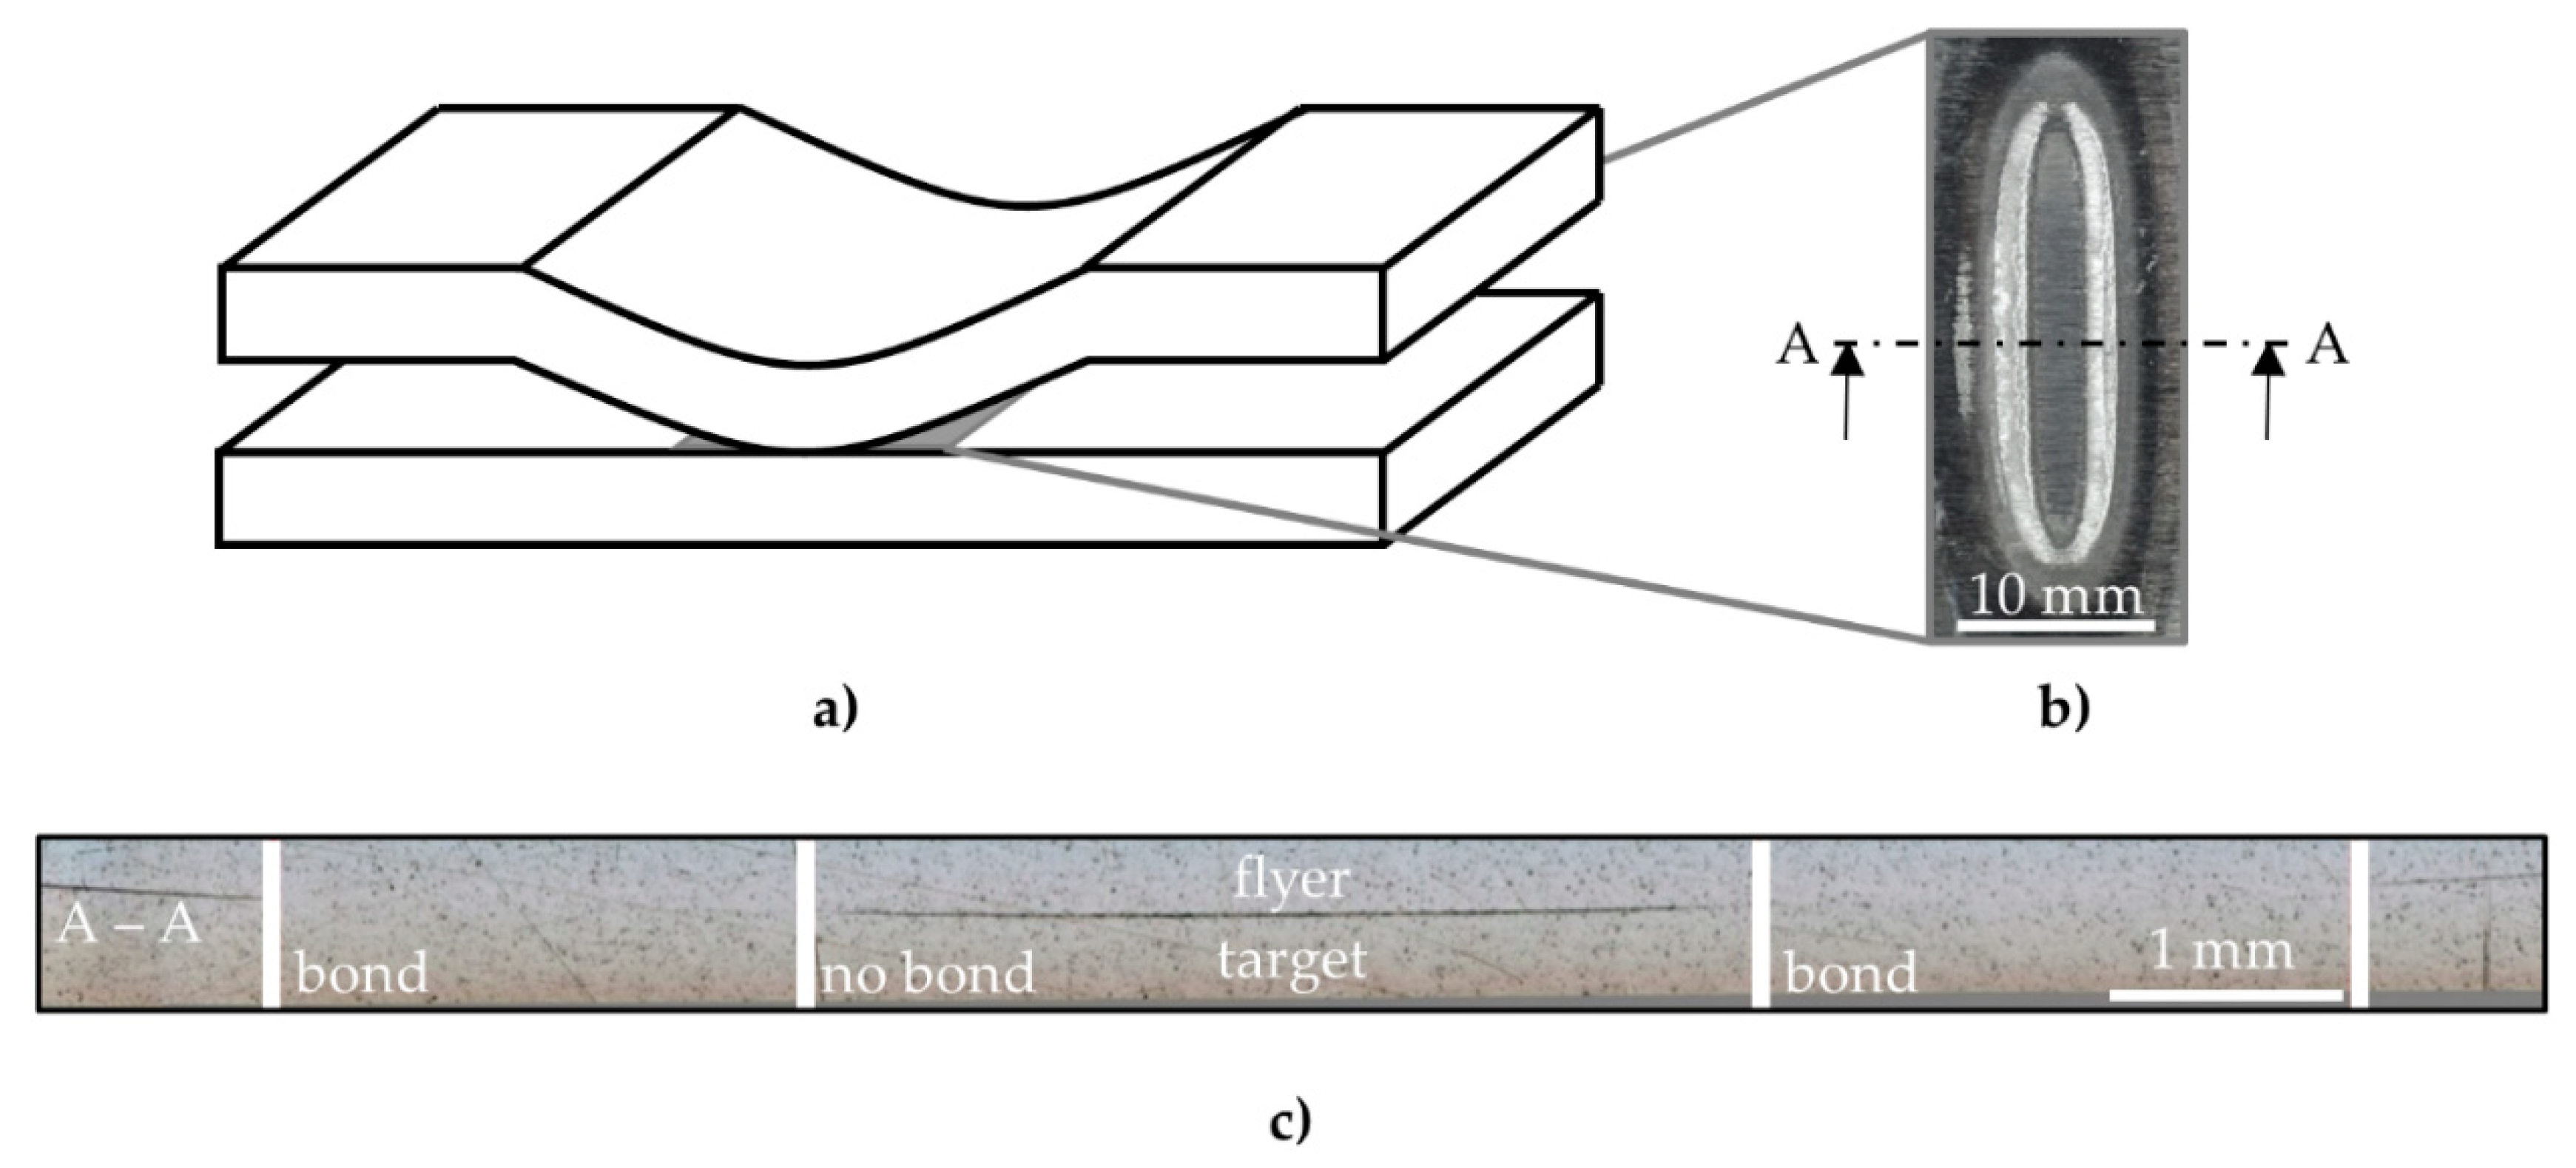
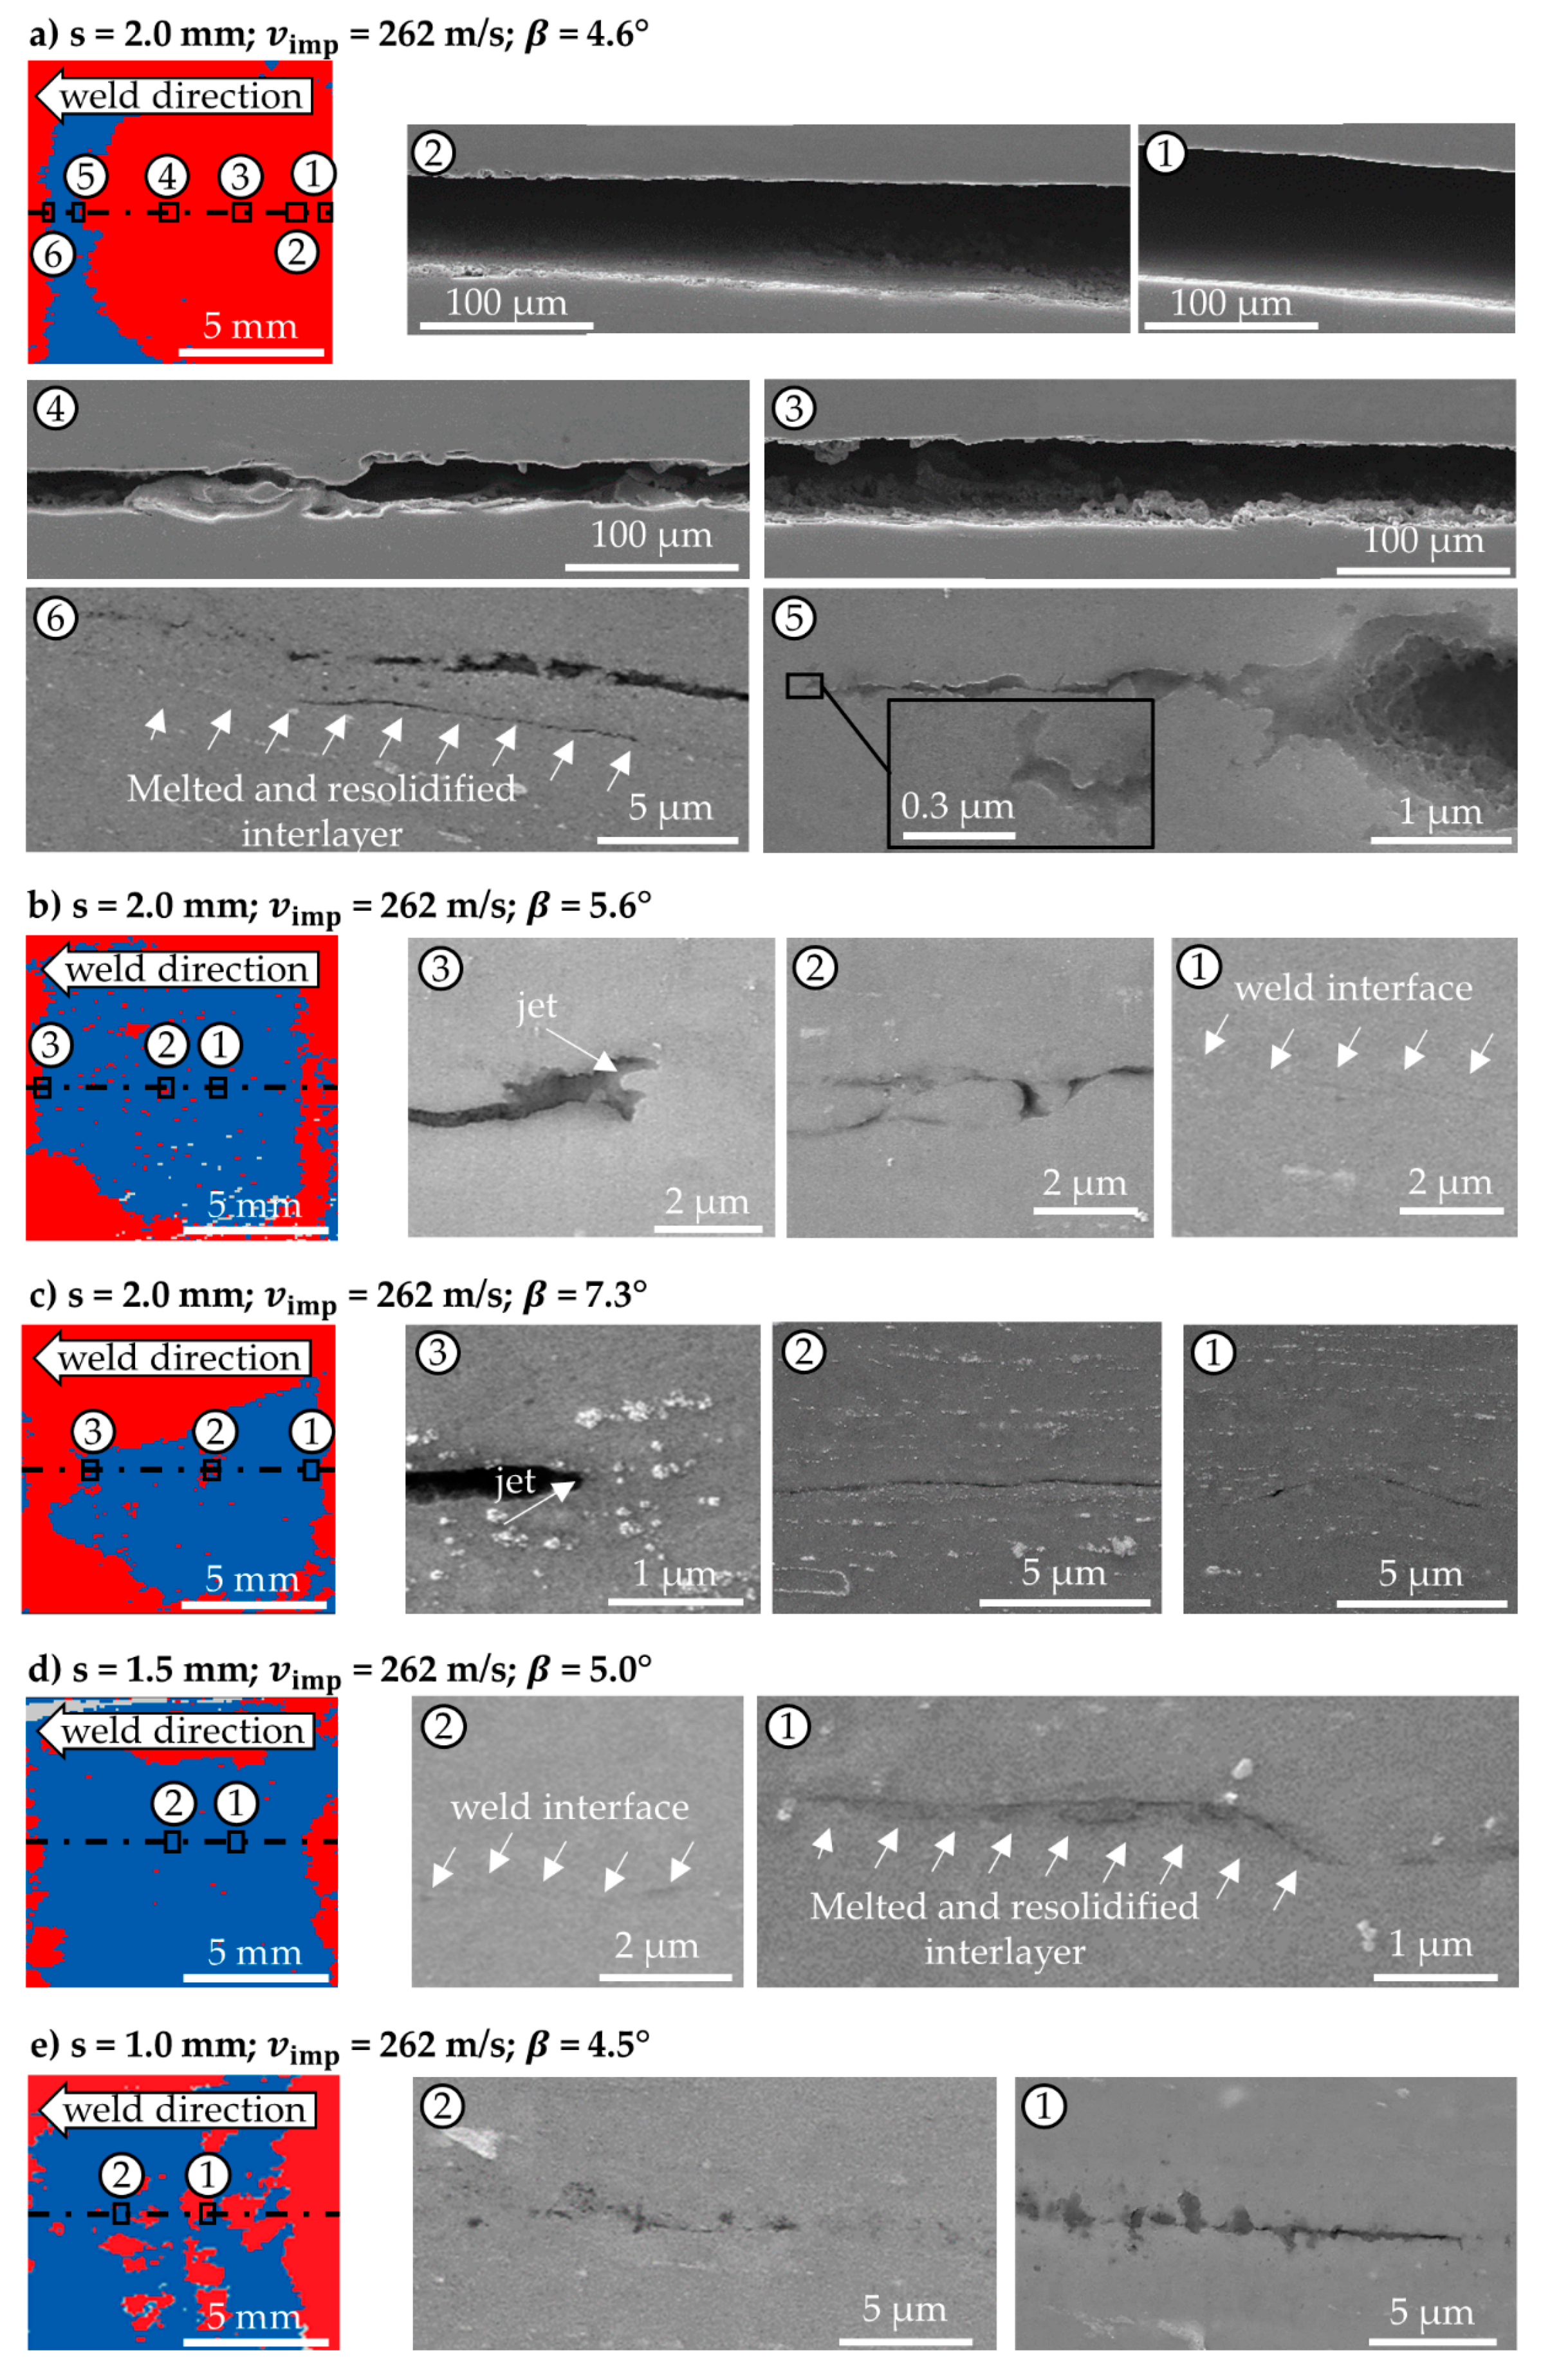
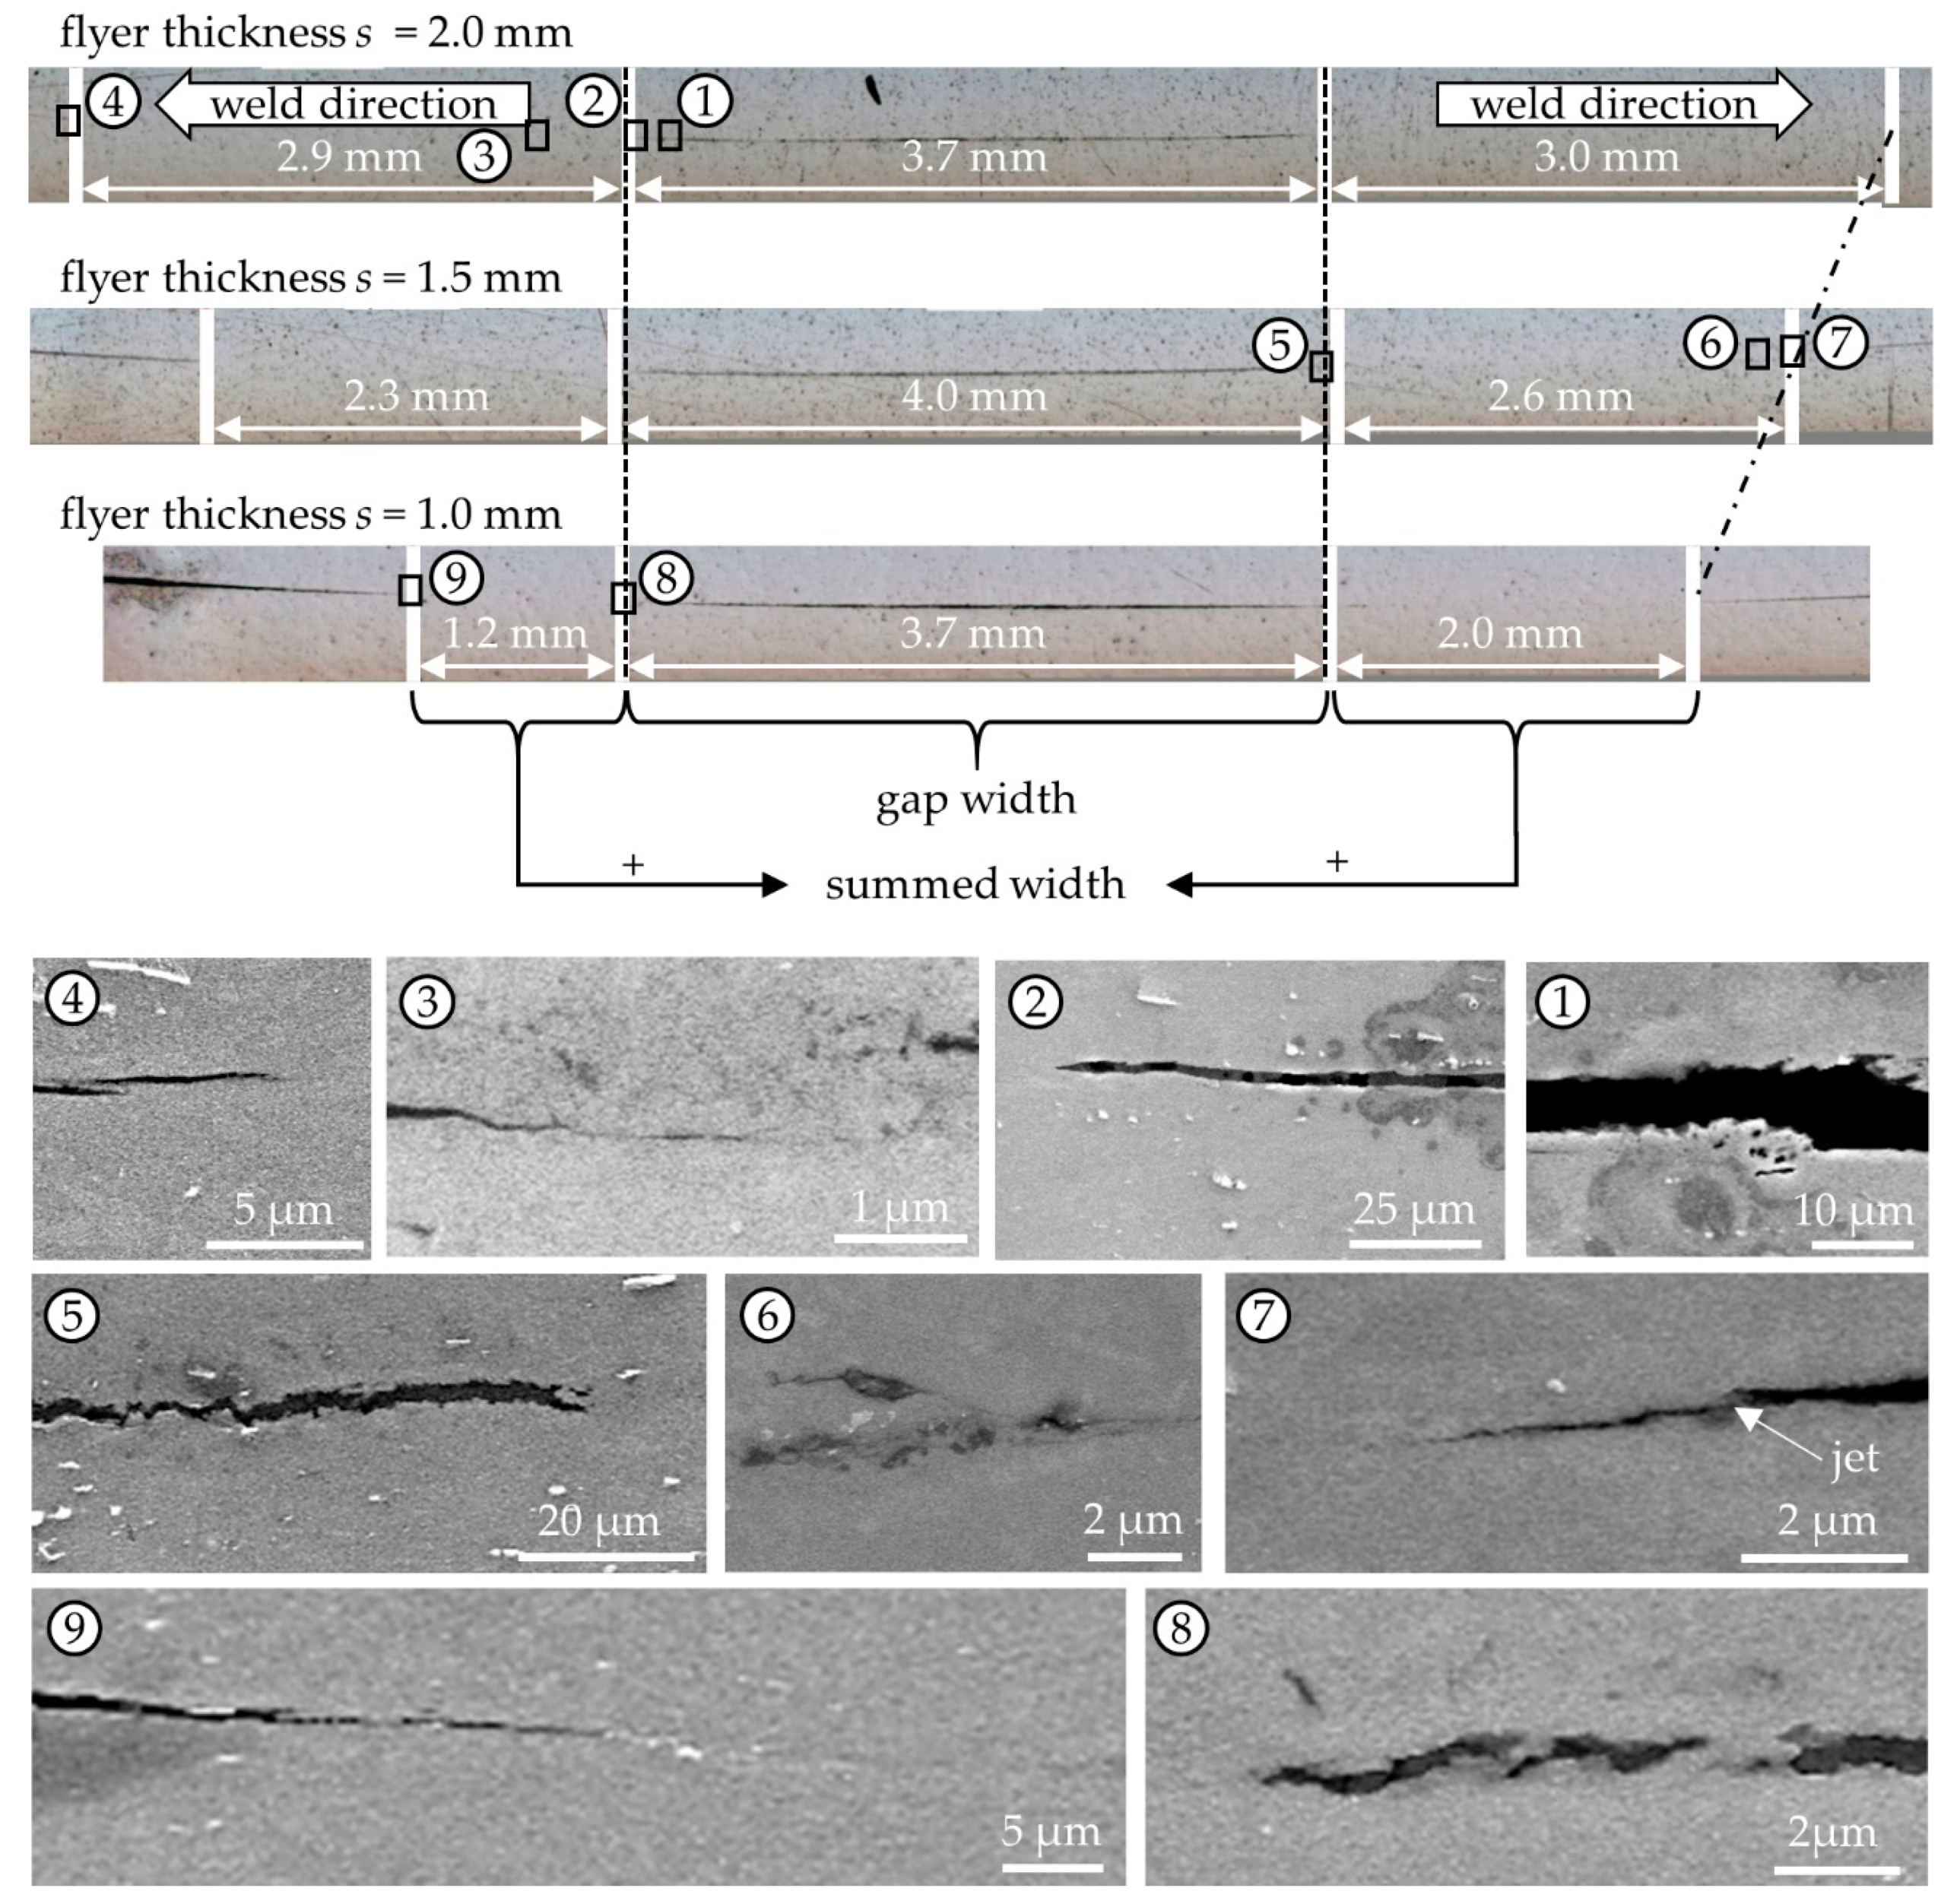
2.5. Analysis of the Weld Interface
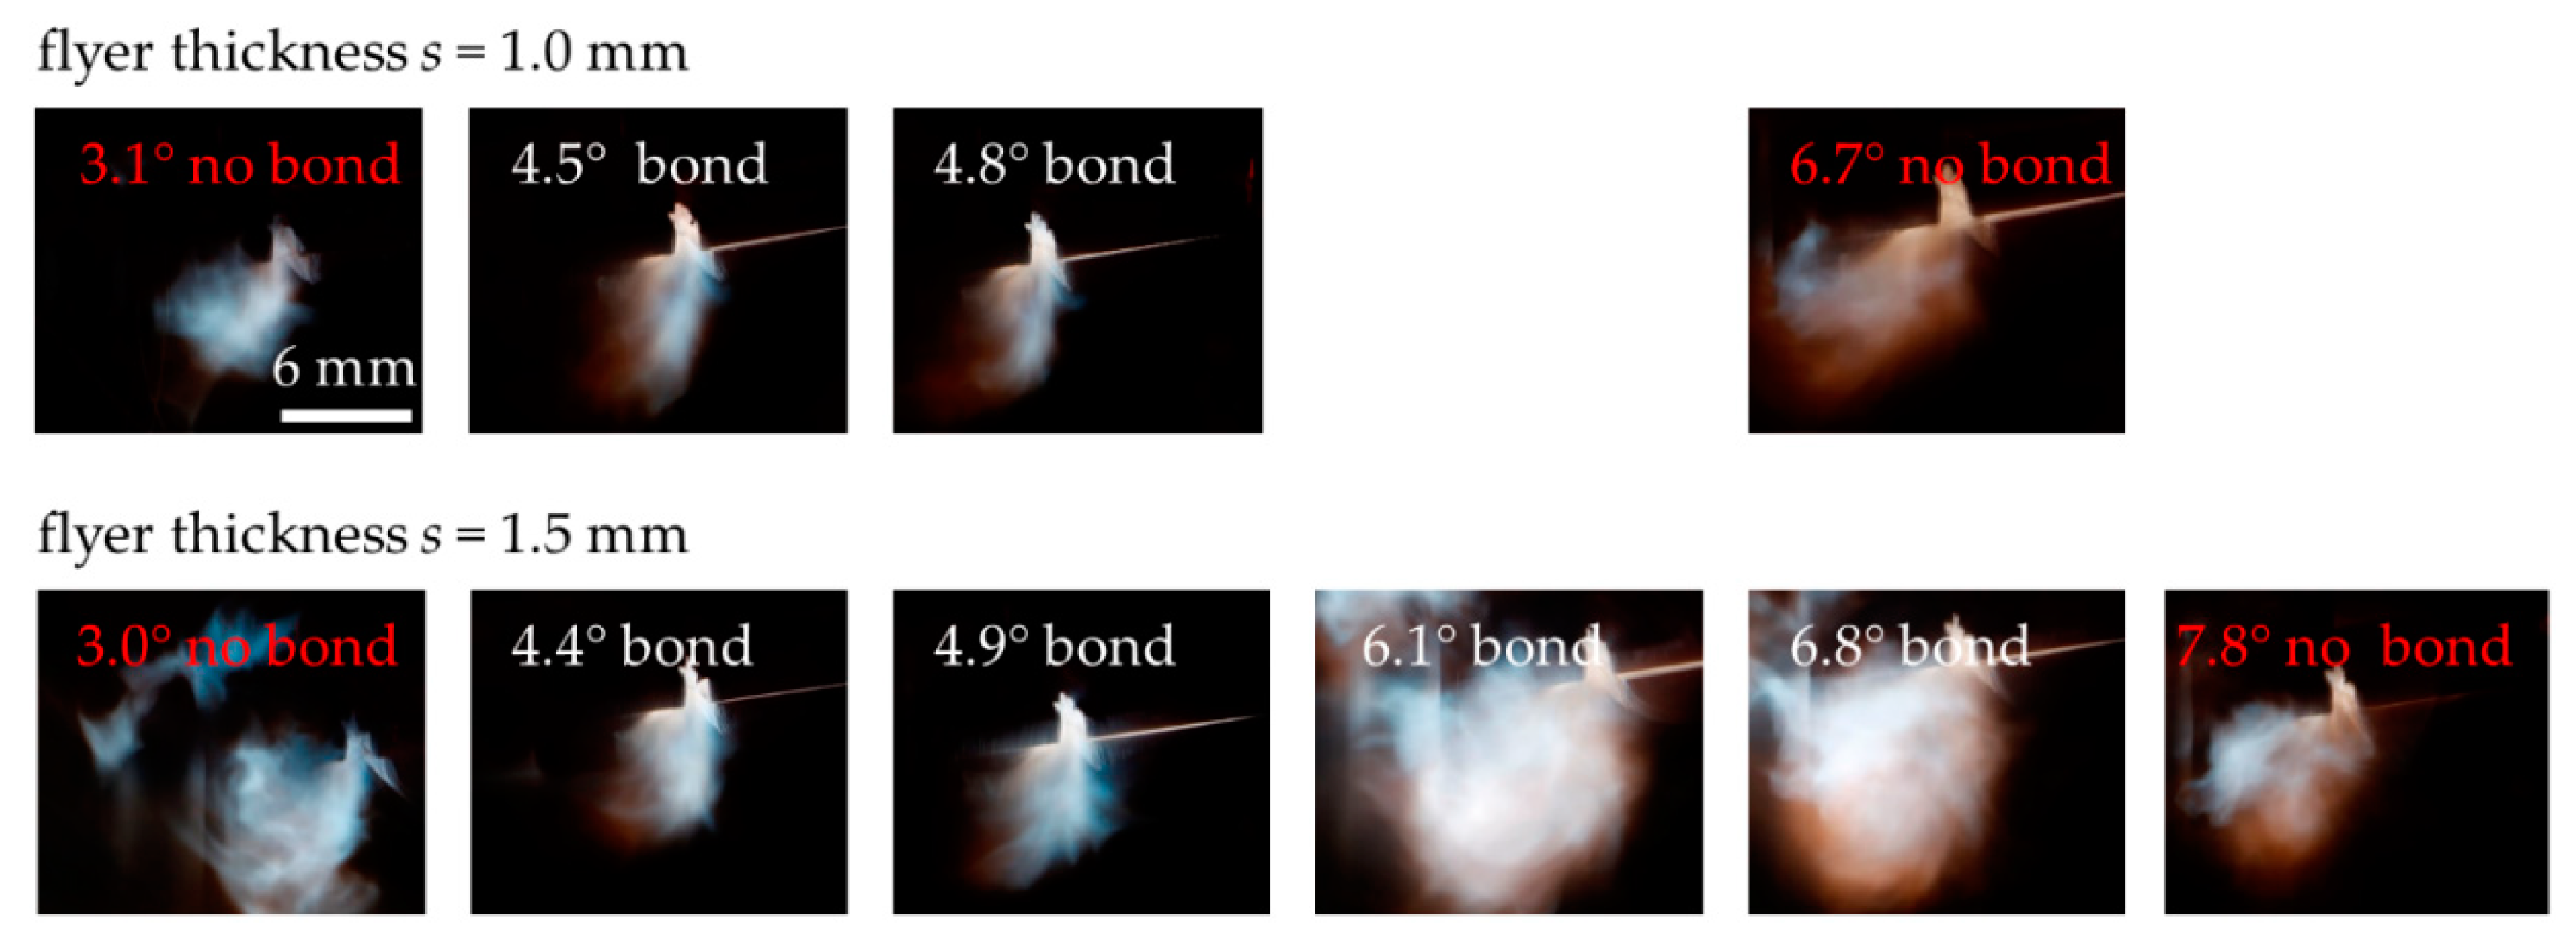
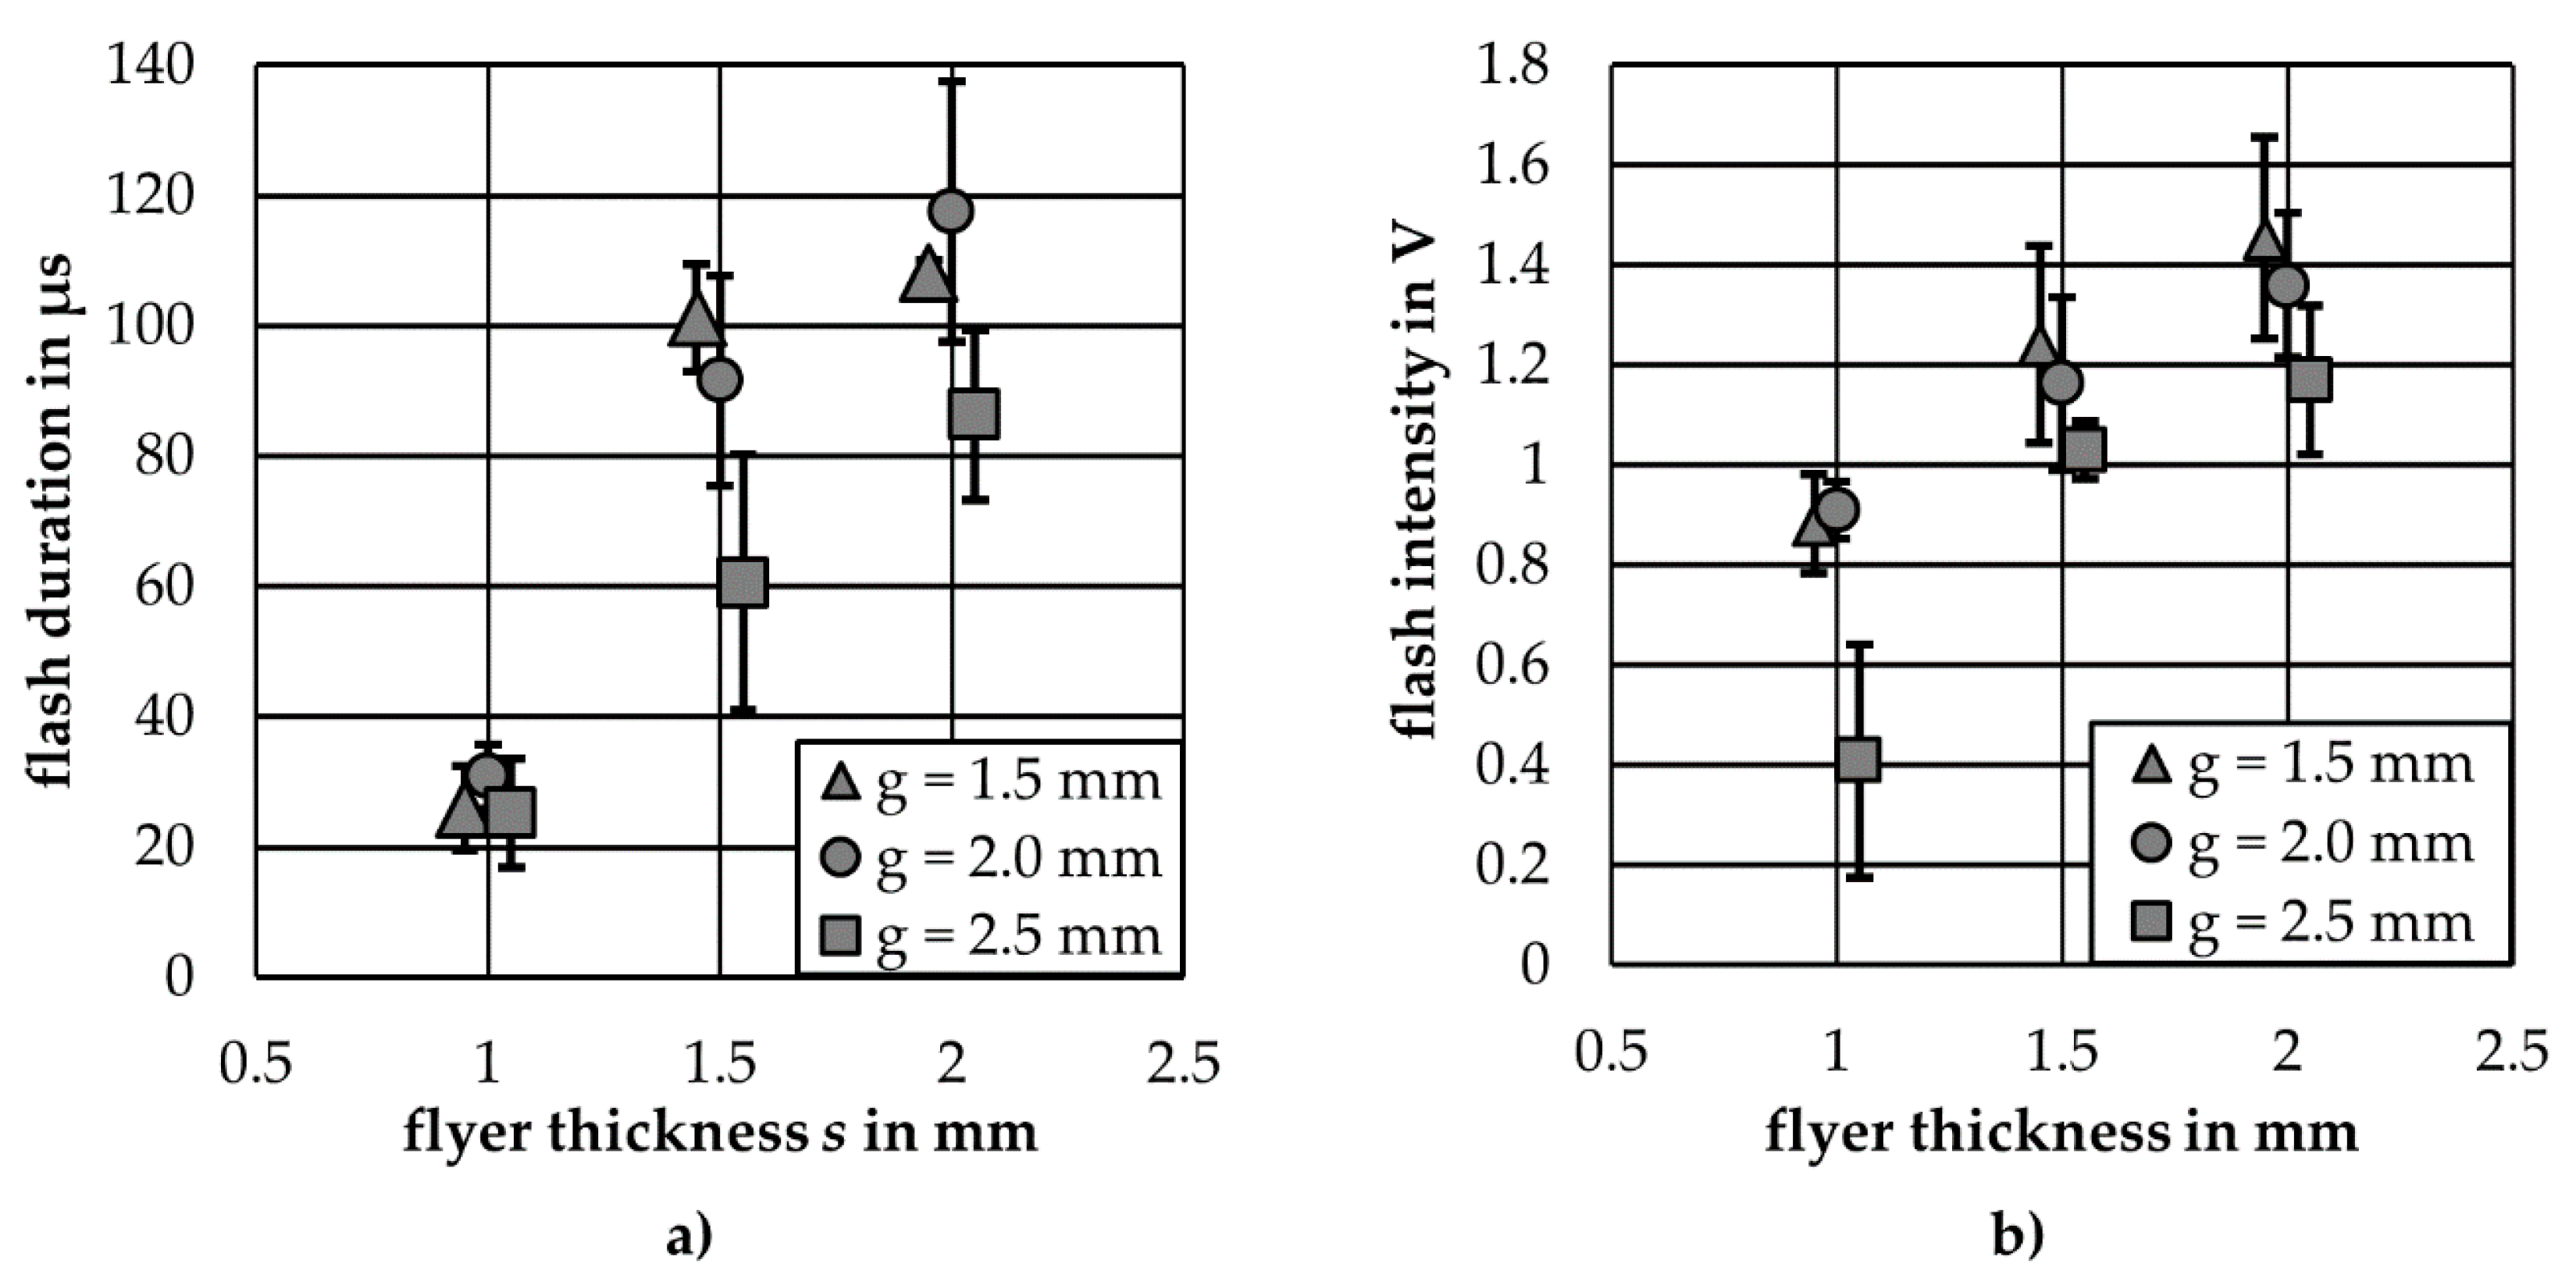
3. Results
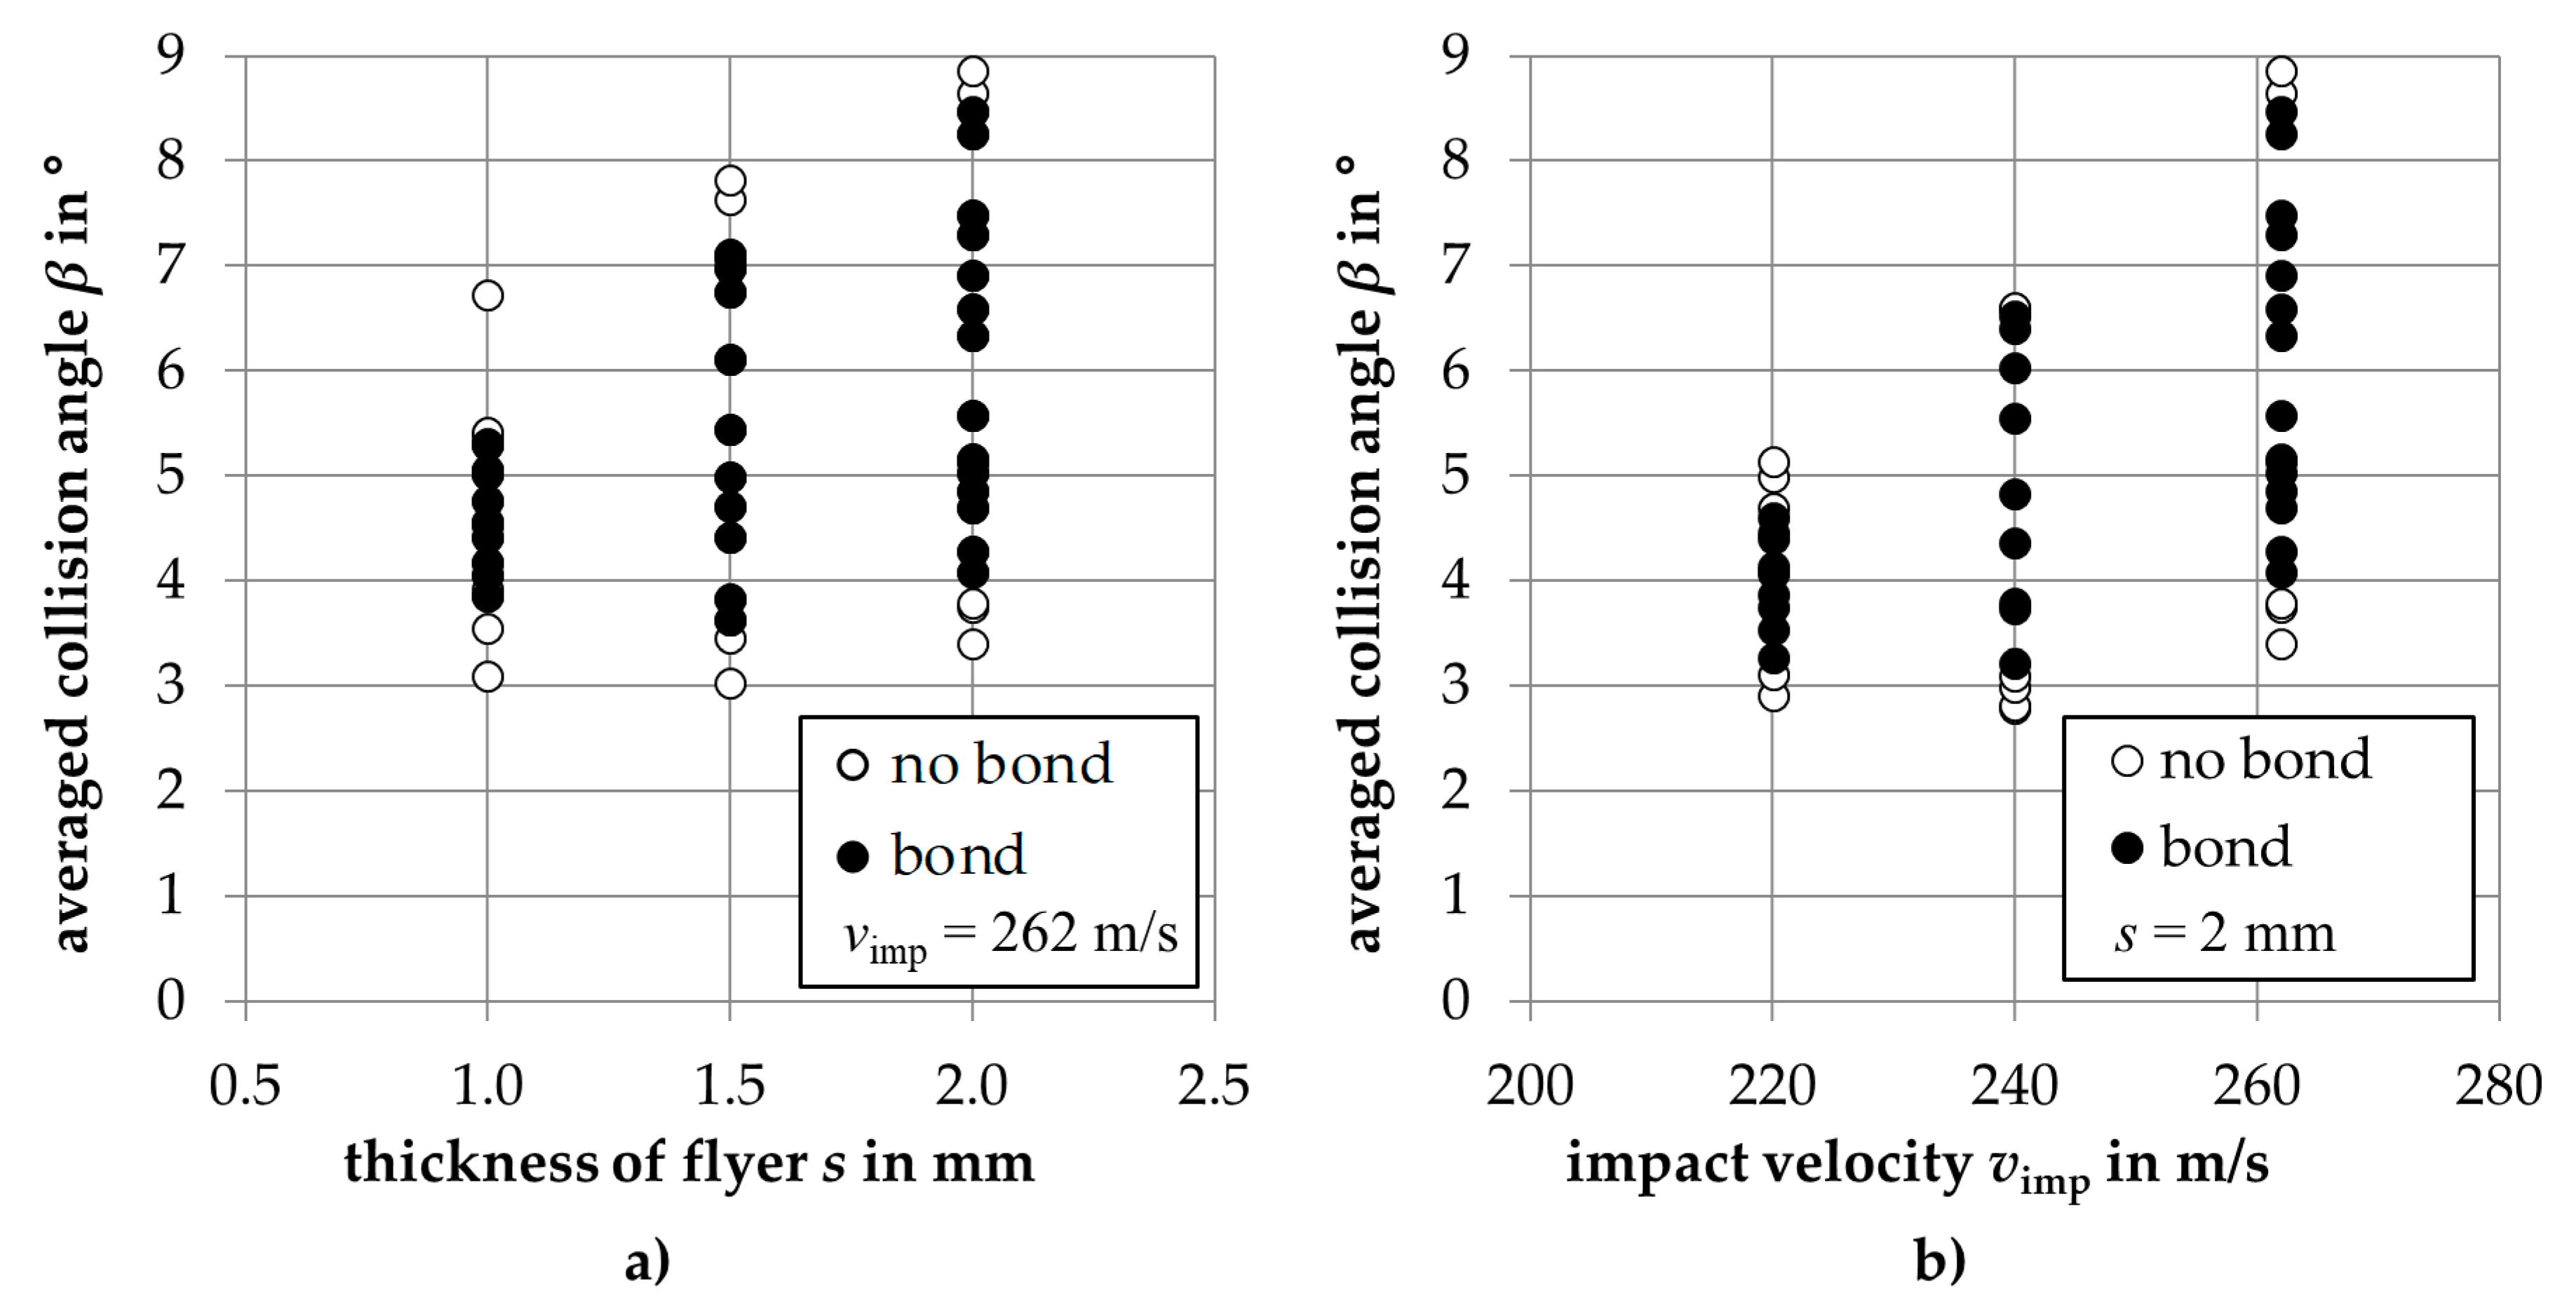
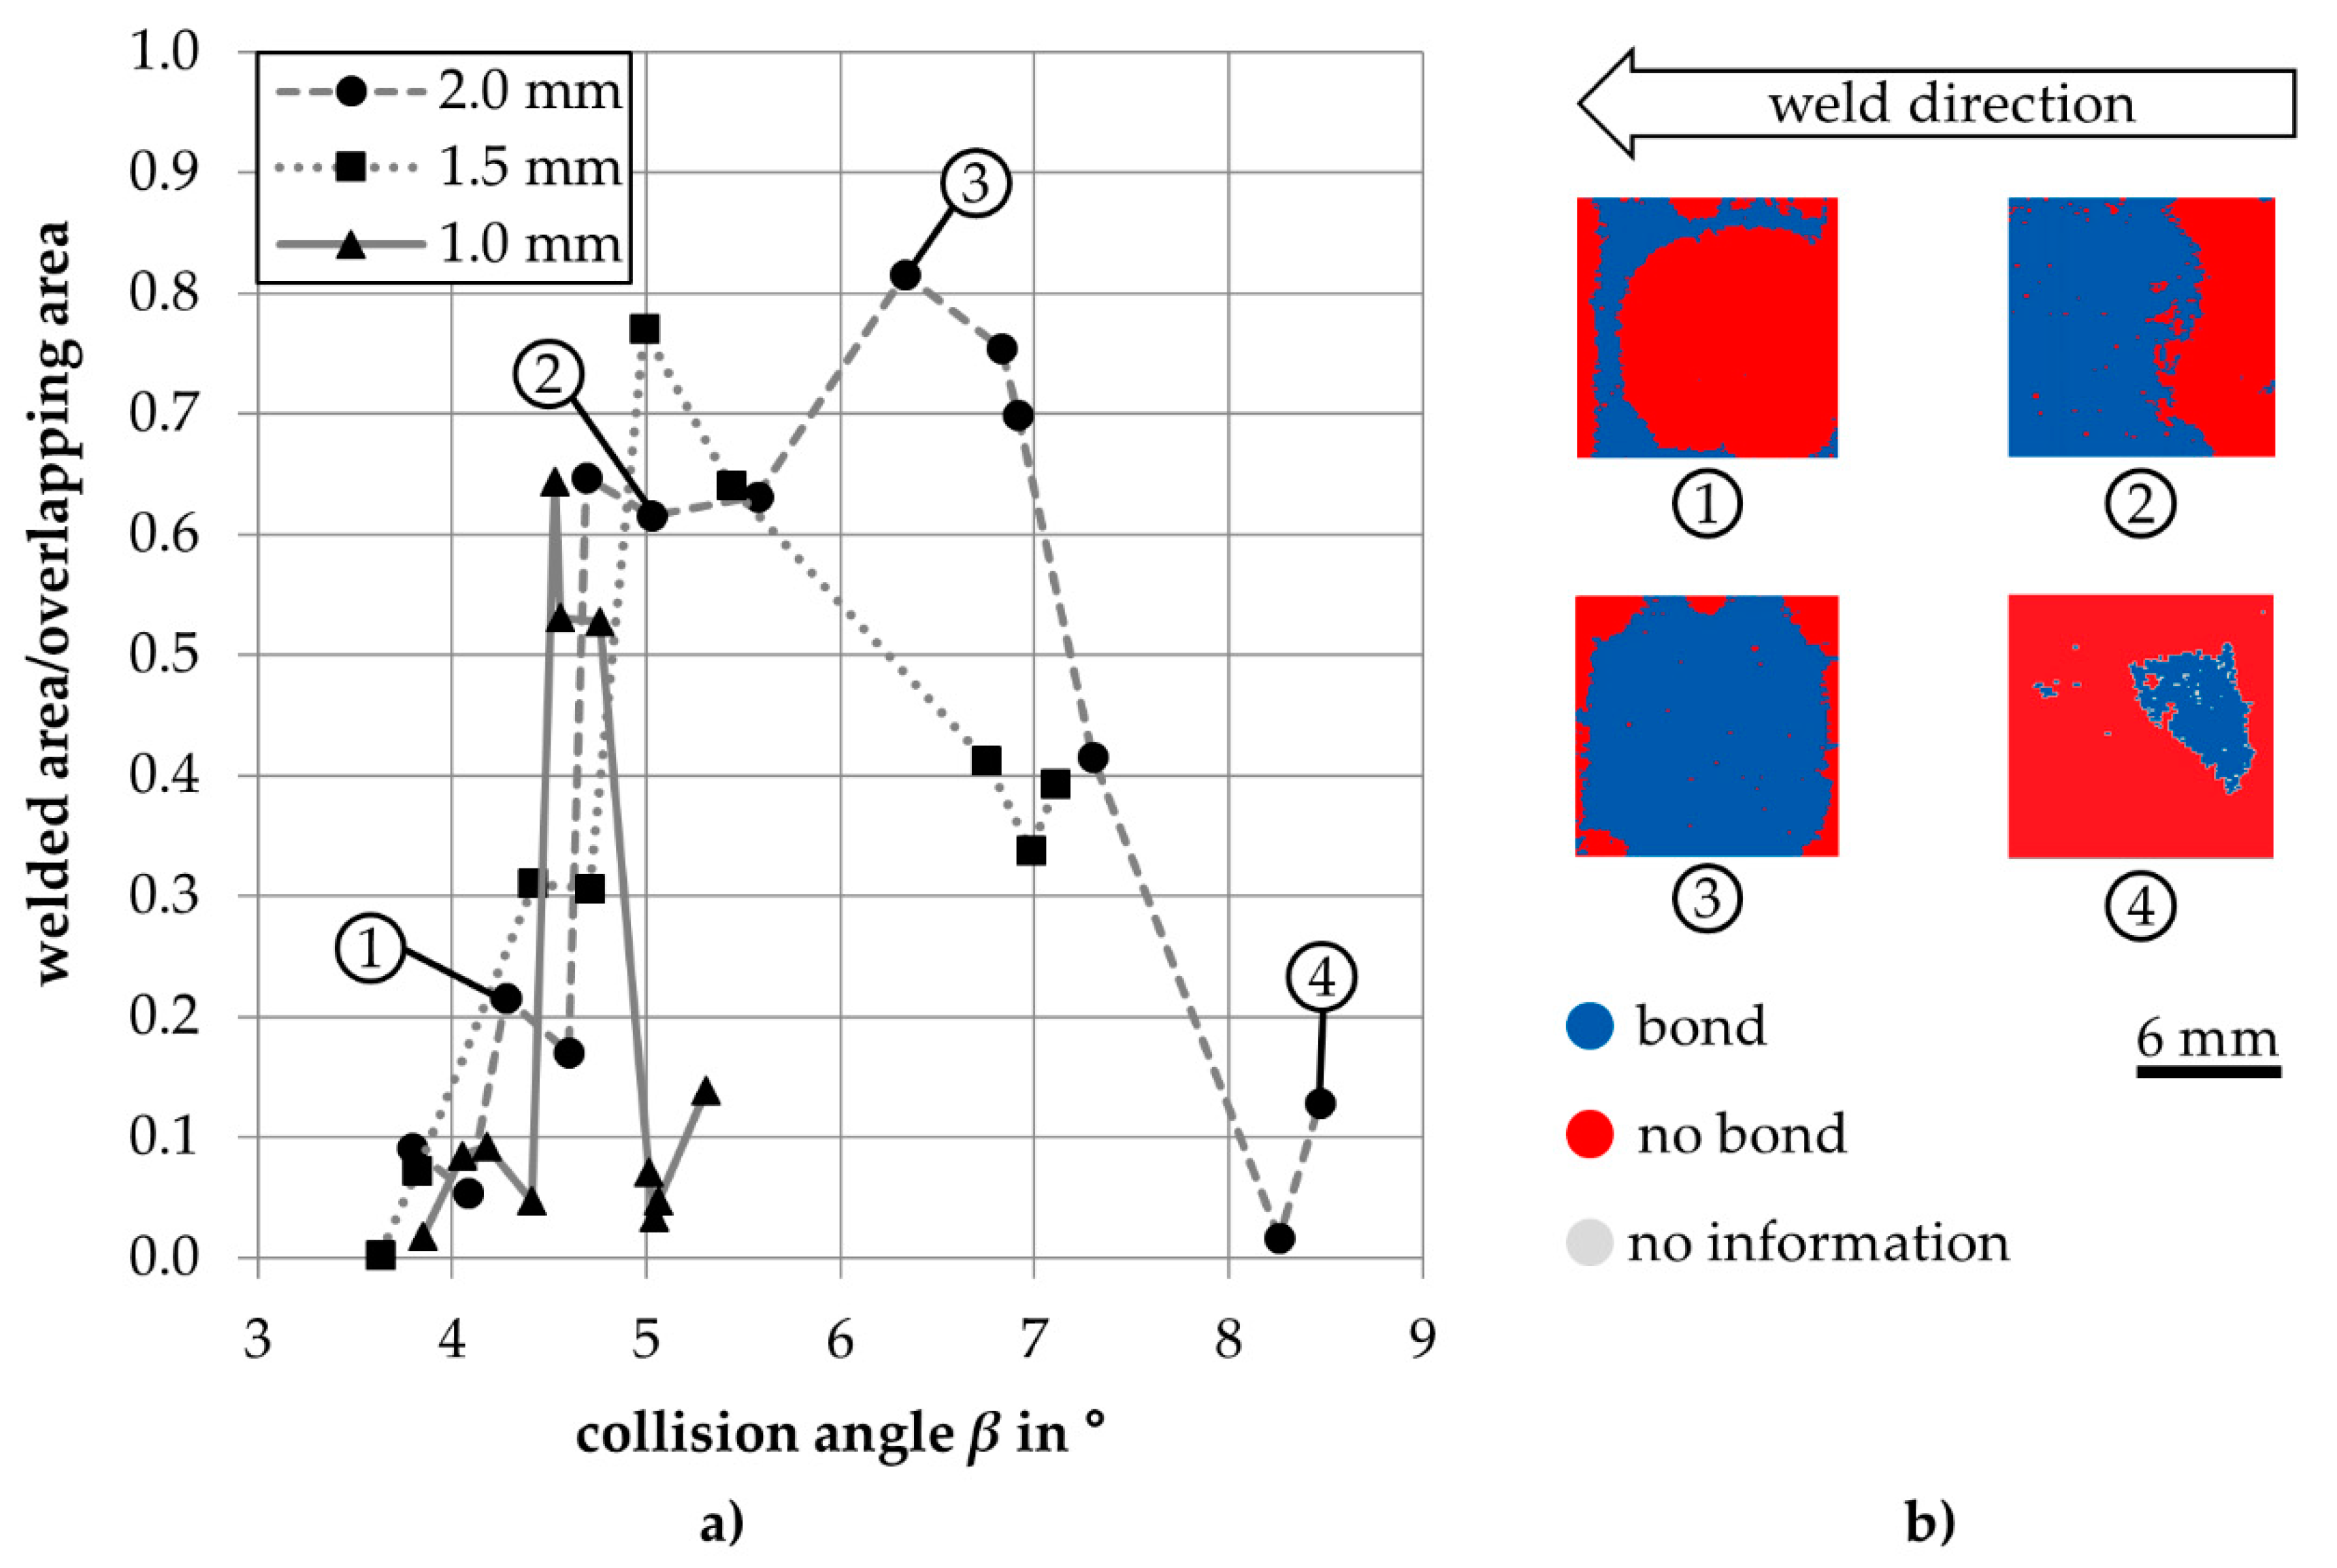
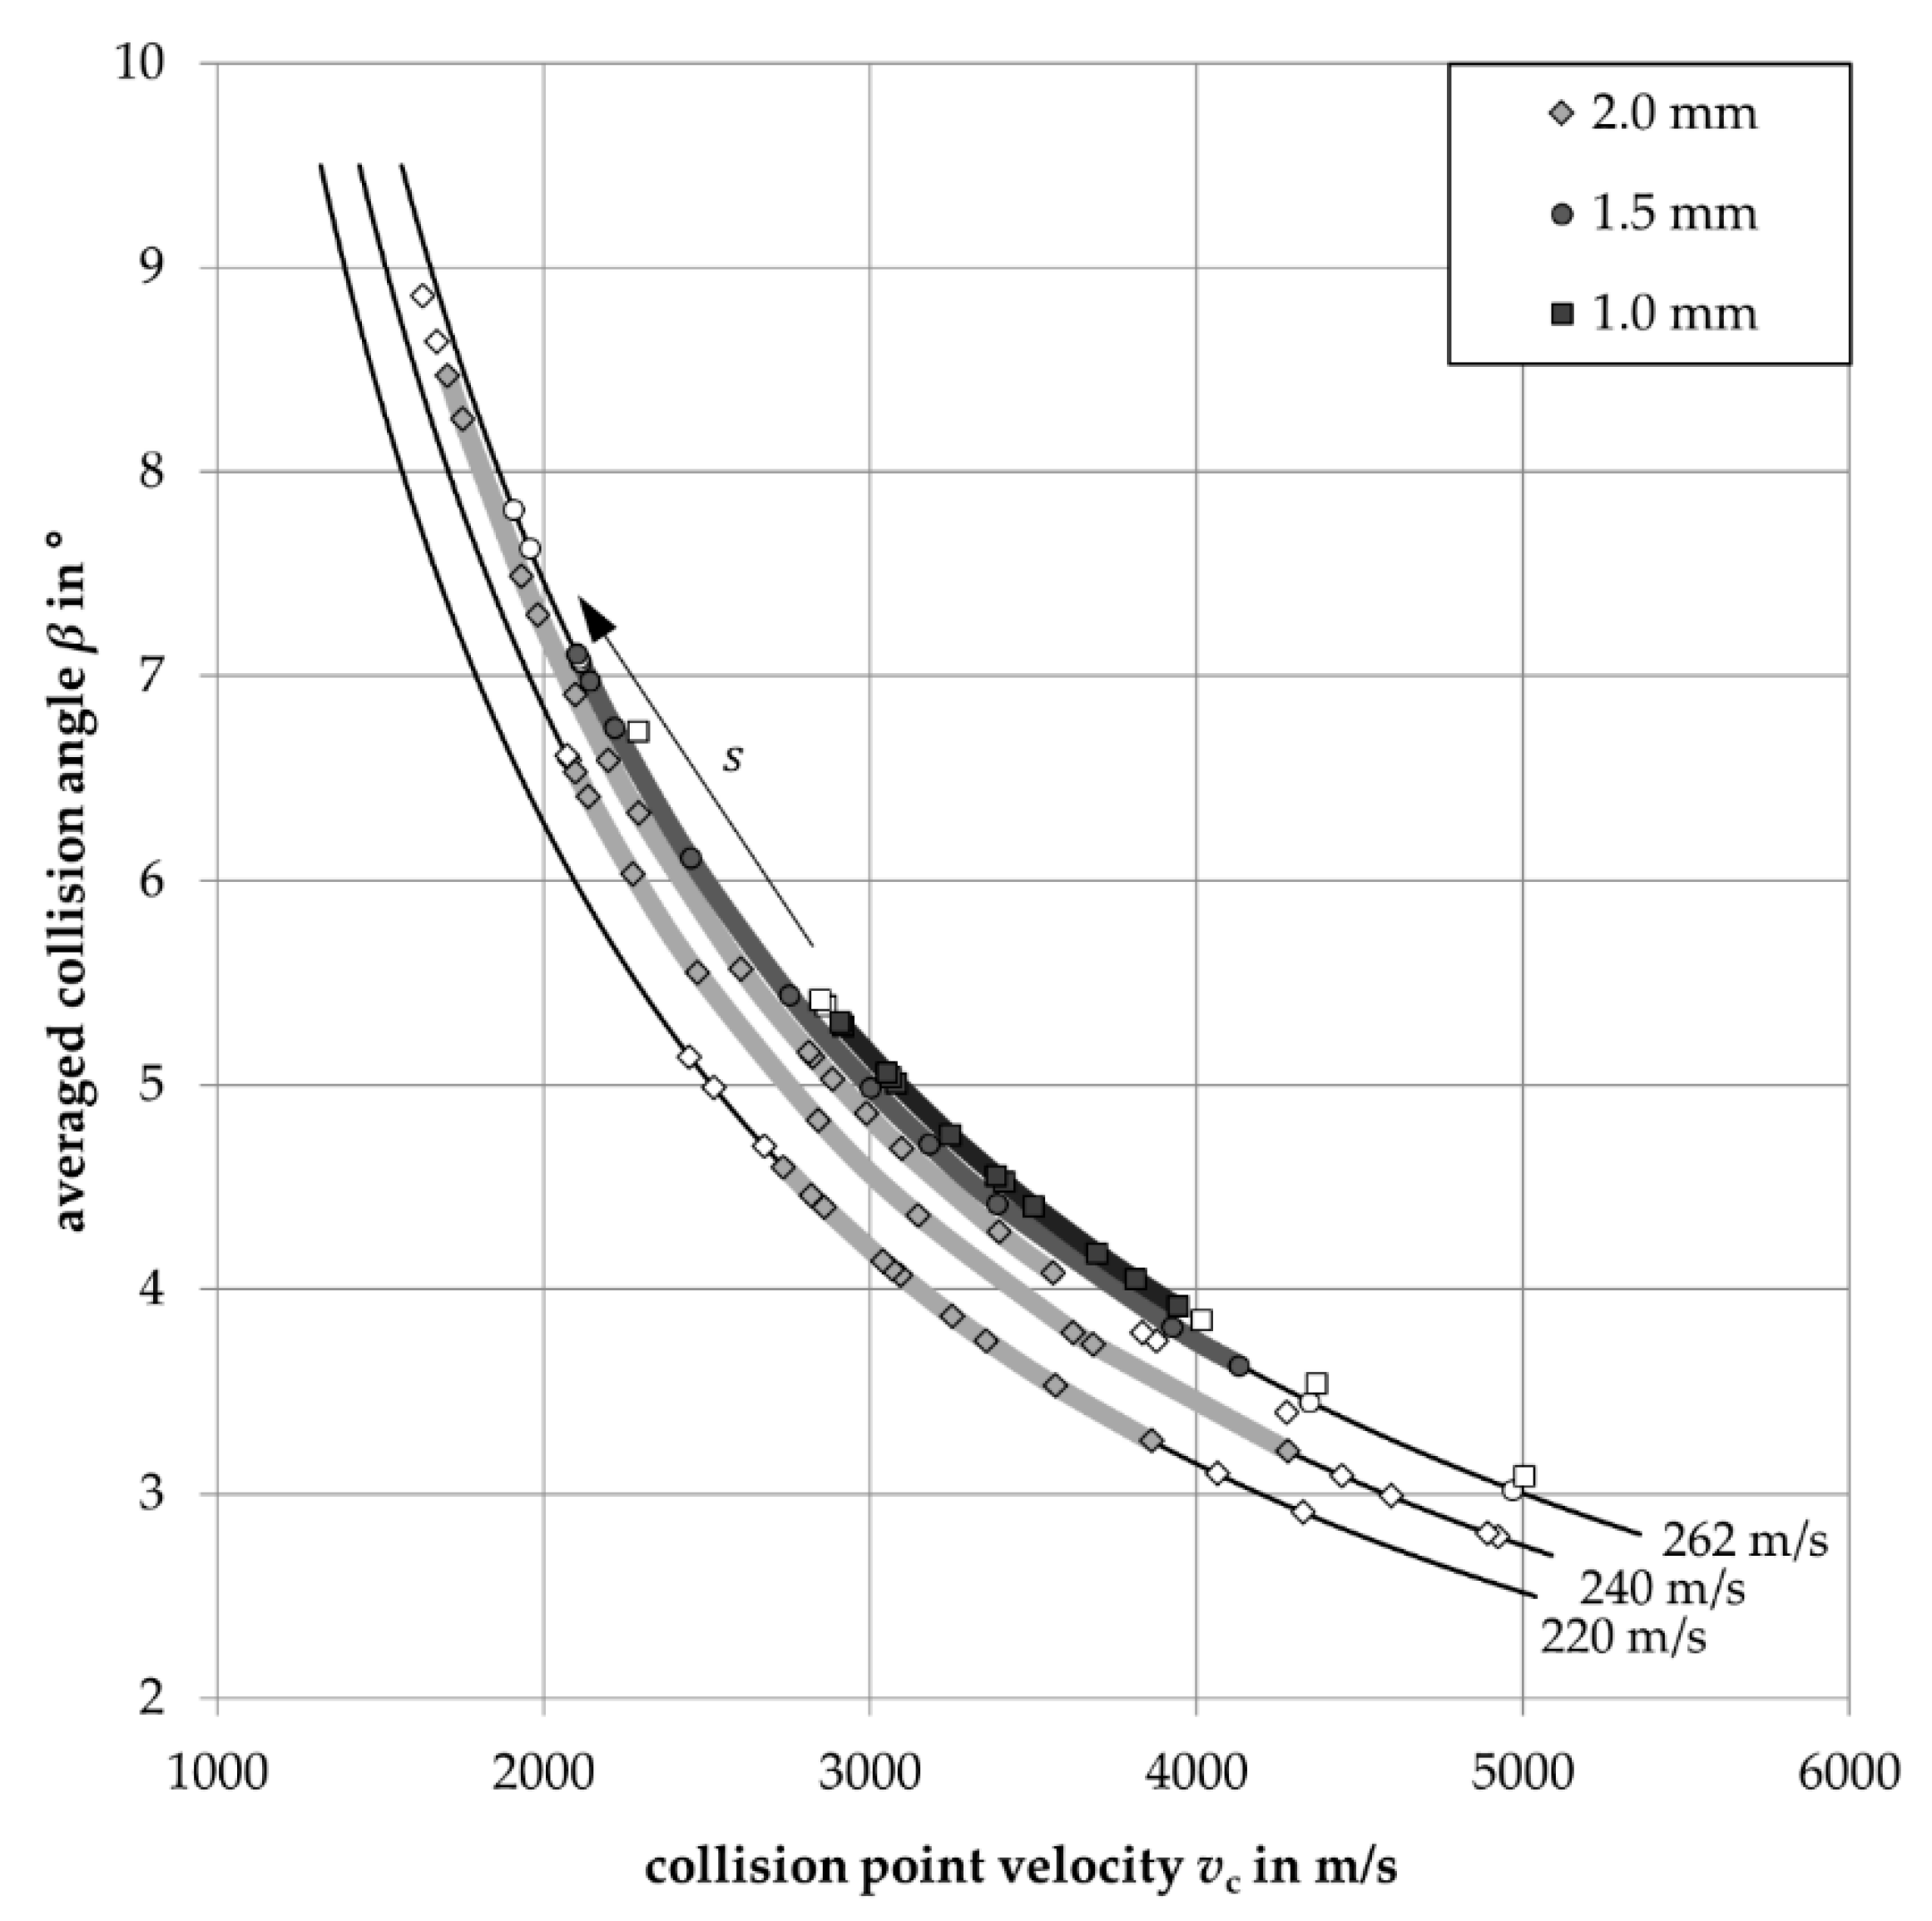
3.1. Model Test Rig
3.2. MPW Setup
4. Discussion
4.1. Influence of Kinetic Energy Input on Weld Interface and Welding Window
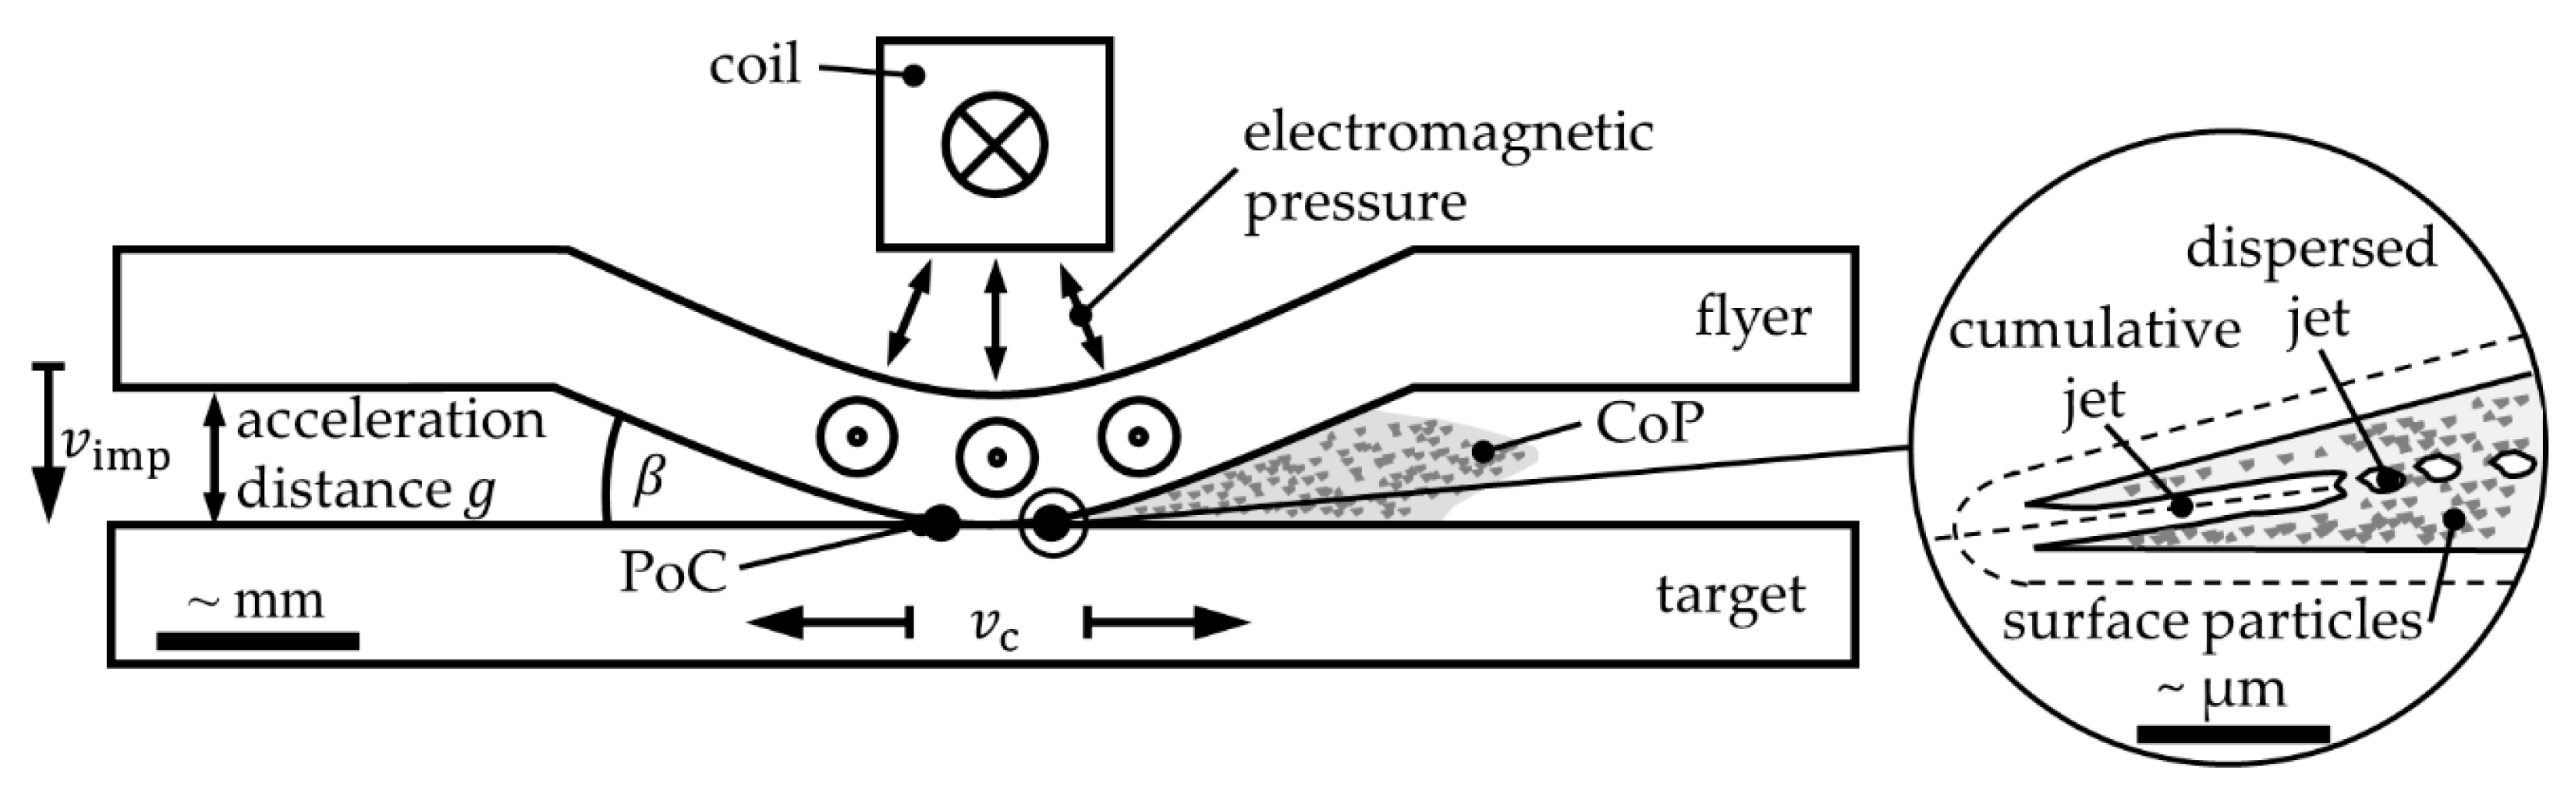
4.2. Influence of the Collision Kinetics on the Phenomena and the Bond Mechanisms
4.3. Prediction and Control of the Weld Interface’s Formation and Properties
5. Conclusions and Outlook
Author Contributions
Funding
Acknowledgments
Conflicts of Interest
Appendix A. Analysis of the Process Glare


References
- Kapil, A.; Sharma, A. Magnetic pulse welding: An efficient and environmentally friendly multi-material joining technique. J. Clean. Prod. 2015, 100, 35–58. [Google Scholar] [CrossRef]
- Jassim, A. Comparison of magnetic pulse welding with other welding methods. J. Energy Power Eng. 2011, 5, 1173–1178. [Google Scholar]
- Wang, H.; Wang, Y. High-Velocity Impact Welding Process: A Review. Metals 2019, 9, 144. [Google Scholar] [CrossRef]
- Stern, A.; Shribman, V.; Ben-Artzy, A.; Aizenshtein, M. Interface Phenomena and Bonding Mechanism in Magnetic Pulse Welding. J. Mater. Eng. Perform. 2014, 23, 3449–3458. [Google Scholar] [CrossRef]
- Akbari Mousavi, A.A.; AL-Hassani, S.T.S. Numerical and experimental studies of the mechanism of the wavy interface formations in explosive/impact welding. J. Mech. Phys. Sol. 2005, 53, 2501–2528. [Google Scholar] [CrossRef]
- Schumacher, E.; Rebensdorf, A.; Böhm, S. Influence of the jet velocity on the weld quality of magnetic pulse welded dissimilar sheet joints of aluminum and steel. Materialwiss. Werkstofftech. 2019, 50, 965–973. [Google Scholar] [CrossRef]
- Carpenter, S.H.; Wittman, R.H. Explosion Welding. Ann. Rev. Mater. Sci. 1975, 5, 177–199. [Google Scholar] [CrossRef]
- Cowan, G.R.; Holtzman, A.H. Flow Configurations in Colliding Plates: Explosive Bonding. J. Appl. Phys. 1963, 34, 928–939. [Google Scholar] [CrossRef]
- Deribas, A.A.; Zakharenko, I.D. Surface effects with oblique collisions between metallic plates. Combust. Explos. Shock Waves 1974, 10, 358–367. [Google Scholar] [CrossRef]
- Bellmann, J.; Lueg-Althoff, J.; Niessen, B.; Böhme, M.; Schumacher, E.; Beyer, E.; Leyens, C.; Tekkaya, A.E.; Groche, P.; Wagner, M.F.-X.; et al. Particle Ejection by Jetting and Related Effects in Impact Welding Processes. Metals 2020, 10, 1108. [Google Scholar] [CrossRef]
- Bellmann, J.; Lueg-Althoff, J.; Schulze, S.; Gies, S.; Beyer, E.; Tekkaya, A.E. Magnetic Pulse Welding: Solutions for Process Monitoring within Pulsed Magnetic Fields. In Proceedings of the Euro-Asian Pulsed Power Conference & Conference on High-Power Particle Beams, Estoril, Portugal, 18–22 September 2016; pp. 18–22. [Google Scholar]
- Cui, J.; Ye, L.; Zhu, C.; Geng, H.; Li, G. Mechanical and Microstructure Investigations on Magnetic Pulse Welded Dissimilar AA3003-TC4 Joints. J. Mater. Eng. Perform. 2020, 212, 8. [Google Scholar] [CrossRef]
- Schäfer, R.; Pasquale, P.; Elsen, A. Material Hybrid Joining of Sheet Metals by Electromagnetic Pulse Technology. Key Eng. Mater. 2011, 473, 61–68. [Google Scholar] [CrossRef]
- Baumgartner, J.; Schnabel, K.; Huberth, F. Fatigue assessment of EMPT-welded joints using the reference radius concept. Procedia Eng. 2018, 213, 418–425. [Google Scholar] [CrossRef]
- Bellmann, J.; Schettler, S.; Dittrich, S.; Lueg-Althoff, J.; Schulze, S.; Hahn, M.; Beyer, E.; Tekkaya, A.E. Experimental study on the magnetic pulse welding process of large aluminum tubes on steel rods. IOP Conf. Ser. Mater. Sci. Eng. 2019, 480, 12033. [Google Scholar] [CrossRef]
- Shribman, V.; Nahmany, M.; Levi, S.; Atiya, O.; Ashkenazi, D.; Stern, A. MP Welding of dissimilar materials: AM laser powder-bed fusion AlSi10Mg to wrought AA6060-T6. Prog. Addit. Manuf. 2019, 11, 2356. [Google Scholar] [CrossRef]
- Mrzljak, S.; Gelinski, N.; Hülsbusch, D.; Schumacher, E.; Boehm, S.; Walther, F. Influence of Process Parameters, Surface Topography and Corrosion Condition on the Fatigue Behavior of Steel/Aluminum Hybrid Joints Produced by Magnetic Pulse Welding. Key Eng. Mater. 2019, 809, 197–202. [Google Scholar] [CrossRef]
- Schumacher, E.; Kümper, S.; Kryukov, I.; Böhm, S. Analysis of the Weld Seam Area of Magnetic Pulse Welded Aluminium-Steel-Sheet-Connections on its Suitability as a Sign of Quality. In Proceedings of the 8th International Conference on High Speed Forming (ICHSF 2018), Columbus, OH, USA, 13–18 May 2018. [Google Scholar]
- Groche, P.; Pabst, C. Numerical Simulation of Impact Welding Processes with LS-DYNA. In Proceedings of the 10th European LS-DYNA Conference, Wurzburg, Germany, 15–17 June 2015. [Google Scholar]
- Cuq-Lelandais, J.-P.; Avrillaud, G.; Ferreira, S.; Mazars, G.; Nottebaert, A.; Teilla, G.; Shribman, V. 3D Impacts Modeling of the Magnetic Pulse Welding Process and Comparison to Experimental Data. In Proceedings of the 7th International Conference on High Speed Forming, Dortmund, Germany, 27–28 April 2016. [Google Scholar]
- Sarvari, M.; Abdollah-zadeh, A.; Naffakh-Moosavy, H.; Rahimi, A.; Parsaeyan, H. Investigation of collision surfaces and weld interface in magnetic pulse welding of dissimilar Al/Cu sheets. J. Manuf. Process. 2019, 45, 356–367. [Google Scholar] [CrossRef]
- Psyk, V.; Hofer, C.; Faes, K.; Scheffler, C.; Scherleitner, E. Testing of Magnetic Pulse Welded Joints—Destructive and Non-Destructive Methods. In Proceedings of the 22nd International ESAFORM Conference on Material Forming (ESAFORM 2019), Vitoria-Gasteiz, Spain, 8–10 May 2019; American Institute of Physics: Melville, NY, USA, 2019; p. 50010, ISBN 978-0-7354-1847-9. [Google Scholar]
- Bellmann, J.; Lueg-Althoff, J.; Schulze, S.; Hahn, M.; Gies, S.; Beyer, E.; Tekkaya, A.E. Effect of the wall thickness on the forming behavior and welding result during magnetic pulse welding. Materialwiss. Werkstofftech. 2019, 212, 150. [Google Scholar] [CrossRef]
- Groche, P.; Niessen, B.; Pabst, C. Process boundaries of collision welding at low energies. Materialwiss. Werkstofftech. 2019, 50, 940–948. [Google Scholar] [CrossRef]
- Niessen, B.; Groche, P. Weld Interface Characteristics of Copper in Collision Welding. In Proceedings of the 22nd International ESAFORM Conference on Material Forming (ESAFORM 2019), Vitoria-Gasteiz, Spain, 8–10 May 2019; American Institute of Physics: Melville, NY, USA, 2019; p. 50010, ISBN 978-0-7354-1847-9. [Google Scholar]
- Lysak, V.I.; Kuzmin, S.V. Lower boundary in metal explosive welding. Evolution of ideas. J. Mater. Process. Technol. 2012, 212, 150–156. [Google Scholar] [CrossRef]
- Groche, P.; Wagner, M.F.-X.; Pabst, C.; Sharafiev, S. Development of a novel test rig to investigate the fundamentals of impact welding. J. Mater. Process. Technol. 2014, 214, 2009–2017. [Google Scholar] [CrossRef]
- Groche, P.; Becker, M.; Pabst, C. Process window acquisition for impact welding processes. Mater. Des. 2017, 118, 286–293. [Google Scholar] [CrossRef]
- Pabst, C.; Sharafiev, S.; Groche, P.; Wagner, M.F.X. A Novel Method to Investigate the Principles of Impact Welding: Development and Enhancement of a Test Rig, Experimental and Numerical Results. Adv. Mater. Res. 2014, 966–967, 500–509. [Google Scholar] [CrossRef]
- Strand, O.T.; Goosman, D.R.; Martinez, C.; Whitworth, T.L.; Kuhlow, W.W. Compact system for high-speed velocimetry using heterodyne techniques. Rev. Instrum. 2006, 77, 83108. [Google Scholar] [CrossRef]
- Johnson, J.R.; Taber, G.; Vivek, A.; Zhang, Y.; Golowin, S.; Banik, K.; Fenton, G.K.; Daehn, G.S. Coupling experiment and simulation in electromagnetic forming using photon doppler velocimetry. Steel Res. Int. 2009, 80, 359–365. [Google Scholar]
- Lueg-Althoff, J. Fügen von Rohren durch elektromagnetische Umformung—Magnetpulsschweißen, 1st ed.; Shaker: Herzogenrath, Germany, 2019; ISBN 384406558X. (In German) [Google Scholar]
- Eichhorn, G. Analysis of the hypervelocity impact process from impact flash measurements. Planet. Space Sci. 1976, 24, 771–781. [Google Scholar] [CrossRef]
- Bellmann, J.; Beyer, E.; Lueg-Althoff, J.; Gies, S.; Tekkaya, A.E.; Schulze, S. Measurement of Collision Conditions in Magnetic Pulse Welding Processes. J. Phys. Sci. Appl. 2017, 7, 1–10. [Google Scholar] [CrossRef]
- Bellmann, J.; Lueg-Althoff, J.; Schulze, S.; Hahn, M.; Gies, S.; Beyer, E.; Tekkaya, A. Thermal Effects in Dissimilar Magnetic Pulse Welding. Metals 2019, 9, 348. [Google Scholar] [CrossRef]
- Manikandan, P.; Hokamoto, K.; Fujita, M.; Raghukandan, K.; Tomoshige, R. Control of energetic conditions by employing interlayer of different thickness for explosive welding of titanium/304 stainless steel. J. Mater. Process. Technol. 2008, 195, 232–240. [Google Scholar] [CrossRef]
- Khaustov, S.V.; Kuz’min, S.V.; Lysak, V.I.; Pai, V.V. Thermal processes in explosive welding. Combust. Explos. Shock Waves 2014, 50, 732–738. [Google Scholar] [CrossRef]
- Pabst, C. Ursachen, Beeinflussung, Auswirkungen sowie Quantifizierung der Temperaturentwicklung in der Fügezone beim Kollisionsschweißen; Shaker Verlag: Düren, Germany, 2019; ISBN 978-3-8440-7073-6. (In German) [Google Scholar]
- Böhme, M.; Sharafiev, S.; Schumacher, E.; Böhm, S.; Wagner, M.F.-X. On the microstructure and the origin of intermetallic phase seams in magnetic pulse welding of aluminum and steel. Materialwiss. Werkstofftech. 2019, 50, 958–964. [Google Scholar] [CrossRef]


| Series of Experiment | Applied Setup | Varied Key Parameter | Constant Parameter |
|---|---|---|---|
| 1.1 | Test rig | Flyer thickness (s = 1 mm, 1.5 mm, 2 mm) = 3–9°) | = 262 m/s |
| 1.2 | Test rig | = 220 m/s, 240 m/s) = 3–9°) | S = 2 mm |
| 2.1 | MPW | Flyer thickness (s = 1 mm, 1.5 mm, 2 mm) | = 262 m/s, g = 1.5 mm |
| 2.2 | MPW | Flyer thickness (s = 1 mm, 1.5 mm, 2 mm) | = 262 m/s, g = 2.0 mm |
| 2.3 | MPW | Flyer thickness (s = 1 mm, 1.5 mm, 2 mm) | = 262 m/s, g = 2.5 mm |
| Flyer Thickness s in mm | Acceleration Gap g in mm | Charging Energy in kJ | Ø max. Current in kA | Ø Discharge Frequency in kHz | Min. Impact Velocity in m/s | Max. Impact Velocity in m/s | Ø Impact Velocity in m/s |
|---|---|---|---|---|---|---|---|
| 2.0 | 1.5 | 19.0 | 392.4 | 19.7 | 255 | 261 | 257.0 |
| 2.0 | 2.0 | 18.0 | 381.3 | 19.7 | 255 | 258 | 256.3 |
| 2.0 | 2.5 | 17.5 | 376.0 | 19.7 | 259 | 262 | 260.7 |
| 1.5 | 1.5 | 14.5 | 340.5 | 19.7 | 251 | 257 | 254.3 |
| 1.5 | 2.0 | 13.7 | 330.4 | 19.7 | 251 | 256 | 253.0 |
| 1.5 | 2.5 | 13.3 | 325.3 | 19.7 | 249 | 255 | 252.3 |
| 1.0 | 1.5 | 9.7 | 274.6 | 19.7 | 261 | 269 | 263.7 |
| 1.0 | 2.0 | 9.3 | 268.7 | 19.7 | 260 | 261 | 260.3 |
| 1.0 | 2.5 | 8.7 | 259.8 | 19.7 | 249 | 250 | 249.3 |
© 2020 by the authors. Licensee MDPI, Basel, Switzerland. This article is an open access article distributed under the terms and conditions of the Creative Commons Attribution (CC BY) license (http://creativecommons.org/licenses/by/4.0/).
Share and Cite
Niessen, B.; Schumacher, E.; Lueg-Althoff, J.; Bellmann, J.; Böhme, M.; Böhm, S.; Tekkaya, A.E.; Beyer, E.; Leyens, C.; Wagner, M.F.-X.; et al. Interface Formation during Collision Welding of Aluminum. Metals 2020, 10, 1202. https://doi.org/10.3390/met10091202
Niessen B, Schumacher E, Lueg-Althoff J, Bellmann J, Böhme M, Böhm S, Tekkaya AE, Beyer E, Leyens C, Wagner MF-X, et al. Interface Formation during Collision Welding of Aluminum. Metals. 2020; 10(9):1202. https://doi.org/10.3390/met10091202
Chicago/Turabian StyleNiessen, Benedikt, Eugen Schumacher, Jörn Lueg-Althoff, Jörg Bellmann, Marcus Böhme, Stefan Böhm, A. Erman Tekkaya, Eckhard Beyer, Christoph Leyens, Martin Franz-Xaver Wagner, and et al. 2020. "Interface Formation during Collision Welding of Aluminum" Metals 10, no. 9: 1202. https://doi.org/10.3390/met10091202
APA StyleNiessen, B., Schumacher, E., Lueg-Althoff, J., Bellmann, J., Böhme, M., Böhm, S., Tekkaya, A. E., Beyer, E., Leyens, C., Wagner, M. F.-X., & Groche, P. (2020). Interface Formation during Collision Welding of Aluminum. Metals, 10(9), 1202. https://doi.org/10.3390/met10091202