Article

The Influence of Specimen Geometry and Strain Rate on the Portevin-Le Chatelier Effect and Fracture in an Austenitic FeMnC TWIP Steel

Canmet Materials, Natural Resources Canada, 183 Longwood Road South, Hamilton, ON L8P 0A5, Canada
*
Author to whom correspondence should be addressed.
Metals 2020, 10(9), 1201; https://doi.org/10.3390/met10091201
Submission received: 27 July 2020 / Revised: 27 August 2020 / Accepted: 3 September 2020 / Published: 8 September 2020
(This article belongs to the Special Issue Recent Developments in Medium and High Manganese Steels)

Abstract

:
We studied the Portevin-Le Chatelier effect and fracture behavior of a FeMnC TWIP steel using high speed digital image correlation by varying the specimen geometry (flat vs. round) and test strain rate (0.001 vs. 0.1 s−1). The results show that the mean flow stress, the mean strain hardening rate and the mean strain rate sensitivity parameters are all independent of the specimen geometry and are uncorrelated with the presence or not of Portevin-Le Chatelier (PLC) bands, the type of PLC bands observed or the critical strain for band formation. However, both the fracture strains and stresses and the PLC behavior are highly geometry and/or strain rate dependent. Dynamic strain aging (DSA) and in particular the presence of PLC instabilities appears to play an important but as yet unclear role in promoting premature necking and final fracture.

1. Introduction

Austenitic FeMnC TWIP steels present enhanced work hardening capacities, allowing for the unique simultaneous exhibition of high tensile strength and ductility [1,2]. This elevated work hardening response consists of contributions from dislocation glide, dynamic strain aging (DSA), twinning (TWIP) and strain-induced ε and α’ martensite (TRIP) mechanisms that vary in a complex way with composition, temperature and strain rate. The relative importance and the dynamical interactions between each strengthening component during straining are still not well understood, and form the basis of a lively ongoing debate in the literature [1,2,3,4,5]. One area where there is a general consensus is that TWIP steels tend to show abrupt shear fracture with negligible post uniform elongation (PUE) in tension, in spite of their ductile failure mode [6,7,8,9]. Shear fracture in TWIP alloys can occur earlier than the predicted onset of diffuse necking not just in uniaxial tension but for all sheet deformation modes [10] and can be reasonably well described by a maximum shear stress (Tresca) criterion [1,6]. In a manner analogous to dual phase (DP) steels, low PUE is undesirable as it correlates with a mediocre hole expansion coefficient that strongly limits stretch flange formability in thin sheets [11]. Several authors have linked premature shear fracture in Al-Mg alloys at room temperature and in C-Mn steels at 200–300 °C to the presence of DSA [12,13,14,15]. DSA causes discontinuous (jerky) flow to appear on the stress-strain curves, leading to the well known “Portevin-Le Chatelier (PLC) effect” in the material. Three types of PLC bands are commonly observed [16]. Type A bands are mobile, often traversing the entire gauge length and are characterized by regular positive stress spikes on the flow curve. Type B bands form discontinuously but regularly and are associated with a higher frequency oscillatory behavior of the flow curve. Type C bands are chaotic and immobile and are associated with random stress drops on the flow curve. Premature fracture is believed to occur in both Al-Mg and C-Mn steels due to the growth and coalescence of voids within inclined immobile (Type B or C) PLC bands [15,17]. In FeMnC TWIP steels, DSA is characterized by a negative strain rate sensitivity (NSRS) for strain rates in the range 1 × 10⁻⁵ to 1 s−1 [18,19]. In fact, some authors have proposed that DSA is actually the dominant strengthening mechanism in this class of alloys [3,5,20]. The source of NSRS in TWIP alloys is unresolved and has variously been attributed to a reduction in the intensity of DSA at higher strain rates [20] and/or a decrease in the twinning kinetics [1]. Obviously, once strain localization occurs the presence of NSRS will naturally tend to accelerate the onset of fracture. Most of the recent studies on DSA in FeMnC TWIP alloys have concentrated on the work hardening behavior in uniaxial tension [16,21,22,23] with fewer authors reporting on the fracture behavior. The latter tend to confirm that fracture occurs inside immobile PLC bands. However, PLC band formation and propagation is known to be dependent on specimen geometry and surface conditions [24,25,26] and laboratory forming trials have confirmed that PLC bands are not observed under complex biaxial stress/strain conditions when premature shear fracture occurs [1,10] although load-displacement fluctuations have been observed during deep drawing [21]. The same trials confirmed that the negative strain rate sensitivity was still present. Clearly, there is an important gap in the open literature on the PLC-NSRS effect and the fracture behavior of austenitic TWIP steels. In this work, we report on how the PLC effect and the fracture behavior in a well-characterized FeMnC TWIP alloy varies with specimen geometry and test strain rate.

2. Materials and Methods

The material used in the present study was vacuum induction melted and hot rolled to a 38 mm thick transfer bar of composition (in wt %) Fe-0.9C-17Mn-0.5Si-0.3V-0.019N. The alloy, which has been described previously [1], was designed using an iso-stacking fault energy (IsoSFE) approach such that the inevitable local compositional fluctuations resulting from the co-segregation of C and Mn during solidification introduced the smallest possible deviation from the target SFE [27]. It has one of the highest work hardening coefficients of all stable austenitic FeMnC TWIP steels (>3000 MPa). The alloy was solution treated at 950 °C and water quenched to dissolve cementite precipitates. This temperature was also sufficient to return the majority of precipitated V(C,N) into solution.
Optical microscopy (Carl Zeiss Axioscope, Jena, Germany) was carried out after polishing with 1 μm diamond paste followed by Struers 0.25 μm OPS silica solution (Struers ApS, Ballerup, Denmark) finishing. Samples were etched with a Klemm color etching solution before observation. Austenite grain sizes were measured using the standard intercept method. Thin foil TEM samples were prepared by mechanical thinning to ~100 μm followed by jet electropolishing using a Struers Tenupol-5 (Struers ApS, Ballerup, Denmark). TEM bright field images and diffraction patterns were acquired in a Tecnai Osiris 200 keV FEG-STEM (FEI Electron Optics BV, Eindhoven, The Netherlands).
Tensile specimens were directly machined from the as-quenched alloy to ASTM E8 standard specifications. Two different cross-section geometries were fabricated to produce 12.5 by 10 mm rectangular section and 12.5 mm diameter round section samples, such that the ratio of the perimeter to the cross section Sv was similar (0.32 mm−1 for the round bars and 0.36 mm−1 for rectangular bars). The gauge length was 50 mm for both types of samples. Uniaxial tensile tests were performed under constant cross-head speed conditions on a MTS Landmark test frame at two nominal strain rates, i.e., a low strain rate of 0.001 s−1 and a high strain rate of 0.1 s−1. A dynamic extensometer with a 25 mm gauge length was attached to the specimen to record the strain evolution during the testing. The data acquisition rate for both the applied force and obtained strain was 10 and 500 Hz for strain rates of 0.001 and 0.1 s−1, respectively. Temperature monitoring was not done, however the total temperature rise at the higher strain rate was <50 °C as determined by touching the freshly fractured samples. Full-field strain maps were acquired during the tests using a commercial Aramis v6.3 3D (GOM GmbH, Braunschweig, Germany) high speed optical strain mapping system based on digital image correlation. For this, a black and white ink pattern was spray painted on the gauge surface of the round specimen and on both the surface and thickness planes for the flat specimen. DIC strain maps were acquired from a 30 mm long central section of the gauge length at a rate of 1 frame per second (fps) during straining at 0.001 s−1 and 300 fps at a strain rate of 0.1 s−1. After testing, the fracture surface area, Af, was measured using a stereomicroscope. The fracture strain, εf, was calculated using the following Equation based on the constant volume assumption.
ε f = ln ( A 0 A f )

3. Results

Figure 1 shows an optical micrograph of the as-quenched microstructure after Klemm colour etching. With this etch, the color variations are related to the crystallographic orientation of the austenite grains. The material is fully austenitic with a coarse recrystallized grain size of 21 μm. A few grain boundaries show evidence of some residual cementite particles that possibly reformed during the quenching step. Twinning is observed in the majority of grains; annealing twins are marked with yellow arrows and deformation twins by red arrows in Figure 1. The presence of a low density of deformation twins after metallographic polishing is not unusual in such a coarse-grained matrix.
More details of the microstructure can be seen in the TEM bright field images taken before straining (Figure 2a) and after fracture (Figure 2b). Figure 2a shows a typical region of the as-quenched alloy with a low dislocation density and no twinning. Some coarse dislocation cells that were probably formed during hot rolling can be seen. The circular voids are due to fine cementite particles (diameter ~75 nm) that were preferentially etched during electropolishing. Cementite particles can form very quickly during quenching of high carbon TWIP alloys, especially near the center of thick sections where the quenching rate is low. No evidence of finer vanadium precipitates was observed although a few coarse VN particles that were not dissolved by the solution treatment were detected. The thin foil in Figure 2b was prepared from a region just behind the fracture surface (ε > 0.4) and it shows a microstructure that is dominated by a high density of the deformation-induced twins that are the main strengthening mechanism in this alloy. Multiple secant twinning systems have been activated (see dotted lines) in the grain to the right of the austenite triple junction marked by the arrow.
Tensile stress-strain curves were plotted for all test conditions as shown in Figure 3a. Each of the four trials was doubled; however, the results were extremely repeatable so only a single dataset is shown for each condition. It can be seen that the mechanical properties of the TWIP alloy are outstanding, even in such a coarse-grained condition without the benefit of precipitation strengthening. For example, the round section sample strained at 0.001 s−1 presents a maximum tensile strength of 1133 MPa with an elongation to fracture of more than 67%. The strain hardening behavior does not appear to be specimen geometry dependent at either strain rate, although the round tensile bars have consistently greater total elongation to fracture. It is also interesting to note that the alloy shows discontinuous (jerky) flow which implies that DSA occurs in all four test conditions (Figure 3a).
At the lower strain rate of 0.001 s−1, Type A PLC bands are observed for both specimen geometries. The flow curves show periodic sharp increases in the load followed by an equally sharp decrease to a level higher than the previous step. The flow stress between these load spikes is not constant but smoothly increases and the spacing between spikes increases monotonically with strain. This behavior is consistent with reports on similar alloys [7,23,28,29]. The critical strains εc at which PLC initiates do not appear to be geometry dependent, i.e., 2.7% for the flat specimen and 2.8% for the round specimen as indicated by the grey and black arrows in the lower inset in Figure 3a.
In contrast, at the higher strain rate (0.1 s−1) the PLC behavior is quite clearly geometry dependent. For the flat specimen, Type C PLC bands appear after a critical strain of 4.8%. Here the load periodically drops below the flow curve (see the lower inset in Figure 3a). At strains above ~30% mixed Type C + A behavior is observed in the flat sample. The round specimen strained at 0.1 s−1 does not present any signs of discontinuous flow at all until a critical strain of 33.2% after which peaks typical of Type A PLC bands appear (see the upper inset in Figure 3a).
In order to study the strain hardening and fracture behavior in more detail, each of the flow curves in Figure 3a was fitted with a 6th order polynomial function in the range 4% strain to failure. Figure 3b is a composite plot showing the true stress v true strain data, the instantaneous strain hardening rate (dσ/dε) and the strain rate sensitivity parameter, m, calculated using Equation (2) below.
m = ln ( σ 2 σ 1 ) ln ( ε ˙ 2 ε ˙ 1 )
The strain hardening rate and the strain rate sensitivity were both derived from the fitted polynomials hence they are smooth functions. Several observations can be made from Figure 3b:
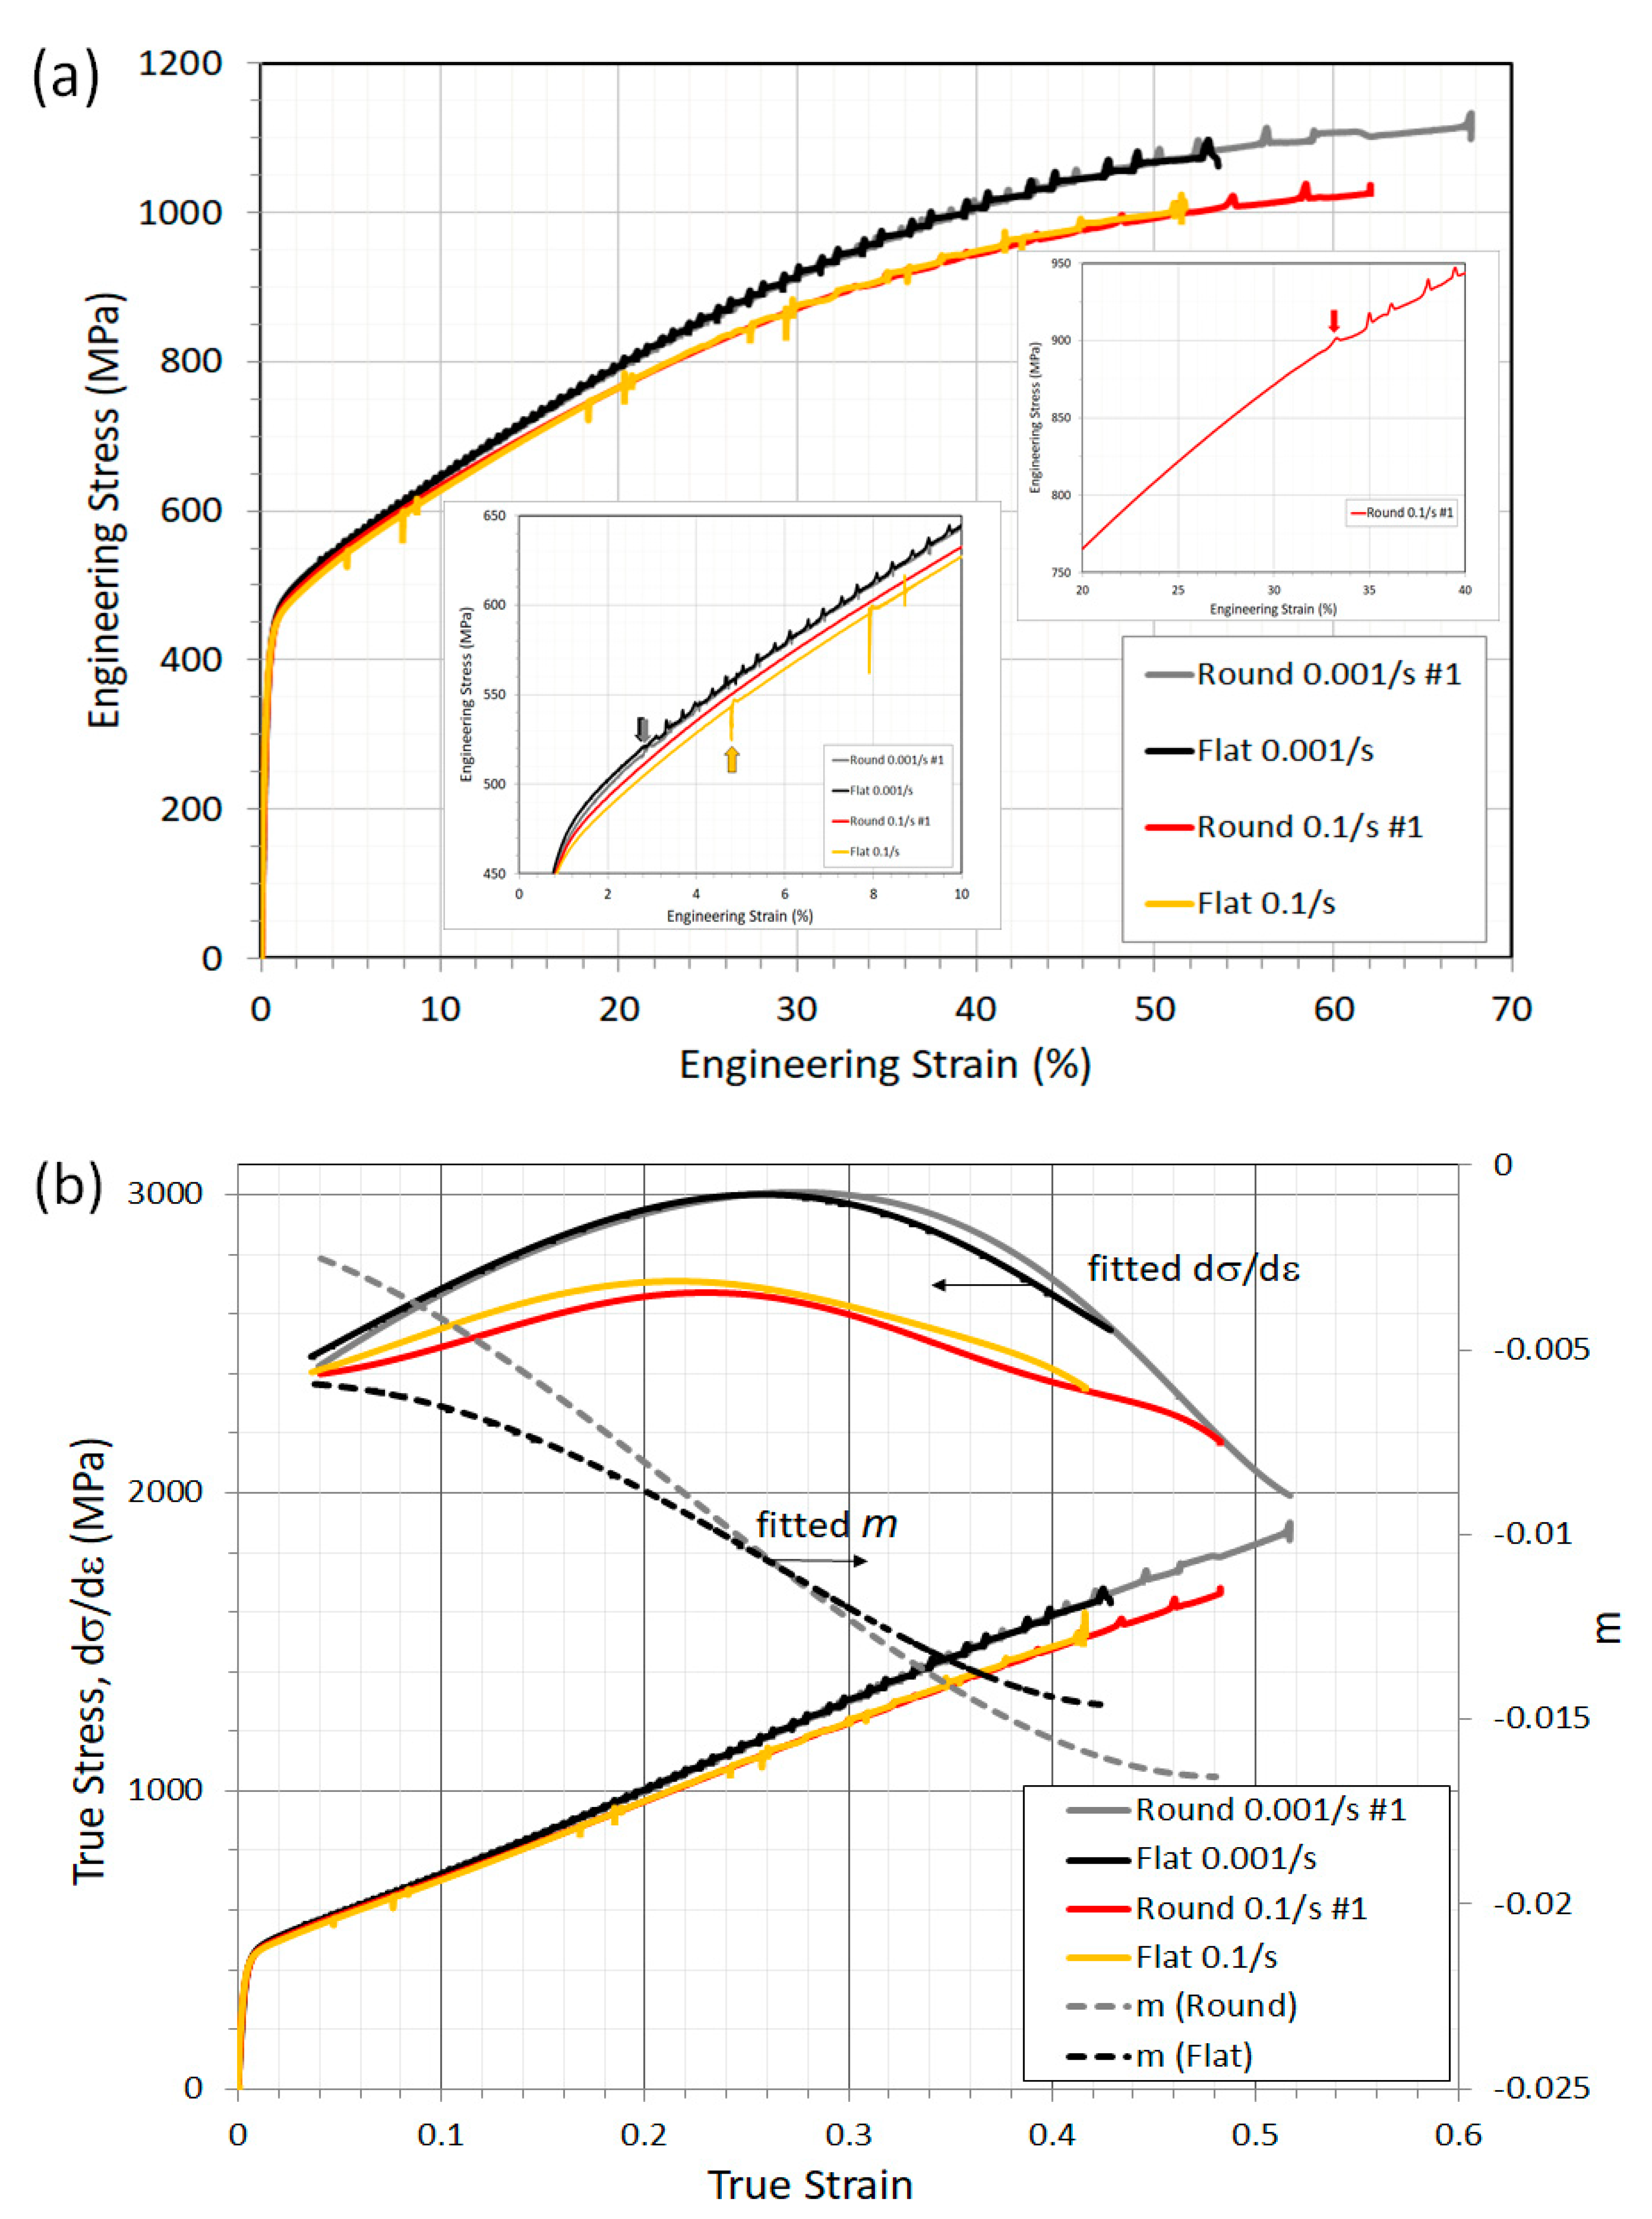
  • All of the specimens fracture before the Considère criterion (dσ/dεσ) is met, although the behavior of the round samples is closer to ideal than the flat specimens in this respect.
  • The strain hardening behavior is independent of the specimen geometry at both high and low strain rates.
  • Both geometries have similar overall negative strain rate sensitivities with values of m around −0.015 at fracture.
  • In all cases, premature fracture appears to be correlated with a PLC load spike.
Some aspects of the PLC band evolution in the four samples can be deduced from the total strain maps shown in Figure 4 and Figure 5. These sequential images were acquired just after the critical strain εc was reached. For the round specimens (Figure 4) the bands are of Type A at both strain rates, however the critical strain for nucleation is quite different (2.8% vs. 33.2%). In Figure 4a (0.001 s−1), the band nucleates at the top of the image and propagates in a downward direction whereas in Figure 4b (0.1 s−1), the band propagates in the opposite sense. The flat specimen strained at 0.001 s−1 (Figure 5a) shows mobile Type A bands that are very similar to the round sample tested at the same strain rate. However, increasing the strain rate to 0.1 s−1 shifts the appearance of Type A bands to higher strains (>~30%) and introduces multiple Type C bands with no obvious spatio-temporal correlation at lower strains (Figure 5b).
The tensile strain distribution along the loading direction was determined from line scans taken parallel to the gauge length in the center of the surface plane of the flat specimens and round specimens. Line scans from the final steps of the tensile tests just before fracture are shown in Figure 6 and Figure 7. The macroscopic strain for each line scan is given in parentheses next to the time stamp. The last time step in each plot is the one directly prior to fracture as recorded in DIC snapshots. We define the maximum PLC band strain in two ways; when localized necking is present, it is the incremental strain carried by the PLC band corresponding to the maximum tensile load, otherwise it is the highest incremental strain observed in the last PLC band prior to fracture. Localized necking can be detected by inspection of the DIC image sequences prior to fracture and from the line scans in Figure 6 and Figure 7. When necking commences, any PLC band activity outside the neck region stops, probably because of the associated drop in load in these regions. For a “pure” neck the axial strain profile remains constant and the amplitude increases until fracture occurs. In a “mixed” neck the peak strain increases and shifts at the same time, presumably under the influence of a mobile PLC band inside the neck region. If the peak strain shifts but there is no change in amplitude then we assume that no necking occurs before fracture.
The fracture behavior is quite different between the flat and round specimens. For the round specimen strained at 0.001s−1 (Figure 6a) a Type A PLC band has progressed rapidly from right to left at t = 1403 s. For some reason, the progression of the band front is greatly impeded after this point although it does continue to move slowly to the left. The maximum load occurs at t = 1407 s. After this point, a neck region appears behind the band front leading to rapid fracture. This is a good example of mixed (PLC + necking) fracture behavior. When the strain rate is increased to 0.1 s−1 (Figure 6b) the DIC images show a very clear neck formation. The last Type A PLC band moves very slowly to the left at t = 8.566 s and a neck commences from t = 8.650 s onwards. Note that fracture occurs outside the section length on the left side in Figure 6b so it is difficult to say whether the band continues to move after the neck starts. The DIC images suggest not, so this is closer to a “pure” necking fracture. Turning to the flat samples, at a strain rate of 0.001 s−1 necking is confined to a short region ~9 mm in length at the right of the DIC section (Figure 7a). From the DIC images, the PLC band at the start of necking is an immobilized Type A band. The constant strain profile shape confirms that this is a “pure” necking fracture. Interestingly, at a high strain rate of 0.1 s−1, the flat sample shows a completely different behavior. From the DIC data, an immobile Type C PLC region is present at the left side of the section and a mobile PLC band (presumably Type A) moves from left to right towards it. Fracture occurs when the two bands meet. We interpret this as a PLC dominated fracture. A summary of the PLC and fracture data can be seen in Table 1.

4. Discussion

All the specimens tested here showed ductile failure with essentially no diffuse necking and very limited or no post-uniform elongation in uniaxial tension. Abrupt fracture occurred before the Considère condition was met, with flat sections systematically failing before round sections at both low and high strain rates, despite showing nearly identical strain hardening and NSRS behavior (Figure 3b and Table 1). Note that, unlike [9], no evidence of side or edge cracking was observed in flat samples. From Table 1 it can be seen that both the fracture strain and the fracture stress were lower in flat samples. In fact, these experiments suggest that changing the sample geometry appears to have had a larger influence on the final fracture behavior than changing the strain rate. Very little data has been published on the effect of TWIP steel sample geometry on fracture. Hwang [8] showed that changing the diameter and gauge length of cylindrical tensile samples had no effect on the PUE/fracture behavior when the length to diameter ratio was held constant and Zavattieri and co-workers [23] found that tapering the edges of flat samples did not modify the nucleation or propagation of Type A PLC bands.
The DIC strain maps in Figure 6 and Figure 7 clearly indicate that in FeMnC TWIP alloys there is a complex interaction between PLC bands, necking and final fracture, which is geometry dependent. The round samples show a mixed behavior with localized necks containing mobile Type A bands at low strain rates and (probably) fixed Type A bands at high strain rates. In flat sections, the fracture region appears to be constrained and is more clearly dominated by “pure” necking at low strain rates. At 0.1 s−1, the PLC band behavior is completely different in flat sections (Type C + Type A) and no local necking is observed at all, with fracture occurring on a moving PLC band.
The fact that DSA and in particular PLC bands can reduce post-uniform elongation and influence fracture has been well established in AlMg alloys [13,17]. Similar claims have been made for FeMnC TWIP in the past (e.g., [2]) but usually by analogy rather than by experiment. One important point in [17] is that Zhemchuzhnikova and co-workers found that the fracture behavior did not depend on the type of PLC bands (A, B or C) observed. In their experiments, the onset of necking occurred at the Considère criterion and coincided with the immobilization of PLC bands. Some data exists in the literature on factors that modify the PLC behavior of AlMgMn (AA5182) alloys. For example, Zdunek and co-workers [24] tested round, square and rectangular section specimens and showed that PLC intensity increases with Sv at room temperature. Abbidi et al. [25] pointed out that simply polishing the AA5182 samples strongly affects εc, causes the PLC band propagation speed to double and reduces the domain in which PLC is apparent.
It should be pointed out that the “classical” DSA observed in ferrite at high temperatures and the DSA in TWIP steels at room temperature have different characteristics [18,19,22,30] which have been variously ascribed to dislocation pinning by C-Mn pairs and/or interactions between DSA/NSRS and twinning kinetics. That discussion is still unresolved and beyond the scope of this article. In a recent communication, Yang and co-workers [7] compared the fracture behavior of FeMnC and FeMnSiAl stable austenitic TWIP alloys with similar twinning kinetics. As expected, the absence of interstitials led to no plastic instabilities being observed in FeMnSiAl and it fractured by necking after the Considère limit. The FeMnC samples showed Type A serrations and fractured abruptly without necking well before the Considère criterion was reached. It is therefore reasonable to conclude that twinning alone does not much influence the fracture mode and that the presence of DSA is a necessary condition for premature shear fracture in FeMnC TWIP steels.
In this paper, we make the important point that the geometry-dependent plastic instabilities associated with DSA have no influence on the average plastic flow behavior of the studied FeMnC TWIP alloy. That is to say, the mean flow stress, the mean strain hardening rate and the mean strain rate sensitivity parameters are all independent of the presence or not of PLC bands, the type of bands and the critical strain for band formation. The latter all vary with specimen geometry and/or strain rate. This probably explains why attempts to determine activation energies for DSA based on measurements of εc give such widely varying results for TWIP alloys [3,19]. Plastic instabilities do play an important role in necking and final fracture but there is no clear correlation between macroscopic properties such as the fracture stress/strain and PLC band parameters such as εc, the maximum band strain or the band propagation behavior (Table 1). In the author’s opinion, the key accessible material parameters to study in more detail in order to better understand and predict premature fracture in FeMnC TWIP are the strain rate sensitivity, m, and the evolution of the twinned volume fraction with strain and strain rate.

5. Conclusions

In summary, we studied the effect of specimen geometry and strain rate on the tensile properties and the shear fracture behavior of a FeMnC TWIP steel using high speed digital image correlation. The results show that the mean flow stress, the mean strain hardening rate and the mean strain rate sensitivity parameters are all independent of the specimen geometry and are uncorrelated with the presence or not of Portevin-Le Chatelier (PLC) bands, the type of PLC bands present or the critical strain for band formation. However, fracture strains and stresses and the PLC behavior are highly geometry and/or strain rate dependent. Dynamic strain aging (DSA) and in particular the presence of PLC instabilities appears to play an important but as yet unclear role in promoting premature necking and final fracture. Again, there is no clear correlation between macroscopic properties such as the fracture stress/strain and measurable PLC band parameters such as the critical strain for band formation, the maximum band strain or the band propagation behavior.

Author Contributions

Conceptualization, C.S. and J.K.; methodology, J.K., L.S., J.L. and B.S.-A.; formal analysis, J.K. and C.S.; investigation, L.S., J.L. and B.S.-A.; writing—original draft preparation, J.K. and C.S.; writing—review and editing, C.S. All authors have read and agreed to the published version of the manuscript.

Funding

This research was funded by the Canadian Office of Energy Research and Development (OERD).

Acknowledgments

The authors wish to thank S. Allain for helpful discussions and are grateful to Renata Zavadil for her expertise in metallography.

Conflicts of Interest

The authors declare no conflict of interest.

References

  1. Bouaziz, O.; Allain, S.; Scott, C.P.; Cugy, P.; Barbier, D. High manganese austenitic twinning induced plasticity steels: A review of the microstructure properties relationships. Curr. Opin. Solid State Mater. Sci. 2011, 15, 141–168. [Google Scholar] [CrossRef]
  2. DeCooman, B.C.; Kwon, O.; Chin, K.G. State of the knowledge on TWIP steel. Mater. Sci. Technol. 2012, 28, 513–527. [Google Scholar] [CrossRef]
  3. Dastur, Y.N.; Leslie, W.C. Mechanism of work hardening in Hadfield manganese steel. Met. Trans. A 1981, 12, 749–759. [Google Scholar] [CrossRef]
  4. Grassel, O.; Kruger, L.; Frommeyer, G.; Meyer, L.W. High strength Fe-Mn-(Al,Si) TRIP/TWIP steels development—properties—application. Int. J. Plast. 2000, 16, 1391–1409. [Google Scholar] [CrossRef]
  5. Luo, Z.C.; Huang, M.X. Revisit the role of deformation twins on the work-hardening behavior of twinning-induced plasticity steels. Scr. Mater. 2018, 142, 28–31. [Google Scholar] [CrossRef]
  6. Lorthios, J.; Maziere, M.; Lemoine, X.; Cugy, P.; Besson, J.; Gourges-Lorenzon, A.-F. Fracture behavior of a Fe-22Mn-0.6C-0.2V austenitic TWIP steel. Int. J. Mech. Sci. 2015, 101–102, 99–113. [Google Scholar] [CrossRef]
  7. Yang, H.K.; Tian, Y.Z.; Zhang, Z.J.; Yang, C.L.; Zhang, P.; Zhang, Z.F. Tensile fracture modes in Fe-22Mn-0.6C and Fe-30Mn-3Si-3Al twinning-induced plasticity (TWIP) steels. Met. Mater. Trans. A 2017, 48A, 4458–4462. [Google Scholar] [CrossRef]
  8. Hwang, J.-K. Revealing the small post-necking elongation in twinning-induced plasticity steels. J. Mater. Sci. 2020, 55, 8285–8302. [Google Scholar] [CrossRef]
  9. Yu, H.Y.; Lee, S.M.; Nam, J.H.; Lee, S.J.; Fabregue, D.; Park, M.H.; Tsuji, N.; Lee, Y.K. Post-uniform elongation and tensile fracture mechanisms of Fe–18Mn–0.6C–xAl twinning-induced plasticity steels. Acta Mater. 2017, 131, 435–444. [Google Scholar] [CrossRef]
  10. Chung, K.; Ahn, K.; Yoo, D.-H.; Chung, K.-H.; Seo, M.-H.; Park, S.-H. Formability of TWIP (twinning induced plasticity) automotive steels. Int. J. Plast. 2011, 27, 52–81. [Google Scholar] [CrossRef]
  11. Hasegawa, K.; Kawamura, K.; Urabe, T.; Hosoya, Y. Effects of microstructure on stretch-flange-formability of 980 MPa grade cold-rolled ultra high strength steel sheets. ISIJ Int. 2004, 44, 603–609. [Google Scholar] [CrossRef]
  12. McCormick, P.G. The Portevin-Le Chatelier effect in an Al-Mg-Si alloy. Acta Met. 1971, 19, 463–471. [Google Scholar] [CrossRef]
  13. Kang, J.; Wilkinson, D.S.; Embury, J.D.; Jain, M.; Beaudoin, A.J. Effect of type-B Portevin-Le Chatelier bands on the onset of necking in uniaxial tension of strip cast AA5754 sheets. Scr. Mater. 2005, 53, 499–503. [Google Scholar] [CrossRef]
  14. Kim, K.C.; Kim, J.T.; Suk, J.I.; Sung, U.H.; Kwon, H.K. Influences of the dynamic strain aging on the J-R fracture characteristics of the ferritic steels for reactor coolant piping system. Nucl. Eng. Des. 2004, 228, 151–159. [Google Scholar] [CrossRef] [Green Version]
  15. Wang, H.; Berdin, C.; Maziere, M.; Forest, S.; Prioul, C.; Parrot, A.; Le-Delliou, P. Portevin-Le Chatelier (PLC) instabilities and slant fracture in C-Mn steel round specimens. Scr. Mater. 2011, 64, 430–433. [Google Scholar] [CrossRef]
  16. Renard, K.; Ryelandt, S.; Jacques, P.J. Characterisation of the Portevin-Le Chatelier effect affecting an austenitic TWIP steel based on digital image correlation. Mater. Sci. Eng. A 2010, 527, 2969–2977. [Google Scholar] [CrossRef]
  17. Zhemchuznikova, D.; Lebyodkin, M.; Yuzbekova, D.; Lebedkina, T.; Mogucheva, A.; Kaibyshev, R. Interrelation between the Portevin Le-Chatelier effect and necking in AlMg alloys. Int. J. Plast. 2018, 110, 95–109. [Google Scholar] [CrossRef] [Green Version]
  18. Allain, S.; Cugy, P.; Scott, C.; Chateau, J.-P.; Rusinek, A.; Deschamps, A. Influence of plastic instabilities on the mechanical properties of a high manganese austenitic FeMnC steel. Int. J. Mater. Res. 2008, 99, 734–738. [Google Scholar] [CrossRef]
  19. Lebedkina, T.A.; Lebyodkin, M.A.; Chateau, J.-P.; Jacques, A.; Allain, S. On the mechanism of unstable plastic flow in an austenitic FeMnC TWIP steel. Mater. Sci. Eng. A 2009, 519, 147–154. [Google Scholar] [CrossRef]
  20. Koyama, M.; Sawaguchi, T.; Tsuzaki, K. Overview of dynamic strain aging and associated phenomena in Fe-Mn-C austenitic steels. ISIJ Int. 2018, 58, 1383–1395. [Google Scholar] [CrossRef] [Green Version]
  21. Kim, J.G.; Hong, S.; Anjabin, N.; Park, B.H.; Kim, S.K.; Chin, K.-G.; Lee, S.; Kim, H.S. Dynamic strain aging of twinning-induced plasticity (TWIP) steel in tensile testing and deep drawing. Mater. Sci. Eng. A 2015, 633, 136–143. [Google Scholar] [CrossRef]
  22. Roth, A.; Lebedkina, T.A.; Lebyodkin, M.A. On the critical strain for the onset of plastic instability in an austenitic FeMnC steel. Mater. Sci. Eng. A 2012, 539, 280–284. [Google Scholar] [CrossRef]
  23. Zavattieri, P.D.; Savic, V.; Hector, L.G.; Fekete, J.R.; Tong, W.; Xuan, Y. Spatio-temporal characteristics of the Portevin–Le Châtelier effect in austenitic steel with twinning induced plasticity. Int. J. Plast. 2009, 25, 2298–2330. [Google Scholar] [CrossRef]
  24. Zdunek, J.; Spychalski, W.L.; Mizera, J.; Kurzydlowski, K.J. The influence of specimens geometry on the PLC effect in Al-Mg-Mn (5182) alloy. Mater. Charact. 2007, 58, 46–50. [Google Scholar] [CrossRef]
  25. Abbadi, M.; Hahner, P.; Zeghloul, A. On the characteristics of Portevin-Le Chatelier bands in aluminum alloy 5182 under stress-controlled and strain-controlled tensile testing. Mater. Sci. Eng. A 2002, 337, 194–201. [Google Scholar] [CrossRef]
  26. Abduluyahed, A.A.; Roiniatowski, K.; Kurzydlowski, K.J. The effect of test environment on tensile properties of 316L austenitic stainless steel Part I: Serrated flow characteristics. Scr. Met. Mater. 1995, 33, 1489–1492. [Google Scholar] [CrossRef]
  27. Cugy, P.; Guelton, N.; Scott, C.; Stouvenot, F.; Theyssier, M.-C. Method of Producing Austenitic Iron/Carbon/Manganese Steel Sheets Having Very High Strength and Elongation Characteristics and Excellent Homogeneity. Patent WO2006/056670, 1 June 2006. [Google Scholar]
  28. Kim, J.-K.; Chen, L.; Kim, H.-S.; Kim, S.-K.; Estrin, Y.; De Cooman, B.C. On the tensile behaviour of high-manganese twinning-induced plasticity steel. Met. Mater. Trans. A 2009, 40, 3147–3158. [Google Scholar] [CrossRef]
  29. Chen, L.; Kim, H.-S.; Kim, S.-K.; De Cooman, B.C. Localised deformation due to Portevin-LeChatelier Effect in 18Mn-0.6C TWIP austenitic steel. ISIJ Int. 2007, 47, 1804–1812. [Google Scholar] [CrossRef] [Green Version]
  30. Allain, S.; Bouaziz, O.; Lebedkina, T.A.; Lebyodkin, M.A. Relationship between relaxation mechanisms and strain ageing in an austenitic FeMnC steel. Scr. Mater. 2011, 64, 741–744. [Google Scholar] [CrossRef]
Figure 1. Optical micrograph showing Klemm color etching of the as-quenched Fe-0.9C-17Mn-0.5Si-0.3V-0.019N alloy.
Metals 10 01201 g001
Figure 2. TEM bright field micrographs of Fe-0.9C-17Mn-0.5Si-0.3V-0.019N in: (a) as-quenched condition; (b) after straining, from a region close to the fracture surface. Two secant deformation twinning systems are indicated by the dotted lines.
Metals 10 01201 g002
Figure 3. Tensile data from Fe-0.9C-17Mn-0.5Si-0.3V-0.019N flat and round specimens under low and high strain rates: (a) engineering stress-engineering strain curves; (b) true stress-true strain curves, fitted instantaneous strain hardening rates and strain rate sensitivities.
Metals 10 01201 g003
Figure 4. Digital image correction strain maps showing initiation of Type A Portevin-Le Chatelier (PLC) bands in round specimens: (a) strained at 0.001 s−1; (b) strained at 0.1 s−1.
Metals 10 01201 g004aMetals 10 01201 g004b
Figure 5. Digital image correction strain maps showing the initiation of different types of PLC bands in flat specimens: (a) Type A bands, strain rate of 0.001 s−1; (b) Type C bands, strain rate of 0.1 s−1.
Metals 10 01201 g005
Figure 6. Digital image correlation results from line scans along the tensile direction showing final steps to fracture in round specimens at strain rates of (a) 0.001 s−1; (b) 0.1 s−1. The macroscopic true strain is given in parentheses.
Metals 10 01201 g006
Figure 7. Digital image correlation results from line scans along the tensile direction showing final steps to fracture in flat specimens at strain rates of: (a) 0.001 s−1; (b) 0.1 s−1. The macroscopic true strain is given in parentheses.
Metals 10 01201 g007
Table 1. Summary of PLC and fracture data.
SamplePLC BandCritical Strain εcMax PLC Band StrainTrue Fracture Strain *True Fracture Stress, (MPa)
Round 0.001 s−1Type A2.8%4.3%0.591992
Round 0.1 s−1Type A33.2%4.7%0.712081
Flat 0.001 s−1Type A2.7%4.7%0.511810
Flat 0.1 s−1Type C + A4.8%6.6%0.501688
*—Calculated using Equation (1) from measurements of the projected fracture surface area.

