Abstract
Inconel 718 (IN718) is a nickel-based superalloy which is widely used in aerospace, oil, and gas industries due to its outstanding mechanical properties at high temperatures, corrosion, fatigue resistance, and excellent weldability. Selective laser melting (SLM), one of the most used powder-bed based methods, is being extensively used to fabricate functional IN718 components with high accuracy. The accuracy and the properties of the SLM fabricated IN718 parts highly depend on the process parameters employed during fabrication. Thus, depending on the desired properties, the process parameters for a given material need to be optimized for improving the overall reliability of the SLM devices. In this study, design of experiment (DOE) was used to evaluate the dimensional accuracy, composition, and hardness corresponding to the interaction between the SLM process parameters such as laser power (P), scan speed (v), and hatch spacing (h). Contour plots were generated by co-relating the determined values for each characteristic and the process parameters to improve the as-built characteristics of the fabricated IN718 parts and reduce the post-processing time. The outcome of this study shows a range of energy density values for the IN718 superalloy needed to attain optimal values for each of the analyzed characteristics. Finally, an optimal processing region for SLM IN718 fabrication was identified which is in accordance with the values for each characteristic mentioned in literature.
1. Introduction
Inconel 718 (IN718) is an age-hardenable nickel-based alloy that was developed in the 1960s by the International Nickel Company [1,2]. IN718, with an exceptional weldability property, is found to be indifferent to strain-age cracking. IN718 has the ability to maintain good chemical and mechanical properties at high temperatures, and the working temperature of IN718 is between −257 °C to 704 °C [3]. IN718 is also known for its corrosion-resistance properties, creep-resistance behavior, and high strength [4]. Thus, IN718 is termed as a “superalloy” [5]. IN718 is one of the most commonly used superalloys and accounts for about 35% of all superalloys produced in the 1980s [6]. Due to these properties of IN718 superalloys, they have applications in fields such as nuclear power plants, gas turbines, aircraft engines, and combustion chambers [2]. The high presence of Fe and Co makes IN718 economical to use, thus making it one of the most used alloys in the field of oil and gas [7]. IN718 is composed of chromium, molybdenum, aluminum, titanium, cobalt, niobium, and nickel, with nickel being the highest proportion. The commonly seen phases in IN718 are γ, γ’, γ”, δ, MC, and laves [8]. The major phase of IN718 is the gamma (γ) phase, as it is mainly comprised of Ni and forms an austenitic face-centered-cubic (FCC) matrix [9,10]. γ” and γ’ are the strengthening phases of IN718. The γ” phase is found to be comparatively higher than the γ’ phase; thus, it is the prevalent strengthening phase in IN718 [11]. The traditional techniques for the fabrication of IN718 include cast and wrought. Cast IN718 is found to be fundamentally stronger at higher temperatures due to the presence of coarse grains [9]; hence, it has applications in aircraft engines, turbines, and nozzles. Wrought IN718 has a relatively more homogenous, finer microstructure than cast IN718. Thus, wrought IN718 has better tensile and fatigue strength, rupture properties, and has applications in gas turbines and in aerospace industry parts that require high impact strength [9]. Cast IN718 specimens must be heat-treated at high temperatures to increase their homogenization and in turn improve their mechanical properties [12]. Therefore, heat treatment is required for IN718 manufactured using casting and powder metallurgy to obtain the desired properties. This heat treatment leads to oxidation and thus increases the brittleness of the IN718 specimens. Thus, to overcome these difficulties, additive manufacturing techniques like selective laser melting (SLM), selective laser sintering (SLS), electron beam melting (EBM), and direct energy deposition (DED) offer a viable solution as their processes allow us to tailor the microstructure based on our needs [13].
SLM is a layer-by-layer AM technique which uses a recoater/roller to deposit powder on the printing bed/substrate. A laser is then used to melt the powder and fuse them to form the designed part [14]. The printing bed/substrate goes down by a layer, and another layer of powder is then deposited. This process continues until the entire part is fabricated [15]. The SLM technique can be used to fabricate geometrically complex parts with high density (~100%) and thus eradicates the need for post-processing [16]. A few of the SLM process parameters such as laser power (LP), scan speed (SS), hatch spacing (HS), and layer thickness (LT) can be controlled and thus helps us to tailor the properties of the fabricated part as per our need [17].
Studying the microstructure of IN718 specimens fabricated using the SLM technique helps us understand the melting and re-melting processes and examine the defects associated with the process. In a study conducted by Amato et al. [18], it was seen that columnar microstructures are seen parallel to the build direction. Brenne et al. [19] studied the effect of high laser power on the microstructure of SLM fabricated IN718 and found columnar grains along the build direction with a high grain aspect ratio compared to the studies which used lower laser power. On the contrary, non-columnar grains were seen in a study conducted by Tucho et al. [20]. They concluded that this might have been due to differences in process parameters and boundary conditions compared to other studies [20]. Fine dendritic structures are commonly seen in as-built IN718 samples along with phases of laves between the dendritic areas [21,22,23]. Yi et al. [24] studied the effect of laser power and scan speed on the geometrical accuracy and noted that, as the scan speed decreased and laser power increased, there was an increase in the deviation of the part from the designed Computer-Aided design (CAD) model. In a similar study, conducted by Sadowski et al. [25], it was noted that the dimensional accuracy of parts decreased with an increase in laser power. If not chosen properly, the process parameters can cause defects like the “balling effect”, residual porosity, and warpage, which affect the dimensional accuracy of the parts [26]. Gong et al. [27] measured hardness along the build direction and established that the hardness values at the top surface were comparatively higher than that at the bottom surface and concluded that this was due to the presence of laves phases which are brittle in nature. Kozior et al. studied the effect of the printing direction on the surface texture of the 316L steel and found that surface roughness varies significantly with a change in the orientation of the fabrication [28]. Various hardness analyses, like Vickers and Rockwell tests, are usually conducted to obtain and evaluate the hardness of SLM fabricated components. A hardness of around 500 HV has been reported. Chlebus et al. [23] along with Amato et al. [18] and Wang et al. [17] stated an increase in the hardness values after heat treatment operations. Thus, optimizing these process parameters is an important step in controlling the microstructural and mechanical properties [14].
In this work, the Design of Experiments (DOE) methodology was used to construct an experiment that evaluated the CAD deviation, composition, and hardness of SLM fabricated IN718 against the three critical processing parameters: laser power, scanning speed, and hatch spacing.
2. Materials and Methods
2.1. Design of Experiments
Minitab v19 (Minitab Inc., State College, PA, USA) was used in order to establish the response surface methodology (RSM) technique. A Central Composite Design (CCD) [29,30] technique, which is part of the most widely used RSM technique (DOE method), was used in this study. The CCD technique establishes the standardized efficient parameters and their subsequent relationship by performing the least amount of required experiments. Statistically, CCD is an experimental method for the RSM to build a second-order design to get an optimized response. The energy density was calculated with the help of the following equation [31]:
where Ev (J/mm3) is energy input, P (W) is laser power, v (mm/s) is scanning speed, h (μm) is hatch distance, and t (μm) is layer thickness.
To simplify the experiment, layer thickness (t) was kept 40 μm, and the stripes scan strategy (direction of the laser movement) as shown in Figure 1 was used for all the test specimens. The ranges of defined process parameters are shown in Table 1. By using the set of defined ranges shown in Table 1, for every parameter suggested by the CCD approach, a total of 20 different combinations of LP, SS and HS were achieved with the help of Minitab v19 software (Minitab Inc., State College, PA, USA), as seen in Table 2. This was followed by the parts having dimensions of 5 mm × 5 mm × 6 mm being fabricated with the obtained 20 different process parameters. For each process parameters’ combination, 3 samples were fabricated (a total of 3 × 20 samples). In the next step, several analysis tests were conducted on the fabricated parts to achieve the required results (i.e., geometrical accuracy, required phase composition, and attainment of the desirable hardness values). The observed results were then integrated into a second-order polynomial model and the coefficients of regression were obtained in Minitab v19. Finally, 3D plots and corresponding 2D contours of different parameters were plotted, and then the required parameters were built and marked on each of the 2D contours where the actual CAD geometry, desired phase composition, hardness, and surface values are equivalent to those of the desired values. The effects of each parameter and the corresponding required geometrical CAD values, phase compositions, and the hardness results can be predicted by calculating the value of ζ for each of the analyzed characteristics in the following equation:
where ζ is the predicted response, a1–a10 are the constants, LP is laser power, SS is scan speed and HS is hatch spacing.
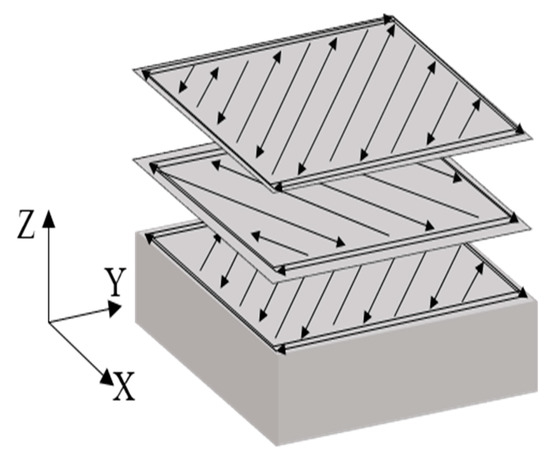
Figure 1.
Schematic depicting the stripes scan strategy used during the SLM process.

Table 1.
The range of effective process parameters.
Table 2.
The 20 suggested sets of process parameters were obtained from the RSM technique.
2.2. Powder Preparation and Fabrication
The IN718 samples were fabricated with the help of an EOS M290 SLM laser powder-bed fusion process printer (EOS GmbH, Electro Optical Systems, Krailling, Germany), which was equipped with a 400 W Ytterbium fiber laser and had a building volume of 250 mm × 250 mm × 325 mm. IN718 powder was obtained from EOS North America (Pflugerville, TX, USA), and the scanning electron microscope (SEM) micrograph of the fresh powder can be seen in Figure 2a. ImageJ [32], a license-free software was used to analyze the particle size and with the help of those results, and a histogram of the particle-size distribution was generated, as shown in Figure 2b. The analysis revealed that the powder had an average particle size of 12 microns. Energy-dispersive X-ray spectroscopy (EDS) analysis was performed on the fresh powder, and the composition of the IN718 powder is shown in Table 3. This powder was used to fabricate the test samples with a dimension of 5 mm × 5 mm × 6 mm.
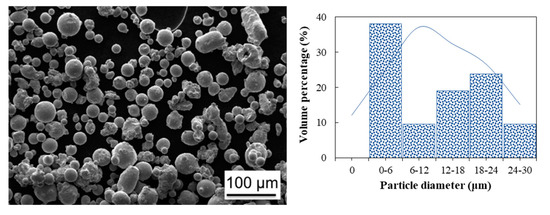
Figure 2.
(a) SEM micrograph of powder; (b) particle size distribution for commercial EOS IN718 powder.
Table 3.
The chemical composition of IN718 powder obtained from EOS.
2.3. Experimental Procedure
A FaroArm® Edge and Laser ScanArm (Faro, Lake Mary, FL, USA) coordinate measuring machine was used to scan the samples and obtain the data of co-ordinate points (point cloud) of the IN718 samples. These coordinates were then converted into a CAD model. Finally, the length, width, and height of each CAD model were measured at six different points using Polyworks Inspector software (Innovmetric, Novi, MI, USA) and their average values have been reported. A Vickers hardness test was conducted using a LECO LM 300 AT (LECO, St. Joseph, MI, USA) micro-hardness tester on each sample. The test was performed by applying a load of 500 g for 10 s and a minimum of four indentations were done in order to report the average number for each side. Finally, in order to perform compositional analysis, the samples were cut using a TECHCUT 5™ precision low-speed saw (Allied High-Tech Products, Inc., Rancho Dominguez, CA, USA). The samples were cut along the XY direction from the top surface, and the thickness of the cut samples was 2 mm. The compositional analysis was conducted using a Bruker D8 Advance X-ray diffractometer (XRD) (Bruker Corporation, Madison, WI, USA) for each fabricated sample. The voltage and the current of the X-ray source were maintained at 40 kV and 40 mA, while the x-ray source was Cu k-alpha, and measurements were made at room temperature with a wavelength of 1.5406 Å, step intervals of 0.04° in 2θ between 30° and 100°, and a locked coupled scan type with a scan speed of 1 s/step. The XRD results obtained from the Bruker D8 Advance X-ray diffractometer were interpreted using X’Pert HighScore Plus (Panalytical, Almelo, The Netherlands).
3. Results
3.1. Dimensional Analysis
The geometrical accuracy analysis was performed with the help of Coordinate Measuring Machine (CMM) measurements for all the 3 × 20 fabricated IN718 samples. The reason for performing dimensional analysis was to compare the effects of different process parameter combinations on the geometrical accuracy of the fabricated parts. This was conducted to establish a relationship between process parameters in order to determine an optimized set of parameter ranges for fabrication. The measured height values are shown in Table 4. Upon analyzing the results obtained in Table 4, the height of the samples differed as the scan speed varied, keeping laser power and hatch spacing constant. Considering a constant laser power of 285 W and a constant hatch spacing of 110 μm and varying the scan speed from 798.5 mm/s to 960 mm/s, it can be seen that the height of the as-built specimens decreased from the desired value of 6.007 mm to 5.972 mm. A similar trend is observed when the laser power and scan speed are kept constant at 256.5 W and 1056 mm/s, respectively, and the hatch spacing is increased from 99 μm to 121 μm, and the height of specimens increases by 51 μm from 5.971 mm to 6.022 mm. Finally, we see that the height values increase from 5.971 mm to 6.011 as the laser power is increased from 256.5 W to 313.5 W while maintaining the scan speed and hatch spacing constant at 1056 mm/s and 121 μm, respectively. In this study, the height of 8 out of the 20 combinations of process parameters exceeded the desired height (max height deviation of 22 μm), while 11 out of the 20 combinations of process parameters resulted in parts whose heights were less compared to that of the designed part (with a max height deviation of 29 μm).
Table 4.
Average measured values of length, width, and height for all samples compared to the designed CAD values of 5 mm, 5 mm, and 6 mm for length, width, and height, respectively.
The values obtained for height from Table 4 were then entered into Minitab, and a model was established. It was noted that the height of the alloy specimen was affected by the scan speed as it is inferred from the Pareto chart for height (Figure 3). The most accurate value for height resulted from the parameter with a laser power of 237 W, scan speed of 960 mm/s, and a hatch spacing value of 110 μm, which yielded a height of exactly 6 mm. From the response surface regression tool in Minitab, the regression equation was found as shown in the equation below:
Height = 8.31 − 0.00646 × LP − 0.00178 × SS − 0.0101 × HS + 0.000007 × LP2 + 0.000001 × SS2 + 0.000041 × HS2 + 0.000001 × LP × SS + 0.000027 × LP × HS − 0.000007 × SS × HS
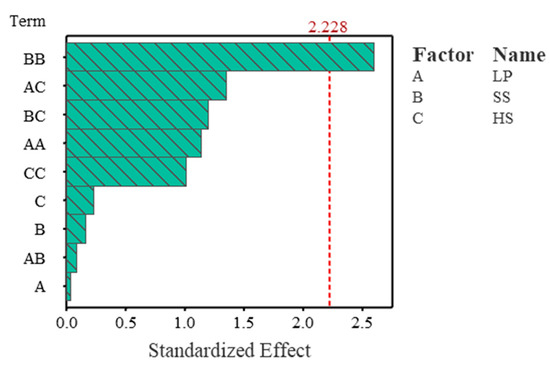
Figure 3.
A Pareto chart to compare the relative magnitude and the statistical significance of the main, square, and interaction of the laser processing parameters on the height of fabricated IN718 samples. The reference line on the chart (α ≤ 0.05) indicates the scan speed square effect on the height is significant.
In a Pareto chart, the effectiveness of the statistical significances of the main, square, and interaction of the laser processing parameters (LP, HS and SS) on the height of the samples are presented (Figure 3). This chart indicates that scan speed plays a significant role in determining the height of fabricated IN718 parts. The influence of laser processing parameters is further investigated by the contour plots shown in Figure 4.
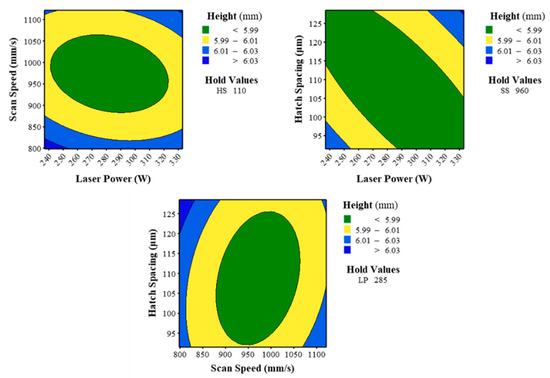
Figure 4.
Contour plots showing the effects of different laser processing parameters on the height of fabricated samples. The CAD file was designed with the height of 6 mm. A desired range of 6 ± 0.01 μm is presented as a yellow region in the contour plots. The regions in blue and green represent areas of height that are higher and lower than the designed CAD value of 6 mm, respectively.
Secondly, the measured width of the fabricated samples is shown in Table 4. By evaluating Table 4, we notice that the width of the samples decreases with an increase in the scan speed of the fabricated samples, while the laser power and hatch spacing is kept constant. Examining Table 4, we can see that the width of the as-built specimens decreases from 5.000 mm to 4.993 mm as the scan speed increased from 960.0 mm/s to 1121.5 mm/s, while the hatch spacing and laser power was maintained at 110 μm and 285.0 W. A similar trend is observed when the hatch spacing varies from 121 μm to 99 μm, and the width of the samples decreases from 5.001 mm to 4.997 mm while the laser power and scan speed are kept constant at 256.5 W and 864 mm/s. The same trend can be observed when the laser power increased from 237.1 W to 285.0 W, and the width of the samples increased from 4.987 to 5.000 at a scan speed of 960 mm/s and 110 μm. The width of 8 samples met the designed CAD value of 5.000 mm, while 10 samples resulted in values lesser than that of 5.000 mm, and 2 samples attained a width more than the designed value.
The measured width values from Table 4 were then processed using the response surface regression tool in Minitab in order to establish and analyze the relationship between the width of the fabricated samples and the process parameters. The below equation represents the regression of influencing parameters on the width of the samples.
Width = 4.679 − 0.00067 × LP + 0.000874 × SS + 0.00045 × HS − 0.000004 × LP2 − 0.000000 × SS2 − 0.000001 × HS2 + 0.000001 × LP × SS + 0.000016 × LP × HS − 0.000004 × SS × HS
In a Pareto chart, the effectiveness of the statistical significances of the main, square, and interaction of the laser processing parameters (LP, HS and SS) on the width of the samples are presented (Figure 5). This chart indicates that scan speed plays a significant role in determining the width of fabricated IN718 parts. Figure 6 shows contour plots of the measured width for all fabricated samples. As it is presented, the scan speed plays a major role in establishing the width of an SLM fabricated IN718 part. This trend is different from that observed in the relationship between the height and the process parameters.
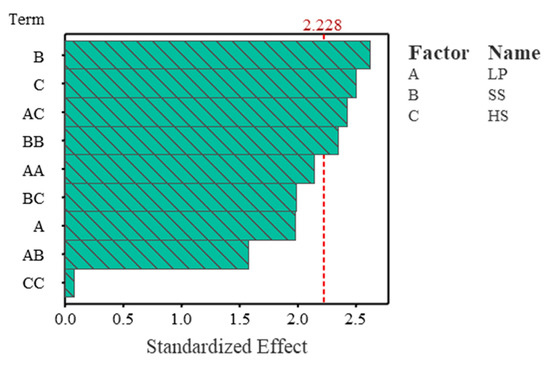
Figure 5.
Pareto chart to compare the relative magnitude and the statistical significance of the main, square, and interaction of the laser processing parameters on the width of fabricated IN718 samples. The reference line on the chart (α ≤ 0.05) indicates the scan speed effect on the width is significant.
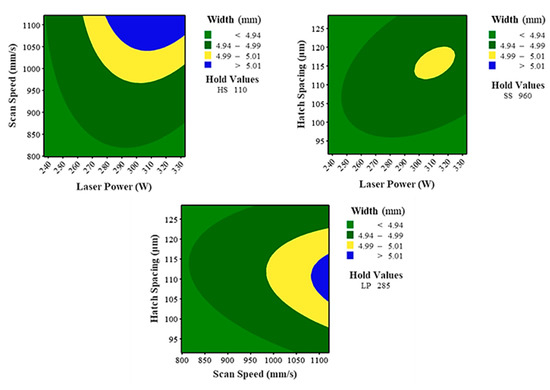
Figure 6.
Contour plots showing the effects of different laser processing parameters on the width of fabricated samples. The CAD file was designed with a width of 5 mm. A desired range of 5 ± 0.01 μm is presented as a yellow region in the contour plots. The regions in green represent areas of width which are lower than the designed CAD value of 5 mm, respectively.
The measured lengths of the as-fabricated IN718 specimens are as represented in Table 4. Examining Table 4, we observed that the length of the samples increased as the scan speed reduced with the laser power and hatch spacing kept constant. For example, it was noted that the length of the specimens increased from 4.992 mm to 5.000 mm when the scan speed decreased from 1121.5 mm/s to 960 mm/s, while the laser power and hatch spacing were kept constant at 285 W and 110 μm, respectively. A similar change in length (4.996 mm to 5.000 mm) was seen when the hatch spacing was reduced from 121 μm to 99 μm as the scan speed and laser power remained constant at 864 mm/s and 256.5 W, respectively. Lastly, the length of the samples decreased from 5.000 mm to 4.989 mm as the laser power decreased from 285 W to 237.1 W at a constant scan speed of 960 mm/s and constant hatch spacing at 110 μm. Of the 20 fabricated samples, 8 samples yielded a length of 5.000 mm, while 11 samples had a length between 4.969 mm to 4.999 mm, and one sample produced a length of 5.002 mm.
The regression of influencing parameters on the length of the samples is represented in the equation below. In a Pareto chart, the effectiveness of the statistical significance of the main, square, and interaction of the laser processing parameters (LP, HS and SS) on the length of the samples are presented (Figure 7). This chart indicates that scan speed plays a significant role in determining the length of fabricated IN718 parts.
Length = 4.655 − 0.00089 × LP + 0.000753 × SS + 0.00167 × HS − 0.000003 × LP2 − 0.000000 × SS2 − 0.000014 × HS2 + 0.000001 × LP × SS + 0.000013 × LP × HS − 0.000002 × SS × HS
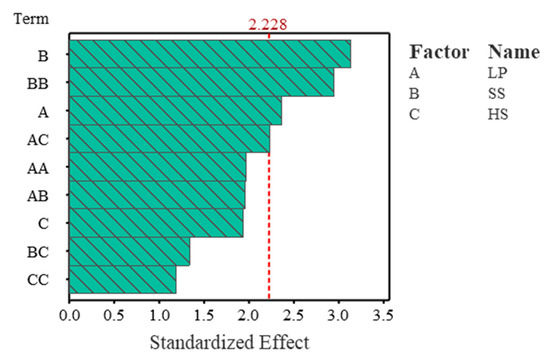
Figure 7.
A Pareto chart for a reduced model to compare the relative magnitude and the statistical significance of the square and interaction of laser processing parameters on the length of fabricated IN718 samples. The reference line on the chart (α ≤ 0.05) indicates the hatch space square effect on the length is significant.
From the contour plots in Figure 8, we can see that scan speed affects the length of an as-built part significantly, as determined by the response surface regression tool in Minitab.
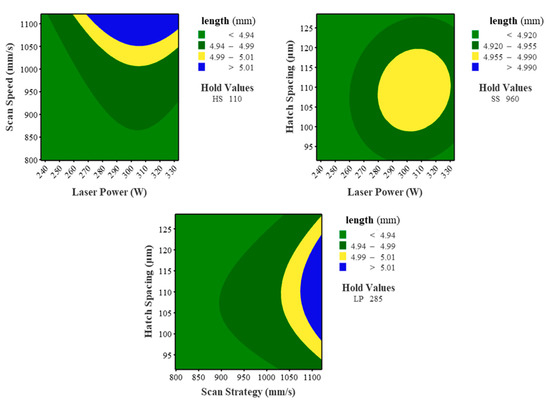
Figure 8.
Contour plots showing the effects of different laser processing parameters on the length of fabricated samples. The CAD file was designed with a length of 5 mm. A desired range of 5 ± 0.01 μm is presented as a yellow region in the contour plots. The regions in green represent areas of length which are lower than the designed CAD value of 5 mm, respectively.
3.2. X-ray Diffraction (XRD) Analysis
The compositional analysis was carried out using an X-ray Diffractometer. The different phases of IN718 such as γ, γ’, and γ” were observed in all 20 fabricated samples. As expected, the γ phase was found to be the major phase in all the fabricated samples (60–75%), and the rest were comprised mostly of γ’ and γ” phases (the strengthening phases of IN718). The δ phase (the thermally stable phase of IN718) was present in traces and had a composition similar to that of the γ” phase. The γ” phase is one of the secondary strengthening phases of IN718 composed of Ni3Nb, and thus its plays an important role in the mechanical properties of the fabricated sample. From Table 5, it is clear that the γ” phase increase with an increase in the energy density of the samples, and it is observed that as the laser power increases from 237.1 W to 285 W, the percentage of γ” phase increases from 13.4% to 14.14% when the scan speed and hatch spacing are kept constant at 960 mm/s and 110 μm, respectively. It is noticed that the γ” phase decreases by 5.39% when the hatch spacing varies from 99 μm to 121 μm at constant scan speed (864 mm/s) and laser power (256.5 W) values. The same trend of decrease in the percentage of the γ” phase (17.68% to 12.92%) can be seen for constant laser power (313.5 W) and constant hatch spacing (121 μm) values with increasing scan speed values (864 mm/s to 1056 mm/s).
Table 5.
Values of constituent phases.
The regression of influencing parameters on the percentage of γ” present in the samples is represented in the equation below.
γ” = 193.6 + 0.306 × LP − 0.1669 × SS − 2.425 × HS − 0.000094 × LP2 + 0.000051 × SS2 + 0.00641 × HS2 − 0.000235 × LP × SS − 0.00025 × LP × HS + 0.001097 × SS × HS
In a Pareto chart, the effectiveness of the statistical significances of the main, square, and interaction of the laser processing parameters (LP, HS and SS) on the percentage of γ” present in the samples are presented (Figure 9). This chart indicates that the interaction between scan speeds plays a significant role in determining the percentage of γ” in the fabricated IN718 parts.
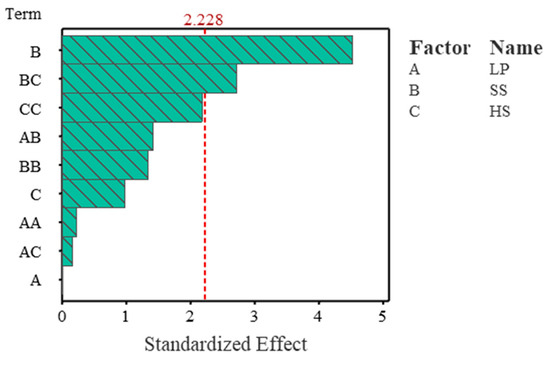
Figure 9.
A Pareto chart for a reduced model to compare the relative magnitude and the statistical significance of the square and interaction of the laser processing parameters on the γ” of fabricated IN718 samples. The reference line on the chart (α ≤ 0.05) indicates the interaction between the scan speed and hatch spacing effect on the γ” is significant.
From the contour plots in Figure 10 and the response surface regression tool, it is evident that the combination of scan speed and hatch spacing plays an important role in the development of γ” phases.
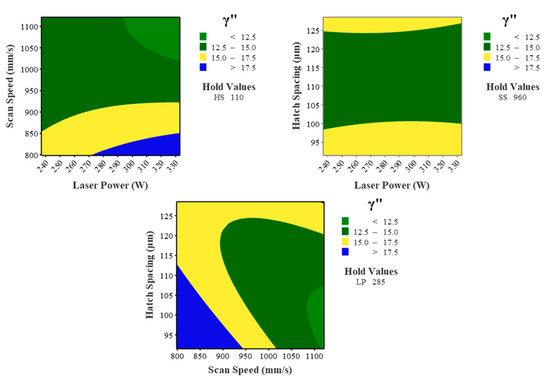
Figure 10.
Contour plots showing the effects of different laser processing parameters on the percentage of the γ” phase of different samples; the desired ranges for the γ” phase are presented in yellow areas. The regions in green and blue represent areas of γ” which are lower and higher than the desired value, respectively.
3.3. Hardness Analysis
Vickers hardness values were determined on the top surfaces for all of the 20 as-built parts. The Vickers hardness values, and the resultant contour plots are represented in Table 6 and Figure 12, respectively. Analyzing Table 6, we can see that the hatch spacing plays a significant role in determining the hardness of the samples. It is evident that as the hatch spacing increases (110 to 128.5 μm), the hardness of the samples decreases from 271.733 HV to 260.28 HV as the scan speed (960 mm/s) and laser power (285 W) are kept constant. The same trend can be seen as the scan speed increases from 798.5 mm/s to 960 mm/s; the hardness values decrease by 13.867 HV from 285.600 HV to 271.733 HV as the laser power and hatch spacing are constant at 285 W and 110 μm, respectively. The Vickers hardness values are found to increase from 260.702 HV to 271.733 HV as the laser power increased from 237.1 W to 285 W while the scan speed and hatch spacing were kept constant at 960 mm/s and 110 μm. The equation below represents the regression of influencing parameters on the hardness of the fabricated samples.
Hardness = 125 + 3.78 × LP − 0.231 × SS − 4.32 × HS − 0.00210 × LP2 + 0.000179 × SS2 + 0.0118 × HS2 − 0.001763 × LP × SS − 0.00648 × LP × HS + 0.00299 × SS × HS
Table 6.
Average values of hardness on the top surfaces of all samples.
In a Pareto chart, the effectiveness of the statistical significances of the main, square, and interaction of the laser processing parameters (LP, HS and SS) on the hardness of the samples are presented (Figure 11). This chart indicates that the hatch spacing plays a significant role in determining the hardness of the fabricated IN718 parts.
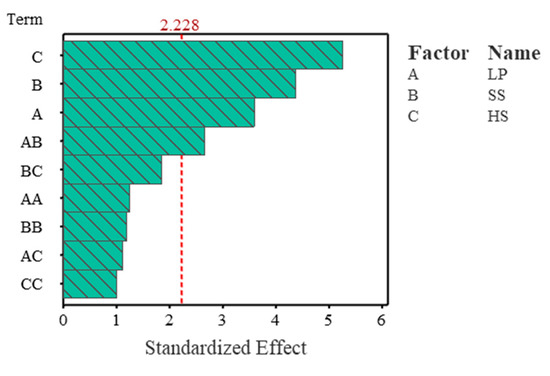
Figure 11.
A Pareto chart for a reduced model to compare the relative magnitude and the statistical significance of the square and interaction of the laser processing parameters on the width of fabricated IN718 samples. The reference line on the chart (α ≤ 0.05) indicates the interaction between the laser power and hatch spacing effect on the hardness is significant.
From the contour plots in Figure 12 and the response surface regression tool, it is evident that the hatch spacing affects the hardness of the IN718 parts.
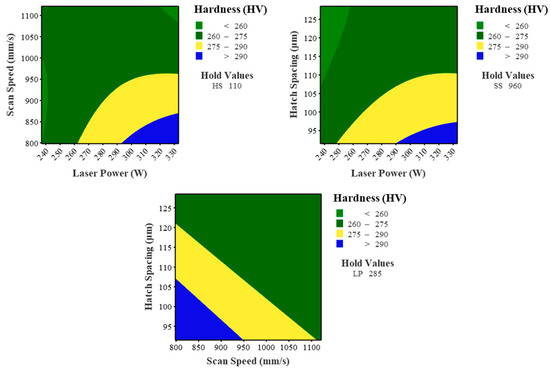
Figure 12.
Contour plots showing the effects of different laser processing parameters on the hardness of different samples; the desired ranges for hardness are presented in yellow areas (a higher value of hardness). The regions in green represent areas of hardness which are lower than the desired value.
Upon processing the found values of height, width, length, γ″ and the hardness in Minitab, it was found that for a small combination set of process parameters, the values for all the aforementioned factors can be obtained as per the desired configurations. The region marked in orange in Figure 13 represents the optimal processing region of the laser process parameters.
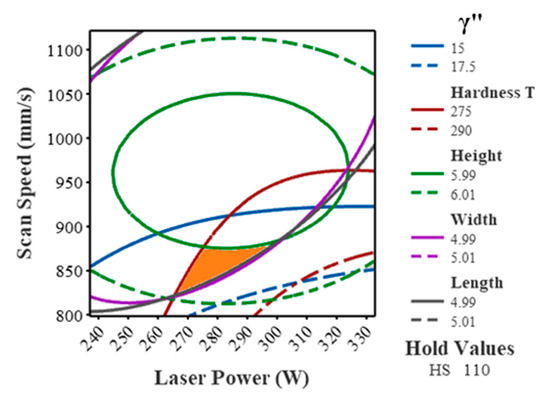
Figure 13.
Contour plot showing the optimal processing region of the laser process parameters presented in orange.
4. Discussion
The interrelations among the various process parameters and geometrical dimensions like height and length were obtained. Evaluating the height values in Table 4, it is evident that as the energy density increases at lower scan speeds and constant values of laser power and hatch spacing, the height of the samples increases. For example, when the laser power and hatch spacing were kept constant at 256.5 W and 121 μm, respectively, and the scan speed changed from 864 mm/s (Ev = 61.3 J/mm3) to 1056 mm/s (Ev = 50.2 J/mm3), the height of the sample decreased from 6.011 mm to 5.971 mm. The same trend can be seen when the laser power and hatch spacing were maintained at 313.5 W and 99 μm, respectively; with the scan speed varying from 1056 mm/s (Ev = 75 J/mm3) to 864 mm/s (Ev = 91.6 J/mm3), the height increased from 5.993 mm to 6.005 mm. From the Pareto chart in Figure 3, it is seen that the scan speed is the dominant factor in determining the height of the fabricated IN718 samples. This variation in height of the as-built samples can be associated with the applied energy density of the samples. Higher energy density leads to deeper melt pools, which lead to epitaxial solidification and bonding. Epitaxial bonding increases the grain growth and formation of longer grain structures like columnar and dendritic grains which alter the height of the fabricated samples, whereas lower energy density values have shallower melt pools and equiaxed grains which lead to lower height values [29].
Similarly, from Table 4, it can be seen that the lengths of most of the fabricated IN718 specimens increase with an increase in the energy density impacted by the scan speed. For instance, it can be seen that as the energy density changes from Ev = 57.8 J/mm3 (SS = 1121.5 mm/s) to Ev = 67.5 J/mm3 (SS = 960 mm/s), the length of the specimen changes from 4.992 mm to 5.000 mm at a constant laser power of 285.0 W and a constant hatch spacing of 110 μm. With the help of Table 4, it can be observed that the width of the fabricated IN718 as-built samples increases with an increase in the amount of energy density applied similar to the trend seen in the length of the samples. For example, the width of the samples increased from 4.993 mm to 5.000 mm as the energy density increased from Ev = 57.8 J/mm3 to Ev = 67.5 J/mm3 as the scan speed decreased from 1121.5 mm/s to 960 mm/s. This deviation in length and width can be attributed to the influence of various process parameters on the energy density of the specimens. As discussed earlier, from Table 4, it can be deduced that the range of deviation for width and length is due to the contraction, as lower energy density leads to faster cooling and vice versa. Similarly, higher scan speed values have shown increased deviation in width and length as the laser travels faster, thereby imparting significantly lesser energy at the heat zone. Lower energy values lead to defects such as porosities and balling effects which occur due to lack of proper cohesion [31]. From the Pareto charts in Figure 5 and Figure 7, we can deduce that the scan speed is the dominant factor in determining the length of the as-fabricated samples.
The compositional analysis using XRD revealed the presence of γ, γ’, and γ″ phases in the as-built specimens. For example, the γ″ of the samples decreased from 19.06% to 13.60% as the energy decreased from Ev = 91.6 J/mm3 to Ev = 75.0 J/mm3 as the scan speed increased from 1056 mm/s to 864 mm/s. As the energy density increases, the Nb present in the IN718 alloy forms precipitates (Ni3Nb), which is the strength-hardening phase. However, a further increase in the overall energy density leads to a transformation of the γ″ phase to the thermally stable δ phase. The composition of γ″ and δ phases are the same, but they differ in the crystal structure [33]. The δ phase is a brittle phase which consumes the strength, inducing Nb in the alloy. This transformation might hinder the high-temperature applications of IN718, where characteristics like tensile and yield strengths are important [8]. From the Pareto chart in Figure 9, it is clear that the scan speed is the dominant factor in determining the percentage of γ″ in the as-built samples.
Finally, the hardness, as a mechanical property, was considered, as it correlates the laser process parameters and the chemical composition [34]. For instance, as the energy density increased from the Ev = 75.0 J/mm3 to Ev = 91.6 J/mm3, with a decrease in the hatch spacing values from 121 μm to 99 μm, the Vickers hardness of the samples increased from 273.813 HV to 308.584 HV. Lower hatch spacing leads to higher energy densities, which in turn affect the epitaxial bonding and the chemical composition of the as-built specimen. As discussed earlier, proper interlayer bonding promotes better adhesion. This, in turn, may lead to fewer defects and also increase the presence of the γ″ phase [27]. As the compositional analysis revealed the presence of γ’, γ″ strength hardening phases in the heat-affected zones, the magnitude of the hardness can be associated with the presence of the aforementioned subsidiary phases. The presence of higher percentages of the strengthening phases shall result in an increase in the Vickers hardness values [34]. From the Pareto chart in Figure 11, it is clear that the hatch spacing is the dominant factor in determining the hardness of the SLM fabricated IN718 specimens.
5. Conclusions
The motivation of this study primarily is to correlate the effect of process parameters on the properties of IN718 specimens using the RSM technique. Abiding by the principles of RSM methodologies and SLM process design, the following conclusions can be made with the help of the Pareto charts:
- The scan speed plays a significant role in determining the dimensions of the as-built parts. The deviation in height can be attributed to a lack or abundance of thermal energy as numerous metallurgical characteristics like grain growth and epitaxial bonding are directly influenced by the variation in scan speed.
- The γ″ phase of the as-built IN718 samples is influenced by the scan speed employed. The scan speed plays a crucial role in defining the critical energy density levels, which in turn defines the percentage (%) of the γ″ phase.
- Hatch spacing is the dominant factor in establishing the hardness of the IN718 specimens. The hatch spacing and energy density are interdependent, which thereby influences the temperature buildup in the heat-affected zones. As the compositional analysis revealed the presence of γ′, γ″ strength hardening phases in the heat-affected zones, the magnitude of hardness can be associated with the presence of the aforementioned subsidiary phases.
- An optimal processing region was obtained for IN718 which depicts the relationship between the examined physical properties and the defined laser process parameters which will enhance the fabrication quality of the as-built IN718 specimens.
Author Contributions
B.B.R.: methodology; analysis; writing—original draft. A.A.: conceptualization; supervision; writing—review & editing. N.S.M.: conceptualization; supervision; writing—review & editing. All authors have read and agreed to the published version of the manuscript.
Funding
This research was funded by the University of Texas System STARs award.
Acknowledgments
This work was supported by a University of Texas System STARs award.
Conflicts of Interest
The authors declare no conflict of interest.
References
- Zheng, L.; Schmitz, G.; Meng, Y.; Chellali, R.; Schlesiger, R. Mechanism of intermediate temperature embrittlement of Ni and Ni-based superalloys. Crit. Rev. Solid State Mater. Sci. 2012, 37, 181–214. [Google Scholar] [CrossRef]
- Paulonis, D.F.; Schirra, J.J. Alloy 718 at pratt & whitney–Historical perspective and future challenges. Superalloys 2001, 718, 13–23. [Google Scholar]
- Verna, E.; Biagi, R.; Kazasidis, M.; Galetto, M.; Bemporad, E.; Lupoi, R. Modeling of Erosion Response of Cold-Sprayed In718-Ni Composite Coating Using Full Factorial Design. Coatings 2020, 10, 335. [Google Scholar] [CrossRef]
- Ardila, L.C.; Garciandia, F.; Gonzalez-Diaz, J.B.; Alvarez, P.; Echeverria, A.; Petite, M.M.; Deffley, R.; Ochoa, J. Effect of IN718 recycled powder reuse on properties of parts manufactured by means of selective laser melting. Phys. Procedia 2014, 56, 99–107. [Google Scholar] [CrossRef]
- Reed, R.C. The Superalloys: Fundamentals and Applications; Cambridge University Press: Cambridge, UK, 2009. [Google Scholar]
- Loria, E.A. The status and prospects of alloy 718. J. Miner. Met. Mater. Soc. 1988, 40, 36–41. [Google Scholar] [CrossRef]
- Brooks, J.W.; Bridges, P.J. Metallurgical stability of Inconel alloy 718. Superalloys 1988, 88, 33–42. [Google Scholar]
- Deng, D. Additively Manufactured Inconel 718: Microstructures and Mechanical Properties; Linköping University Electronic Press: Linköping, Sweden, 2018. [Google Scholar]
- Donachie, M.J.; Donachie, S.J. Superalloys: A Technical Guide; ASM international: Cleveland, OH, USA, 2002. [Google Scholar]
- Bowman, R. Superalloys: A Primer and History. In Proceedings of the 9th International Symposium on Superalloys, Champion, PA, USA, 17 September 2000. [Google Scholar]
- Oblak, J.M.; Paulonis, D.F.; Duvall, D.S. Coherency strengthening in Ni base alloys hardened by DO22 γ’ precipitates. Metall. Trans. 1974, 5, 143. [Google Scholar]
- Carlson, R.G.; Radavich, J.F. Microstructural characterization of cast 718. Int. Symp. Superalloys 1989, 79–95. [Google Scholar] [CrossRef]
- Li, J.; Zhao, Z.; Bai, P.; Qu, H.; Liu, B.; Li, L.; Li, L.; Wu, L.; Guan, R.; Liu, H.; et al. Microstructural evolution and mechanical properties of IN718 alloy fabricated by selective laser melting following different heat treatments. J. Alloy. Compunds 2019, 772, 861–870. [Google Scholar] [CrossRef]
- Ravichander, B.B.; Farhang, B.; Swails, N.; Amerinatanzi, A.; Moghaddam, N.S. Analysis of the deviation in properties of selective laser melted samples fabricated by varying process parameters. In Proceedings of the SPIE Smart Structures + Nondestructive Evaluation, Long Beach, CA, USA, 22 April 2020. [Google Scholar]
- Gibson, I.; Rosen, D.; Stucker, B. Additive Manufacturing Technologies, 2nd ed.; Springer: New York, NY, USA, 2015. [Google Scholar]
- Gu, D.; Hagedorn, Y.-C.; Meiners, W.; Meng, G.; Batista, R.J.S.; Wissenbach, K.; Poprawe, R. Densification behavior, microstructure evolution, and wear performance of selective laser melting processed commercially pure titanium. Acta Mater. 2012, 60, 3849–3860. [Google Scholar] [CrossRef]
- Wang, Z.; Guan, K.; Gao, M.; Li, X.; Chen, X.; Zeng, X. The microstructure and mechanical properties of deposited-IN718 by selective laser melting. J. Alloy. Compunds 2012, 513, 518–523. [Google Scholar] [CrossRef]
- Amato, K.N.; Gaytan, S.M.; Murr, L.E.; Martinez, E.; Shindo, P.W.; Hernandez, J.; Collins, S.; Medina, F. Microstructures and mechanical behavior of Inconel 718 fabricated by selective laser melting. Acta Mater. 2012, 60, 2229–2239. [Google Scholar] [CrossRef]
- Brenne, F.; Taube, A.; Pröbstle, M.; Neumeier, S.; Schwarze, D.; Schaper, M.; Niendorf, T. Microstructural design of Ni-base alloys for high-temperature applications: Impact of heat treatment on microstructure and mechanical properties after selective laser melting. Prog. Addit. Manuf. 2016, 1, 141–151. [Google Scholar] [CrossRef]
- Tucho, W.M.; Cuvillier, P.; Sjolyst-Kverneland, A.; Hansen, V. Microstructure and hardness studies of Inconel 718 manufactured by selective laser melting before and after solution heat treatment. Mater. Sci. Eng. A 2017, 689, 220–232. [Google Scholar] [CrossRef]
- Pröbstle, M.; Neumeier, S.; Hopfenmüller, J.; Freund, L.; Niendorf, T.; Schwarze, D.; Göken, M. Superior creep strength of a nickel-based superalloy produced by selective laser melting. Mater. Sci. Eng. A 2016, 674, 299–307. [Google Scholar] [CrossRef]
- Zhang, D.; Niu, W.; Cao, X.; Liu, Z. Effect of standard heat treatment on the microstructure and mechanical properties of selective laser melting manufactured Inconel 718 superalloy. Mater. Sci. Eng. A 2015, 644, 32–40. [Google Scholar] [CrossRef]
- Chlebus, E.; Gruber, K.; Kuźnicka, B.; Kurzac, J.; Kurzynowski, T. Effect of heat treatment on the microstructure and mechanical properties of Inconel 718 processed by selective laser melting. Mater. Sci. Eng. A 2015, 639, 647–655. [Google Scholar] [CrossRef]
- Yi, J.H.; Kang, J.W.; Wang, T.J.; Wang, X.; Hu, Y.Y.; Feng, T.; Feng, Y.L.; Wu, P.Y. Effect of laser energy density on the microstructure, mechanical properties, and deformation of Inconel 718 samples fabricated by selective laser melting. J. Alloy. Compunds 2019, 786, 481–488. [Google Scholar] [CrossRef]
- Sadowski, M.; Ladani, L.; Brindley, W.; Romano, J. Optimizing quality of additively manufactured Inconel 718 using powder bed laser melting process. Addit. Manuf. 2016, 11, 60–70. [Google Scholar] [CrossRef]
- Shi, Q.; Gu, D.; Xia, M.; Cao, S.; Rong, T. Effects of laser processing parameters on thermal behavior and melting/solidification mechanism during selective laser melting of TiC/Inconel 718 composites. Opt. Lasers Technol. 2016, 84, 9–22. [Google Scholar] [CrossRef]
- Gong, X.; Wang, X.; Jones, Z.; Cooper, K.; Cole, J.V.; Chou, K. Characterization of microstructure and mechanical property of Inconel 718 from selective laser melting. In Proceedings of the ASME 2015 International Manufacturing Science and Engineering Conference, Charlotte, NC, USA, 8–12 June 2015. [Google Scholar]
- Kozior, T.; Bochnia, J. The influence of printing orientation on surface texture parameters in powder bed fusion technology with 316L steel. Micromachines 2020, 11, 639. [Google Scholar] [CrossRef]
- Maamoun, A.H.; Xue, Y.F.; Elbestawi, M.A.; Veldhuis, S.C. Effect of selective laser melting process parameters on the quality of Al alloy parts: Powder characterization, density, surface roughness, and dimensional accuracy. Materials 2018, 11, 2343. [Google Scholar] [CrossRef] [PubMed]
- Zhuang, J.-R.; Lee, Y.-T.; Hsieh, W.-H.; Yang, A.-S. Determination of melt pool dimensions using DOE-FEM and RSM with process window during SLM of Ti6Al4V powder. Opt. Lasers Technol. 2018, 103, 59–76. [Google Scholar] [CrossRef]
- Moghaddam, N.S.; Saedi, S.; Amerinatanzi, A.; Hinojos, A.; Ramazani, A.; Kundin, J.; Mills, M.J.; Karaca, H.; Elahinia, M. Achieving superelasticity in additively manufactured NiTi in compression without post-process heat treatment. Sci. Rep. 2019, 9, 1–11. [Google Scholar]
- Rasband, W. National Institutes of Health: Bethesda, MD, USA, 2012. Available online: http://imagej.nih.gov/ij/.
- Barros, R.; Silva, F.J.G.; Gouveia, R.M.; Saboori, A.; Marchese, G.; Biamino, S.; Salmi, A.; Atzeni, E. Laser powder bed fusion of Inconel 718: Residual stress analysis before and after heat treatment. Metals 2019, 9, 1290. [Google Scholar] [CrossRef]
- Farhang, B.; Ravichander, B.B.; Venturi, F.; Amerinatanzi, A.; Moghaddam, N.S. Study on variations of microstructure and metallurgical properties in various heat-affected zones of SLM fabricated Nickel-Titanium alloy. Mater. Sci. Eng. A 2020, 774, 138919. [Google Scholar] [CrossRef]
© 2020 by the authors. Licensee MDPI, Basel, Switzerland. This article is an open access article distributed under the terms and conditions of the Creative Commons Attribution (CC BY) license (http://creativecommons.org/licenses/by/4.0/).