Article

Comprehensive Study of the Deformation Behavior during Diffusion Bonding of 1.4301 (AISI 304) as a Function of Material Width and Aspect Ratio

KIT, Institute for Micro Process Engineering, PoBox 3640, 76021 Karlsruhe, Germany
*
Author to whom correspondence should be addressed.
Metals 2020, 10(9), 1116; https://doi.org/10.3390/met10091116
Submission received: 28 July 2020 / Revised: 12 August 2020 / Accepted: 14 August 2020 / Published: 19 August 2020
(This article belongs to the Special Issue Diffusion Bonding of Metals)

Abstract

:
In this paper, the impact of material width as well as aspect ratio on deformation during diffusion bonding of layered samples were investigated. For this, six annular samples with a constant cross-sectional area but an increasing diameter and thus decreasing material width were designed. In a first set of experiments, specimens of a constant height of h = 20 mm were examined. Each sample consisted of 10 sheets, 2 mm in thickness each. Diffusion bonding was performed at T = 1075 °C, t = 4 h and p = 15 MPa. Subsequently, additional samples with a constant aspect ratio of about three but different material width were diffusion bonded. For this, additional layers were added. It was expected that the deformation should be nearly constant for a constant aspect ratio. However, comparing the deformation to a sample possessing an aspect ratio of about three from the first batch, a much higher deformation was obtained now. Bonding a third sample, a deformation in the same range as for the other two samples of the second batch was obtained. It was found that due to the evaporation of metals, the thermocouples were subjected to aging, which was proven indirectly by the evaluation of heating power. Since the diffusion coefficient of the metals follows an exponential law, deformation changes considerably with temperature. This emphasizes that exact temperature measurement is very important, especially for bonding microprocessor devices at constant contact pressure. The experiments showed that the deformation depends strongly on geometry. Bonding parameters cannot be generalized. For layered setups, the contribution that thickness tolerances from manufacturing and leveling of surface roughnesses of sheets add to the overall deformation cannot be reliably separated. After diffusion bonding, thickness tolerances increase with a lateral dimension. Obviously, the stiffness of the pressure dies is crucial.

1. Introduction

Micro process devices often consist of multiple microstructured thin sheets of metal. The variation of the thickness of cold-rolled sheet material is in the range of 20–50 µm regardless of the actual thickness due to the cold rolling process. So, relative variation is quite high for thin sheets and cannot be neglected, especially for larger lateral dimensions [1]. Thickness tolerances affect deformation during diffusion bonding too. For multilayered devices, tolerances may add up or balance out without being measurable with reasonable effort. In addition, multiple surface roughness must be leveled to make atomic contact. Both effects contribute to the percentage of deformation. It leads to poor reproducibility of vacuum tightness and the deformation on diffusion bonding in serial production, despite identical bonding parameters. At the beginning of the bonding process, a much higher contact pressure may apply locally. A localized deformation may result in the blocking of internal microstructures.
Considerable production-oriented design effort is required to ensure force transmission between different layers. [2].
In consequence, for microprocess engineering and single or small series production, it is difficult to predict suitable bonding parameters, e.g., bonding temperature, dwell time and contact pressure to obtain the desired deformation and to ensure high vacuum-tight components. Furthermore, for multilayered designs, it is not possible to specify a fixed percentage of deformation to reach these goals.
For the reasons described above, it is essential to control the deformation during the diffusion bonding of microprocessor devices. Surprisingly, there is not too much literature facing deformation on the microscopic and macroscopic scale during diffusion bonding [3,4,5]. Moravec et al. give a set of parameters including the deformation using a thermomechanical simulator Gleeble 3500-device (Poestenkill, NY, USA) [6]. The experiments were performed on specimens by applying a temperature profile along the axis in which the force was acting. Hence, the comparability to multilayer stacks at constant temperature is low. Most papers are focused on the characterization of the bonding surface, formation of precipitates or brittle intermetallic phases and residual pores according to bonding parameters [7,8,9].
In [
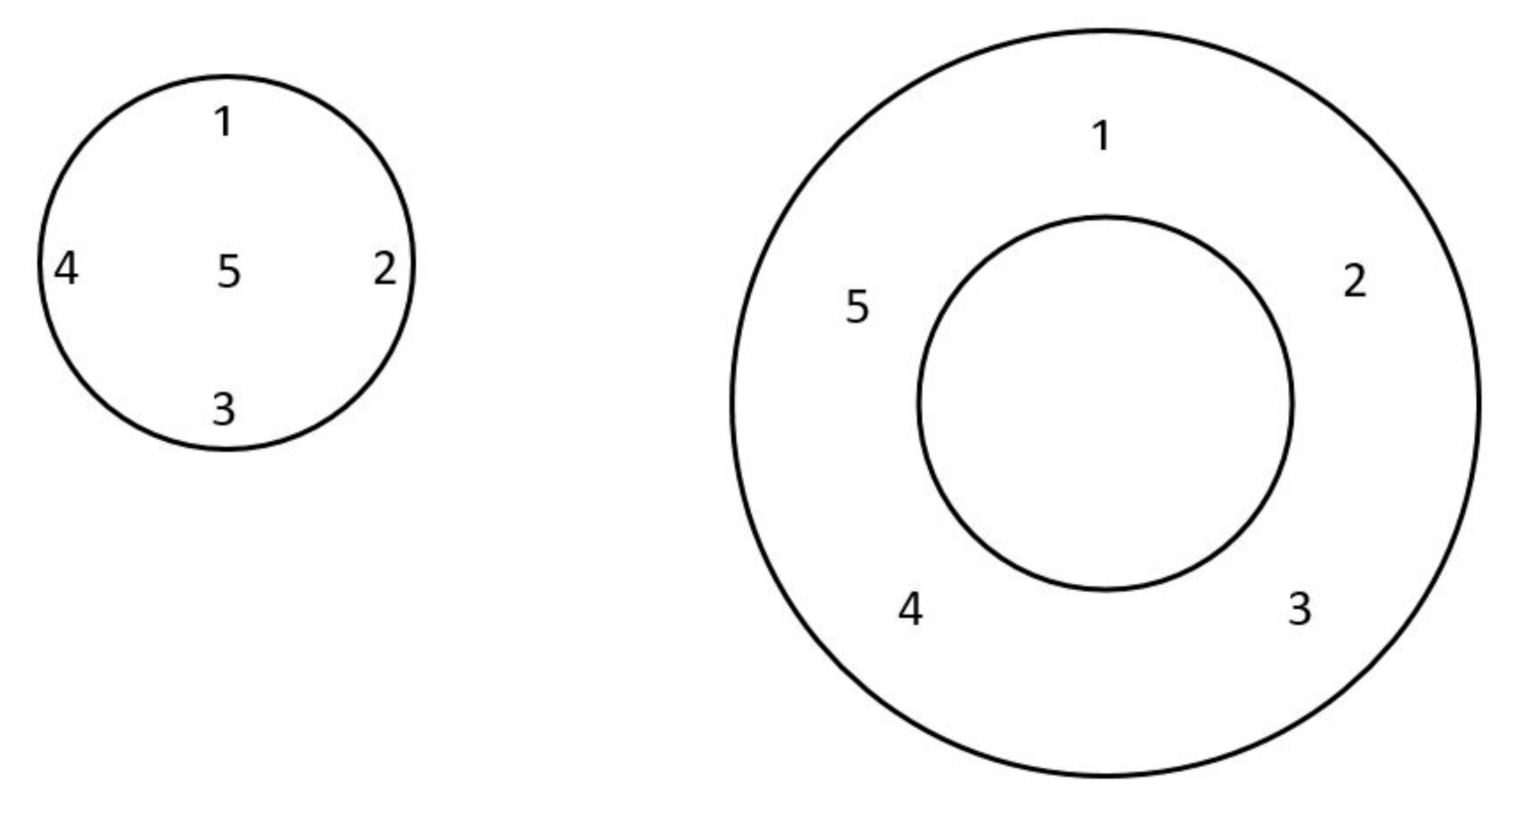
10], the authors examined the influence of the number of layers per construction height in comparison to components made of two only pieces, as well as the impact of overall cross-section and aspect ratio (in Appendix A) on deformation. However, the roughness values of the surfaces were not characterized. In [11], Zhang et al. investigated the deformation behavior of asperities during diffusion bonding of milled surfaces possessing a surface roughness Ra = 1.6 µm at T = 1080 °C, t = 20 min and varying contact pressures of 5, 10, 15 and 20 MPa, respectively, in terms of remaining pores. However, different roughness values were not investigated and compared. In [12], the authors investigated the depth of singular scratches on vacuum tightness and compared the impact of constant contact pressure to a contact pressure superimposed by short peak loads. However, the impact of the absolute width of joining cross-sections on the deformation behavior was not yet investigated systematically.
In addition to the issues mentioned above, the composition, origin and prehistory of the material have an impact on diffusion and formation of passivation layers affecting deformation, grain growth across the bonding planes and diffusion bonding result [13,14]. Therefore, a certain bonding temperature, bonding time and contact pressure do not lead to a reproducible deformation for different parts and/or materials. In consequence, for each alloy and even each design, the bonding parameters must be optimized separately.
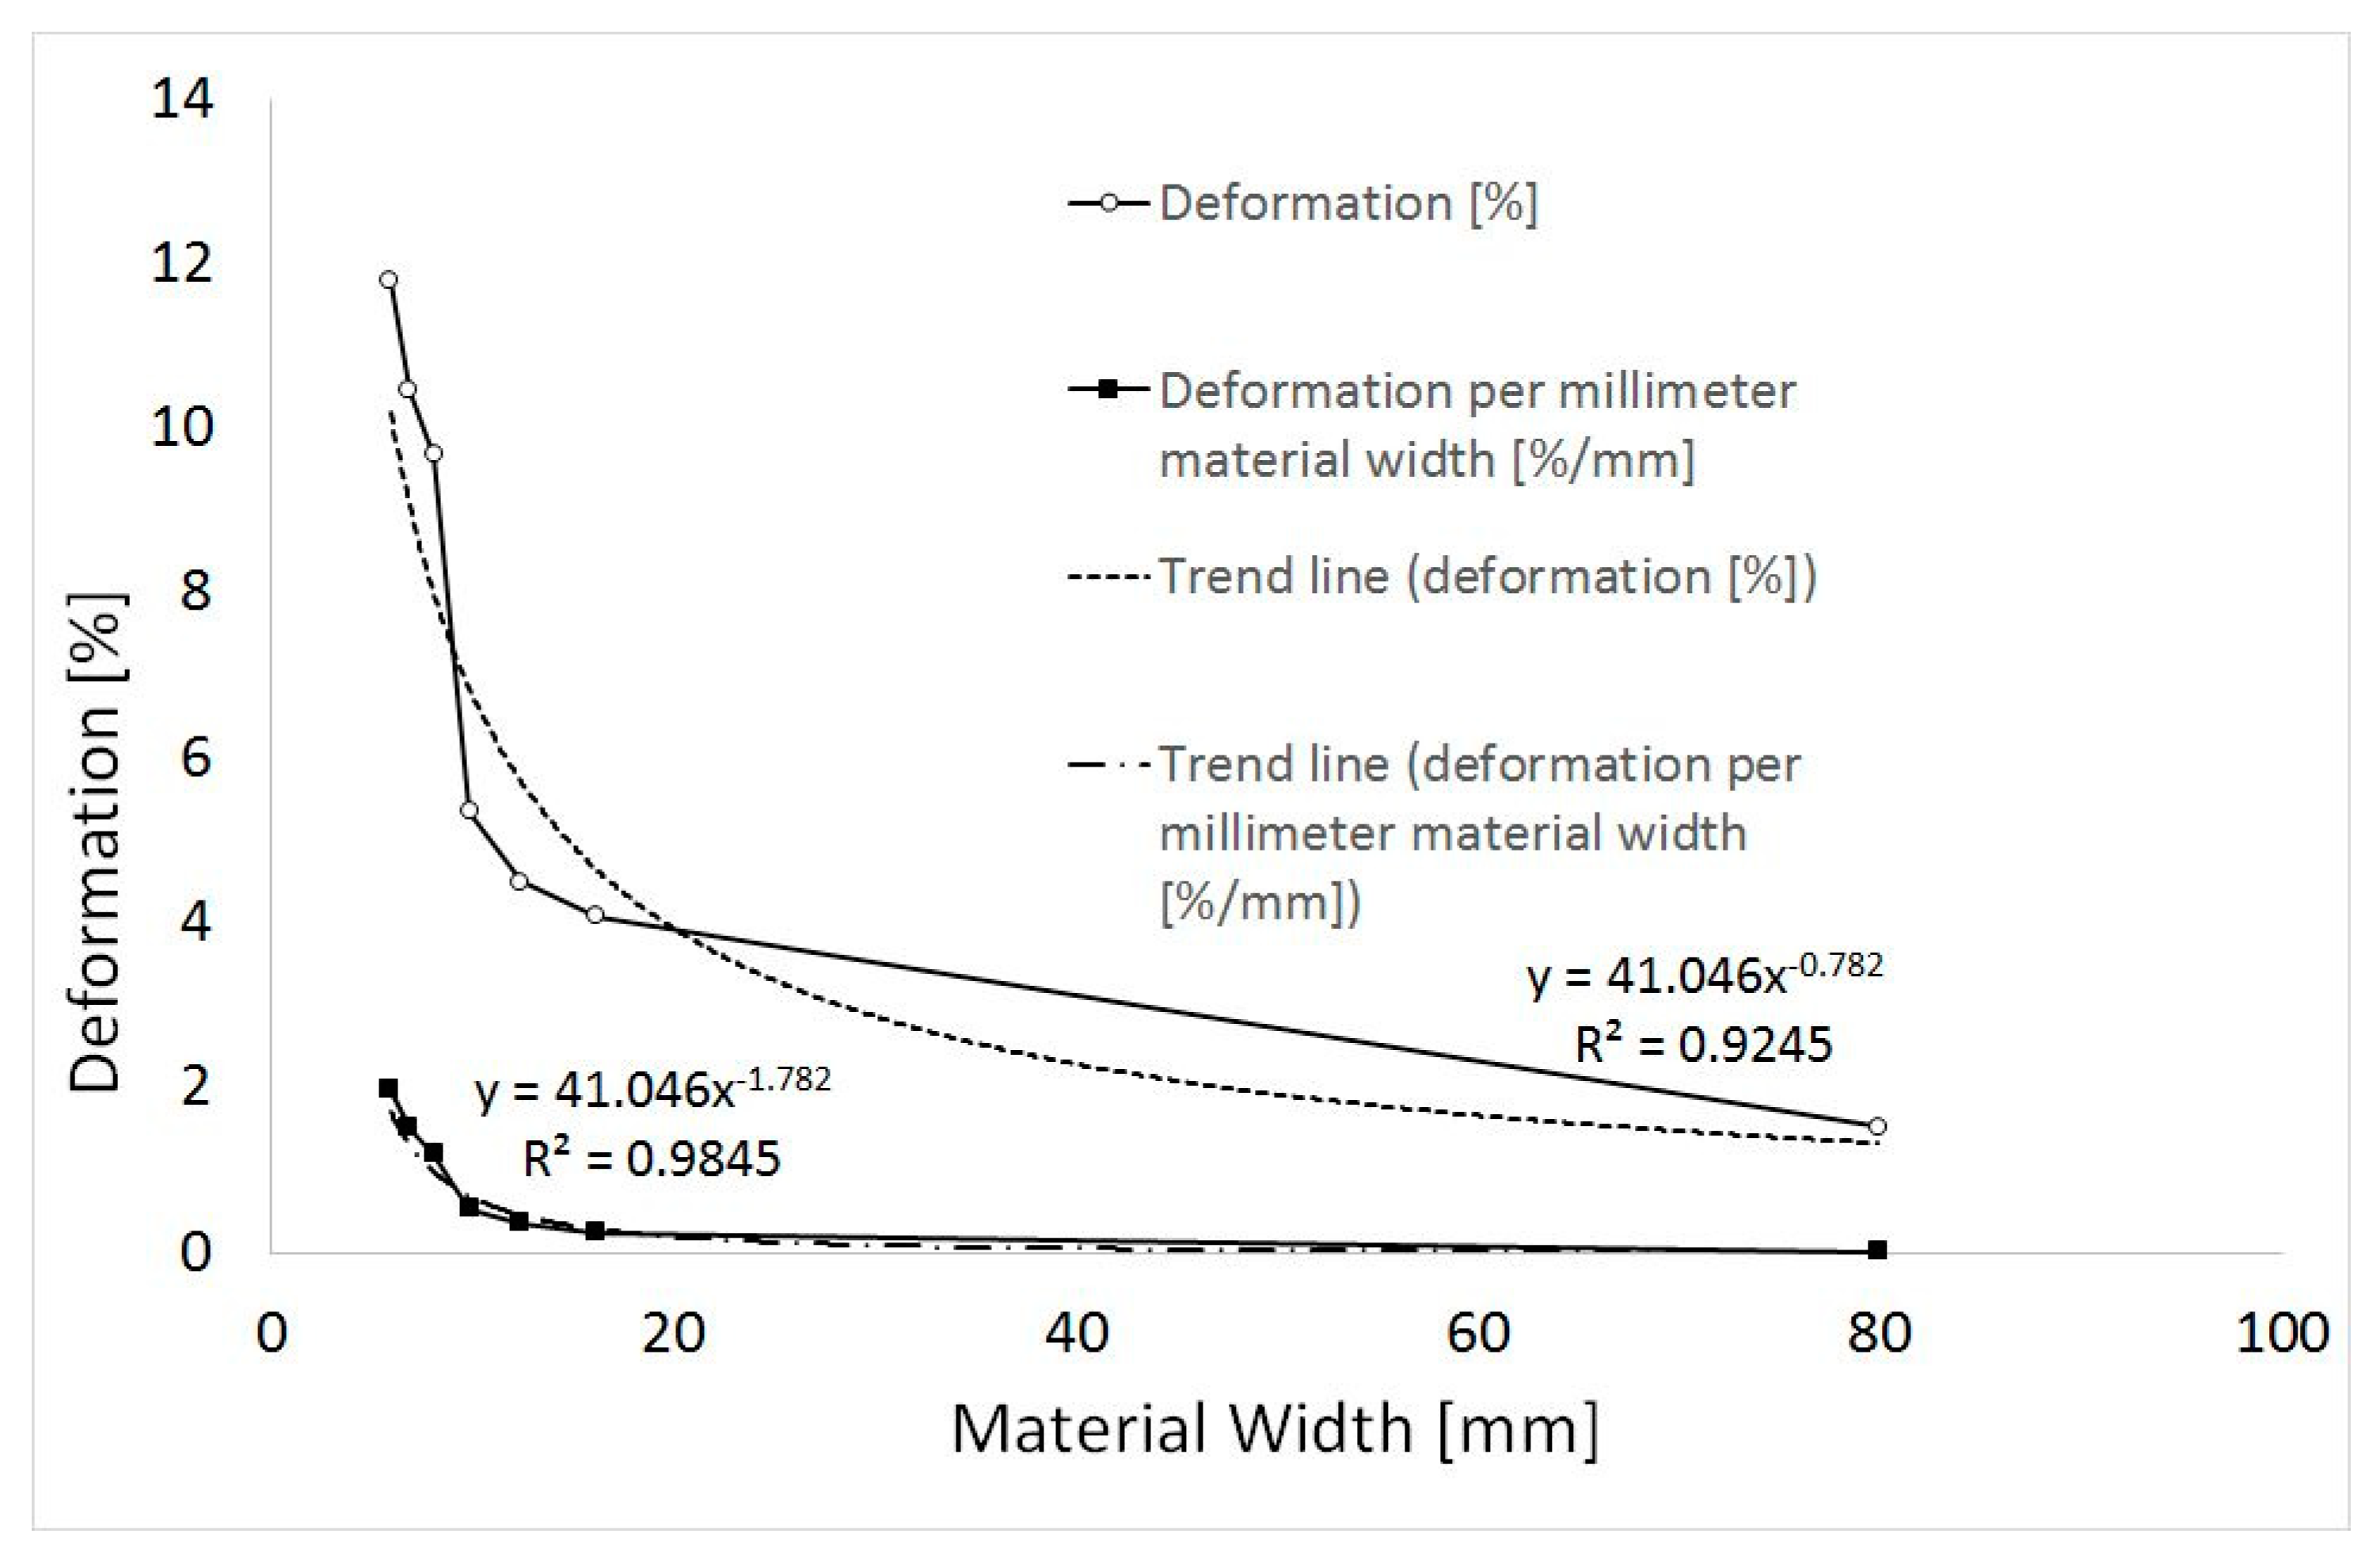
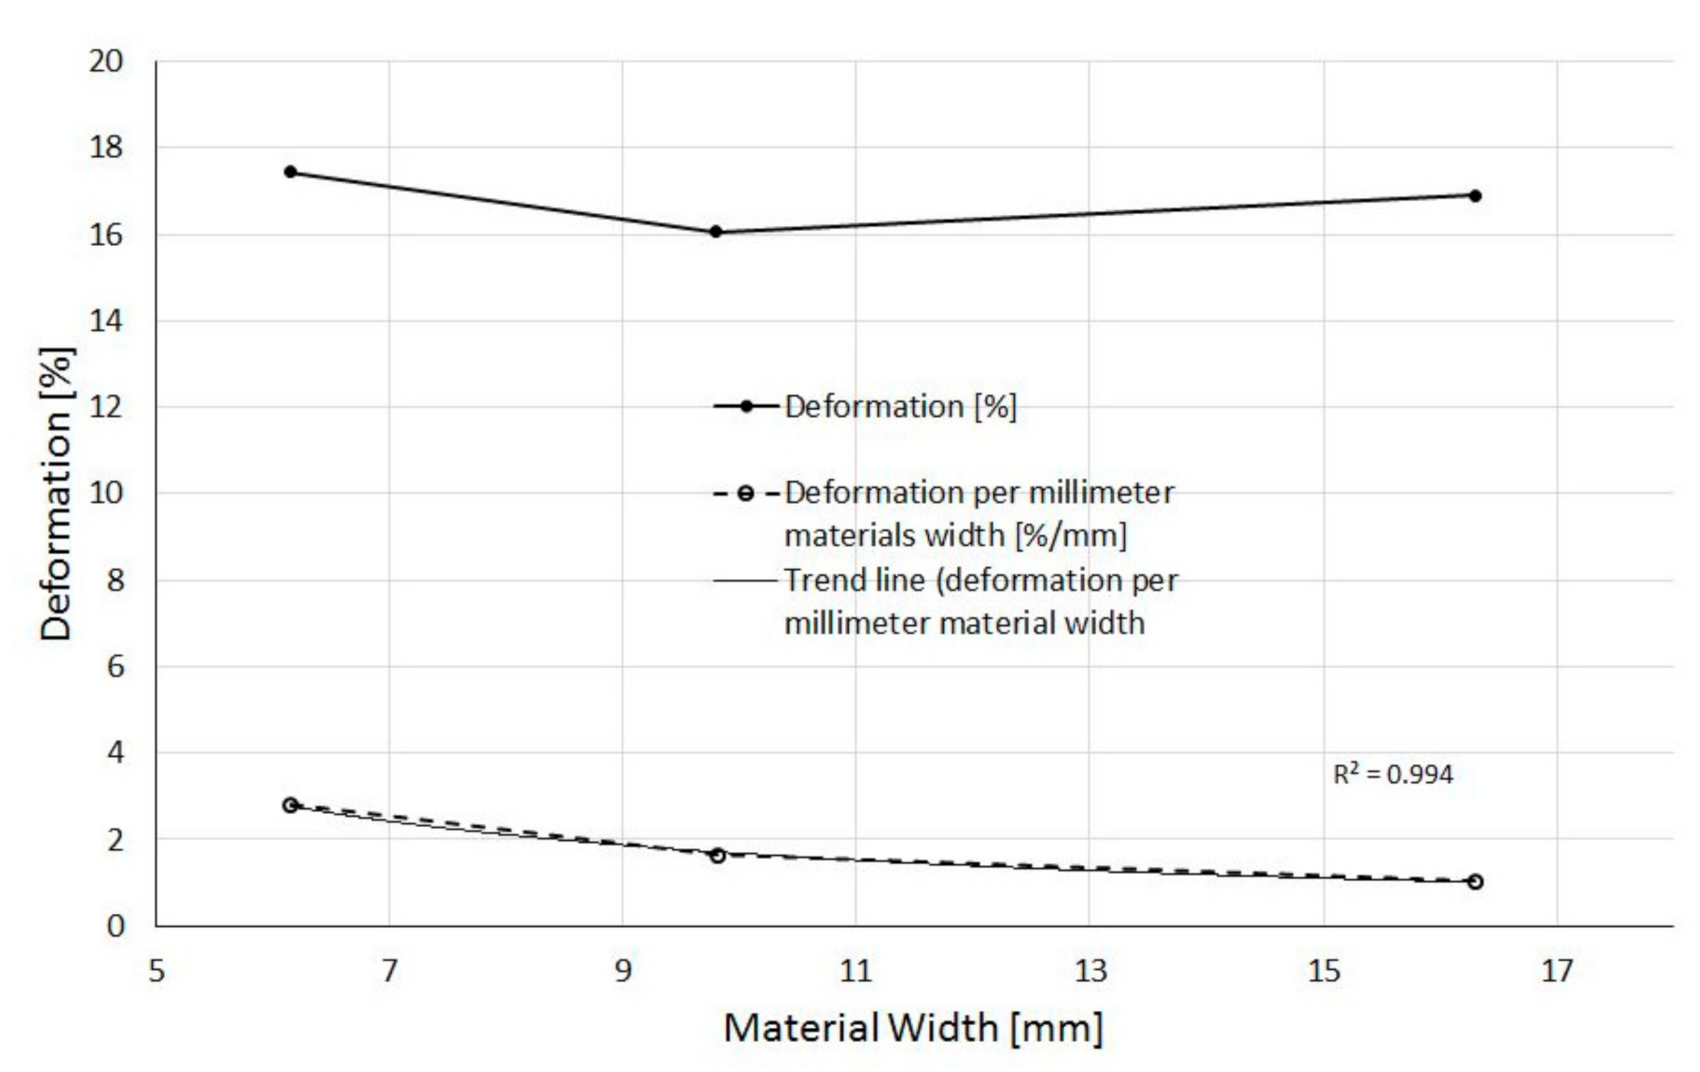
In this paper, the impact of the material width on deformation and the aspect ratio was investigated. For comparison reasons, samples with an aspect ratio of about three were bonded. However, the deformation obtained did not follow the expected trend. It was found that the aging of thermocouples was the reason. This emphasizes the importance of accurate temperature measurement during diffusion bonding and monitoring of thermocouples, which is being neglected at the most macroscopic applications of diffusion bonding.

2. Materials and Design of Experiments

The material used was 1.4301 austenitic stainless steel (AISI 304) with a sheet thickness of 2 mm, due to the simplicity of manufacturing. The composition of the alloy is given in Table 1.
Diffusion bonds of high-alloy austenitic steels are possible in a wide range of process parameters. Different authors report temperatures ranging from 850 to 1100 °C, contact pressures of 2 to 15 MPa and dwell times on temperature not exceeding 60 min [16,17,18]. However, for microstructured devices made from several layers, the experience of the authors showed that longer dwell times led to improved bonding results. Thus, diffusion bonding was performed at T = 1075 °C, t = 4 h and p = 15 MPa. These parameters are in accordance with years of experience in the manufacturing of small microstructured devices from 1.4301.
To investigate the influence of the lateral dimension independent of the bonding cross-section, a set of samples with a constant cross-section of 5026.6 mm2, corresponding to a diameter of 80 mm, were used. In order to save material, overlapping annular test specimens were designed for this purpose. All dimensions of the samples like inner and outer diameter (di and do, respectively), material width (Mat. Width) and the aspect ratio (AR, the ratio of diameter and height) are given in Table 2. By increasing dimensions of the annular samples, also technical process deviations during diffusion bonding originating from the equipment could be assessed.
All test specimens were cut by laser out of 1.4301 sheet material, 2 mm in nominal thickness. For this, a TruLaser Cell 3010, combined with a 3 kW TruDisk 3001 (TRUMPF GmbH + Co. KG, Ditzingen, Germany) was used. Due to tolerances arising from the laser cutting process, all dimensions were checked using a caliper gauge with a scale division of 1/100 mm. From this, the true cross-section was calculated, using the measured width of the annular test samples and the outer diameter. The percentage deviations to 5026.6 mm2 were calculated (Table 3). It turned out that the error is between −0.25 and−3.16% due to manufacturing tolerances. This reflects the problem that the same accuracy in one-dimensional effects larger errors in the area.
For the first set of bonding experiments, 10 layers were stacked each, leading to varying aspect ratios (Table 2).
Later on and in order to compare the deformation for a constant aspect ratio of about three, different numbers of sheet layers were stacked for selected samples (Table 4). Thereby, the contributions of additional layers, thickness tolerances and leveling of individual surface roughness are covered. Since layers for two annular samples were laser cut in a second run, the dimensions differed slightly.

3. Experiments and Results

For all diffusion bonding experiments, additional baffle plates, made of TZM-molybdenum alloy, were used, to protect the compression dies from damage. Plates were coated by spraying alumina suspension in multiple runs to prevent sticking at the samples at high temperatures. After placing the samples in the furnace, it was evacuated to a vacuum better than 1 × 10⁻⁴ mbar. When reaching the criterion, the temperature was ramped up at a rate of 10 K/min for experiments performed in Furnace II and 5 K/min in Furnace III, used for larger formats (Table 5). The load was applied after reaching the set point of temperature within 5 min. All diffusion bonding experiments were performed at T = 1075 °C, t = 4 h and p = 15 MPa. After diffusion bonding, the heating was turned off and the furnaces cooled down naturally according to their thermal mass.

3.1. Impact of Material Width on Deformation for Annular Test Samples of Constant Height

Table 5 shows the measured heights of the samples consisting of 10 layers, before and after diffusion bonding. Before diffusion bonding, the 10 sheets were fixed using a pulsed laser for alignment reasons. A peak power Pp = 800 W, frequency f = 1000 Hz at a pulse duration of 0.75 ms giving an average power Pa = 600 W at a speed v = 5 m/min at a focal position F = −1 mm related to the surface were used. Three welds were done under 120° of the perimeter of the stack with a depth of about 0.8 mm. Five spots for the height were measured (Figure 1). For the round sample, the heights were measured in all four directions as well as in the center. For the annular sample, heights were measured under an incremental angle of 72°. These values were averaged and thickness tolerances calculated (Table 5).
It turned out that the sheet thickness was approximately 1.95 mm only instead of 2.000 mm. The thickness tolerance of all samples laser-tacked before diffusion bonding is less than 50 µm, but increases with increasing lateral dimensions. After diffusion bonding, the thickness tolerance increases considerably. Especially for smaller samples bonded in Furnace II, the thickness tolerance increases steadily with lateral dimensions (Table 5). Relating the thickness tolerances to the outer diameter do, a constant value is obtained. The three largest annular samples, bonded in Furnace III, show lower and nearly constant thickness tolerances, due to higher stiffness of the setup and the compression dies. The ratio of the thickness tolerances to the outer diameter do is smaller and no obvious trend is observed. Furthermore, it can be stated that the impact of the thickness tolerance on the accuracy of the deformation is much higher for Furnace II compared to Furnace III. Obviously, the main impact is not the increasing thickness tolerance of sheet material with an increasing dimension of samples but the stability of the pressure dies and deformation behavior of the samples itself.
Table 6 displays the percentages of deformation of annular samples made of 10 sheets each. It is obvious that the circular sample with d = 80 mm exhibits the greatest resistance to deformation.
If the percentage deformation is related to the material widths, there is a strong increase in decreasing material width. However, as the height was constant, the aspect ratios were not, but increasing. Therefore, the deformation related to the material width was normalized to an aspect ratio of one, showing a strong and steady increase for decreasing material width.
From Table 6, a huge impact of the bonding material width on deformation can be stated. The deformation covers a range of 1.53% for the circular sample with a diameter of 80 mm to about the eightfold of 11.79% for a material width of 5.94 mm only. For a material width of 16.2 mm, the deformation is more than the 2.5-fold compared to the circular sample. For a material width of 5.94 mm, which is about one-third of 16.2 mm, the deformation triples, showing a roughly linear correlation between deformation and material width.
In general, it can be stated that the deformation and all related deformation values show a leap changing from Furnace II to Furnace III.
Figure 2 shows the percentage of deformation versus the material width for a cross-section of 5027 mm2 and normalized to the material width in millimeters. For the cylindrical sample with a diameter of 80 mm, a very small value of the normalized deformation of 0.02%/mm is striking. For a material width of 16.2 mm, the normalized deformation increases to the twelvefold. If the material width decreases from 16.2 mm to 5.94 mm, it increases by eightfold.
For the normalized deformation versus material width, a very good agreement with a potential function is obtained. It was found that the regression coefficient of the trend line drops if the deformation for the cylindrical samples was not taken into account. This affirms that the deformation is described well by a potential function and for small material cross-sections, the deformation increases extremely strongly.
For the diffusion bonding experiments, different deformation conditions have to be considered, because circular specimens can only be deformed outside. It was noticeable that the barrel-shaped distortion of the outline of annular specimens occurred only to the outside and not to the inside (Figure 3). The inner contour corresponds not to that of the parallel-shifted, convex outer contour. Rather, vertical or even slightly convex areas are visible at the top and bottom. In the middle of the ring height, however, the contour is concave.
Due to the lack of material data, e.g., elastic modulus, yield strength and tensile strength, for 1.4301 austenitic stainless steel at 1075 °C, the deformation behavior was simulated at room temperature. For this, ANSYS 2019 R1 was used. For symmetrical reasons meshing was done automatically. A total of 1226 elements and 4054 nodes were used. Static analysis with 15 iterations was performed until a reasonable deformation value compared to a practical experiment was obtained. An elastic–plastic material behavior was assumed, and the load level was adjusted accordingly. Figure 4 shows that the inner contour of the simulation of the deformation behavior of the annular sample corresponds qualitatively well with the observed profile of the diffusion-bonded sample in Figure 3. It does not exactly follow a concave curvature. Rather, the sample is restricted in its deformation on the upper and lower side due to the mechanically very stiff compression dies made of TZM-molybdenum alloy and possessing a lower coefficient of thermal expansion, and the friction that occurs between. In contrast to the outer contour, the inner side is first vertical to convex before it changes to a concave curvature in the middle of the sample height.

3.2. Annular Samples with an Aspect Ratio of Approximately Three

For comparison reasons regarding diffusion bonding of samples with a constant aspect ratio of about three, to sample “Annular 5” of the first set of experiments, experiments using two additional different sample geometries were performed (Table 6). Laser cuts were produced by laser cutting as described in Section 3.1
It was noticed that the deformation of the new samples of “Annular 1” and “Annular 3”, with 24 and 15 layers to achieve an aspect ratio of approximately three, respectively, deviated strongly from the deformation of sample “Annular 5” of the first batch, which had an aspect ratio of about three, too.
Therefore, a supplementary experiment which is named “Annular 6” in Table 7 and consisted of nine layers, was carried out. The deformation obtained from this last experiment at an aspect ratio of about three fitted into the results of the other two experiments. It has to be mentioned that experiments do not allow quantifying the contribution of different numbers of layers to the overall deformation.
Comparing the deformation for samples with an aspect ratio of about three, namely “Annular 1” and “Annular 3”, respectively, to “Annular 6”, which were bonded at the second batch, the deformation is nearly constant whereas the deformation normalized to the materials’ width steadily increases for decreasing material width (Figure 5).
From comparing Table 7 to Table 6, it can be seen that the deformation for samples of a constant aspect ratio of three generally is much higher. For an aspect ratio of three, for “Annular 1” the deformation is fourfold compared to an aspect ratio of 1.20 from Table 6. For “Annular 3”, the deformation is tripled related to an aspect ratio of two.

3.3. Experiments to Clarify the Discrepancy of the Deformation

However, when comparing the deformation of “Annular 5” with the deformations of other samples with an aspect ratio of three in Table 7, it is obvious that the deformations do not show a linear dependence. The deformations obtained in different test series seem irregular.
As mentioned above, the first set of samples was made in one batch and the second batch of samples with an aspect ratio of about three were performed in a series of experiments later. In between, in Furnace III, several runs were performed, among others and the diffusion bonding of eight identical parts for a customer, consisting of a few hundreds of layers. It was the first time that a series of identical parts were diffusion bonded. As is often the case in research institutions, usually completely different components were diffusion bonded up to this time. Hence, it was not possible to realize any systematic process alterations. Usually, a deformation in the range of 3 to 5% was specified, regardless to process parameters.
By comparing the deformation of these consecutive diffusion-bonded parts, it was recognized that the deformation increased with the numbers of runs. The deformation of the last part was 1.5% higher than for the first one (Table 8). Therefore, the log-files of the furnace runs were evaluated. The procedure for these diffusion bonding runs was as follows: Evaluate, apply a preload of 50 kN, heat up to a set temperature of T = 1075 °C, holding time t = 1 h for warm-up, apply full bonding load, dwell time t = 4 h, cool down. The mass of the parts was about 300 kg. It was heated at a rate of 5 K/min. The diameter of the furnace is divided into three heating zones, one of which is formed by the door. It was found that the heating power per zone was more than 40 kW when the set temperature was reached. At the end of the 4 h dwell time, no more heat flow into the workpiece occurs. Power consumption is only to compensate for the radiation losses. For the first run, heating power consumption was below 20 kW per heating zone. Table 8 shows that the increasing deformation correlates with an increase in heating power for subsequent runs. The scattering of heating power with time is within 0.3 kW. Since the workpieces were identical, the radiation loss to be compensated is constant, but depends on the absolute level of the joining temperature. This is an indirect proof that the bonding temperature must have been increased over the eight components due to aging of the thermocouples. This effect of heating power is hard to realize, too After replacing thermocouples, a test run using a lighter TZM-block was performed at T = 1100 °C without load. Hence, the position of the compression dies was at a similar position as for bonding the eight commercial parts. Despite a higher setpoint temperature, the heating power per zone dropped to 15 kW. That means the radiation loss depends not only on the absolute level of temperature and radiation conditions depending on the position of compression dies but on the mass of the part to be bonded, too.
Actually, diffusion bonding of the additional bonding experiment of “Annular 6” with an aspect ratio of three was performed 12 runs later than the diffusion bonding of “Annular 5” with 10 sheet layers.
In our setup, thermocouples of type S were used, with a wire thickness of 0.3 mm. Thermocouple wires were isolated by two-bore-insulators made of alumina (see Figure 6 for Furnace III). The thermocouples were attached at different positions at the workpiece, by either inserting into holes or fixing it on the surface by means of small blocks made of TZM-molybdenum alloy. Generally, it can be assumed that the temperature inhomogeneity in the furnace is low, since heat is provided via radiation in vacuum and the metal of the stack itself is a good heat conductor. A small contribution to the thermoelectric voltage may be generated along the profile of the temperature gradient [19,20]
The diffusion bonding process is performed under vacuum. Anyone who deals with diffusion bonding or heat treatment at high temperatures knows about debris in furnace chambers. Furthermore, it is known that chromium and its oxides in particular have a low vapor pressure. [21,22] Additionally, different metals may be subjected to evaporation depending on their content within an alloy and its melting point. A few thermal cycling of Furnace III after bonding the eight parts mentioned in Table 8, flaking of precipitations at the furnace wall was observed (Figure 6, right). Flakes were characterized EDX using a microprobe JEOL JXA 8530F,(Peabody, MA, USA) equipped with an EDX-system EX-94310F4L1Q by Jeol (Peabody, MA, US) with an energy resolution of 129 eV. An acceleration voltage of 15 keV and a current of 5.0 nA were used. The areas investigated and the results obtained are displayed in Figure 7 and Table 9, respectively. Manually added elements (marked by *) were selected because they represent known components of the austenitic stainless steel or are expected impurities from bonding runs performed before.
From Table 9, it can be seen that the precipitations consisted mainly of manganese, despite its content in austenitic stainless steels is specified usually below 2%. However, since the melting point of manganese (1246 °C) is the lowest of all alloying elements of 1.4301, its partial pressure is highest [15]. Surprisingly, the content of chromium was rather low. The copper content is attributed to former diffusion bonding runs with copper parts. In subsequent runs at higher bonding temperatures for other materials, copper migrates outwards the thermal shielding towards the water-cooled wall of the furnace according to the temperature profile.
This observation means that the composition of thermocouple wires may change depending on the diffusion-bonded materials and with the number of runs.
The individual thermocouple wires are isolated using 2-bore insulator pieces made of alumina for flexibility reasons. There is sufficient space left between for condensation of metal vapors. Despite their different positions, all three sample thermocouples are normally within a temperature range of 5 K (Figure 6, left).
Hence, a Pegasus 4853 Advanced by Isotech, UK, supplied by Klasmeier, was used to check the thermocouples. The Pegasus was placed in front of Furnace III and the thermocouples were inserted into the calibrator block. A test run under vacuum at T = 1100 °C for t = 1 h was carried out. Thermocouple (TC) 1 was replaced before. It was found that older TC 2 was 23 to 29 K and TC 3 was 12 to 18 K below 1100 °C. Furthermore, it can be seen from the curves that the temperature of the old thermocouples is not constant but decreases with time (Figure 8).
For that reason, EDX-measurements were carried out on old cut-off TC 1. Again, the microprobe JEOL JXA 8530F, equipped with an EDX-system EX-94310F4L1Q by Jeol with an energy resolution of 129 eV was used. At a voltage of 15 keV and a current of 3.2 nA, 2.500–3.000 counts per second were obtained. In Figure 9, surfaces of the sensing tip, the platinum-wire and the Pt/10% rhodium-wire together with the measuring spots are displayed.
In Table 10a–c, the results of EDX-measurements are summarized. For the tip of the old TC 1 (Figure 9, left) it can be seen that Spots 1 to 3 represent the Pt-wire. Spot 4 is in the transition range to the Pt/10%Rh-wire, whereas Spot 5 represents the Pt/10%Rh-wire. Especially at the tip, large amounts of impurities by different metals such as iron, copper and chromium, are found due to diffusion and evaporation from the workpieces. Calcium and potassium may be attributed to skin excretions. For the Pt-wire, fewer contaminants were found than for the Pt/10%Rh-wire. This might be attributed to the fact that it is not clear, which spots of both wires with respect to the gaps between the alumina insulator pieces were investigated. For the Pt/10%Rh-wire, the Pt-Rh-ratio was found to be 10:1.

4. Summary

In this paper, for the first time, a comprehensive and systematic study of the deformation of layered materials and depending on material width was performed. It was shown that constant bonding temperature, contact pressure and dwell time might result in a completely different percentage of deformations depending on material width and aspect ratio. The reason for this is that for large material cross-sections through the surrounding material exert a greater restriction on deformation than thinner ones. Furthermore, larger cross-sections are more hindered in deformation by friction on the compression dies than smaller ones. The deformation behavior of multilayer structures is subject to large fluctuations due to manufacturing tolerances in sheet metal thickness from production and the leveling of many surface roughnesses.
Hence, it is difficult to estimate the expected deformation in advance for parts of arbitrary geometry.
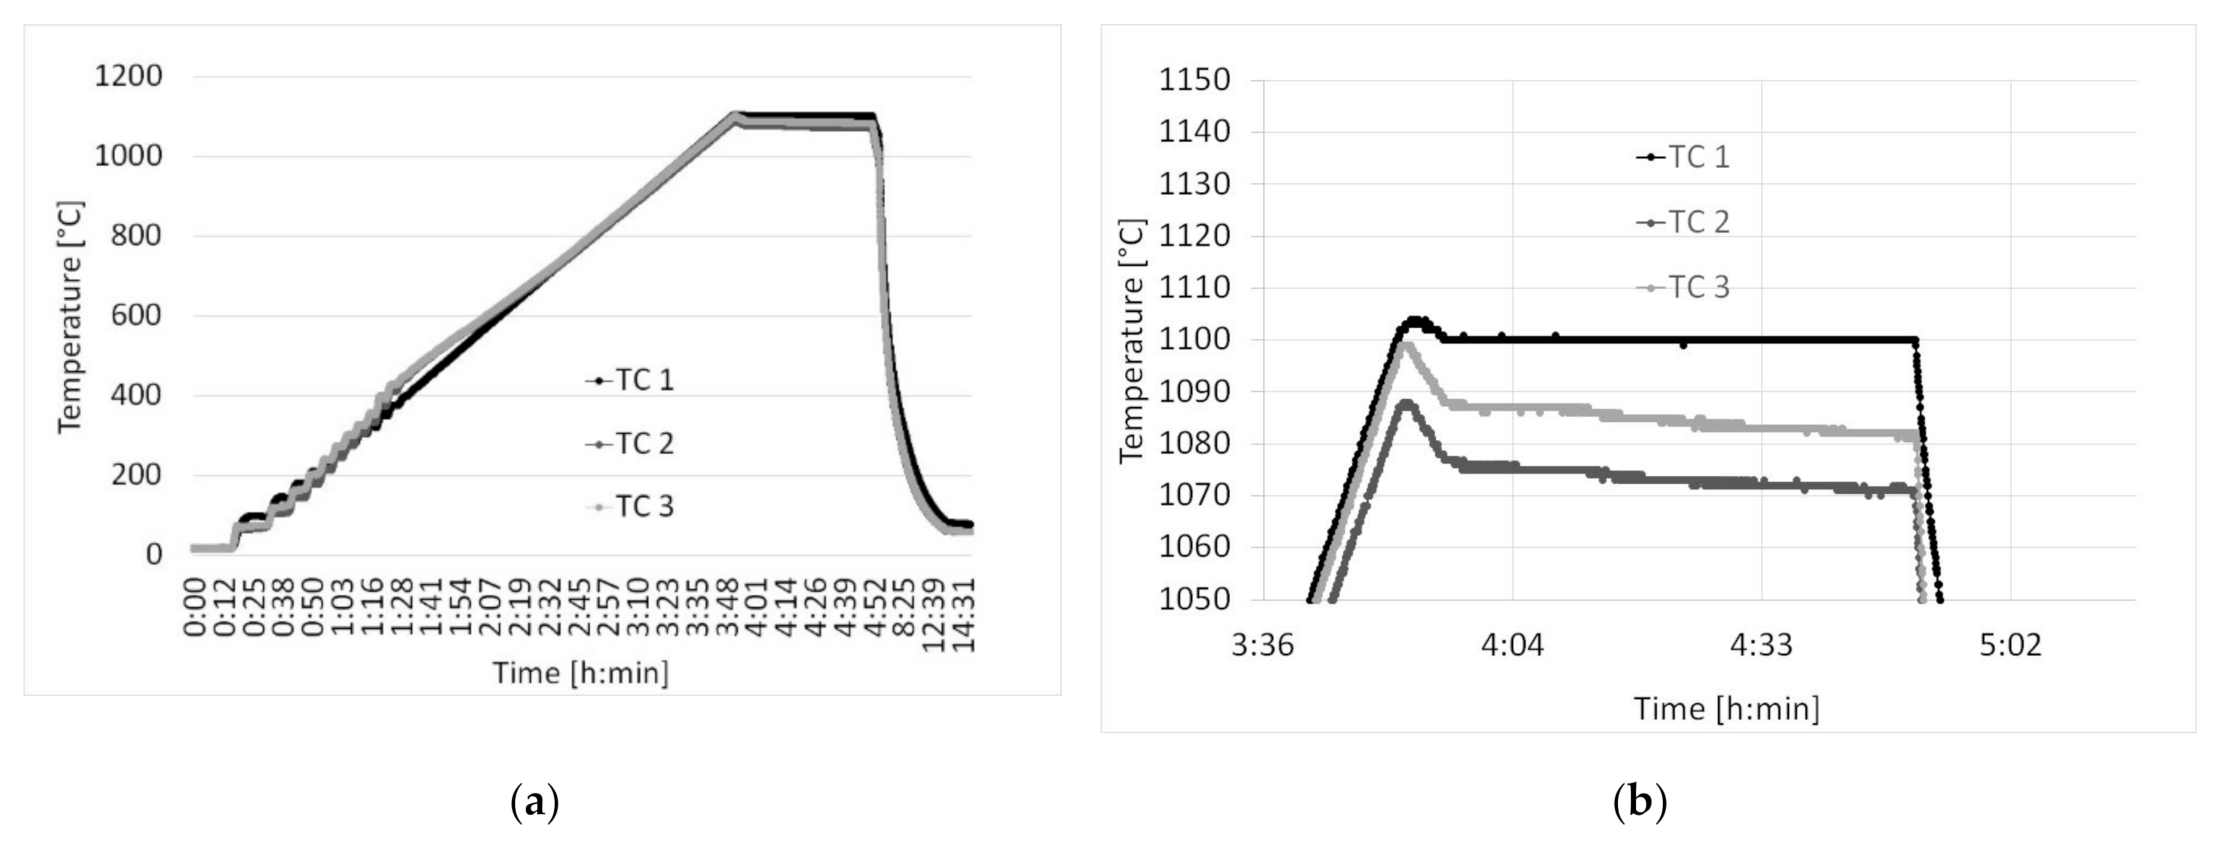
The two batches of experiments underlined the importance of exact temperature measurement and showed the aging effects of thermocouples for consecutively diffusion bonding processes.
This allows the following conclusions to be drawn:
First, the thermocouples are subject to aging. Some thermoelectric voltage is generated along the wires. Cutting off and reshaping the sensing tip before each bonding run does not ensure exact temperature measurement.
Second: From the heating power consumption at a steady temperature level, a change in temperature can be concluded. This is, however, only valid for identical parts. Especially in research with permanently changing components, it is difficult to detect such effects.
Thirdly, since it is economically not feasible to replace the complete thermocouples after each run, temperature measurement is subject to uncertainty. Calibration runs should be performed after a certain number of runs for being able to correct actual temperature. Hence, it is hard to predict reliably the deformation of new designs, based on the deformation obtained from previously diffusion-bonded components.
Fourthly, the deformation, as investigated in this paper and as described above, depends strongly on the component geometry.
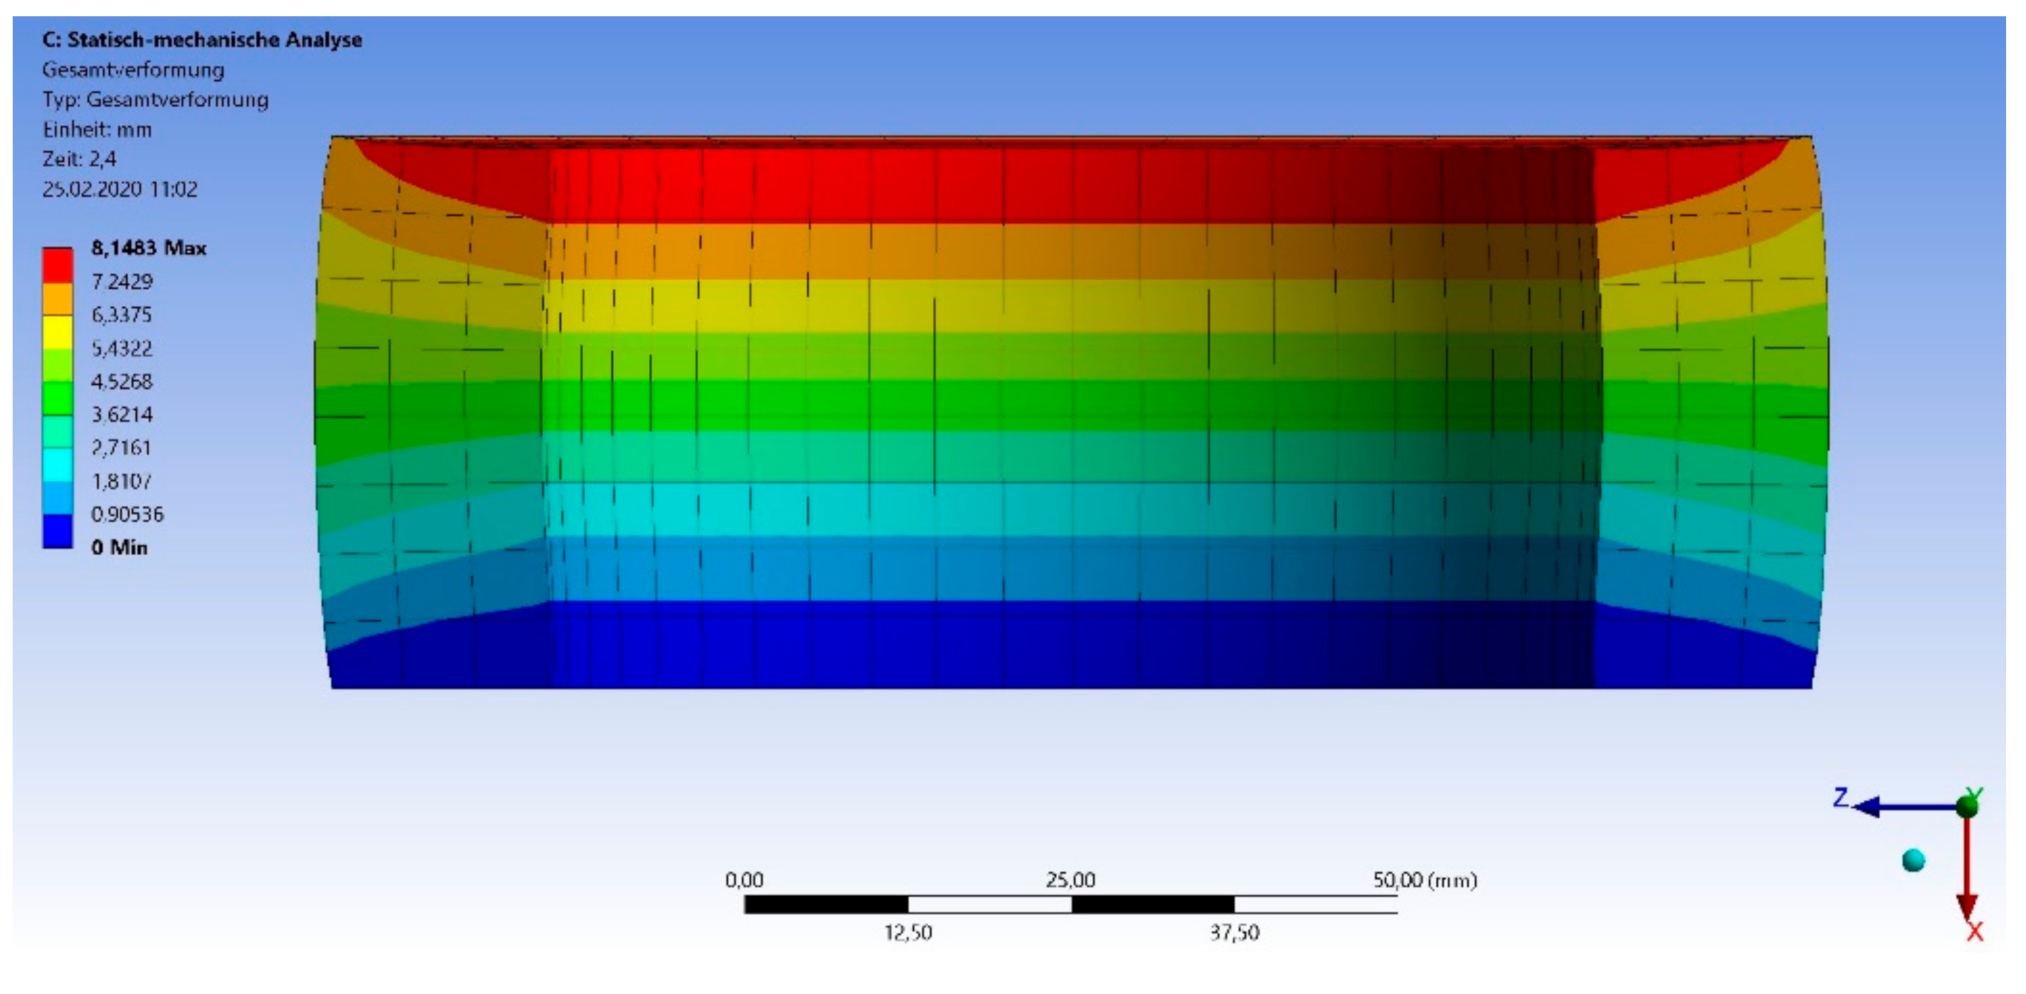
Fifthly, despite it is desirable, we believe that there is much work to do for being able to facilitate all impacts on deformation into the simulation. It is very difficult to perform simulations in such a way that they anticipate the practical deformation that will occur in advance. Reasons are that the modulus of elasticity of the materials at such high temperatures is unknown, the deformation behavior depends strongly on the grain size, and the contribution of thickness tolerances from sheet metal production with the size of the cross-section to be bonded as well as the contribution of the surface roughness to the deformation in detail is unclear. The coexistence of different material cross-sections in one component makes this task even more difficult.
Generally, an applicable and reliable design of the diffusion bonding process is desirable. To guarantee a reproducibly and successful diffusion bonding with limited deformation independent of the geometric constraints and layout, there are two ways:
First, the constant contact pressure should be temporarily increased to a level where the flow rate of the material is high. This is necessary to level thickness tolerances and surface roughnesses of multilayered parts and enlarge the contact area at the atomic level. Due to short dwell time, the overall deformation of the components is limited. Afterwards, the contact pressure should decrease to a level where the materials flow rate is very low. By maintaining the low contact pressure for a longer period, remaining pores are closed by grain boundary and volume diffusion.
Unfortunately, the materials flow rate depends on the geometric condition of the parts to be bonded and grain size. It is also subjected to changes due to the kind and content of alloying elements, changing the diffusion coefficient for different materials. In consequence, it is hard to estimate both levels of contact pressure.
Thereby, it seems advantageous to select the constant contact pressure in a range where only a moderate strain rate of the material applies. The deformation of roughness peaks and the expansion of the contact area on the atomic scale, on the other hand, occurs predominantly during the short-term peak load. This increased contact pressure should be chosen two to three times as high. During the predominant duration of the overall dwell time at lower contact pressure, atomic diffusion takes place, closing pores at a considerably lower volume diffusion coefficient. This is also the difference to the procedure proposed in [23,24,25]. The sole multiple application of peak loads does not necessarily lead to the filling of remaining pore spaces. Instead, longer dwell times are required between peak loads.
Secondly, this can be addressed by appropriate process control by setting a maximum permissible deformation in millimeters per program step. If a certain deformation is achieved, the next program step proceeds, regardless of whether the programmed dwell time has expired or not. By specifying two independent criteria (dwell time and deformation), excessive deformation can be avoided. At the same time, no specific deformation is forced to the part, but the deformation is effectively limited. A prerequisite for this is that the component to be diffusion bonded has a minimum height in relation to the resolution of the distance measuring accuracy during the bonding process.
In prospective research, we will systematically investigate the impact of temperature variations in steps of 20 K around 1075 °C and its impact on deformation as well as mechanical strength, e.g., yield strength, tensile strength and elongation to rupture as well. Furthermore, the dependence of the mechanical properties at a much lower bonding temperature and variation of contact pressure and contact pressure regimes will be evaluated.

Author Contributions

Conceptualization, T.G. and M.K.; methodology, T.G.; investigation, V.T., U.G., simulation, R.D.; data curation, T.G. and R.D.; writing—original draft preparation, T.G. and M.K.; writing—review and editing, T.G. and M.K.; visualization, T.G. and R.D.; supervision, T.G. and M.K. All authors have read and agreed to the published version of the manuscript.

Funding

The financial support from Helmholtz Program SCI (Storage and Cross-linked Infrastructure) is gratefully acknowledged.

Conflicts of Interest

The authors declare no conflict of interest.

Appendix A

Aspect ratio (AR): The ratio of height to diameter or material width.
For a sample of d = 80 mm and a height of h = 20 mm, AR = 80 mm/20 mm = 0.25
For “Annular 5”: AR = 20 mm/7.05 mm = 2.84
Thickness tolerance: Thickness tolerances were determined as range by the measurement of height at several points, namely five.
The sheet thickness during cold rolling of thin sheet material is not constant across the width due to the deflection of the rolls of the roll stand. It varies according rolling width and yield strength of a material (and the state of the art of the equipment used). This means that the thickness tolerance increases with the sheet size. For components that consist of a large number of thin layers of sheet metal, tolerances may add up or even out. This is not reasonably accessible from a metrological point of view. As a result, different percentage deformations are obtained for identical joining parameters for several parts. The vacuum tightness of such components will also vary.
Whereas the thickness tolerance of a layered sample before diffusion bonding is governed by manufacturing tolerances of cold rolling, after diffusion bonding, the impact of the stiffness of compression dies and lateral dimension of the part prevails.
Given relation in tables: Please, consider calculated and true values.
Percentage of material width related to 80 mm: The reduction of diffusion-bonded material width related to the circular sample of d = 80 mm were calculated.
Example for “Annular 5”: material width = 7.05 mm ≥ (7.05/80) × 100% = 8.81%
Reduction of material width related to previous Sample: Calculation of the reduction of the material width to the previous sample.
Example for “Annular 4”: material width of “Annular 4” = 8.28 mm, material width of “Annular 3” = 10.00 mm
Reduction = (10 mm − 8.28 mm)/10 mm) × 100% = 17.2%
Calculation of cross-section:
Example for “Annular 2”: π/4 * {(139.8 mm)2 − [139.8 mm – (2 * 12.4 mm)]2} = 4963 mm2
Deviation to 5026.6 mm2:
Example for “Annular 6”: (4868 mm2 − 5026.6 mm2)/5026.6 mm2 × 100% = −3.16%
Calculation of ratio thickness tolerance to d0 × 10−3: Result must be divided by factor of 1000 for 1000 µm/mm
Example for “Annular 3”: 218 µm/169.6 mm = 1.29
Ratio thickness tolerance to deformation:
Example for “Annular 1”: 0.142 mm/0.828 mm = 0.171
Calculation of deformation per material width:
Example for “Annular 6”: 11.79%/5.94 mm = 1.98%/mm
Calculation of deformation per material width normalized to AR = 1
Example for “Annular 3”: 5.35%/9.90 mm/1.97 = 0.274
Aspect ratio: AR was calculated from measured height (see Table 5) and real material width (see Table 6).
Example for “Annular 3”: AR = 19.533 mm/9.90 mm = 1.97
Calculation of deformation per material width: Calculation from deformation and true material width from Table 3.
Example for “Annular 5”: 10.47%/6.9 mm = 1.52

References

  1. DIN EN 10131, Kaltgewalzte Flacherzeugnisse: Grenzabmaße und Formtoleranzen; DIN Deutsches Institut für Normung e.V.: Berlin, Germany, 2006; pp. 1–4.
  2. Jahn, S. Technologieentwicklung zur Herstellung Variantenreicher Innen-Strukturierter Bauteile und Werkzeuge. Ph.D. Thesis, TU Ilmenau, Thuringia, Germany, 2007; pp. 28–70. [Google Scholar]
  3. Li, Z.; Zhao, B.; Shao, J.; Liu, S. Deformation behavior and mechanical properties of periodic topological Ti structures fabricated by superplastic forming/diffusion bonding. Int. J. Lightweight Mater. Manuf. 2019, 2, 1–30. [Google Scholar] [CrossRef]
  4. Paul, B.K.; Lingam, G.K. Cooling rate limitations in the diffusion bonding of microchannel arrays. J. Manuf. Processes 2012, 14, 119–125. [Google Scholar] [CrossRef]
  5. Zhang, C.; Li, H.; Li, M. Detailed Evolution Mechanism of Interfacial Void Morphology in Diffusion Bonding. J. Mater. Sci. Technol. 2016, 32, 259–264. [Google Scholar] [CrossRef]
  6. Moravec, J.; Novakova, I. The Selection of Appropriate Process Parameters of Diffusion Bonding in Hetereogeneous Weld of 355J2/AISI 316L Steels. Key Eng. Mater. 2017, 737, 101–106. [Google Scholar] [CrossRef]
  7. Thirunavukarasu, G.; Kundu, S.; Laha, T.; Roy, D.; Chatterjee, S. Chatterjee: Exhibition of veiled features in diffusion bonding of titanium alloy and stainless steel via copper. Metall. Res. Technol. 2018, 115, 115. [Google Scholar] [CrossRef]
  8. Simões, S.; Viana, F.; Ramos, A.S.; Vieira, M. Vieira: Microstructural Characterization of Dissimilar Titanium Alloys Joints Using Ni/Al Nanolayers. Metals 2018, 8, 715. [Google Scholar] [CrossRef] [Green Version]
  9. Saleh, M.; Khan, T.I.; Roven, H.J. Roven: Transient liquid phase bonding of AA-6063 to UNS S32304 using Cu interlayer. Procedia. Chem. 2016, 19, 517–524. [Google Scholar] [CrossRef] [Green Version]
  10. Gietzelt, T.; Toth, V.; Huell, A.; Dittmeyer, R. Determining the Dependence of Deformation during Diffusion Welding on the Aspect Ratio Using Samples Made of SS 304 (1.4301). Adv. Eng. Mater. 2017, 19, 1600344. [Google Scholar] [CrossRef] [Green Version]
  11. Zhang, C.; Li, H.; Li, M. Detailed analysis of surface asperity deformation mechanism in diffusion bonding of steel hollow structural components. Appl. Surf. Sci. 2016, 371, 407–414. [Google Scholar] [CrossRef]
  12. Gietzelt, T.; Hüll, A.; Tóth, V.; Messerschmidt, F.; Thelen, R. Impact of scratch depth on vacuum tightness of diffusion bonded parts. Mater. und Werkst. 2018, 49, 185–192. [Google Scholar] [CrossRef]
  13. Xie, B.; Sun, M.; Xu, B.; Wang, C.; Jiang, H.; Li, D.; Li, Y. Oxidation of stainless steel in vacuum and evolution of surface oxide scales during hot-compression bonding. Corrs. Sci. 2019, 147, 41–52. [Google Scholar] [CrossRef]
  14. Xie, B.; Sun, M.; Xu, B.; Wang, C.; Li, D.; Li, Y. Dissolution and evolution of interfacial oxides improving the mechanical properties of solid state bonding joints. Mater. Des. 2018, 157, 437–446. [Google Scholar] [CrossRef]
  15. Data Sheet of 1.4301 by Deutsche Edelstahlwerke GmbH, Auestr 4, 58452 Witten. Available online: https://www.dew-stahl.com/fileadmin/files/dew-stahl.com/documents/Publikationen/Werkstoffdatenblaetter/RSH/1.4301_de.pdf (accessed on 10 August 2020).
  16. Jauharai, I.; Ogiyama, H.; Tsukuda, H. Solid State Diffusion Bonding of Superplastic Duplex Stainless Steel with Carbon Steel. Mater. Sci. Res. Int. 2003, 9, 154–159. [Google Scholar] [CrossRef] [Green Version]
  17. Kundu, S.; Chatterjee, S. Diffusion bonding between commercially pure titanium and micro-duplex stainless steel. Mater. Sci. Eng. A 2008, 480, 316–322. [Google Scholar] [CrossRef]
  18. Habisch, S.; Chemnitz, T.U.; (Department of Mechanical Engineering, Technische Universität Chemnitz, Chemnitz, Germany). Personal communication.
  19. Pelster, R.; Pieper, R.; Hüttl, I. Thermospannungen—viel genutzt und fast immer falsch erklärt! PhyDid 2005, 1, 10–22. Available online: http://www.phydid.de/index.php/phydid/article/view/28 (accessed on 12 August 2020).
  20. Klasmeier, Kalibrier-und Messtechnik GmbH, Fulda. Available online: http://www.temperaturblog.de/2015/07/29/thermospannung-entsteht-am-temperaturgradient (accessed on 12 August 2020).
  21. Gulbransen, E.A.; Andrew, K.F. Andrew: A Preliminary Study of the Oxidation and Vapor Pressure of Chromium. J. Electrochem. Soc. 1952, 99, 402–406. [Google Scholar] [CrossRef]
  22. Plansee, S.E. Vapor Pressure of Chromium at Selected Temperatures. Available online: https://www.plansee.com/de/werkstoffe/chrom.html (accessed on 20 March 2020).
  23. Aktaa, J.; Basuki, W.; Norajitra, P.; Spatafora, L. Schichtverbund. Patent DE 10 2012 1090782 A1, 2012. [Google Scholar]
  24. Sharma, G.; Dwivedi, D.K. Effect of pressure pulsation on bond interface characteristics of 409ferritic stainless steel diffusion bonds. Vacuum 2017, 146, 152–158. [Google Scholar] [CrossRef]
  25. Wang, F.-L.; Sheng, G.; Deng, Y.-Q. Impulse pressuring diffusion bonding of titanium to 304 stainless steel using pure Ni interlayer. Rare Met. 2016, 35, 331–336. [Google Scholar] [CrossRef]
Figure 1. Schematic representation of the height measuring points of the samples. Left: Circular sample. Right: Annular sample.
Metals 10 01116 g001
Figure 2. Relation between material width and percentage of deformation at a constant height.
Metals 10 01116 g002
Figure 3. Characteristic shape of distortion of annular samples. Left: Overview. Right: Cross-section.
Metals 10 01116 g003
Figure 4. Simulation of the qualitative deformation of a ring-shaped sample of an aspect ratio close to three at room temperature.
Metals 10 01116 g004
Figure 5. Relation of deformation and related to the material width for Annular 1, 3 and 6, respectively, with an aspect ratio of approximately three.
Metals 10 01116 g005
Figure 6. (a) Diffusion bonding furnace with three sample thermocouples (TC) and debris. (b) Flaking precipitations at the cooled furnace wall.
Metals 10 01116 g006
Figure 7. SEM of the flaking precipitations of the furnace (Figure 6b) with areas of interest.
Metals 10 01116 g007
Figure 8. (a) Temperature profile of diffusion bonding experiment with new TC 1 for comparison to old thermocouples. (b) Expanded detail at setpoint temperature of T = 1100 °C.
Metals 10 01116 g008
Figure 9. EDX-measurements of thermocouple tip (top left), Pt-wire (top right) and Pt/10 Rh-wire (below).
Metals 10 01116 g009
Table 1. Composition of 1.4301 (AISI 304) [15].
ElementCCrMnNNiPSSi
Amount (wt %)≤0.0717.5–19.5≤2.0≤0.118–10.5≤0.045≤0.015≤1.0
Table 2. Design of annular test samples consisting of 10 layers (h = 20 mm).
Sampledi (mm)do (mm)Cross-Section (mm2)Width (mm)Percentage of Mat. Width Related to
80 mm (%)
Reduction of Mat. Width Related to the Previous Sample by (%)AR
Diameter 805026.6 ≙100 ≙1000.25
Annular 180113.145026.616.5720.7179.31.21
Annular 2115140.095026.612.5415.6824.31.59
Annular 3150170.005026.610.0012.5020.32.00
Annular 4185201.565026.68.2810.3517.22.42
Annular 5220234.095026.67.058.8114.92.84
Annular 6255267.255026.66.137.6613.13.26
Table 3. Geometric dimensions of annular samples related to a nominal cross-section of 5026.6 mm2. True cross-sections calculated from do and width.
Sampledi (mm)do (mm)Real Width (mm)Cross-Section (Real Width and do; mm2)Deviation to 5026.6 mm2 (%)
Diameter 79.9 5014−0.25
Annular 180.15112.916.204921−2.09
Annular 2114.8139.812.404963−1.26
Annular 3150169.69.904967−1.19
Annular 4185201.28.104914−2.24
Annular 5219.6233.66.904912−2.24
Annular 6254.4266.85.944868−3.16
Table 4. Geometric dimensions of annular samples with an aspect ratio of approximately three. Cross-section calculated using d0 and material width. Deviation related to 5026.6 mm2.
Sampledi (mm)do (mm)Real Width (mm)Number of LayersReal Height (mm)Cross-Section (mm2)ARDeviation to 5026.6 mm2 (%)
Annular 180.15112.9016.302446.93149472.88−1.59
Annular 3150169.609.801529.23349202.98−2.12
Annular 5219.6233.606.901019.52149142.83−2.24
Annular 6254.4266.806.15917.6250362.87+0.19
Table 5. Thickness tolerance before and after diffusion bonding and deformation for samples made of 10 layers.
SampleHeight before (mm)Thickness Tolerance (µm)Height after (mm)Thickness Tolerance (µm)Ratio Thickness Tolerance to do × 10−3Deformation (mm)Ratio Thickness Tolerance to DeformationFurnace
Diameter 80 mm19.4881119.19831.040.2980.279II (200 kN)
Annular 119.4972918.6691421.260.8280.171II
Annular 219.5072318.6291751.250.8780.199II
Annular 319.5332918.4872181.291.0460.208II
Annular 419.5014217.6121430.711.8890.076III (2 MN)
Annular 519.5213617.4761050.452.0450.051III
Annular 619.5614117.2541450.542.3070.063III
Table 6. Deformation of samples related to material width and aspect ratio.
Sampledi (mm)do (mm)Real Width (mm)Deformation (%)Deformation per Mat. Width (%/mm)Deformation per Mat. Width Normalized to AR = 1 (%/mm)AR
Diameter 79.9 1.530.0190.0790.24
Annular 180.15112.916.204.250.250.2101.20
Annular 2114.8139.812.404.500.360.2311.57
Annular 3150169.69.905.350.540.2741.97
Annular 4185201.28.109.691.200.4972.41
Annular 5219.6233.66.9010.471.520.5362.83
Annular 6254.4266.85.9411.791.980.6033.29
Table 7. Deformation of selected annular samples with an aspect ratio of three.
SampleHeight before (mm)Height after (mm)Thickness Tolerance (µm)Thickness Tolerance Related to Deformation (%)ARDeformation (%)Deformation per Mat. Width (%/mm)
Annular 1AR 346.93139.0002403.032.8816.901.04
Annular 3AR 329.23324.5381813.862.9816.061.64
Annular 519.52117.4761055.132.8310.471.52
Annular 6AR 317.62014.5471434.652.8717.442.84
Table 8. Deformation and correlation with constant heating power per heating zone for eight subsequently diffusion-bonded parts of identical design.
Part-No. Deformation (%)Heating Power per Heating Zone (kW)
12.8219.3
23.1519.4
33.820.0
43.5619.9
53.9320.4
63.9620.8
74.3620.8
84.3320.6
Table 9. Composition of precipitation (Figure 6, right), determined by EDX. Elements marked with * were manually added.
Spot 1Spot 2Spot 3
Elementwt %Elementwt %Elementwt %
C *1.16C *1.07C *1.07
O *7.4O *7.04O *7.35
Na2.47Na2.37Na2.52
Si *0.24Si *0.28Si *0.27
S0.95S0.95S0.93
Cr3.67Cr3.53Cr3.48
Mn64.97Mn65.24Mn65.11
Fe7.51Fe7.37Fe7.4
Ni *1.00Ni *1.12Ni *1.27
Cu7.58Cu8.05Cu7.52
Sn3.04Sn3.00Sn3.08
99.99 100.02 100.0
Table 10. EDX-measurements on the tip, Pt- and Pt/10%Rh-wire of thermocouple, respectively. Chemical elements marked with * were added manually as known constituents or impurities. (a) Tip of TC. (b) Pt-wire. (c) Pt/Rh10-wire.
(a)
Spot 1Spot 2Spot 3Spot 4Spot 5
Elementwt %Elementwt %Elementwt %Elementwt %Elementwt %
O *17.44O20.33O21.57O20.16O22.03
Ca *0.07Mg0.32Mg *0.15Mg *0.07Al *0.61
Cr8.09Al1.45Al *0.72Al0.55Si *0.18
Mn *0.91K *0.22Si *0.22Si *0.18Ca *0.41
Fe7.59Ca1.61K *0.38Ca0.82Cr8.42
Cu7.21Cr10.26Ca0.56Ti0.24Mn *2.64
Rh *0.09Mn *1.38Cr8.69Cr5.86Fe11.33
Pt58.60Fe10.1Mn *1.09Mn *1.09Ni *2.4
100Cu7.99Fe8.93Fe7.81Cu7.14
Rh *0.12Cu5.71Ni *1.43Rh4.47
Pt46.22Rh *0.66Cu6.68Pt40.37
100Pt51.31Rh *1.92 100
99.99Pt53.19
100
(b)
Spot 1Spot 2Spot 3
Elementwt %Elementwt %Elementwt %
Cu *0.41Cu *0.43Cu *0.01
Rh/Rh/Rh0.25
Pt99.59Pt99.57Pt99.74
100 100 100
(c)
Spot 1Spot 2Spot 3
Elementwt %Elementwt %Elementwt %
O *4.9O *5.59O *6.07
Cr *1.03Cr *1.09Cr *0.81
Fe *0.50Fe *0.28Fe *0.35
Ni *0.28Ni *0.03Ni *0.47
Cu *0.73Cu *0.97Cu *0.48
Rh8.50Rh8.36Rh8.13
Pt84.06Pt83.67Pt83.69
100 99.99 100

