Abstract
This paper reviews state of the art laser powder bed fusion (L-PBF) manufacturing of γ′ nickel-based superalloys. L-PBF resembles welding; therefore, weld-cracking mechanisms, such as solidification, liquation, strain age, and ductility-dip cracking, may occur during L-PBF manufacturing. Spherical pores and lack-of-fusion voids are other defects that may occur in γ′-strengthened nickel-based superalloys manufactured with L-PBF. There is a correlation between defect formation and the process parameters used in the L-PBF process. Prerequisites for solidification cracking include nonequilibrium solidification due to segregating elements, the presence of liquid film between cells, a wide critical temperature range, and the presence of thermal or residual stress. These prerequisites are present in L-PBF processes. The phases found in L-PBF-manufactured γ′-strengthened superalloys closely resemble those of the equivalent cast materials, where γ, γ′, and γ/γ′ eutectic and carbides are typically present in the microstructure. Additionally, the sizes of the γ′ particles are small in as-built L-PBF materials because of the high cooling rate. Furthermore, the creep performance of L-PBF-manufactured materials is inferior to that of cast material because of the presence of defects and the small grain size in the L-PBF materials; however, some vertically built L-PBF materials have demonstrated creep properties that are close to those of cast materials.
1. Introduction
The quest for higher efficiency jet engines and land-based gas turbines has necessitated the use of materials that can withstand the mechanical stress of operating at extremely high temperatures [1]. Nickel-based superalloys are suitable for turbine blade applications where they confer resistance to creep, fatigue, and oxidation and protect against corrosion [1]. Although additional creep resistance benefits can be gained with γ′ nickel-based superalloys, they come at the cost of processability. For superalloy development, mechanical properties must be balanced with processability [2]. An example of a processing difficulty is that alloys with a high volume fraction of γ′ are susceptible to cracking during welding. Weldability is attributed to the content of Al and Ti. When the Al + Ti content exceeds approximately 4.5 wt.%, the alloy is considered to be nonweldable [3]. Table 1 displays the composition of Alloy 247LC (where “LC” means “low carbon”), one of the alloys reviewed in this paper. The Al + Ti content is 6.3 wt.%, placing this material into the nonweldable range according to [3]. Similarly, Alloy 247, Inconel 738LC, and 939 are also in the nonweldable range (Table 1). The Al + Ti content of Waspaloy is 4.2 wt.%; therefore, it is weldable, according to [3]. Laser powder bed fusion (L-PBF) is of interest for the manufacture of turbine blades using γ′-strengthened nickel-based superalloys. Turbine blades have intricate designs with internal cooling channels and geometrical constraints that L-PBF is adequately suited to address. Such geometry can be difficult, or even impossible, to achieve by conventional manufacturing [4]. For example, the processing of turbine blades from Alloy 247 has historically been challenging [5]. L-PBF has demonstrated potential in such applications. However, processability challenges with γ′ are similar to those that occur in welding. In this paper, processability is discussed from the perspective of producing parts that are defect-free and have suitable microstructural and mechanical properties. A search of literature published from the year 2000 to the present, displayed in Figure 1, yielded few publications on powder bed fusion (PBF; using laser and electron beam energy sources) of superalloys. In comparison, publications on PBF or superalloys are numerous. A search for publications on PBF with γ′ nickel-based superalloys produced so few results that their presence is barely evident in the chart. After a detailed search, 36 publications where L-PBF was used to manufacture γ′ nickel-based superalloys were found. These superalloys were reviewed in the present work and their nominal compositions are listed in Table 1. Despite the high-temperature strength of γ′ superalloys and the importance of their potential applications, the problems encountered during processing may be responsible for the paucity of publications to date. Most publications on PBF of superalloys involve Alloy 718, as seen in the bottom of Figure 1. Alloy 718 is primarily strengthened by γ″ (therefore, Alloy 718 is not reviewed in this paper) and is relatively easy to process [6].

Table 1.
Nominal compositions (wt.%) of γ′-strengthened nickel-based superalloys [1,3,5,7].
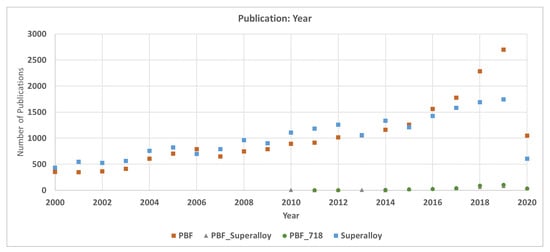
Figure 1.
Literature search showing the number of publications on powder bed fusion (PBF), superalloys, PBF of superalloys, and PBF of Alloy 718.
2. Laser Powder Bed Fusion
2.1. Overview
L-PBF belongs to a class of additive manufacturing (AM) processes called “powder bed fusion” [8]. A laser beam melts a thin layer of powder on the surface of a substrate or a previously formed powder layer. The melting is performed such that single tracks are formed on each layer in a predefined pattern. Successive layers are melted vertically, forming the required part. The densification and properties of the part depend on single tracks and layer-by-layer formation [9,10]. The thermal history of a single track, the microstructure, and subsequent part properties are governed by several process parameters, including scan speed, power, and hatch distance. Optimized process parameters are required to produce acceptable parts [8]. In industry, knowledge of the process parameters and material interactions is needed to fabricate parts with the required properties. Navrotsky et al. [4] postulated that such knowledge is not readily available. The processing window is limited, and optimization is difficult to achieve [10]. Hence, the industrial capability for processing materials with AM is limited by the lack of process parameter knowledge. Adequate process parameter knowledge ensures that AM processes are optimized in terms of speed, tolerances/surfaces, and strength so that the industrial quality standards for these materials are achieved [4]. To understand the influence of different process parameters on the L-PBF process, a term that encompasses the combined effects of vital process parameters into one measurable unit is “energy density,” which has been employed in many studies [11,12,13]. The energy density equation is as follows:
2.2. Heat Source and Material Interaction in the L-PBF Process
The chosen process parameters contribute to the amount and manner of heat transfer during the laser scanning process. Laser melting occurs by different heat transfer mechanisms and material physics. The transfer of energy from the laser photon electromagnetic field to free electrons during the scanning process and, ultimately, to other electrons and lattice defects in the powder was explained by Yadroitsev [9]. A typical powder bed consists of solid powder particles in contact with each other. Air or protective gas can exist between powder particles. After interacting with the laser, the solid particles become molten. Heat is transferred through all phases (liquid, solid, and gas) by a combination of radiation, conduction, and convection.
High thermal gradients are involved in L-PBF manufacturing and influence the resulting microstructures and properties of the built materials. This relationship is well known in welding. Debroy et al. [14] compared AM processes to welding and reported that a melt pool following the direction of a traveling heat source is a characteristic of both AM and welding. The thermal cycles differ spatially, and these differences influence the microstructure and subsequent properties achieved. The microstructure is inhomogeneous and depends on the thermal cycles that are operating at each location. The melt pool is typically smaller in L-PBF relative to welding; this explains why it is difficult to slow the cooling rate in L-PBF processes. For example, some reports indicate that typical cooling rates during laser welding are [15], whereas those during L-PBF are [16]. Welding also differs from L-PBF in terms of interaction materials; solid metals are used for welding, and powder is used for L-PBF processes [14]. This distinction influences the characteristics of the thermal cycles in L-PBF because the conductivity of powder is lower than that of the solid substrate. This is illustrated by the temperature profiles of single tracks that are melted on a substrate and a powder bed displayed in Figure 2 [17]. The solid substrate conducts heat much faster than the powder bed. Therefore, the cooling rate near the substrate is faster than it is higher in the build because heat is more readily released into the substrate. When successive single tracks are melted, the temperature distribution can be described according to the example displayed in Figure 3. A simulation placed five single tracks (10 mm) side-by-side with a hatch distance of 75 µm [17]. The melting point is indicated by . Let point “X” be the start of the melting of the single Track 2 after the single Track 1 was melted. Temperature measurements at a point “X” in the melting of the single Track 2 indicate that temperature is at its peak. This is followed by rapid cooling as the melting of the track progresses and the temperature at point “X” drops to its lowest value when the laser is at the end of the track. As time progresses and as the melting of subsequent single tracks (Tracks 3, 4, and 5) ensues, position “X” is subjected to similar temperature cycles, albeit with lower temperature peaks. Such temperature peaks may be above or below the melting temperature. Similar profiles are followed by the temperature measurements at the start of Tracks 1, 3, 4, and 5. The implication is that the microstructure formed in the initial melt is transformed by reheating [14]. In summary, high thermal gradients, fast cooling rates, and spatially variable thermal cycles are distinctive characteristics of AM processes. These data confirm that complex microstructures form and influence the final properties of parts that are fabricated with L-PBF.
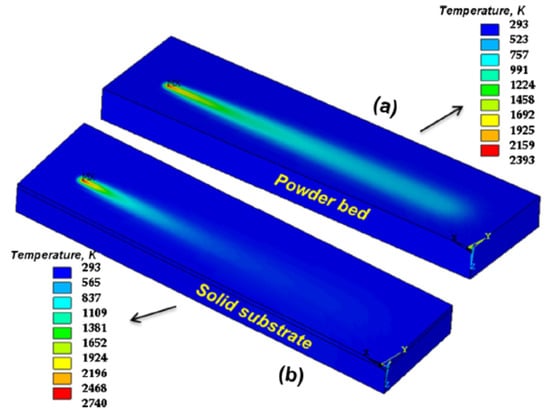
Figure 2.
Temperature distribution of a single track that was melted on (a) a powder bed and (b) a solid substrate. Reproduced from [17], with permission of Elsevier.
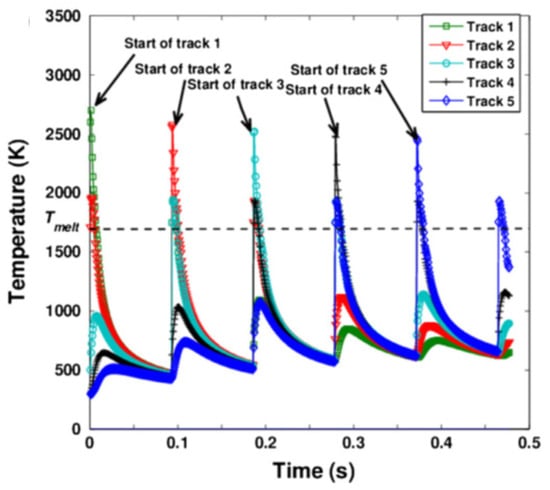
Figure 3.
Temperature distribution of five single tracks positioned side-by-side during the sequential melting of each track. Reproduced from [17] with permission of Elsevier.
3. Defects Occurring from L-PBF of γ′ Nickel-Based Superalloys
3.1. Overview of Cracking and Porosity
For γ′ nickel-based superalloys, cracks are expected to be the predominant defect during L-PBF processing as in welding. Cracking causes adverse consequences because it decreases the dimensional accuracy, ductility, and strength of the AM components [18]. The cracking phenomena that occur in the welding of γ′ nickel-based-superalloys are different; however, the underlying mechanisms are likely to occur during L-PBF. Cracking mechanisms include the following:
Solidification cracking: This cracking occurs in the mushy zone of the solidifying melt pool [19,20]. Cracking is attributed to the presence of a liquid film in the last solidifying melt pool and residual stress. Susceptibility to solidification cracking increases as the range of solidification temperature widens. Different theories, such as Pellini’s strain theory, the shrinkage-brittleness theory, and Borland’s generalized theory, have been used to explain this cracking mechanism [21,22,23]. Several metallurgical factors influence susceptibility to solidification cracking, including the amount of liquid and its distribution, primary solidification mode, the surface tension of the grain boundary liquid, and grain structure [6].
Liquation cracking: Unlike solidification cracking, liquation cracking occurs in the heat-affected zone outside the melt pool [24]. This zone is exposed to a temperature less than the liquidus temperature of the base metal but high enough to cause local melting of the grain boundary constituents [6,25,26,27]. This exposure reduces ductility, which, coupled with stress, can lead to cracking. The propensity for liquation cracking decreases as heat input decreases.
Strain age cracking (SAC): Postweld heat treatment (PWHT) plays a dual role in restoring the microstructure and inducing stress relief. When stress relief occurs in conjunction with precipitation hardening, high strain levels are induced that lead to cracking [6]. Precipitation hardening is associated with reduced ductility, which aggravates SAC. This mechanism is also observed during repair welding.
Ductility-dip cracking (DDC): This is similar to SAC [28]; however, a decrease in ductility is not a result of precipitation hardening; instead, it occurs because of the intense strain concentration at grain boundary triple points caused by grain boundary sliding. DDC occurs at temperatures below the solidus temperature [19].
Different types of pores exist in L-PBF components. They are described in the following:
Spherical pore: This type of pore is associated with the powder material, where a gas atomization process introduces a pore. The ability to produce highly dense parts is jeopardized if the quality of the powder is poor. Divya et al. [29] attributed the porosity that is observed in L-PBF of Alloy 247LC to entrapped gases that are released during melting. Pores can also form when shielding gas is trapped in the powder [14]. Pores due to entrapped gases are typically spherical in shape.
Lack-of-fusion: These are voids found in L-PBF components and are due to low energy input to the process. These voids occur because a new layer fails to bond correctly with the previously formed layer or substrate [14]. Low energy melts only a small amount of liquid, which has poor wettability [30]. Lack-of-fusion voids have a higher aspect ratio compared with gas pores and may have sharp edges. Micrographs of as-built samples of L-PBF-manufactured Alloy 247LC studied by the present authors are presented in Figure 4 and display pores and lack-of-fusion voids. In the light microscopy (LM) micrograph in Figure 4a, a spherical gas pore and lack-of-fusion defect are indicated.
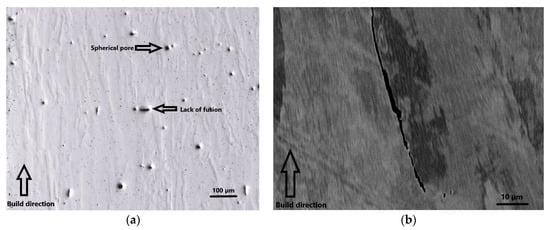
Figure 4.
Laser powder bed fusion (L-PBF)-manufactured Alloy 247LC: (a) light microscopy (LM) image of lack-of-fusion and spherical pores; (b) SEM image of grain boundary crack.
Keyhole pore: This type of pores is also commonly observed in AM. Keyhole pores arise because of instability during high power density processing, which is typical in keyhole mode operations. Such instability may collapse the keyhole and form a pore [14].
3.2. Influence of Process Parameters on Cracking and Porosity
Cracks found in L-PBF γ′ nickel-based superalloys are related to the energy density. Figure 4b displays a crack that was observed with scanning electron microscopy (SEM). The crack is along a grain boundary parallel to the build direction. The effect of energy density on the densification of L-PBF manufactured parts is similar among nickel-based superalloys because their compositions are similar, and they exhibit similar laser absorption, reflectivity, and conductivity [12]. A study was undertaken to investigate the effects of energy density on densification and crack propensity after L-PBF of nickel-based superalloys. The nickel-based superalloys investigated included Alloy 247LC and CMSX 486. An energy density of 85 was determined as the threshold level where full densification occurred (densification was calculated by subtracting the percent porosity from 100%) [13]. This energy density value can be used as a guide when choosing possible process windows in optimization studies. Earlier work by Carter [31] evaluated the effects of process parameters on crack density and porosity of Alloy 247LC. Cuboidal samples (10 mm × 10 mm × 10 mm) were manufactured with Concept Laser M2 equipment (Concept Laser, Lichtenfels, Germany) using power values ranging from 150 to 200 W, scanning speeds ranging from 400 to 2000 mm/s, and dimensionless hatch distance values ranging from 0.2 to 0.53. When cracks and porosity were characterized in vertical sections, a trend of decreasing crack density with increasing scanning speed or decreasing power was observed. An increase in scanning speed or a decrease in power corresponds to a decrease in energy density (refer to Equation (1)). The study determined that the mechanism of cracking and pore type correlated with energy density input. At high energy density input, solidification cracks and rough pores appeared because the high energy density vaporized certain elements. At medium energy density input, cracking appeared to be due to DDC or liquation cracking, and the pores were smoother. At low energy density input, lack-of-fusion defects were observed. The small hatch distance reduced the porosity but increased the cracking. A small hatch distance increases the energy density, as seen in Equation (1). The “optimal” process parameters, which caused the least number of cracks, were at a scanning speed, laser power, and an absolute dimensionless hatch distance of 1500 mm/s, 150 W, and 0.2, respectively [31]. The influence of process parameters on the porosity and cracking density in CMX 486 showed trends similar to those seen in Alloy 247LC [31]. These studies each concluded that it was impossible to eliminate cracks at the investigated process parameters. As highlighted earlier, Alloy 247LC is considered to be a nonweldable alloy; therefore, it is not surprising that the L-PBF-manufactured material contained cracks at the investigated process parameters. Process parameter optimization alone may not eliminate cracks [19]. Lippold [19] stated that the metallurgical properties of an alloy also influence cracking. Therefore, investigation of the metallurgical properties of the alloys was recommended to identify the root cause of the cracks. Such a metallurgical investigation of the effects of segregated elements and the solidification temperature range on cracking was conducted by Cloots et al. [32] and is discussed in Section 3.6. Instead of merely optimizing process parameters, finding a solution to cracking and pore formation should also include alloy modification. Cloots et al. also investigated the effect of process parameters on cracking in L-PBF of Inconel 738LC. An increase in scanning speed decreased the crack density; however, it led to an increase in the total porosity. This observation agrees with research done by Carter [31]. In the Cloots et al. study, evidence suggested that solidification cracking was the predominant cracking mechanism. Cracks were primarily observed in large-angle grain boundaries parallel to the build direction (i.e., the x-z plane) and reached 100 µm in length. In the plane parallel to the laser scans (i.e., the x-y plane), cracks were transverse to the plane of laser movement. Perevoshchikova et al. [33] achieved <0.5% porosity and decreased the number of microcracks by using a medium scanning speed and small hatch spacing parameters in L-PBF of Inconel 738LC. A high scanning speed produced lack-of-fusion defects between the melted track and the layer beneath. A large hatch spacing also produced lack-of-fusion defects. L-PBF of Alloy 247LC was researched by Divya et al. [29] and revealed that pores ranging from 0.5 to 20 µm occupied 0.013% of the sampled area. This study demonstrated that cracks along cell boundaries were prevalent. Although Carter [31] proposed that DDC was one mode of cracking, Divya et al. [29] and Rickenbaucher et al. [34] rejected this proposal, proposing instead that solidification or liquation cracking were possible cracking mechanisms. In L-PBF of Waspaloy, the porosity decreased with an increase in energy density until vaporization occurred, which increased the amount of porosity [35]. This finding is similar to that of Carter [30]. A density of 99.7% was obtained for the optimized process parameters, and crack formation appeared to decrease as a result [35]. A common finding among these studies was that although high densification was achieved in L-PBF, cracks were still prevalent. A high energy density (either through high power, low scanning speed, or small hatch distance) produced high densification. However, high energy density also increased crack density. Low energy density had the opposite effect: high porosity and low crack density. The evidence presented strongly supported solidification cracking, although liquation cracking or DDC were also possible.
3.3. Influence of Laser Scanning Strategy on Cracking
Although energy density and its inherent process parameters influence densification and crack density, scanning strategies also have a significant effect. A scanning strategy controls the scanning pattern and maintains a uniform heat distribution during processing. A well-designed scanning strategy can reduce the high residual stress that occurs during L-PBF [29,31,36]. Residual stress influences crack formation, as discussed later in Section 3.4. Carter [31] used an “island scanning strategy.” Island scans are long vectors or raster scans at millimeter-scale that are parallel to each other in a designated area. The scan vectors in an adjacent area are perpendicular to those in the neighboring area. Different areas lie within a larger area whose perimeter is contour scanned. An example of an island scanning strategy is shown in Figure 5. Carter shifted the whole island scan area 1 mm (in the x- and y-directions) in the next build layer. Carter attempted to use island scans to mitigate crack formation, but the effort did not yield the desired result. The island scanning strategy was responsible for a large scatter in the results of crack density measurements for L-PBF-manufactured Alloy 247LC and CMX 486 using various process parameters [31]. The island scans caused the crack density to vary (for the same process parameter set) at different cross-sections. The heat transfer during the island scanning led to the formation of a bimodal grain structure, which affected the crack density. Aspects of this grain structure are explained in Section 4.1. Carter compared a meander scanning strategy of back and forth scan movements with an island scanning strategy. Meander scans are parallel to one another and occupy a single area. The crack density in an area subjected to a meander scan was lower than that in an island-scanned area. The island scanning strategy was described by Smith et al. [36] to be less effective in achieving high bulk density compared with a fractal scanning strategy that is also known as the “Hilbert and Peano-Gosper curve,” as shown in Figure 6. Fractal scans are short vectors at the micrometer scale. They are scanned continuously, yet the direction changes over the designated area. The length of the fractal scans ranged between 100 and 300 µm. When these scanning strategies were compared during L-PBF manufacturing of Alloy 247LC, the fractal scanning strategies yielded remarkably higher bulk densities than the island scanning strategy. However, the difference in crack density was not substantial [36]. However, the mode of crack propagation was found to differ. The cracks followed the scanning vector direction with island scans, whereas with fractal scans, the cracks were either parallel or at an angle to the scan vectors. The role of scanning strategy in influencing the thermal cycle, reducing porosity, and cracking is significant; therefore, variants of scanning strategies have been explored for L-PBF manufacturing with γ′ nickel-based superalloys. Divya et al. [29] used a scanning pattern that followed a particular direction in one layer and was then rotated 67° in subsequent layers. A cross-hatched unidirectional scanning pattern was used by Cloots et al. [37] and Mumtaz et al. [35] for L-PBF with Inconel 738LC and Waspaloy, respectively.
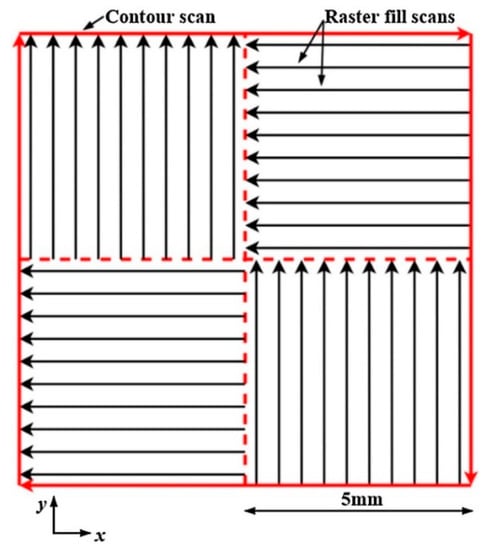
Figure 5.
An island scanning strategy where the raster fill scans in each area are perpendicular to one another [36], used under CC BY 4.0.
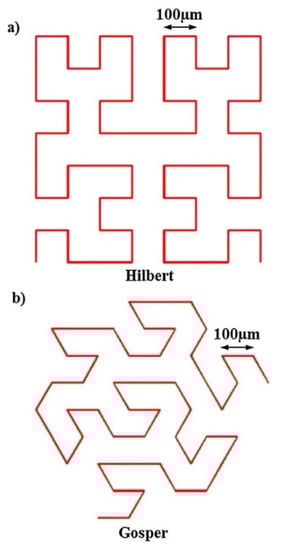
Figure 6.
The Hilbert (a) and Gosper (b) fractal scanning strategies showing the patterns of the micrometer length scans [36], used under CC BY 4.0.
3.4. Influence of Stress on Cracking
L-PBF-manufactured material experiences temperature gradients that are influenced by the material, process parameters, and scanning strategy. The temperature gradients permit nonuniform heating and cooling that subsequently produce thermal and residual stress [14]. Other factors that influence residual stress formation include variations in the coefficient of thermal expansion and an uneven distribution of inelastic strains [14]. Because residual stress contributes to crack formation, it is important to understand the development of stress during L-PBF of γ′-strengthened nickel-based superalloys. However, few studies have investigated residual stress during L-PBF of γ′-strengthened nickel-based superalloys. The mechanism by which thermal and residual stress influence cracking in Alloy 247 was investigated in detail by Lee et al. [38]. The manufacturing method in this study was electron beam powder bed fusion (EB-PBF). EB-PBF is comparable to L-PBF; the difference is that the powder bed is heated and maintained at approximately 1000 °C in EB-PBF. Cylindrical specimens with a diameter of 7.5 mm were fabricated. The specimens were oriented at 30°, 40°, 45°, and 50° relative to the z-axis (build direction). Cracks were located on the left side of the specimen; the right side was primarily crack-free. Lee et al. [38] proposed that cooling occurred faster on the left side of the specimen, as shown in Figure 7. The specimen orientation was such that heat dissipated through the specimen on the left side, but heat dissipated through the powder on the right side. The powder has a lower conductivity than bulk material, which explains why cooling occurred faster on the left side [38]. Numerical models were employed to determine the temperature and thermal stress distributions on the x-y plane of the specimen, and the results are displayed in Figure 7. The surface temperature distribution and thermal stress were inhomogeneous, as shown in Figure 8a,b, respectively. Lee et al. [38] showed that as the orientation angle increased, the thermal stress became more inhomogeneous. The thermal stress distribution exhibited tension on the left side of the specimen and compression on the right side. Scheil-Guliver calculations were made within ThermCalc to determine the solidification temperature range. A critical temperature range (CTR) was subsequently determined. The CTR used was a temperature range in which a solid fraction of 0.7 to 0.98 was formed. Within this CTR, the material was prone to hot cracking. The CTR was plotted on the x-y plane, as shown in Figure 8c. Lee et al. [38] showed that cracking occurred in the x-y plane, where the CTR intersected the high tensile stress on the left side of the specimen. After solidification, the alloy continued to cool, but the residual stress still caused cracking. In EB-PBF, the residual stress was small because the powder bed was preheated to approximately 1000 °C, thereby lowering the thermal gradient [38,39]. In L-PBF, there was no preheating, and the residual stress was high. Consequently, cracking was more predominant in L-PBF than in EB-PBF. The residual stress in the x-z plane in the z-direction (build direction) was investigated in Chauvet et al. [39]. The investigators manufactured samples (23 mm× 23 mm× 30 mm) from a nonweldable superalloy by EB-PBF. No cracks were observed at heights of less than 12 mm in the z-direction. Cracks were observed between 12 and 30 mm in the z-direction, and these cracks were located in high angle grain boundaries, indicating that tensile stress was present in the top layer. This layer was unable to shrink due to the restrictive force of the solidified layers below. The presence of tensile stress in the top layer can cause solidification or liquation cracks. Chauvet et al. [39] postulated that the stress was lower at the bottom of the build and increased in the z-direction. The cracking started when a critical tensile stress level was reached. Typically, in AM of thin-wall tracks, tensile stress is found in top layers, and the tensile stress levels increase as the number of layers increases [40,41,42,43,44,45]. Shiomi et al. [45] suggested that a top layer has high residual stress because it is subjected to low iterative thermal conditions necessary for stress relaxation. The ratio of residual stress to yield stress in AM of nickel-based superalloys at room temperature exceeded those of Ti-6Al-4V and stainless steel [14]. This suggests that nickel-based superalloys processed by L-PBF may display high residual stress compared with other materials. A strain gauge measurement of the residual stress of Alloy 247LC manufactured by L-PBF was conducted by Boswell et al. [46]. The von Mises stress near the substrate was 1134 MPa. The yield stress in L-PBF of Alloy 247LC measured by Wang et al. [47] was 792 MPa. A comparison of the two values indicated that the von Mises stress exceeded the yield stress. Cloots et al. [32] reported that the residual stress in L-PBF-manufactured Inconel 738LC reached 95% of the yield stress. Zhao et al. [48] simulated thermal and residual stress in L-PBF single tracks of the nickel-based superalloy GH4169. The calculated von Mises stress equivalent was 326 MPa at the hatch region, where a single track crossed the previous track. At this location, the von Mises stress was severe and approached the yield stress of the material. This was caused by the high thermal gradient of the liquid melt on a previously solidified layer [48]. The stress distribution also displayed high values of tensile stress at the location where the laser scan changed direction from one single track to form the neighboring single track.
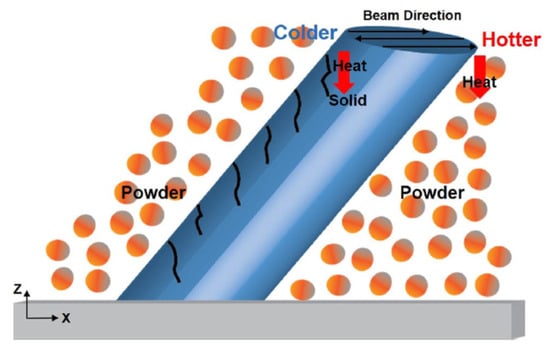
Figure 7.
Schematic diagram of an electron beam powder bed fusion (EB-PBF) cylindrical specimen at an incline on the substrate. Heat is dissipated through the specimen on the left-hand side and the powder on the right-hand side. Consequently, colder and hotter regions are obtained on the left- and right-hand sides, respectively. Reproduced from [38], with permission of Springer Nature.
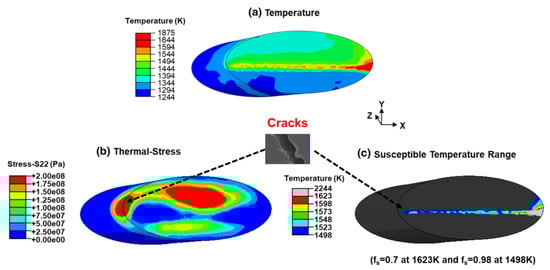
Figure 8.
Distribution of (a) temperature, (b) thermal stress, and (c) critical temperature range (CTR) on the x-y plane in EB-PBF with Alloy 247. On the left side, the CTR is intercepted by high thermal stress, and the formation of hot cracks is predicted. Reproduced from [38], with permission of Springer Nature.
3.5. Influence of Powder Composition on Porosity and Cracking
Engeli et al. [49] investigated the influence of different Inconel 738LC powder batches on the formation of pores and cracks during L-PBF manufacturing. Eight powder batches of Inconel 738LC were used for manufacturing cuboidal samples (15 mm × 10 mm × 10 mm) by L-PBF. Seven batches were gas atomized (GA) powders, and one batch was water atomized (WA) powder. The same process parameters were used (these process parameters had been optimized for one of the batches). The batches were categorized in terms of the particle size distribution (PSD), morphology, and chemical composition. The processability in terms of porosity and crack density was evaluated for each batch. The results showed that highly dense specimens with porosities less than 1.2% for GA powder batches were formed. The porosity for the WA powder batch was 3.5%. The flowability, as calculated by the Hausner ratio (a ratio of tapped and apparent density), affected the porosity. A low Hausner ratio (i.e., having good flowability in the powder) resulted in better recoating and less porosity. The WA powder displayed irregular morphology and poor flowability, so it performed more poorly than the GA powder during recoating. These characteristics could have also caused the higher porosity observed in materials fabricated with the WA powder. The influence of PSD on the porosity and crack density was insignificant. The chemical composition of the powder batches influenced the crack density. The eight powder batches had chemical compositions that deviated from the nominal composition of the powder. The crack density in the batches was plotted against the concentrations of each element, and a linear regression was derived. The coefficient of determination, , was estimated to evaluate the correlations between the crack density and each element. Si displayed the strongest correlation to the crack density as displayed in Figure 9 [49]. Si is a residual element in Inconel 738LC. The Si composition in each powder batch varied between 0.018 and 0.212 wt.%. Carter [31] stated that Si should be limited in a nominal composition of Alloy 247LC to a maximum of 0.03 wt.%. The powder used in reference [31] had a Si composition of 0.04 wt.%, but this was considered a negligible variation that would not be detrimental to processability. Harris et al. [5] found Si in regions around cracks in cast Alloy 247 and recommended a maximum concentration of 0.03 wt.% [5]. Si widened the solidification temperature range [50] and increased the cracking susceptibility. Engeli et al. [51] proposed that alloy compositions should be optimized for AM and that such optimizations should be based on a knowledge of the AM processability of various alloy compositions.
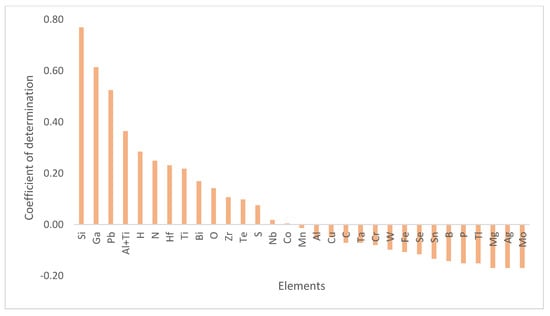
Figure 9.
The plot of the coefficient of determination () of various elements. The coefficient of determination was calculated from a linear regression that modeled the correlation of crack density with the concentration of each element. The plot shows that Si has the largest value which means that Si has the strongest correlation to crack density. Replotted from [49].
3.6. Influence of Solidification on Cracking
Other studies investigated the solidification behavior and elemental partitioning that cause cracking. In Cloot et al. [32], Scheil-Guliver calculations indicated a low solidus temperature of 682 °C and a wide critical temperature range (CTR). Calculations also showed that immediately above this solidus temperature, the formed liquid contained approximately 28.52 wt.% Zr, which was substantially higher than the nominal composition of 0.05 wt.%. A correlation between the low solidus temperature and segregation of Zr was established. This nonequilibrium solidification behavior explains why liquid films are present along grain boundaries. The liquid films lead to brittle grain boundaries; when residual stress is present, it causes solidification cracks. Atom probe tomography (APT) measurements were performed across grain boundaries, and they revealed that Zr segregated at the grain boundaries; these results agree with the Scheil-Guliver analysis. The APT measurements indicated that B also segregated; however, this could not be linked to a decrease in the solidus temperature. Elemental partitioning is seen with deep melt pools that can lead to hot cracking, whereas shallow melt pools can mitigate cracking. The effect of Zr on cracking is not a new phenomenon. The transition from equiaxed Alloy 247 to directionally solidified (DS) Alloy 247LC required that the Zr composition be reduced to 0.015 wt.% in DS Alloy 247LC [5]. Reductions in Zr and Ti and the appropriate control of Si and S eliminated DS grain boundary cracking [5]. Chauvet et al. [39] performed studies similar to those of Cloot et al. [32] and suggested that local B partitioning and the presence of low-melting liquid film decreased the solidus temperature. Although the nonweldable nickel-based superalloy in this study was manufactured by selective electron beam melting, which is identical to EB-PBF, the underlying theory of classifying cracks is similar and remains rooted in the welding literature. Both studies [32,39] reported that the presence of a liquid film in the previous solidifying melt contributed to cracking. Both papers propose that microsegregation of elements widens the CTR; therefore, the liquid is available at a lower temperature than is typically found at equilibrium solidification. Chauvet et al. demonstrated that the CTR from a Scheil-Guliver calculation spanned 350 °C, whereas the CTR from an equilibrium calculation spanned 100 °C. These results demonstrate that the factors necessary for solidification cracks are not limited to the presence of liquid films or a large solidification temperature range, but thermal or residual stress must pull apart the liquid film. Such a model is highlighted in the studies mentioned above. In principle, high levels of thermal or residual stress are preconditions for crack initiation that exist in L-PBF manufacturing. As discussed in Section 2.2, there are high thermal gradients in L-PBF; therefore, high levels of thermal or residual stress are also formed.
3.7. Solutions to Cracking
Nickel-based superalloys with high γ′ content manufactured by L-PBF are prone to cracks, as described in the studies discussed above. Conversely, laser processing methods that use nonconventional L-PBF have been reported to reduce or eliminate cracks. One such study manufactured Alloy 247 using “high-temperature selective laser melting,” which is similar to L-PBF [52]. Samples were manufactured by L-PBF, and the substrate mount was preheated to 1200 °C, which conductively heated the substrate. Control samples were also fabricated at room temperature (RT). At RT, hot cracking was predominant and primarily oriented in the build direction. In preheated samples, no cracks were observed. Selective laser epitaxy (SLE), another approach that is similar to L-PBF [53], was reported to completely eliminate cracks. In the SLE experiments, a high-power beam of 1 kJ/s irradiated a 1500 µm thick Alloy 247 powder layer on an equiaxed cast Alloy 247 substrate in one pass. The laser beam spot size was 20 µm, scan spacing was 25.4 µm, and laser speed ranged from 400 to 550 mm/s. A crack-free build correlated with a reduction in residual stress due to the shallow remelt of the substrate. A shallow remelt region was achieved by regulating the energy input with a rapid scan speed and small spot diameter. SLE also successfully deposited Inconel 100 to a thickness of approximately 1000 µm without cracks [54]. Inconel 100 has an Al + Ti content of 11 wt.%, which makes it difficult to weld. Rene 80, having an Al + Ti content of 7.7 wt.%, was also deposited with SLE in the work of Acharya et al. [55]. A zig-zag movement along the specimen width was used as a scanning strategy. The scan spacing was 12.7 µm, and the scans were repeated to preheat the substrate and ensure adequate bonding between the deposit and substrate. The scanning strategy and controlled energy input contributed to the success of the deposition. Basak et al. [56] deposited single-crystal CMSX-4 on investment cast single-crystal CMSX-4 that was dense and crack-free using SLE. The single-crystal deposit grew epitaxially from the substrate to a height of 500 µm. The single-crystal deposit was discontinued at the height of 500 µm because the direction changed from [001] to [100]. At higher levels, the grain, which was initially columnar, transitioned to equiaxed. Therefore, the maximum single-crystal height achieved was 500 µm. Basak et al. [56] proposed that a single-crystal deposit height of 1000 µm could be attained by controlling the process parameters. SLE was also utilized to deposit single-crystal Rene N5 on a single-crystal Rene N5 substrate, which was oriented in [001] and [100]. A deposit height of 1000 µm was attained in both directions; a single-crystal was formed, and it reached a height of more than 500 µm [57]. SLE was also employed to deposit dense Rene 142 [58]. Martin et al. [59] solved the cracking problem during L-PBF manufacturing of Al 7075. Al 7075 is a nonweldable alloy that is prone to solidification and liquation cracking, as are nickel-based superalloys with high γ′ content. Nanoparticles of Zr nucleants were introduced electrostatically into the Al 7075 powder feedstock. Using this approach, fine equiaxed grains were nucleated during L-PBF. The equiaxed grains tolerated the strains that occurred during the last stage of solidification. Consequently, the equiaxed grains were crack-free. Columnar grains were unable to withstand such strains, so they developed cracks. L-PBF produces columnar grains that grow epitaxially across multiple layers in the build direction, a phenomenon that will be discussed below. Cracks were found parallel to such grain boundaries during L-PBF. Martin et al. [59] recommended a method similar to that used with Al 7075 to prevent cracking during L-PBF manufacturing of γ′ nickel-based superalloys. This method requires matching suitable nanoparticles to the nickel-based superalloy powder. Equiaxed grains were observed at the top of a single track during the deposition of single track Alloy 247 on Alloy 718 [60].
4. Microstructure
4.1. Grain Structure
The direction of heat flow into the substrate strongly influences the grain structure of L-PBF-manufactured γ′ nickel-based superalloys. A specific structure is observed in Inconel 939, Alloy 247LC, and Inconel 738LC [29,34,61,62]. In a cross-section that is parallel to the build direction, columnar grains that are oriented in the build direction and grow epitaxially across multiple layers are typical. The growth direction is dictated by the competition between the maximum temperature gradient and the preferred crystallographic direction [14]. This microstructure is similar to a DS microstructure. Cross-sections of Alloy 247LC manufactured by L-PBF with Electro-Optical Systems equipment (EOS GmbH, Krailling, Germany) using an energy density of 113.5 were investigated by the present authors. Figure 10a displays the grain structure in the as-built condition along the build direction. The melt pool lines can also be seen. Columnar grains are visible, and the shape of the melt pool can be observed. In a section that is transverse to the build direction, the grain structure displays an equiaxed structure, as shown in Figure 10b. These results demonstrate that L-PBF-manufactured samples display anisotropy. Munoz-Moreno et al. [63] measured the bulk elastic anisotropy of L-PBF of Alloy 247LC by resonant ultrasound spectroscopy (RUS) and ascertained that the material was anisotropic. Sample properties vary depending on whether they are measured parallel or transverse to the build direction. Such variations were investigated in [31,34,61,62,64], and the results are discussed in Section 5. The grain sizes are small in L-PBF samples, as can be observed in the L-PBF-manufactured Alloy 247LC shown in Figure 10a,b. Small grains occur because of the high thermal gradient (G), and a fast solidification rate (R) [14] produces a high cooling rate that results in a fine grain structure [13]. In a study performed by the present authors [65], the mean grain size of L-PBF of Alloy 247LC was 7 µm in the x-y plane, which is transverse to the build direction. Although columnar grains are typically observed in L-PBF, equiaxed grains can theoretically be produced by optimizing the process parameters and scanning strategies to obtain the appropriate thermal gradient and solidification rate for a columnar-to-equiaxed transition (CET). This is governed by the level of constitutional supercooling, according to Equation (2) [66,67],
where G is the thermal gradient; R is the solidification rate; is the solidification temperature range; D is the diffusion coefficient. When is sufficiently low, equiaxed grains are formed. A high value of G is attained in L-PBF. Typically, in L-PBF, the value is not sufficiently low to promote the high degree of supercooling needed to form equiaxed grains. Instead, cellular or columnar grains, which require a lower degree of supercooling, are formed [59,66,67]. Therefore, the conditions for forming equiaxed grains are difficult to achieve by merely manipulating process parameters and scanning strategies. Instead, inoculation is a viable alternative, as proposed by Martin et al. [59] because it introduces nanoparticles that create nucleation sites around which equiaxed grains can form. However, near the top of the deposit, local conditions (e.g., lower G values) can satisfy Equation (2) so that equiaxed grains form without inoculation. Geiger et al. [68] described three different scanning strategies that rotated the scanning direction in the subsequent layer. Applying these strategies changed the texture of L-PBF-manufactured Inconel 738LC and influenced the Young’s modulus. The island scanning strategy used by Carter [31] partially altered the formation of columnar grains; fine, equiaxed grains formed between the boundaries of columnar grains. This bimodal grain structure was present when a new layer was built because regions were formed between the columnar grain boundaries when the island scans were moved by 1 mm (relative to the previous layer) along the x-y plane. The local cooling conditions in the boundary regions facilitated the growth of fine equiaxed grains. These fine equiaxed grains have high misorientation (i.e., grain boundary angle >15°), which promotes DDC, according to Carter. A high percentage of the columnar grain cores had low misorientation and displayed lower crack density. Although high angle grain boundaries have been linked to cracking of L-PBF- and EB-PBF-manufactured γ′ nickel-based superalloys, these studies attributed crack formation to either solidification or liquation cracking, not DDC [32,39]. The propensity of high misorientation boundaries to undergo solidification cracking is explained in the theoretical models proposed by Rappaz et al. [69,70]. Carter’s argument and the correlation between high angle grain boundary and DDC are based on the works of Collins et al. [71,72]. Several studies have revealed cell structures within the grains of L-PBF-manufactured γ′ nickel-based superalloys (by SEM using a higher magnification than that typically used to observe grains) [29,31,47,61,63,65]. These studies are discussed in more detail in the following section.
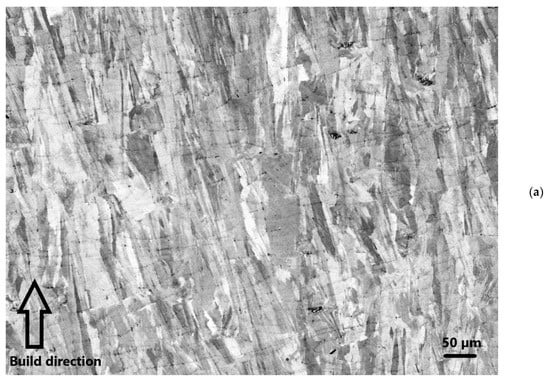
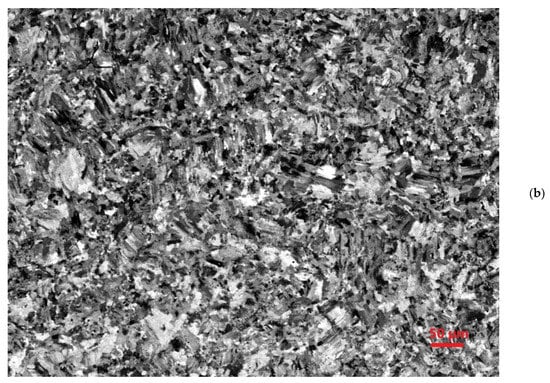
Figure 10.
Scanning electron microscope (SEM) images of L-PBF-manufactured Alloy 247LC: (a) elongated columnar grains along the build direction; (b) equiaxed grains transverse to the build direction. The images were taken in the secondary electron mode.
4.2. Phases in L-PBF Microstructure
The phases obtained during L-PBF manufacturing are important for predicting mechanical properties, and they play a vital role in the formation of cracks. The thermal cycle, including the solidification mode, influences the phase formation and the corresponding constituents. The L-PBF process involves exceptionally rapid heating and cooling, which is unlike that obtained with casting. However, the microstructure of cast γ′ nickel-based superalloys have been extensively studied and can serve as starting points defining expectations for L-PBF-manufactured alloys. The microstructure of cast γ′ nickel-based superalloys, (e.g., Alloy 247), as characterized by Liao et al. [73] and Mostafaei et al. [74], consists of γ, γ′, and carbides. The microstructure component γ/γ′ eutectic was also present. These phases and components were characterized in early studies of cast alloys [5] and are also present in cast Inconel 738 [75]. Few works have investigated L-PBF of γ′ nickel-based superalloys; consequently, elucidating the microstructure is at an early stage. However, γ, γ′, and γ/γ′ eutectic and carbides, similar to those found in cast materials, have been detected in L-PBF-manufactured samples [29,34,47,62]. In L-PBF of Alloy 247, γ, γ′, and γ/γ′ eutectic and carbides were reported [47].
Kunze et al. [62] did not detect γ′ in L-PBF-manufactured Inconel 738LC in the as-built condition when observed using SEM; however, after heat treatment (HT), dual-size γ′ precipitates with cuboidal or irregular shapes were found. This γ′ morphology was similar to that found in the as-cast material. Discrete fine carbides were found in the as-built and HT L-PBF-manufactured materials; however, fewer and smaller carbides were detected in the as-built material. Carbides that precipitated in the as-cast material were found in the grain boundaries. Rickenbacher et al. [34] also investigated L-PBF of Inconel 738LC and failed to find γ′ in the as-built material. Only after HT was γ′ observed, which agrees with the findings of Kunze et al. [62]. Rickenbacher [34] explained that the microstructure after solution and aging HT consists of unimodal γ′. However, adding hot isostatic pressing (HIP) before the HT changed the unimodal γ′ to dual-size. The HT implemented by Kunze et al. that reported dual-size γ′ included HIP, as well as solution and aging. Divya et al. [29] studied L-PBF of Alloy 247LC and found that in the as-built material, the microstructure exhibited cell structures with bright microconstituents located between cells. The microconstituents were shown to be oxides and carbides. The oxides were Hf- and Al-rich, and they originated directly from the powder or from the powder that reacted with the atmosphere during L-PBF. Microconstituents between cells were rich in Ti, Hf, Ta, Mo, and W, suggesting that the carbides were MC-type carbides. Figure 11 displays micrographs of L-PBF-manufactured Alloy 247 LC that was studied by the present authors. The micrograph of the as-built material reveals the presence of cell structures with many bright microconstituents between cells. Such cell structures, having similar microconstituents between cells, were reported in Wang et al. [47]. The cell boundaries displayed higher dislocation densities than the cell centers [47]. During solidification in the L-PBF process, cells with low misorientation are formed. If the misorientation of the cell boundary is higher than that of the cell, it is called a grain boundary. These boundaries (e.g., cell and grain boundaries) consist of solidified eutectic liquid and microconstituents. The microconstituents in these boundaries obstruct the movement of dislocations (as discussed previously, these dislocations are a consequence of the high stress induced by the L-PBF process), thereby increasing the dislocation density, which may aggravate cracking [47].
Figure 11.
As-built L-PBF-manufactured Alloy 247LC containing cell structures with bright microconstituents in the cell boundaries. The image was taken in the backscattered electron mode in the SEM.
Transmission electron microscopy (TEM) observation revealed bimodal γ′ precipitates [29]. These precipitates were either inside or between cells and 5 or 50 nm in size, respectively. Wang et al. [47] demonstrated that γ/γ′ eutectic was present between cells. Furthermore, Hf-, W-, Ti-, and Ta-rich microconstituents were found between cells. These cell boundary constituents resulted from partitioning of elements during solidification. In addition, the microconstituents contained C or O, which agreed with the findings of Divya et al. Rapid heating of a previously deposited layer or substrate by a top layer can cause melting of γ/γ′ eutectic and carbides and cause cracks to initiate from the lower layer or substrate. Such cracks were observed originating from a DS Inconel 738 substrate during L-PBF manufacturing of Inconel 738 [25]. The γ′ precipitates in the cell center were <20 nm. The cooling rate during solidification was K/s. No γ′ was observed in the as-built L-PBF-manufactured material in SEM analyses performed by Kunze et al. and Rickenbacher et al. However, additional evidence that γ′ precipitates in the nanometer scale are present has been reported by Divya et al. and Wang et al. Therefore, high-spatial-resolution microscopy studies are required to detect γ′. The size of γ′ precipitates depends on the cooling rate, as reported in [76,77,78]. Chen and Xue [79] claimed that a high cooling rate suppresses γ′ precipitation in L-PBF-manufactured Inconel 738. A high cooling rate leads to more precipitates that are finer. As was discussed in Section 2.2, extremely high cooling rates are obtainable with L-PBF. Among the alloys discussed above, Alloy 247LC and Inconel 738LC have high volume fractions of γ′ and fast γ′ precipitation kinetics, as shown in Figure 12a, which is a time-temperature-transformation (TTT) diagram modeled in JMatPro thermodynamic software. The TTT diagram shows that γ′ precipitates form in less than 1 s and 2 s in Alloy 247LC and Inconel 738LC, respectively. Nimonic 263 has a lower volume fraction and slower precipitation kinetics of γ′, as seen from the Al + Ti composition and the TTT diagram in Figure 12b. Nimonic 263 is used at a temperature of approximately 500 °C. Vilaro et al. [80] used SEM to observe the microstructure of L-PBF-manufactured Nimonic 263 and reported a cell size of approximately 500 nm. The MC-type carbides observed between cells were rich in Ti. TEM did not reveal γ′. Vilaro et al. asserted that γ′ was not precipitated due to the rapid cooling rate in the L-PBF process. A fast cooling rate will influence γ′ precipitation, but Nimonic 263 typically has a relatively slow γ′ precipitation kinetics that may delay its precipitation during L-PBF processing. Alloy 247LC has a fast γ′ precipitation kinetics, as previously stated; additional JMatPro modeling results of Alloy 247LC are shown in Reference [65]. The difference in precipitation kinetics may be why γ′ is observed in Alloy 247LC (fast precipitation) and not observed in Nimonic 263 (slow precipitation). The TTT diagram of Figure 12b shows that γ′ is not precipitated in Nimonic 263 until after 3000 s. TEM revealed that both alloys have high dislocation densities, and dislocation density contributes to hardness [47,80].
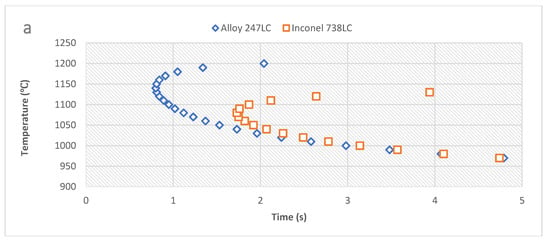
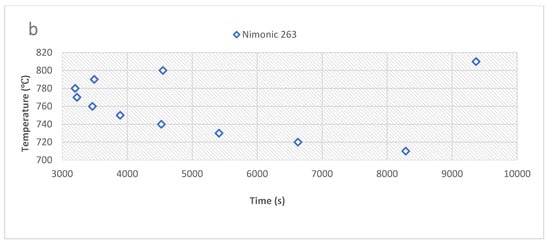
Figure 12.
(a) Time-temperature-transformation (TTT) diagram of Alloy 247LC and Inconel 738LC, modeled in JMatPro, showing the precipitation of 0.5% γ′. Both alloys display fast precipitation kinetics; (b) TTT diagram of Nimonic 263, modeled in JMatPro, indicating slow precipitation of 0.5% γ′.
4.3. Influence of the Thermal Cycle on Microstructure Evolution
In Section 2.2, it was noted that the thermal cycle in L-PBF processes is location-dependent. For example, in a layer-by-layer deposition process, the first layer deposited will be thermally affected by subsequent layers. Consequently, possible changes in the microstructure from successive deposition in the z-direction need to be investigated. Wang et al. [47] compared the microstructure of the top surface of an L-PBF-manufactured Alloy 247LC cube sample with the microstructure of the bulk sample. In addition, a single track was manufactured to compare its microstructure with those of the top surface and bulk of the cube sample. The samples were fabricated with a laser power of 150 W and a scan speed of 1500 mm/s. The microstructures of the top surface and bulk were similar. However, the single track displayed lack-of-fusion voids in some regions. Element partitioning to regions between cells was observed in the top surface, bulk sample, and single track. The degree of partitioning in the single track was lower than in the top surface or bulk sample. The top surface and bulk sample exhibited similar γ′ size distributions with a high fraction of precipitates <10 nm; the single track displayed a high fraction of γ′ precipitates >10 nm. The thermal cycles experienced in the cube samples altered the size of γ′ precipitates. Chauvet et al. [39] measured the γ′ size gradient along the z-axis in EB-PBF-manufactured material and observed that γ′ size increased from top to the bottom in the cube sample. At z-heights of 29, 25, and 5 mm, the γ′ precipitates were approximately 100, 500, and 600 nm, respectively. The hardness of the top layer was 490 HV at a z-height of 29 mm; between 0 and 27 mm, the hardness was 400 HV. Hardness measurements tend to be uniform at a given height but can vary where cracks and pores are found. Larger γ′ and lower hardness levels could be due to γ′ coarsening from prolonged aging treatment by the heated substrate [81]. In L-PBF processes, there is no preheating, so this type of lower layer coarsening may not occur. However, lower layers in both EB-PBF and L-PBF processes are subject to HT from subsequently deposited layers that will influence γ′ behavior. It is not clear why the γ′ distribution in the single track in [70] had a higher fraction of larger γ′ precipitates than in the cube samples. No layers were deposited over the single track, making the occurrence of γ′ coarsening unlikely. One reason for the bigger size of γ′ in the single track might be that γ′ precipitates formed from the eutectic between cells during solidification. The size of eutectic γ′ precipitates was larger than the γ′ precipitates in cell centers that were formed by solid-state precipitation.
4.4. Role of Other Microconstituents
The role of oxides in causing cracks was investigated by Qiu et al. [82] with Al-, Si-, and W-based oxide particles that have high melting points. Qui et al. proposed that during L-PBF manufacturing of Inconel 738LC, the cause of cracking was less associated with the element and more associated with the melting point of the oxides, and high melting point oxides cause cracks. The findings revealed that large and elongated , discrete spherical oxides containing W and Si, and loosely bonded oxide clusters containing W and Si were around cracks that formed along grain boundaries [82]. Nanoindentation measurements were 8–9.5 GPa along these grain boundaries, but 2 GPa in the matrix. Qui et al. associated the high hardness at the grain boundaries with the presence of oxides and proposed that this caused grain boundary embrittlement. During solidification, oxides are the first to nucleate in the liquid, followed by γ. Solidification contraction and thermal shrinkage between the interface of oxide clusters and the γ precipitates cause cracks to form. Cracking may also occur along the centerline of the oxides or the embrittled grain boundary. Cracked grain boundaries were populated with small, sometimes equiaxed grains. Some cracks initiated from lack-of-fusion defects, probably due to higher concentrations of stress around the pores. Such cracks were found in L-PBF-manufactured Alloy 247LC investigated by the present authors. An exemplary electron backscatter diffraction (EBSD) micrograph that displays a crack initiated by a lack-of-fusion pore is shown in Figure 13. Small equiaxed grains between larger columnar grains are also seen in the figure.
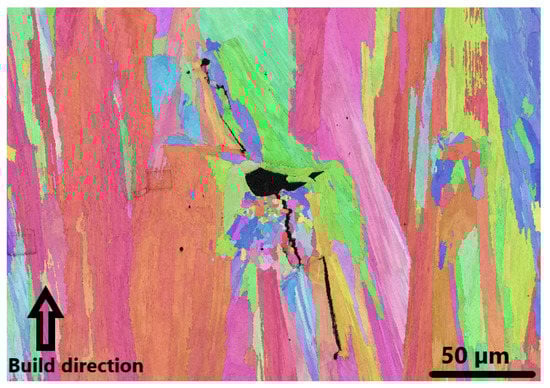
Figure 13.
EBSD micrograph of an L-PBF-manufactured Alloy 247LC showing a crack initiated by a lack-of-fusion, which is surrounded by equiaxed and columnar grains.
Preventing oxidation during L-PBF manufacturing of nickel-based superalloys is challenging. Inert gases of high grade and purity should be used in the process. However, even when such gases are used, the oxygen equilibrium partial pressure in the inert gas at the melting point of some elements in the alloy is still higher than the threshold required to prevent oxidation [83].
5. Mechanical Properties and Performance
Carter [31] performed creep tests on L-PBF-manufactured Alloy 247LC material. The tests were conducted at 1050 °C; a load of 100 MPa was applied during HT, and HIP was also used in combination with other HTs. The creep tests included vertical and horizontal build orientations for each of the processing conditions. Results indicated that a tertiary creep mechanism was predominant under all conditions tested, and the creep tests revealed anisotropy. The vertically built specimens had higher creep strength than horizontally built specimens. The reason for this may be because the creep load was perpendicular to the grain boundary cracks in the horizontally built specimens but parallel to the grain boundary cracks in the vertically built specimens. Thus, the load is more effective in causing failure in the horizontally built samples. Recall from Section 3.2 that cracks are found in the grain boundaries and the grain boundaries follow the build direction. The creep performance of plates that were manufactured at a 30° tilt was inferior to that of vertically built plates [84]. This may be because of the reason given above. In addition, grains in the vertically built plates were larger and had lower grain boundary density, so they resisted creep better than the horizontally built and tilted plates. Adding HIP to the materials improved creep strength. The creep life of 9.6 h reported for the L-PBF-manufactured material was significantly less than the corresponding creep life of 236 h predicted by the Larsson-Miller index using identical test parameters. Carter attributed the poor creep performance to the presence of defects, inferior grain structures, and high test temperatures. However, the inferior creep performance raises questions about the suitability of L-PBF-manufactured Alloy 247LC for high-temperature applications. However, more tests are required to validate these results, especially at lower temperatures where the dissolution of γ′ is not at risk. The creep performance of L-PBF-manufactured Inconel 738LC material in tests performed by Kunze et al. [62] and Rickenbaucher et al. [34] indicated that the creep rupture strength for vertically built material was close to that of cast material in the lower scatter range values. In contrast, horizontally built samples had inferior creep performance. The effect of anisotropy was also evident. Long columnar grains in the vertically built samples were aligned in the loading direction; hence, they resist creep better than the horizontally built samples, whose grains are aligned perpendicular to the loading direction [62]. The grain sizes and precipitates in the L-PBF-manufactured samples were smaller relative to those in cast samples and could also be responsible for the inferior creep in L-PBF-manufactured materials.
Chen et al. [64] performed tensile tests on L-PBF-manufactured K418 in vertical and horizontal build orientations to investigate the influence of anisotropy on tensile properties. Vertically built specimens exhibited slightly higher ultimate tensile strength (UTS) and slightly lower yield strength than horizontally built specimens. The horizontally built specimens of L-PBF-manufactured Inconel 738LC displayed higher UTS and Young’s modulus than the vertically built samples and a proof stress of 0.2% [34,62]. This trend was also seen for Haynes 230 during depositions in the high energy input range [85]. The vertically built specimens displayed better ductility than the horizontally built samples [34,64]. Chen et al. [64] stated that the stress applied to the horizontally built samples was perpendicular to the columnar grains; hence, it caused grain delamination. However, in the vertically built samples, the stress applied is parallel to the columnar grains, resulting in better ductility. The grain size was smaller in horizontally built samples, resulting in higher yield strength. Horizontally built samples are expected to have a larger area close to the substrate than vertically built samples. Consequently, the cooling rates are higher in horizontally built samples, yielding finer grains. The yield strength of L-PBF-manufactured K418 was superior to that of cast K418. A similar trend is seen in [34,62]. This trend is expected because of the finer grain size seen in L-PBF-manufactured materials. As discussed in Section 4 and shown in Figure 9a,b, the grain size of L-PBF-manufactured Alloy 247LC is small. Yield strength is related to grain size. According to the Hall-Petch relation, yield strength is inversely proportional to the square root of grain diameter.
6. Summary
Given the high thermal gradients, residual stress, and susceptibility of γ′ nickel-based superalloys to weld cracking, it is not surprising that these alloys crack during L-PBF processing. Currently, studies have demonstrated several relationships between process parameters, powder properties, alloy metallurgy, and defects. However, the number of studies is low; therefore, further studies must be conducted.
Similarly, additional investigation into the mechanism of cracking in L-PBF-manufactured materials is also required. More evidence is needed to fully characterize solidification-type cracking and differentiate it from liquation cracking because each mechanism requires the presence of liquid films. Thermal gradients and cycling in L-PBF layers, as well as their subsequent effects on cracks and microstructure, can be studied in detail by experimenting with single tracks or in samples with varying numbers of layers. Liquation cracking may be revealed in the thermally treated lower layers of single tracks. The solid-state cracking mechanism of SAC scenarios can also be revealed in such investigations. The effect of thermal treatment on a solidified layer by a subsequent layer can be observed more easily in single tracks than in cubes.
Further investigation should be done to identify the contributions of different elements in widening the CTR and characterize the segregation of such elements between cells during L-PBF manufacturing. The elements present in crack boundaries should also be identified. It should be possible to identify which elements influence cracking. Such knowledge is important for developing alloy compositions that eliminate cracking while retaining acceptable microstructures and material properties. One challenge is that critical microstructural details are in the nanometer range; therefore, such studies will require advanced microscopy techniques (for example high-resolution TEM) and energy dispersive X-ray (EDX) analyses. The addition of nanoparticles to γ′ nickel-based superalloy powders to induce equiaxed grains, similar to the approach used with Al 7075, should also be investigated in more detail. Technical improvements in L-PBF equipment that preheat the powder bed and reduce residual stress may improve crack resistance. The observations in SLE implies that nickel-based superalloys with a high volume fraction of γ′ can be processed crack-free. However, the properties of the processed parts should be tested to ensure that they meet the requirements. Analyses obtained from the literature suggest that oxides are present between cells. Such oxides can cause cracking or deteriorate the mechanical properties and ought to be studied in more detail. Ultimately, the crystal structure and lattice parameters must be investigated to identify these oxides. Inert gases of high purity should be used during L-PBF to ensure that the partial pressure of oxygen remains below the threshold required for oxidation of susceptible elements. In addition, powder quality should be improved to limit the amount of Si and other trace elements.
The main findings of this review can be summarized as follows:
- There remains an industrial requirement to optimize L-PBF process parameters for γ′-strengthened superalloys.
- Complex heat transfer mechanisms, including conduction, convection, and radiation, are characteristics of L-PBF processes.
- High thermal gradients, fast cooling rates, and spatial variation of thermal cycles influence the microstructure of the formed materials.
- L-PBF-manufactured γ′ nickel-based superalloys are prone to defects such as cracks, spherical pores, and lack-of-fusion voids.
- Solidification, liquation, SAC, and DDC are known cracking mechanisms in the welding of γ′ nickel-based superalloys; such cracking mechanisms also occur during L-PBF of γ′ nickel-based superalloys.
- L-PBF process parameters, including scanning strategies (patterns) and powder properties, strongly influence defect formation. The presence of Si in the powder increases cracking density.
- For solidification cracking to occur, prerequisites include the presence of liquid films, a wide critical temperature range (CTR), and the presence of residual stress. Segregating elements, such as Zr or B, could cause liquid films to be present in grain boundaries at low temperatures. Scheil-Gulliver thermodynamic plots can identify the CTR.
- The microstructures of L-PBF-manufactured γ′ nickel-based superalloys have constituents that are also found in the corresponding cast alloys. The γ, γ′, and γ/γ′ eutectic and carbides detected in L-PBF materials are important phases and microstructure components.
- Cell structures within grains can be characteristic of the microstructure, and enrichment of Ti, Hf, Ta, Mo, and W between cells has been observed.
- The size of γ′ precipitates becomes finer at high cooling rates and may not be observable in as-built L-PBF samples because of their small size. High-resolution electron microscopy analysis, for example TEM, can detect γ′ precipitates at the nanometer scale.
- Vertically built L-PBF samples have creep characteristics that are superior to those of horizontally built samples. However, the creep of cast samples outperforms L-PBF samples because L-PBF samples contain defects or because the grains and precipitates are smaller. Tensile tests also display anisotropy, and yield strength is generally better in horizontal-built specimens than in vertical-built specimens. L-PBF-manufactured samples display better yield strength than equivalent cast materials, and this is linked to the smaller grain sizes in L-PBF-manufactured samples.
Author Contributions
Conceptualization, methodology, literature review, material characterization, thermodynamic modelling and writing of the manuscript were done by O.A. Supervision, conceptualization, review and editing of the manuscript were done by J.A. and R.P. Manufacturing of the samples and review of the manuscript were done by H.B. All authors have read and agreed to the published version of the manuscript.
Funding
This research was funded by Vinnova. Grant number 2016-05175.
Acknowledgments
This research is part of the CAM 2 project. The authors are grateful for the support of this project. The authors also acknowledge and are thankful for the funding from Vinnova.
Conflicts of Interest
The authors declare no conflict of interest.
References
- Sims, C.T.; Stoloff, N.S.; Hagel, W.C. (Eds.) Superalloys II; Wiley: New York, NY, USA, 1987. [Google Scholar]
- Ott, E.A.; Groh, J.; Sizek, H. Metals Affordability Initiative: Application of Allvac Alloy 718Plus for Aircraft Engine Static Structural Components. In Superalloys 718, 625, 706 and Various Derivatives (2005); The Minerals, Metals & Materials Society: Pittsburgh, PA, USA, 2005; pp. 35–45. [Google Scholar] [CrossRef]
- Donachie, M.J.; Donachie, S.J. Superalloys: A Technical Guide, 2nd ed.; ASM International: Materials Park, OH, USA, 2002. [Google Scholar]
- Navrotsky, V.; Graichen, A.; Brodin, H. Industrialization of 3D Printing (Additive Manufacturing) for Gas Turbine Components Repair and Manufacturing; VGB Power Tech 12: Essen, Germany, 2015. [Google Scholar]
- Harris, K.; Erickson, G.L.; Schwer, R.E. MAR M 247 Derivations—CM 247 LC DS Alloy and CMSX Single Crystal Alloys: Properties & Performance. In Superalloys 1984 (Fifth International Symposium); The Minerals, Metals & Materials Society: Pittsburg, PA, USA, 1984; pp. 221–230. [Google Scholar] [CrossRef]
- Andersson, J. Weldability of Precipitation Hardening Superalloys: Influence of Microstructure; Chalmers University of Technology: Göteborg, Germany, 2011. [Google Scholar]
- Basak, A.; Raghu, S.H.; Das, S. Microstructures and Microhardness Properties of CMSX-4® Additively Fabricated Through Scanning Laser Epitaxy (SLE). J. Mater. Eng. Perform. 2017, 26, 5877–5884. [Google Scholar] [CrossRef]
- Gibson, I.; Rosen, D.; Stucker, B. Additive Manufacturing Technologies; Springer: New York, NY, USA, 2015. [Google Scholar]
- Yadroitsev, I. Selective Laser Melting: Direct Manufacturing of 3D-Objects by Selective Laser Melting of Metal Powders; Lambert Acad. Publ.: Saarbrücken, Germany, 2009. [Google Scholar]
- Gu, D. Laser Additive Manufacturing of High-Performance Materials; Springer: Berlin, Germany, 2015. [Google Scholar]
- Olakanmi, E.O.; Cochrane, R.F.; Dalgarno, K.W. Densification mechanism and microstructural evolution in selective laser sintering of Al–12Si powders. J. Mater. Process. Technol. 2011, 211, 113–121. [Google Scholar] [CrossRef]
- Wang, F.; Wu, X.H.; Clark, D. On direct laser deposited Hastelloy X: Dimension, surface finish, microstructure and mechanical properties. Mater. Sci. Technol. 2011, 27, 344–356. [Google Scholar] [CrossRef]
- Carter, L.N.; Wang, X.; Read, N.; Khan, R.; Aristizabal, M.; Essa, K.; Attallah, M.M. Process optimisation of selective laser melting using energy density model for nickel based superalloys. Mater. Sci. Technol. 2016, 1–5. [Google Scholar] [CrossRef]
- DebRoy, T.; Wei, H.L.; Zuback, J.S.; Mukherjee, T.; Elmer, J.W.; Milewski, J.O.; Beese, A.M.; Wilson-Heid, A.; De, A.; Zhang, W. Additive manufacturing of metallic components – Process, structure and properties. Prog. Mater. Sci. 2018, 92, 112–224. [Google Scholar] [CrossRef]
- Elmer, J.W.; Allen, S.M.; Eagar, T.W. Microstructural development during solidification of stainless steel alloys. Metall. Trans. A 1989, 20, 2117–2131. [Google Scholar] [CrossRef]
- Li, Y.; Gu, D. Parametric analysis of thermal behavior during selective laser melting additive manufacturing of aluminum alloy powder. Mater. Des. 2014, 63, 856–867. [Google Scholar] [CrossRef]
- Hussein, A.; Hao, L.; Yan, C.; Everson, R. Finite element simulation of the temperature and stress fields in single layers built without-support in selective laser melting. Mater. Des. 1980–2015 2013, 52, 638–647. [Google Scholar] [CrossRef]
- Gu, D.D.; Meiners, W.; Wissenbach, K.; Poprawe, R. Laser additive manufacturing of metallic components: Materials, processes and mechanisms. Int. Mater. Rev. 2012, 57, 133–164. [Google Scholar] [CrossRef]
- DuPont, J.N.; Lippold, J.C.; Kiser, S.D. Welding Metallurgy and Weldability of Nickel-Base Alloys; John Wiley & Sons: Hoboken, NJ, USA, 2009. [Google Scholar]
- Kou, S. Welding Metallurgy, 2nd ed.; Wiley-Interscience: Hoboken, NJ, USA, 2003. [Google Scholar]
- Pellini, W.S. Strain theory of hot tearing. Foundary 1952, 80, 125. [Google Scholar]
- Pumphrey, W.I. A consideration of the nature of brittleness at temperatures above the solidus in castings and welds in aluminium alloys. J. Inst. Met. 1948, 75, 235. [Google Scholar]
- Borland, J.C. Generalized theory of super-solidus cracking in welds (and castings). Br. Weld J. 1960, 7, 508–512. [Google Scholar]
- Dye, D.; Hunziker, O.; Reed, R.C. Numerical analysis of the weldability of superalloys. Acta Mater. 2001, 49, 683–697. [Google Scholar] [CrossRef]
- Zhong, M.; Sun, H.; Liu, W.; Zhu, X.; He, J. Boundary liquation and interface cracking characterization in laser deposition of Inconel 738 on directionally solidified Ni-based superalloy. Scr. Mater. 2005, 53, 159–164. [Google Scholar] [CrossRef]
- Sidhu, R.K.; Ojo, O.A.; Chaturvedi, M.C. Microstructural Response of Directionally Solidified René 80 Superalloy to Gas-Tungsten Arc Welding. Metall. Mater. Trans. A 2009, 40, 150–162. [Google Scholar] [CrossRef]
- Egbewande, A.T.; Buckson, R.A.; Ojo, O.A. Analysis of laser beam weldability of Inconel 738 superalloy. Mater. Charact. 2010, 61, 569–574. [Google Scholar] [CrossRef]
- Young, G.A.; Capobianco, T.E.; Penik, M.A.; Morris, B.W.; McGee, J.J. The mechanism of ductility dip cracking in nickel-chromium alloys. Weld. J. 2008, 87, 31–43. [Google Scholar]
- Divya, V.D.; Muñoz-Moreno, R.; Messé, O.M.D.M.; Barnard, J.S.; Baker, S.; Illston, T.; Stone, H.J. Microstructure of selective laser melted CM247LC nickel-based superalloy and its evolution through heat treatment. Mater. Charact. 2016, 114, 62–74. [Google Scholar] [CrossRef]
- Olakanmi, E.O.; Cochrane, R.F.; Dalgarno, K.W. A review on selective laser sintering/melting (SLS/SLM) of aluminium alloy powders: Processing, microstructure, and properties. Prog. Mater. Sci. 2015, 74, 401–477. [Google Scholar] [CrossRef]
- Carter, L. Selective Laser Melting of Nickel Superalloys for High Temperature Applications. Ph.D. Thesis, University of Birmigham, Birmigham, UK, 2013. [Google Scholar]
- Cloots, M.; Uggowitzer, P.J.; Wegener, K. Investigations on the microstructure and crack formation of IN738LC samples processed by selective laser melting using Gaussian and doughnut profiles. Mater. Des. 2016, 89, 770–784. [Google Scholar] [CrossRef]
- Perevoshchikova, N.; Rigaud, J.; Sha, Y.; Heilmaier, M.; Finnin, B.; Labelle, E.; Wu, X. Optimisation of selective laser melting parameters for the Ni-based superalloy IN-738 LC using Doehlert’s design. Rapid Prototyp. J. 2017, 23, 881–892. [Google Scholar] [CrossRef]
- Rickenbacher, L.; Etter, T.; Hövel, S.; Wegener, K. High temperature material properties of IN738LC processed by selective laser melting (SLM) technology. Rapid Prototyp. J. 2013, 19, 282–290. [Google Scholar] [CrossRef]
- Mumtaz, K.A.; Erasenthiran, P.; Hopkinson, N. High density selective laser melting of Waspaloy®. J. Mater. Process. Technol. 2008, 195, 77–87. [Google Scholar] [CrossRef]
- Catchpole-Smith, S.; Aboulkhair, N.; Parry, L.; Tuck, C.; Ashcroft, I.A.; Clare, A. Fractal scan strategies for selective laser melting of ‘unweldable’ nickel superalloys. Addit. Manuf. 2017, 15, 113–122. [Google Scholar] [CrossRef]
- Cloots, M.; Kunze, K.; Uggowitzer, P.J.; Wegener, K. Microstructural characteristics of the nickel-based alloy IN738LC and the cobalt-based alloy Mar-M509 produced by selective laser melting. Mater. Sci. Eng. A 2016, 658, 68–76. [Google Scholar] [CrossRef]
- Lee, Y.S.; Kirka, M.M.; Kim, S.; Sridharan, N.; Okello, A.; Dehoff, R.R.; Babu, S.S. Asymmetric Cracking in Mar-M247 Alloy Builds during Electron Beam Powder Bed Fusion Additive Manufacturing. Metall. Mater. Trans. A 2018, 49, 5065–5079. [Google Scholar] [CrossRef]
- Chauvet, E.; Kontis, P.; Jägle, E.A.; Gault, B.; Raabe, D.; Tassin, C.; Blandin, J.J.; Dendievel, R.; Vayre, B.; Abed, S.; et al. Hot cracking mechanism affecting a non-weldable Ni-based superalloy produced by selective electron Beam Melting. Acta Mater. 2018, 142, 82–94. [Google Scholar] [CrossRef]
- Attallah, M.M.; Jennings, R.; Wang, X.; Carter, L.N. Additive manufacturing of Ni-based superalloys: The outstanding issues. MRS Bull. 2016, 41, 758–764. [Google Scholar] [CrossRef]
- Prabhakar, P.; Sames, W.J.; Dehoff, R.; Babu, S.S. Computational modeling of residual stress formation during the electron beam melting process for Inconel 718. Addit. Manuf. 2015, 7, 83–91. [Google Scholar] [CrossRef]
- Griffith, M.L.; Schlienger, M.E.; Harwell, L.D.; Oliver, M.S.; Baldwin, M.D.; Ensz, M.T.; Essien, M.; Brooks, J.; Robino, C.V.; Smugeresky, E.J.; et al. Understanding thermal behavior in the LENS process. Mater. Des. 1999, 20, 107–113. [Google Scholar] [CrossRef]
- Labudovic, M.; Hu, D.; Kovacevic, R. A three dimensional model for direct laser metal powder deposition and rapid prototyping. J. Mater. Sci. 2003, 38, 35–49. [Google Scholar] [CrossRef]
- Song, X.; Xie, M.; Hofmann, F.; Illston, T.; Connolley, T.; Reinhard, C.; Atwood, R.C.; Connor, L.; Drakopoulos, M.; Frampton, L.; et al. Residual stresses and microstructure in Powder Bed Direct Laser Deposition (PB DLD) samples. Int. J. Mater. Form. 2015, 8, 245–254. [Google Scholar] [CrossRef]
- Shiomi, M.; Osakada, K.; Nakamura, K.; Yamashita, T.; Abe, F. Residual Stress within Metallic Model Made by Selective Laser Melting Process. CIRP Ann. 2004, 53, 195–198. [Google Scholar] [CrossRef]
- Boswell, J.H.; Clark, D.; Li, W.; Attallah, M.M. Cracking during thermal post-processing of laser powder bed fabricated CM247LC Ni-superalloy. Mater. Des. 2019, 174, 107793. [Google Scholar] [CrossRef]
- Wang, X.; Carter, L.N.; Pang, B.; Attallah, M.M.; Loretto, M.H. Microstructure and yield strength of SLM-fabricated CM247LC Ni-Superalloy. Acta Mater. 2017, 128, 87–95. [Google Scholar] [CrossRef]
- Zhao, Z.; Li, L.; Tan, L.; Bai, P.; Li, J.; Wu, L.; Liao, H.; Cheng, Y. Simulation of Stress Field during the Selective Laser Melting Process of the Nickel-Based Superalloy, GH4169. Materials 2018, 11, 1525. [Google Scholar] [CrossRef] [PubMed]
- Engeli, R.; Etter, T.; Hövel, S.; Wegener, K. Processability of different IN738LC powder batches by selective laser melting. J. Mater. Process. Technol. 2016, 229, 484–491. [Google Scholar] [CrossRef]
- Holt, R.T.; Wallace, W. Impurities and trace elements in nickel-base superalloys. Int. Met. Rev. 1976, 21, 1–24. [Google Scholar] [CrossRef]
- Engeli, R.; Etter, T.; Geiger, F.; Stankowski, A.; Wegner, K. Effect of Si on the SLM processability of IN738LC. Available online: Sffsymposium.engr.utexas.edu (accessed on 20 July 2020).
- Hagedorn, Y.; Risse, J.; Meiners, W.; Pirch, N.; Wissenbach, K.; Propawe, R. Processing of nickel based superalloy MAR M-247 by means of high temperature–selective laser melting (HT-SLM). In Proceedings of the the International Conference on Advanced Research in Virtual and Rapid Prototyping (VRAP 2013), Leiria, Portugal, 1–5 October 2013; pp. 291–295. [Google Scholar]
- Basak, A.; Das, S. Microstructure of nickel-base superalloy MAR-M247 additively manufactured through scanning laser epitaxy (SLE). J. Alloys Compd. 2017, 705, 806–816. [Google Scholar] [CrossRef]
- Basak, A.; Das, S. Additive Manufacturing of Nickel-Base Superalloy IN100 Through Scanning Laser Epitaxy. JOM 2018, 70, 53–59. [Google Scholar] [CrossRef]
- Acharya, R.; Bansal, R.; Gambone, J.J.; Kaplan, M.A.; Fuchs, G.E.; Rudawski, N.G.; Das, S. Additive Manufacturing and Characterization of René 80 Superalloy Processed Through Scanning Laser Epitaxy for Turbine Engine Hot-Section Component Repair: Additive Manufacturing and Characterization of. Adv. Eng. Mater. 2015, 17, 942–950. [Google Scholar] [CrossRef]
- Basak, A.; Acharya, R.; Das, S. Additive Manufacturing of Single-Crystal Superalloy CMSX-4 Through Scanning Laser Epitaxy: Computational Modeling, Experimental Process Development, and Process Parameter Optimization. Metall. Mater. Trans. A 2016, 47, 3845–3859. [Google Scholar] [CrossRef]
- Basak, A.; Das, S. Additive Manufacturing of Nickel-Base Superalloy René N5 through Scanning Laser Epitaxy (SLE)—Material Processing, Microstructures, and Microhardness Properties: Additive Manufacturing of Superalloy René N5. Adv. Eng. Mater. 2017, 19, 1600690. [Google Scholar] [CrossRef]
- Basak, A.; Acharya, R.; Das, S. Epitaxial deposition of nickel-based superalloy René 142 through scanning laser epitaxy (SLE). Addit. Manuf. 2018, 22, 665–671. [Google Scholar] [CrossRef]
- Martin, J.H.; Yahata, B.D.; Hundley, J.M.; Mayer, J.A.; Schaedler, T.A.; Pollock, T.M. 3D printing of high-strength aluminium alloys. Nature 2017, 549, 365–369. [Google Scholar] [CrossRef]
- Ramos, J.A.; Murphy, J.; Lappo, K.; Wood, K.; Bourell, D.L.; Beaman, J.J. Single-layer Deposits of Nickel Base Superalloy by means of Selective Laser Melting. Presented at the Solid Free form Fabrication Symposium, Austin, TX, USA, 17–19 August 2002. [Google Scholar]
- Kanagarajah, P.; Brenne, F.; Niendorf, T.; Maier, H.J. Inconel 939 processed by selective laser melting: Effect of microstructure and temperature on the mechanical properties under static and cyclic loading. Mater. Sci. Eng. A 2013, 588, 188–195. [Google Scholar] [CrossRef]
- Kunze, K.; Etter, T.; Grässlin, J.; Shklover, V. Texture, anisotropy in microstructure and mechanical properties of IN738LC alloy processed by selective laser melting (SLM). Mater. Sci. Eng. A 2015, 620, 213–222. [Google Scholar] [CrossRef]
- Muñoz-Moreno, R.; Divya, V.D.; Driver, S.L.; Messé, O.M.; Illston, T.; Baker, S.; Carpenter, M.A.; Stone, H.J. Effect of heat treatment on the microstructure, texture and elastic anisotropy of the nickel-based superalloy CM247LC processed by selective laser melting. Mater. Sci. Eng. A 2016, 674, 529–539. [Google Scholar] [CrossRef]
- Chen, Z.; Chen, S.; Wei, Z.; Zhang, L.; Wei, P.; Lu, B.; Zhang, S.; Xiang, Y. Anisotropy of nickel-based superalloy K418 fabricated by selective laser melting. Prog. Nat. Sci. Mater. Int. 2018, 28, 496–504. [Google Scholar] [CrossRef]
- Adegoke, O.; Andersson, J.; Ojo, O.A.; Brodin, H.; Pederson, R. Laser Beam Powder Bed Fusion and Post Processing of Alloy 247LC; Material Science and Technology: Portland, OR, USA, 2019; pp. 27–34. [Google Scholar]
- Porter, D.A.; Easterling, K.E.; Sherif, M.Y. Phase Transformations in Metals and Alloys, 3rd ed.; CRC Press: Boca Raton, FL, USA, 2009. [Google Scholar]
- Krakhmalev, P.; Fredriksson, G.; Svensson, K.; Yadroitsev, I.; Yadroitsava, I.; Thuvander, M.; Peng, R. Microstructure, Solidification Texture, and Thermal Stability of 316 L Stainless Steel Manufactured by Laser Powder Bed Fusion. Metals 2018, 8, 643. [Google Scholar] [CrossRef]
- Geiger, F.; Kunze, K.; Etter, T. Tailoring the texture of IN738LC processed by selective laser melting (SLM) by specific scanning strategies. Mater. Sci. Eng. A 2016, 661, 240–246. [Google Scholar] [CrossRef]
- Rappaz, M.; Jacot, A.; Boettinger, W.J. Last-stage solidification of alloys: Theoretical model of dendrite-arm and grain coalescence. Metall. Mater. Trans. A 2003, 34, 467–479. [Google Scholar] [CrossRef]
- Wang, N.; Mokadem, S.; Rappaz, M.; Kurz, W. Solidification cracking of superalloy single- and bi-crystals. Acta Mater. 2004, 52, 3173–3182. [Google Scholar] [CrossRef]
- Collins, M.J.; Ramirez, A.J.; Lippold, J.C. An investigation of ductility-dip cracking in nickel-based weld metals—Part II. Weld. J. 2003, 82, 348–354. [Google Scholar]
- Collins, M.J.; Ramirez, A.J.; Lippold, J.C. An investigation of ductility-dip cracking in nickel-based weld metals—Part III. Weld. J. 2004, 83, 39–49. [Google Scholar]
- Liao, J.-H.; Bor, H.-Y.; Wei, C.-N.; Chao, C.-G.; Liu, T.-F. Influence of microstructure and its evolution on the mechanical behavior of modified MAR-M247 fine-grain superalloys at 871 °C. Mater. Sci. Eng. A 2012, 539, 93–100. [Google Scholar] [CrossRef]
- Mostafaei, M.; Abbasi, S.M. Influence of Zr content on the incipient melting behavior and stress-rupture life of CM247 LC nickel base superalloy. J. Alloys Compd. 2015, 648, 1031–1037. [Google Scholar] [CrossRef]
- Ojo, O.A.; Richards, N.L.; Chaturvedi, M.C. Contribution of constitutional liquation of gamma prime precipitate to weld HAZ cracking of cast Inconel 738 superalloy. Scr. Mater. 2004, 50, 641–646. [Google Scholar] [CrossRef]
- Babu, S.S.; Miller, M.K.; Vitek, J.M.; David, S.A. Characterization of the microstructure evolution in a nickel base superalloy during continuous cooling conditions. Acta Mater. 2001, 49, 4149–4160. [Google Scholar] [CrossRef]
- Kusabiraki, K.; Zhang, X.; Ooka, T. The Growth of GAMMA Precipitates in a 53Ni-20Co-15Cr Superalloy. ISIJ Int. 1995, 35, 1115–1120. [Google Scholar] [CrossRef]
- Radis, R.; Schaffer, M.; Albu, M.; Kothleitner, G.; Pölt, P.; Kozeschnik, E. Multimodal size distributions of γ′ precipitates during continuous cooling of UDIMET 720 Li. Acta Mater. 2009, 57, 5739–5747. [Google Scholar] [CrossRef]
- Chen, J.; Xue, L. Process-induced microstructural characteristics of laser consolidated IN-738 superalloy. Mater. Sci. Eng. A 2010, 527, 7318–7328. [Google Scholar] [CrossRef]
- Vilaro, T.; Colin, C.; Bartout, J.D.; Nazé, L.; Sennour, M. Microstructural and mechanical approaches of the selective laser melting process applied to a nickel-base superalloy. Mater. Sci. Eng. A 2012, 534, 446–451. [Google Scholar] [CrossRef]
- Babu, S.S.; Raghavan, N.; Raplee, J.; Foster, S.J.; Frederick, C.; Haines, M.; Dinwiddie, R.; Kirka, M.K.; Plotkowski, A.; Lee, Y.; et al. Additive Manufacturing of Nickel Superalloys: Opportunities for Innovation and Challenges Related to Qualification. Metall. Mater. Trans. A 2018, 49, 3764–3780. [Google Scholar] [CrossRef]
- Qiu, C.; Chen, H.; Liu, Q.; Yue, S.; Wang, H. On the solidification behaviour and cracking origin of a nickel-based superalloy during selective laser melting. Mater. Charact. 2019, 148, 330–344. [Google Scholar] [CrossRef]
- Zhang, Y.N.; Cao, X.; Wanjara, P.; Medraj, M. Oxide films in laser additive manufactured Inconel 718. Acta Mater. 2013, 61, 6562–6576. [Google Scholar] [CrossRef]
- Hilal, H.; Lancaster, R.; Jeffs, S.; Boswell, J.; Stapleton, D.; Baxter, G. The Influence of Process Parameters and Build Orientation on the Creep Behaviour of a Laser Powder Bed Fused Ni-based Superalloy for Aerospace Applications. Materials 2019, 12, 1390. [Google Scholar] [CrossRef]
- Bauer, T.; Dawson, K.; Spierings, A. Microstructure and mechanical characterization of SLM processed Haynes 230. Presented at the International Solid Freeform Symposium, Austin, TX, USA, 4–6 August 2015. [Google Scholar]


© 2020 by the authors. Licensee MDPI, Basel, Switzerland. This article is an open access article distributed under the terms and conditions of the Creative Commons Attribution (CC BY) license (http://creativecommons.org/licenses/by/4.0/).