Article

Influence of Surface Ultrasonic Rolling on Microstructure and Corrosion Property of T4003 Ferritic Stainless Steel Welded Joint

1
School of Material Science and Engineering, Dalian JiaoTong University, Dalian 116028, China
2
Wuhan Works Overhaul Section, China Railway Wuhan Group Co., Ltd., Wuhan 430031, China
3
Metals and Chemistry Research Institute, China Academy of Railway Sciences Co., Ltd., Beijing 100081, China
*
Author to whom correspondence should be addressed.
Metals 2020, 10(8), 1081; https://doi.org/10.3390/met10081081
Submission received: 27 June 2020 / Revised: 30 July 2020 / Accepted: 7 August 2020 / Published: 11 August 2020

Abstract

:
In this paper, the effect of surface ultrasonic rolling treatment (SURT) on surface properties of T4003 cold metal transfer (CMT) welded joints was studied. Surface topography and microstructure changes of the welded joint surface before and after SURT were observed by optical microscope and scanning electron microscope. The hardness and residual stress distribution of welded joint were measured by a microhardness tester and X-ray diffractometer. The change of corrosion resistance of welded joints was studied by electrochemical polarization curve measurement. The results show that surface roughness (Ra) of the weld zone, heat affect zone (HAZ), and base metal after SURT was reduced to 0.320 μm, 0.156 μm, and 0.227 μm, respectively, and surface morphology became smooth. The plastic deformation layer and working hardening layer were formed at the welded joint. The degree of plastic deformation of the weld zone was more serious than that in the base metal, and grains in weld zone was obviously refined. The thickness of plastic deformation layer was about 100 μm. The surface hardness in the weld zone was highest, which is about 420 HV. The refinement of grains and the increase of surface hardness can improve the fatigue life of welded joint. After SURT, the residual stress in the welded joint changes from residual tensile stress to residual compressive stress, which can also improve fatigue life of the welded joint. Surface corrosion resistance of welded joints after SURT was improved due to smooth surface and the formation of fine grains layer.

1. Introduction

In recent years, with the increasing of train capacity, material property for truck bodies are increasingly high [1,2]. T4003 stainless steel, which is a new type ultra-low carbon ferritic stainless steel, is widely used in railway vehicle manufacturing due to its excellent corrosion resistance and wear resistance [3]. Welding is an important production technique of stainless steel. But the mechanical properties of T4003 stainless steel will be deteriorated after welding. The result of Taban et al. [4] shows that the ferrite grains are coarsen after the welding test, and the toughness of steel is reduced. Cold metal transfer (CMT) welding has advantages of less spatter and higher welding quality. However, the disadvantages of CMT is that a large residual tensile stress in a welded joint is formed after welding treatment. The formation of residual tensile stress will affect the welded joint performance and accelerate the formation of fatigue cracks [5]. According to previous research results, surface peening technology can change the residual stress of the surface. After surface peening treatment, the residual stress at materials surface transforms from residual tensile stress to residual compressive stress [6,7]. However, surface peening would increase surface roughness of material surface. The increase of surface roughness can cause stress concentration and affect the properties of materials. Surface ultrasonic rolling technology is a novel surface strengthening technology. It combines ultrasonic impact energy with static load to treat material surface to improve material property. Surface ultrasonic rolling treatment (SURT) can greatly improve surface hardness, corrosion resistance, reduce surface roughness, and change surface residual stress distribution. The change of material property after SURT can enhance the service life of materials [8,9]. In the past, the research of surface ultrasonic rolling is mainly about the plate materials. The research about influence of surface ultrasonic rolling treatment (SURT) on the performance of welded joint is less common.
This paper studies the effect of SURT on surface properties of a T4003 stainless steel welded joint. Optical microscope and scanning electron microscope were used to observe and analyze surface morphology and surface structural changes of welded joint before and after SURT. The surface roughness, microhardness, and residual stress distribution were measured, respectively. Finally, an electrochemical corrosion test was used to study the change rule of surface corrosion resistance of welded joint before and after SURT. The research results can lay a foundation for the application of ultrasonic rolling treatment technology.

2. Experimental Materials and Methods

In this paper, test material was T4003 ferritic stainless steel, and its chemical composition is shown in Table 1. The thickness of T4003 ferritic stainless steel plate was 6 mm, and the received material was cold rolled. The yield strength and tensile strength of T4003 ferritic stainless steel were 350 MPa and 480 MPa, respectively. The TPS 500i cold metal transfer (CMT) welding machine was used to carry out flat plate welding of T4003 ferritic stainless steel. Welding parameters were shown in Table 2. The welding groove was 60° V groove. Before welding, the flat plate was cleaned by anhydrous ethanol alcohol. There is no backing gas in the welding test. The shielding gas in the welded test was 98% Ar + 2% CO2. The welding solid wire in the welded test is ER308LSi, its diameter was 1.2 mm, and its chemical composition is also shown in Table 1. The macroscopic morphology of T4003 stainless steel welded joint is shown in Figure 1.
The H+B6063 surface ultrasonic rolling machine was used to treat surface of T4003 stainless steel welded joint, as shown in Figure 2. The frequency was 20 kHz, static pressure was 0.2 MPa, the current was 1 A, the linear velocity was 2 m/min, transverse feed was 0.2 mm, and the amplitude was 0.07–0.008 mm.
After the surface ultrasonic rolling test, surface microstructure and rolling surface morphology of welded joint were analyzed by Zeiss Supra field emission gun scanning electron microscope (FEG-SEM, Carl Zeiss, Jena, Germany). Surface roughness of the welded joint was measure by Leica three-dimensional microscope (Leica Microsystems, Heidelberg, Germany). The corrosion method of metallographic samples was electrolytic corrosion with 10% oxalic acid solution. The corrosion parameters were as follows: voltage 6 V, current 5.8 A, and corrosion for 1 min. The surface hardness was measured by a FM-700 hardness tester (Future-Tech Corporation, Kawasaki, Japan) with a load of 2.45 N and dwell time of 15 s. The residual stress tests of the welded joint before and after SURT was carried out with i-XRD X-ray residual stress tester (Proto Company, Wensor, Canada). The type of tube ball was Cr-ka, the test voltage was 20 kV, the operating current was 4 mA, and the diffraction Angle was 156.4°. The Angle meter was used for accurate measurement during the test process. The exposure time was 10 s, the spot size was 2 mm, the diffraction plane was (211), the Bragg Angle was 2θ is 156.41°, the peak positioning method is Gaussian, and there was 80% gain correction P/G(s). The polarization curves of the welded joint were measured by PARSTAT2273 electrochemical analysis station (Princeton Applied Research, Oak Ridge, USA). The electrolyte is an aqueous solution of NaCl with a concentration of 3.5%. Electrochemical parameters: reference electrode (Ag-AgCl electrode), auxiliary electrode (platinum electrode), the tested sample area is 1 cm2.The measured potential was −1.0 V ~ +1.0 V, and scanning speed was 0.005 V/s.

3. Results and Discussion

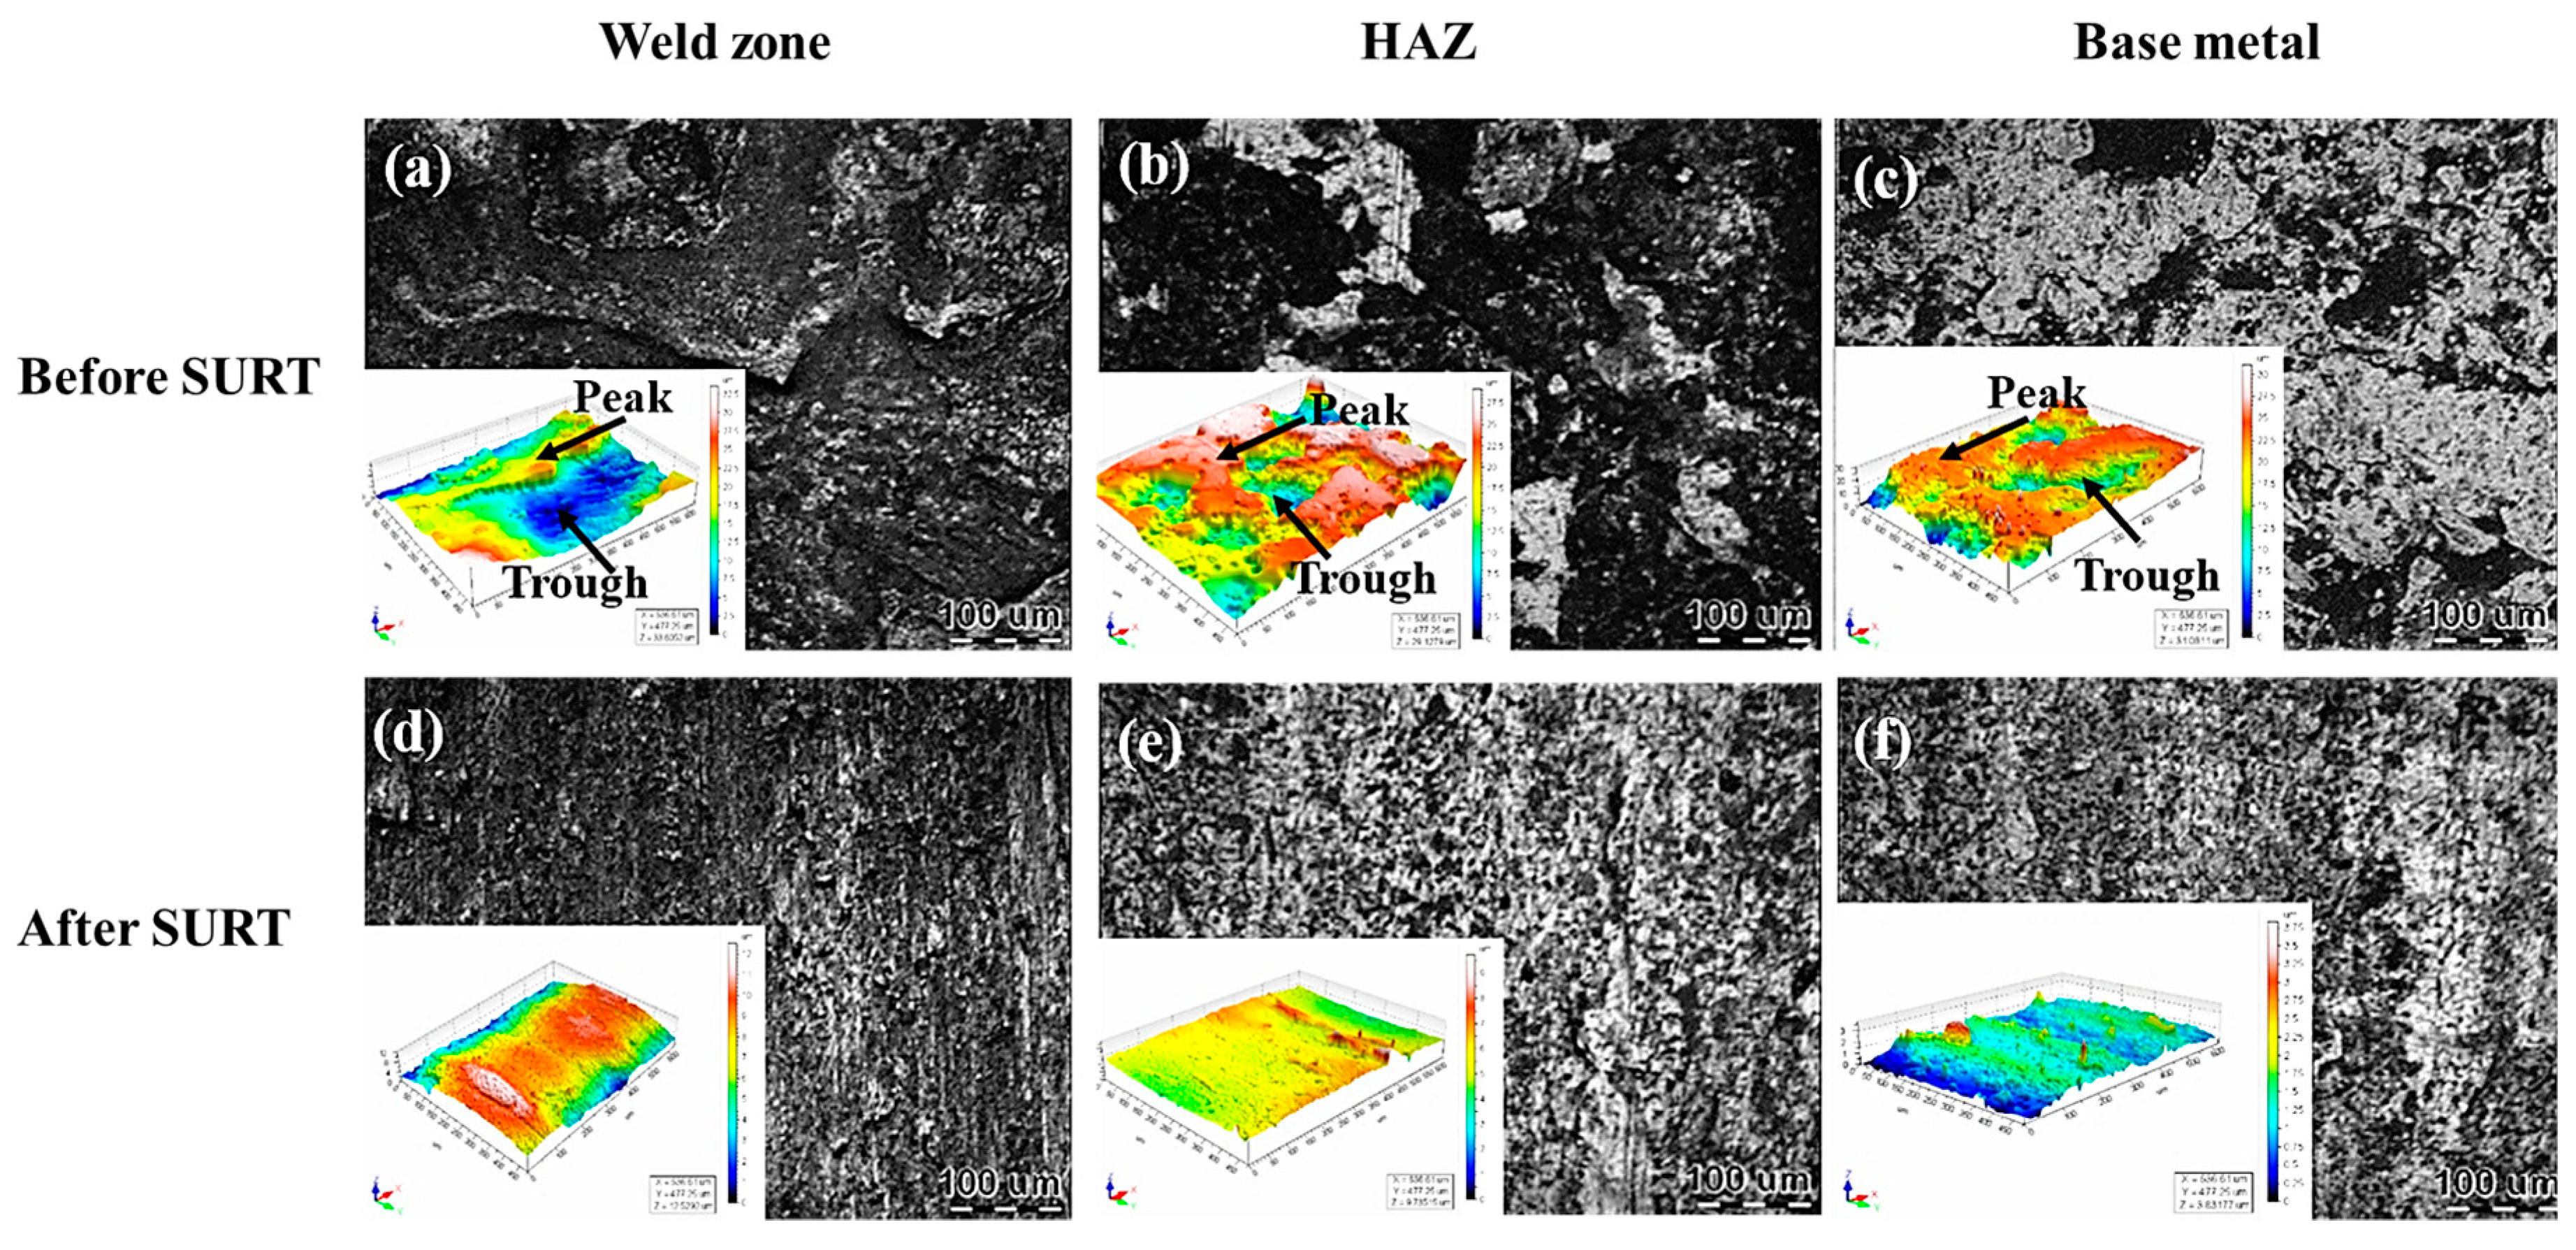
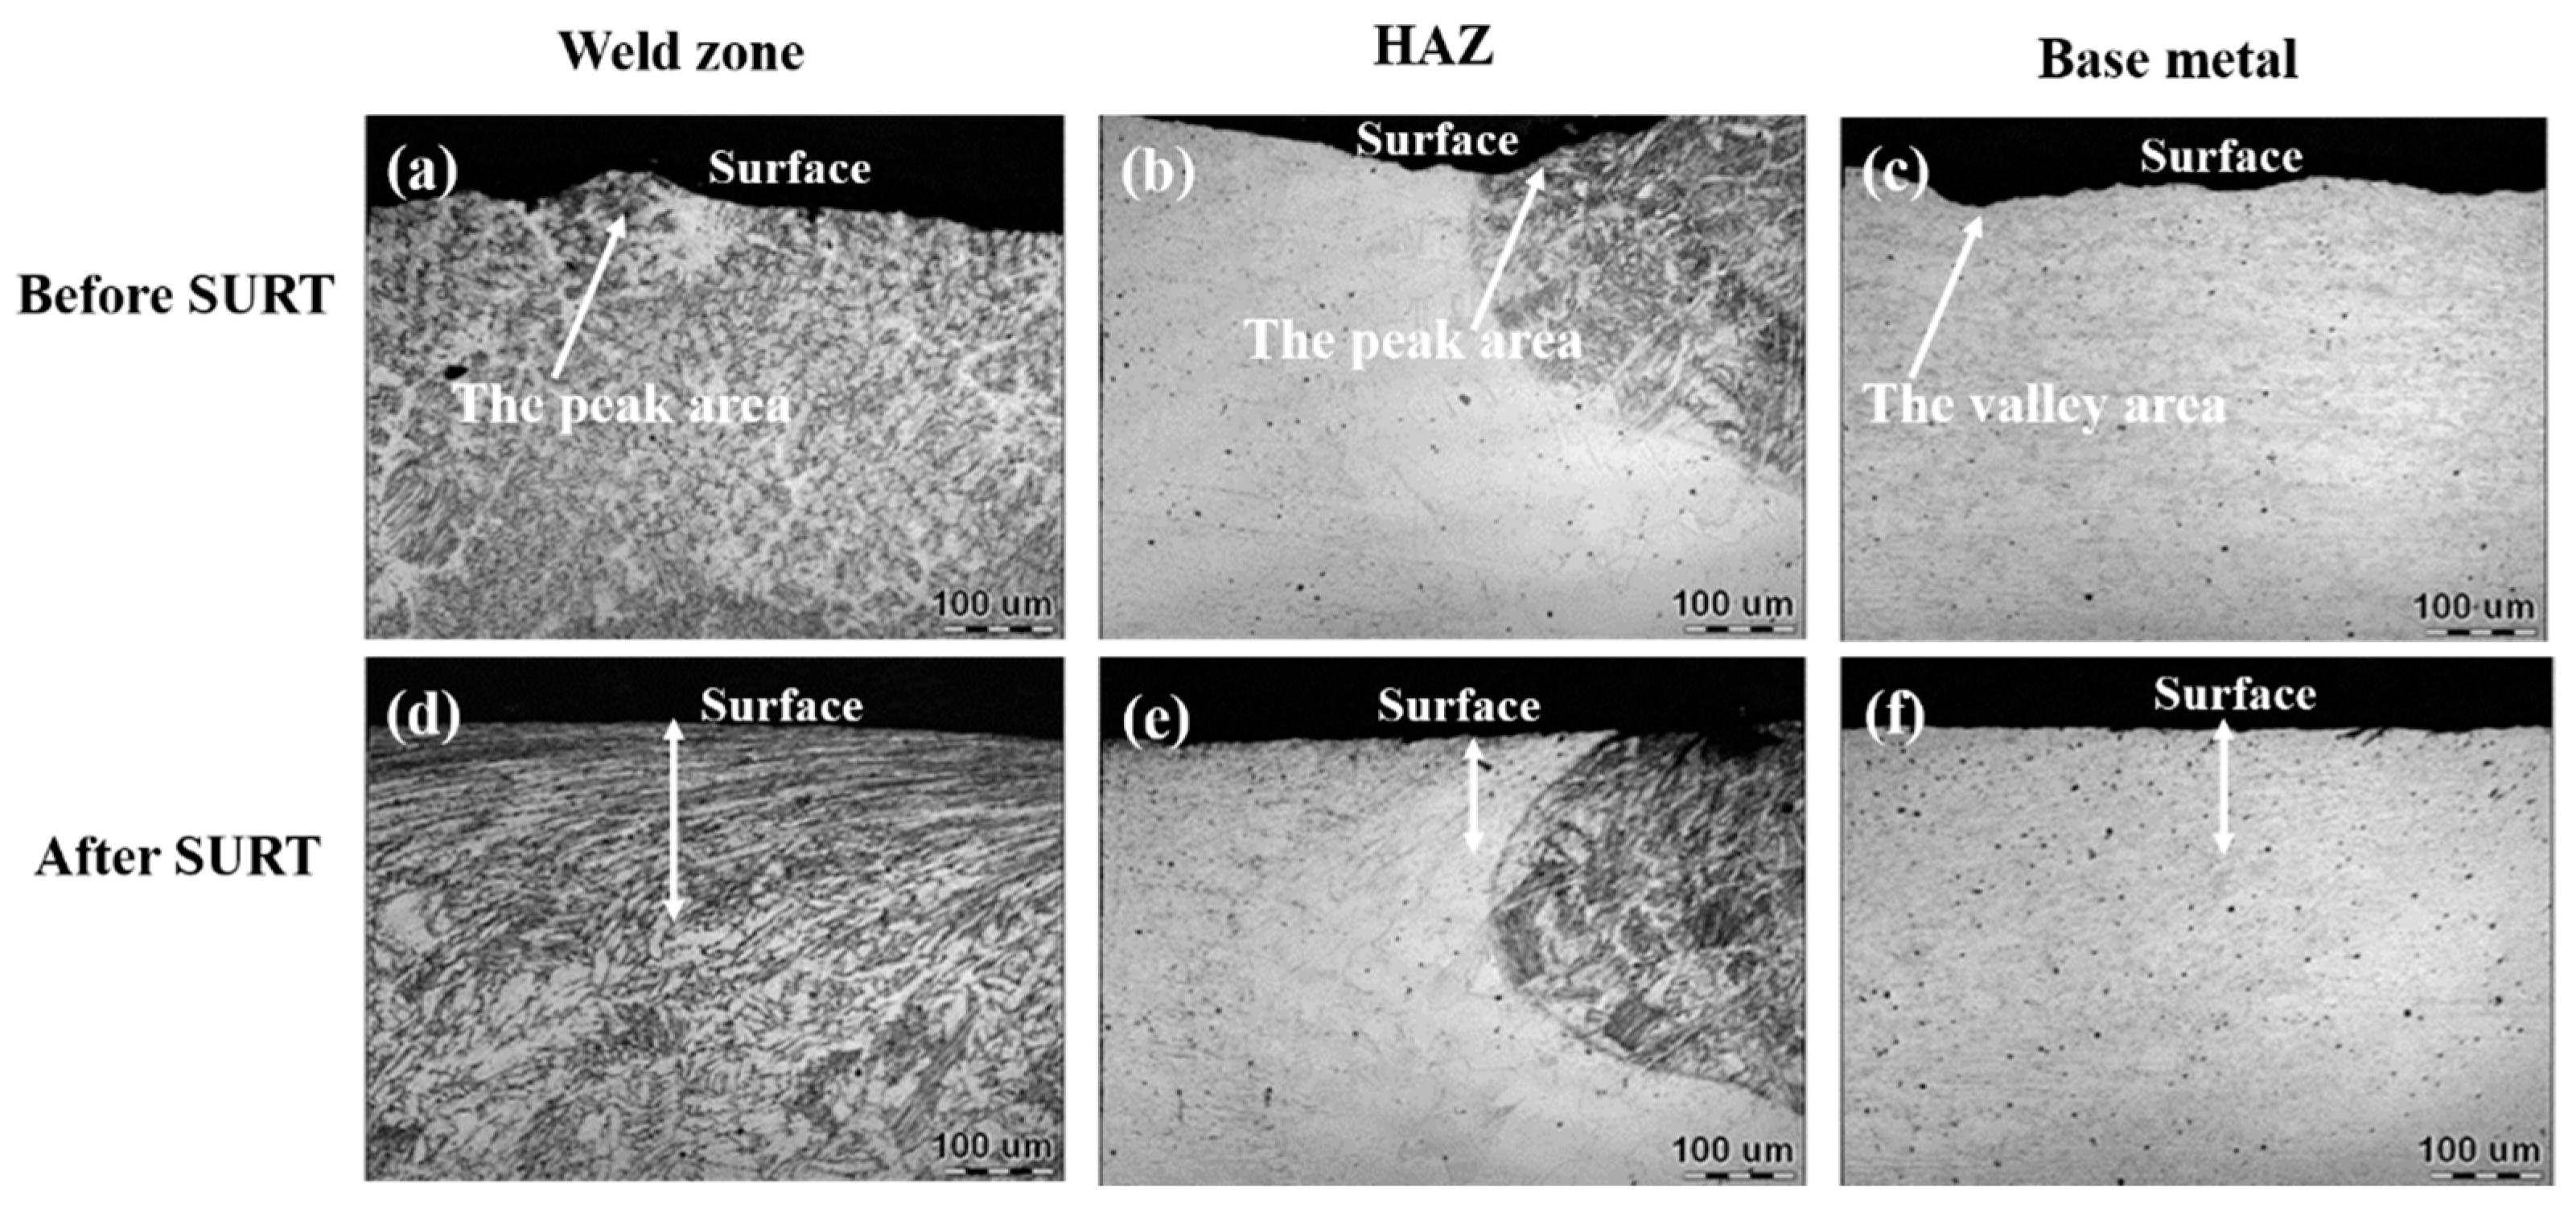
3.1. Surface Morphology

Figure 3 shows the surface morphology of T4003 stainless steel welded joint before and after SURT. The difference of surface morphology of the welded joint is obvious before and after SURT. Before SURT, the surface morphology of welded joint is very unsmooth, and there are peaks and troughs at welded joint surface, as shown in Figure 3a,c. However, after SURT, the welded joint surface morphology became obviously smooth. No peaks and troughs at the welded joint are observed, as displayed in Figure 3d,f.
There are many peaks and valleys on the welded joint surface before SURT, as shown in Figure 3a,c, which cause obvious stress concentration. Arola et al. proposed the formula of stress concentration factor for machined surface [10]:
K st = 1 + n ( R a ρ ) ( R y R z ) ,
where Kst is stress concentration factor, Ra is the average roughness, Ry is the difference in peak and valley height in the surface contour, Rz is ten-point roughness, ρ is the radius of the contour valley, under shear stress n = 1, and under average tension n = 2. The value of Ry and Ra before SURT is higher than that after SURT. Therefore, the peaks and valleys of the welded joint before SURT can cause the increase stress concentration factor to lead to increase of stress concentration. The research results of Kapoor [11] et al. showed that the Hertz contact stress level of around the rough peak is 8 times higher than that of smooth surface. The stress concentration of a welded joint is the main factor to lead to fatigue failure [12]. However, there were no obvious peaks and valleys on the welded joint surface after SURT, as shown in Figure 3d,f. Therefore, fatigue life of welded joint can be significantly improved after SURT.
Table 3 shows the variation of surface roughness value of T4003 ferritic stainless steel welded joint at different positions before and after SURT. For the weld zone, before SURT, surface roughness value (Ra) is large. The surface roughness value at the weld zone reaches to 1.817 μm, the minimum value is only 0.593 μm, and the difference value between maximum value and minimum value is 1.224 μm. The surface roughness value of heat affect zone (HAZ) varies from 1.331 to 4.671 μm, and the difference between maximum value and minimum value is 3.340 μm. Surface roughness value of the base metal varies from 1.081 to 3.361 μm, and the difference value between maximum value and minimum value is 2.280 μm. However, after SURT, the weld zone, HAZ, and base metal of surface roughness reduce to an average value of 0.320 μm, 0.156 μm, and 0.227 μm, respectively. The percentage decline of surface roughness value after SURT is about 70%, 94%, and 89%, respectively.
It can be concluded that surface roughness of a welded joint after SURT is greatly reduced, and surface morphology became smooth. The reduction of surface roughness will significantly improve fatigue performance of welded joints [13].

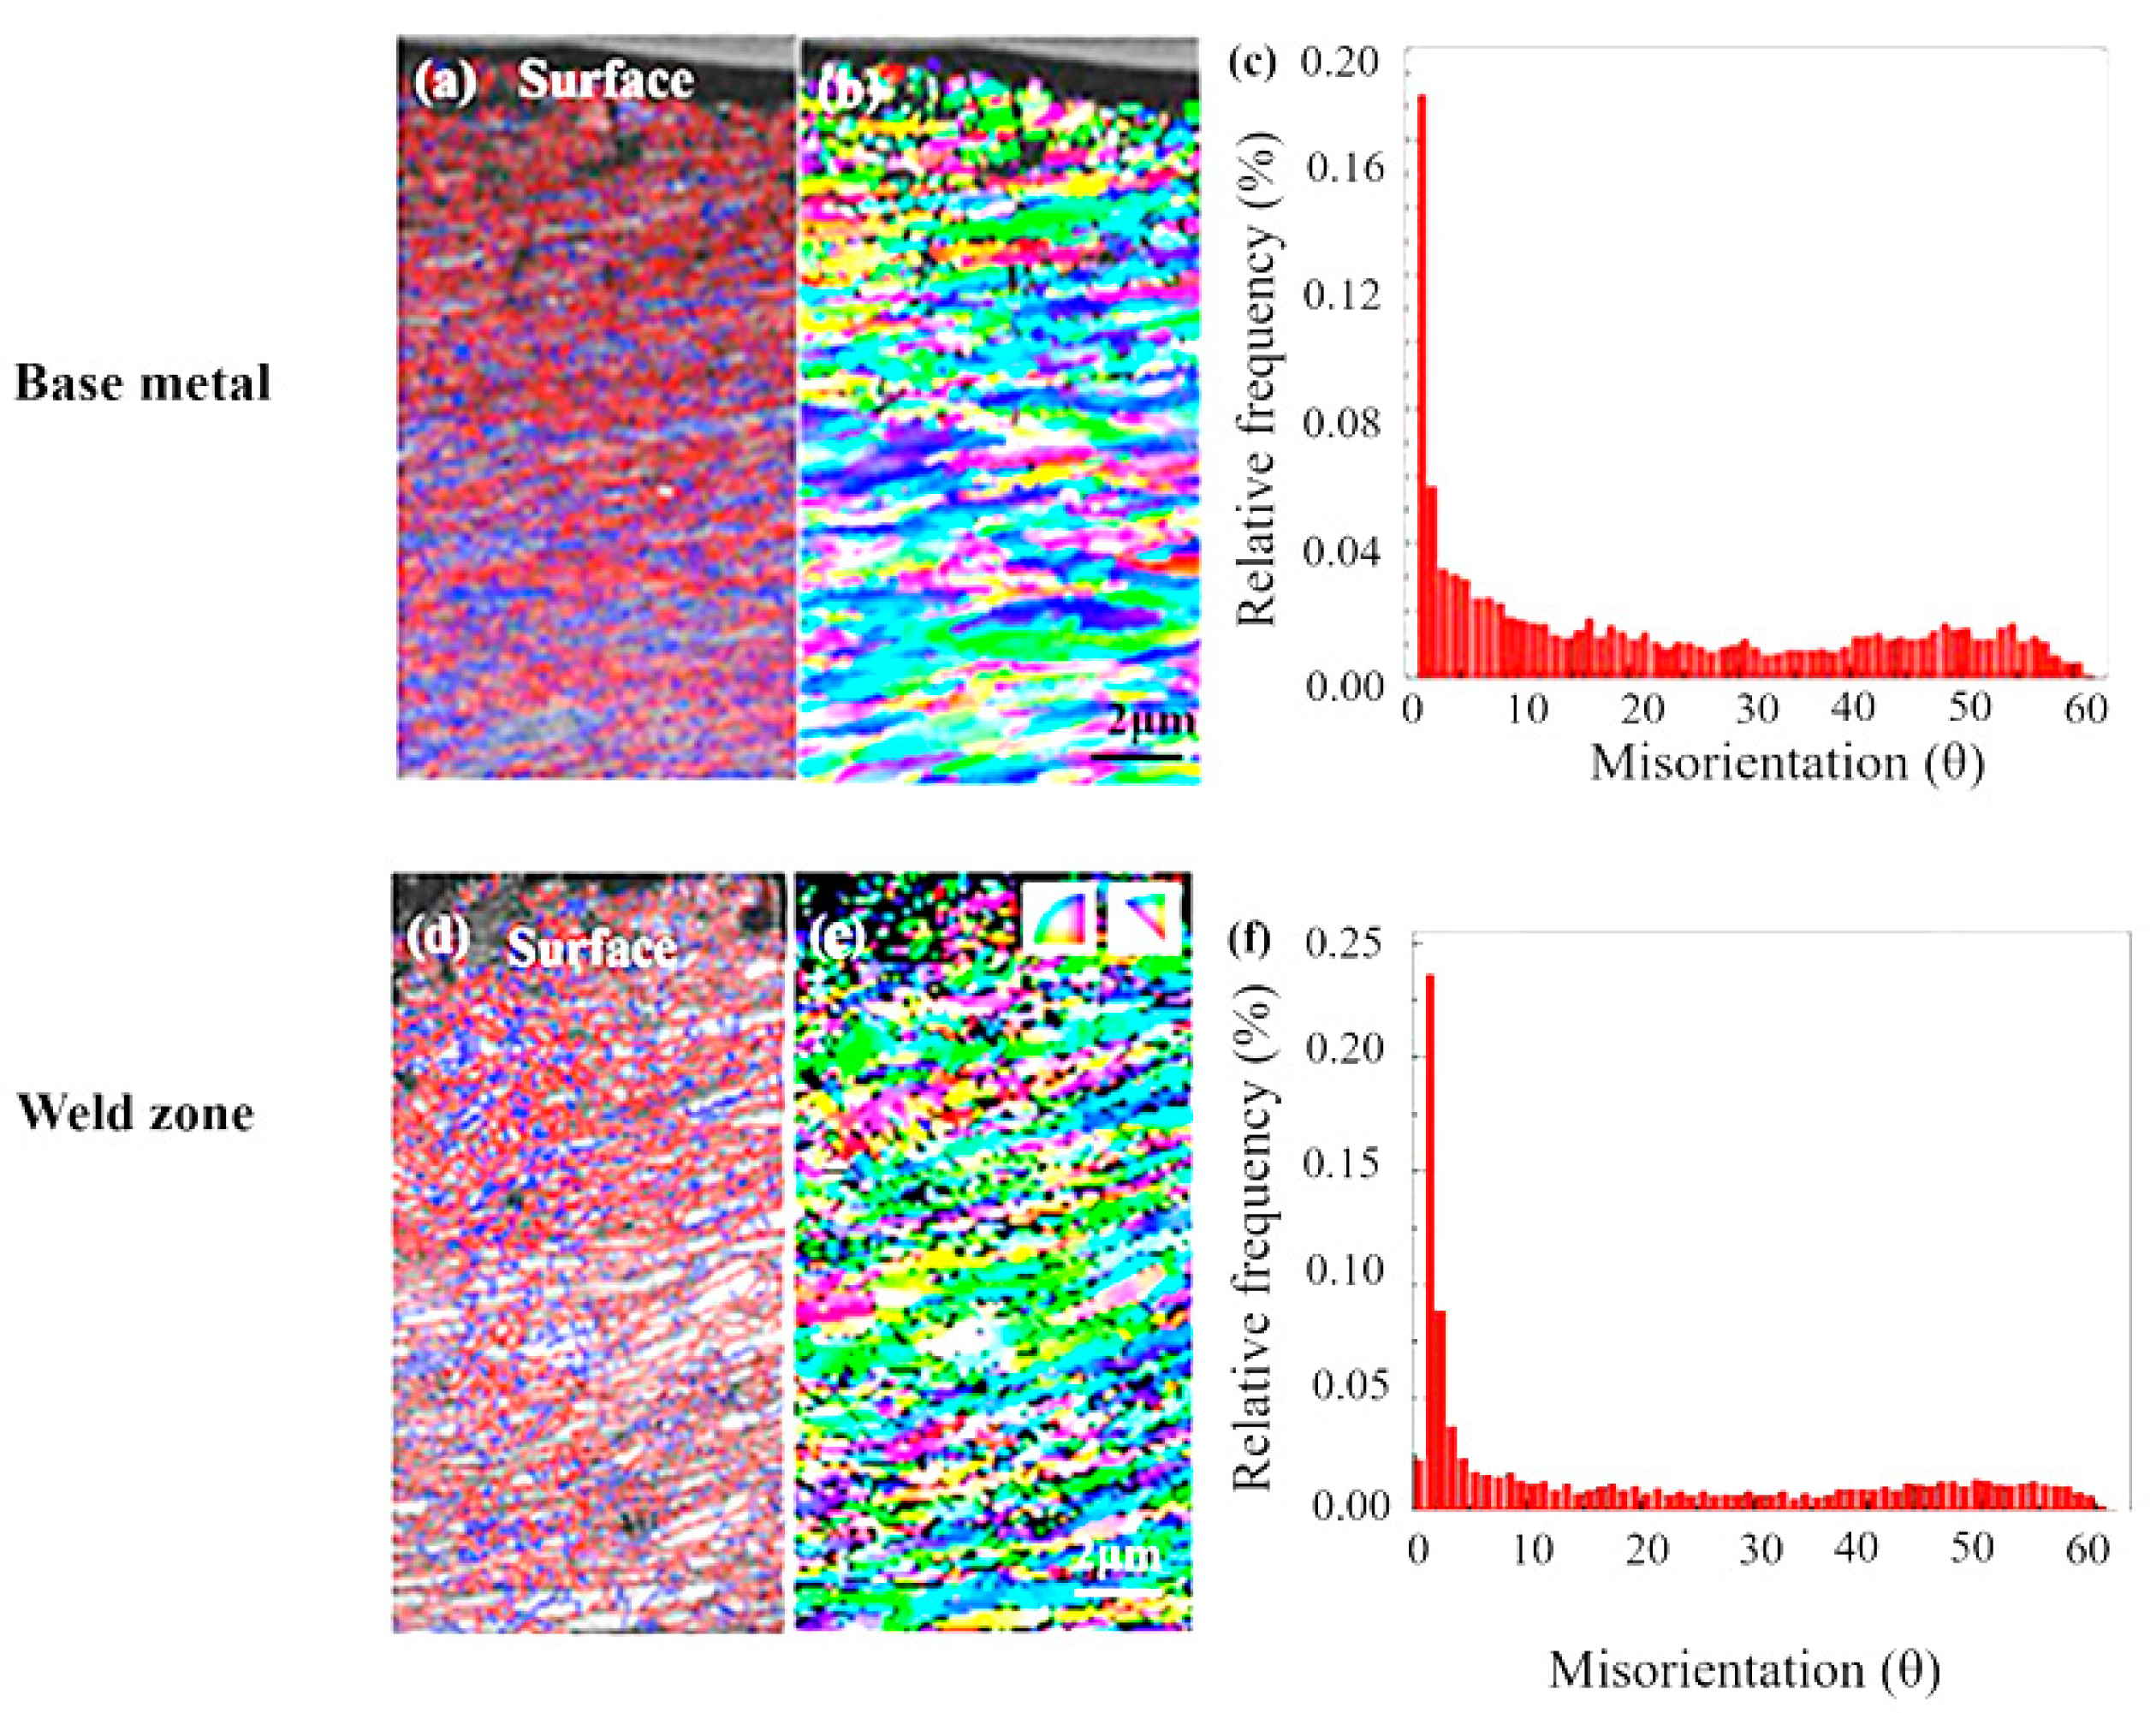
3.2. Surface Microstructure

Figure 4 shows the variation of surface microstructure of the T4003 stainless steel welded joint before and after SURT. The austenite wire was used in the welding test. Therefore, the microstructure of the weld zone was austenite and a small amount of ferrite. The microstructure of the HAZ is ferrite and a small amount of Martensite, and the microstructure of the base metal is ferrite. The evolution of the microstructure of the welded joint is similar to the result of Zhang et al. [14]. The obvious plastic deformation was formed in the weld zone, HAZ, and base metal after SURT.
For the weld zone, the microstructure had no obvious change before SURT, and surface morphology was very uneven, with obvious peaks and troughs, as shown in Figure 4a. The surface microstructure of weld zone exhibited significant plastic deformation after SURT. The thickness of plastic deformation layer was about 100 μm. Moreover, the surface morphology was obviously smooth, as shown in Figure 4b. The degree of plastic deformation in the HAZ was less than that of the weld zone; the depth of plastic deformation layer in HAZ was only about 70 μm. For the base metal, the depth of plastic deformation layer was only about 50 μm. There was a large amount of austenite in the weld zone. The austenite in the weld zone, as a soft phase, can accelerate the plastic deformation. Therefore, the thickness of plastic deformation layer in the weld zone is largest. The refinement of grain can improve strength and toughness of welded joint.
Due to large amount of plastic deformation in the near surface of welded joint, the plastic deformation in the near surface was analyzed by use of electron backscatter diffraction (EBSD). The EBSD micrographs of the weld zone and base metal after SURT are presented in Figure 5. The obvious plastic deformation is produced, and the grain shape transform equiaxial to lath. This is due to the ultrasonic impact process, the ultrasonic impact on welded joint surface tens of thousands of seconds. The fraction of high angle grain boundary (HAGB) is increased, and grains are obviously refined. The degree of grain refinement of the weld zone is more severe than that of the base metal. According to the research results of Izotov et al. [15] and Tao et al. [16], the refinement process was that, firstly, the dislocation walls were formed. Then, as the degree of plastic deformation increased, the dislocation density was increased. As the balance between dislocation multiplication rate and annihilation rate is reached, the dislocation walls change to sub-boundaries. Finally, the sub-boundaries would evolve into the HAGB with the increase of plastic deformation. The grain refinement can improve fatigue property and surface properties of a welded joint [17].

3.3. Surface Hardness

The microstructural evolution of welded joint after SURT can lead to the change of the variation of surface hardness. Figure 6 shows the variation of hardness of the T4003 stainless steel welded joint at different depth from surface before and after SURT. The variation rule of hardness in the weld zone, HAZ, and base metal is similar. With the increase of depth from surface, the hardness is gradually reduced. After SURT, surface hardness in weld zone is highest, which is about 420 HV. The surface hardness in HAZ is similar to that in the base metal, which is about 260 HV. According to results of Figure 4, there is a large amount of plastic deformation in the surface layer after SURT, which leads to the increase of hardness. After SURT, the hardening depth in the weld zone can reach to 1500 μm, the hardened region in HAZ can reach to 750 μm, and the hardening depth in the base metal can also reach to 600 μm. According to the Hall-Peth relation equation [18]:
σ s = σ 0 + k d 1 2 ,
where σs is yield strength, σs = 3.577 HV [19], σ0 and k are constants with a value of 43 MPa and 22 MPa/mm−1/2, respectively, based on literature [20], and d is the grain size. After surface ultrasonic rolling treatment, the refinement of grains can enhance the yield strength of a welded joint. Therefore, the hardness of a welded joint is increased due to the refinement of grains.

3.4. Surface Residual Stress

The existence of residual tensile stress can significantly affect the welded joint performance. The residual compressive stress can greatly improve the metal performance [21]. Figure 7 shows the variation of residual stress before and after SURT. A large amount of residual compressive stress was generated on the welded joint surface after SURT. Compared with the traditional surface processing method, SURT can transform from the residual tensile stress to the residual compressive stress and reduce the surface damage. It can be seen from Figure 7, the residual stress is residual tensile stress at about 19 mm from the weld toe before SURT. However, after SURT, the residual stress is converted to the residual compressive stress, and the maximum compressive stress is −732 MPa. At the position from the weld toe of 60 mm, the welded joint surface is not treated by SURT. Therefore, the residual stress is still residual tensile stress.
It is known that residual compressive stress of a T4003 stainless steel welded joint is produced by SURT. The existence of residual compressive stress can greatly squeeze surface fatigue cracks. Therefore, residual compressive stress can increase fatigue cracks close force and reduce the tendency of the extension of cracks and effectively restrain the early fatigue crack formation. However, the surface tensile stress of a welded joint before SURT can accelerate the formation of fatigue cracks [22]. At the same time, residual tensile stress can lead to stress concentration at peaks and troughs, not only reducing the service life of the welded joint but also increasing stress corrosion on the welded joint surface. Therefore, SURT can improve a T4003 ferritic stainless steel welded joint fatigue life.

3.5. Corrosion Property

The polarization curve in the weld zone and base metal before and after SURT was measured, as shown in Figure 8. The corrosion parameters of the samples derived from Tafel polarization curves are listed in Table 4. Before SURT, the corrosion potential (Ecorr) of the weld zone was about −0.61 V. However, after SURT, the corrosion potential of weld zone increased to about −0.41 V. For the base metal, before SURT, the corrosion potential was about −0.50 V, and, after SURT, the corrosion potential increased to about −0.46 V. Before SURT, the corrosion potential of the weld zone (−0.61 V) was lower than that of the base metal (−0.50 V). The reason is that the surface of weld zone was uneven, as shown in Figure 3a. However, after SURT, the corrosion potential of the weld zone was higher than that of the base metal. After SURT, the weld zone and base metal exhibited better corrosion resistance. The increase of corrosion resistance of the weld zone is obvious.
As for the corrosion current density (icorr), after SURT, the current density of weld zone and base metal was significantly lower than that before SURT, as shown in Table 4. Especially in the weld zone, the corrosion inhibition efficiency(η) caused by SURT could reach to 79.05%. It indicates that the corrosion resistance of the weld zone and base metal was enhanced after SURT.
The reasons for the improvement of surface corrosion resistance were analyzed as follows: With the increase of surface roughness, the welded joint surface can more easily release electron. This will increase the corrosion rate of welded joint. This point is confirmed by Li et al. [23]. When the welded joint is immersed into the corrosive solution, the smooth surface of the welded joint after SURT can reduce the surface area in contact with the corrosive solution. Therefore, after SURT, the smooth surface can reduce the corrosion rate of welded joint [24]. On the other hand, the existence of surface residual compressive stress is beneficial to hinder the generation and expansion of surface cracks, so as to improve the corrosion resistance of stainless steel.

4. Conclusions

In this paper, influence of surface ultrasonic rolling on surface microstructure and corrosion property of T4003 ferritic stainless steel welded joint was studied. The surface microstructure, surface residual stress and corrosion property before and after SURT was analyzed. The main conclusions are as follows:
(1) The surface roughness (Ra) of the welded joint after SURT is reduced, and the surface morphology becomes smooth because SURT can flatten the convex positions at welded joint surface due to the static pressure.
(2) After SURT, the plastic deformation layer and working hardening layer are formed at the welded joint. The degree of plastic deformation of the weld zone is the most serious, and the grains in weld zone is refined. The surface hardness in the weld zone is higher than that in the HAZ and base metal. The refinement of grain and the increase of surface hardness can improve the fatigue life of a welded joint.
(3) After SURT, the residual stress of welded joint changes from the residual tensile stress to the residual compressive stress. The maximum compressive residual stress value in weld zone is about −742 MPa. The production of residual compressive stress can improve the fatigue life of welded joint.
(4) The corrosion potential of the welded joint after SURT is higher than that before SURT, and the current density is also lower after SURT. The surface corrosion resistance of the welded joints after SURT is improved, owing to the formation of smooth surface and residual compressive stress.

Author Contributions

Methodology, R.Y. and P.L.; formal analysis, P.L., R.Y. and X.G.; investigation, R.Y. and P.L.; resources, G.Z.; writing—original draft preparation, R.Y. and P.L.; writing—review and editing, P.L. and G.Z. All authors have read and agreed to the published version of the manuscript.

Funding

This research was supported by Doctoral Start-up Foundation of Liaoning Province (20170520377).

Conflicts of Interest

The authors declare no conflict of interest.

References

  1. Widiyarta, I.M.; Franklin, F.J.; Kapoor, A. Modelling thermal effects in ratcheting led wear and rolling contact fatigue. Wear 2008, 256, 1325–1331. [Google Scholar] [CrossRef]
  2. Stone, D.H.; Steel, R.K. The effect of mechanical properties upon the performance of railroad rails. In Rail Steels—Developments, Processing and Use; ASTM International: Philadelphia, PA, USA, 1976; pp. 21–43. [Google Scholar]
  3. Zheng, H.B.; Ye, X.N.; Jiang, L.Z.; Wang, B.S.; Liu, Z.Y.; Wang, G.D. Study on microstructure of low carbon 12% chromium stainless steel in high temperature heat-affected zone. Mater. Des. 2010, 31, 4836–4841. [Google Scholar] [CrossRef]
  4. Taban, E.; Kaluc, E.; Dhooge, A. Hybrid (plasma + gas tungsten arc) weldability of modified 12% Cr ferritic stainless steel. Mater. Des. 2009, 30, 4236–4242. [Google Scholar] [CrossRef]
  5. Tang, X.; Zhang, S.; Cui, X.; Zhang, C.H.; Liu, Y.; Zhang, J.B. Tribological and cavitation erosion behaviors of nickel-based and iron-based coatings deposited on AISI 304 stainless steel by cold metal transfer. J. Mater. Res. Technol 2020, 9, 6665–6681. [Google Scholar] [CrossRef]
  6. Bagherifard, S.; Fernandez-Pariente, I.; Ghelichi, R.; Guagliano, M. Effect of severe shot peening on microstructure and fatigue strength of cast iron. Int. J. Fatigue 2014, 65, 64–70. [Google Scholar] [CrossRef]
  7. Mikova, K.; Bagherifard, S.; Bokuvka, O.; Guagliano, M.; Trško, L. Fatigue behavior of X70 microalloyed steel after severe shot peening. Int. J. Fatigue 2013, 55, 33–42. [Google Scholar] [CrossRef]
  8. Zhang, Y.L.; Lai, F.Q.; Qu, S.G.; Liu, H.P.; Jia, D.S.; Du, S.F. Effect of ultrasonic surface rolling on microstructure and rolling contact fatigue behavior of 17Cr2Ni2MoVNb steel. Surf. Coat. Technol. 2019, 366, 321–330. [Google Scholar] [CrossRef]
  9. Yang, J.; Liu, D.X.; Zhang, X.H.; Liu, M.X.; Zhao, W.D.; Liu, C.S. The effect of ultrasonic surface rolling process on the fretting fatigue property of GH4169 superalloy. Int. J. Fatigue 2020, 133, 105373. [Google Scholar] [CrossRef]
  10. Arola, D.; WillIams, C.L. Estimating the fatigue stress concentration factor of machined Surfaces. Int. J. Fatigue 2002, 24, 923–930. [Google Scholar] [CrossRef]
  11. Kapoor, A.; Franklin, F.J.; Wong, S.K.; Ishida, M. Surface roughness and plastic flow in rail wheel contact. Wear 2002, 253, 257–264. [Google Scholar] [CrossRef]
  12. Nandagopal, A.; Chai, R.; Boay, G.; Srikanth, N. Influence of stress ratio and stress concentration on the fatigue behaviour of hygrothermal aged multidirectional CFRP composite laminate. Int. J. Fatigue 2020, 137, 105651. [Google Scholar] [CrossRef]
  13. Bagehorn, S.; Wehr, J.; Maier, H.J. Application of mechanical surface finishing processes for roughness reduction and fatigue improvement of additively manufactured Ti-6Al-4V parts. Int. J. Fatigue 2017, 102, 135–142. [Google Scholar] [CrossRef]
  14. Zhang, Z.H.; Wang, Z.B.; Wang, W.X.; Yan, Z.F.; Dong, P.; Du, H.Y.; Ding, M. Microstructure evolution in heat affected zone of T4003 ferritic stainless steel. Mater. Des. 2015, 68, 114–120. [Google Scholar] [CrossRef]
  15. Izotov, V.I.; Pozdnyakov, V.A.; Luk’yanenko, E.V.; Yu, O.; Sanova, U.; Filippov, G.A. Influence of the pearlite fineness on the mechanical properties, deformation behavior, and fracture characteristics of carbon steel. Phys. Met. Metallogr 2007, 103, 519–529. [Google Scholar] [CrossRef]
  16. Tao, N.R.; Wang, Z.B.; Tong, W.P.; Sui, M.L.; Lu, J.; Lu, K. An investigation of surface nanocrystallization mechanism in Fe induced by surface mechanical attrition treatment. Acta Mater 2002, 50, 4603–4616. [Google Scholar] [CrossRef]
  17. Sajadifar, S.V.; Wegener, T.; Yapici, G.G.; Niendorf, T. Effect of grain size on the very high cycle fatigue behavior and notch sensitivity of titanium. Theor. Appl. Fract. Mech. 2019, 104, 102362. [Google Scholar] [CrossRef]
  18. Petch, N. The cleavage strength of polycrystals. Iron Steel Inst. 1953, 174, 25–28. [Google Scholar]
  19. Busby, J.T.; Hash, M.C.; Was, G.S. The relationship between hardness and yield stress in irradiated austenitic and ferrite steels. J. Nucl. Mater. 2005, 336, 267–278. [Google Scholar] [CrossRef]
  20. Liu, C.M.; Wang, J.J.; Lin, R.R.; Cui, W.F.; Bai, Y.G. Role of small amounts of carbon in fine grain strengthening of steels. Mater. Sci. Technol. 2001, 9, 301–304. (In Chinese) [Google Scholar]
  21. Li, H.Y.; Sun, H.L.; Bowen, P.; Knott, J.F. Effects of compressive residual stress on short fatigue crack growth in a nickel-based superalloy. Int. J. Fatigue 2018, 108, 53–61. [Google Scholar] [CrossRef] [Green Version]
  22. McCallion, H.; Lotifi, M. Tensile surface stresses and fatigue in plain journal bearings. Tribo. Int. 1992, 25, 247–257. [Google Scholar] [CrossRef]
  23. Li, W.; Li, D.Y. Influence of surface morphology on corrosion and electronic behavior. Acta Mater. 2006, 54, 445–452. [Google Scholar] [CrossRef]
  24. Ye, H.; Sun, X.; Liu, Y.; Rao, X.X.; Gu, Q. Effect of ultrasonic surface rolling process on mechanical properties and corrosion resistance of AZ31B Mg alloy. Surf. Coat. Technol. 2019, 372, 288–298. [Google Scholar] [CrossRef]
Figure 1. View of T4003 stainless steel welded joint.
Metals 10 01081 g001
Figure 2. Schematic diagram of surface ultrasonic rolling machine.
Metals 10 01081 g002
Figure 3. Surface morphology of T4003 ferritic stainless steel welded joint before and after SURT. (ac) Surface morphology before surface ultrasonic rolling treatment (SURT). (df) Surface morphology after SURT. (a,d) Weld zone. (b,e) Heat affect zone (HAZ). (c,f) Base metal.
Metals 10 01081 g003
Figure 4. Surface microstructure of T4003 ferritic stainless steel welded joint before and after surface ultrasonic rolling. (ac) Surface morphology before surface ultrasonic rolling. (df) Surface morphology after surface ultrasonic rolling. (a,d) Weld zone. (b,e) HAZ. (c,f) Base metal.
Metals 10 01081 g004
Figure 5. The EBSD micrographs of T4003 ferritic stainless steel welded joint after SURT. (ac) Base metal. (df) Weld zone. Red lines: High angle grain boundary (HAGB), >10°; blue lines: low angle grain boundary (LAGB), 2–10°.
Metals 10 01081 g005
Figure 6. The variation of hardness of T4003 ferritic stainless steel welded joint at different depth from surface before and after SURT. (a) Weld zone. (b) HAZ. (c) Base metal.
Metals 10 01081 g006
Figure 7. (a) Schematic diagram of measure residual stress. (b) Variation of residual stress of T4003 ferritic stainless steel welded joint before and after SURT.
Metals 10 01081 g007
Figure 8. The variation of electric polarization of T4003 ferritic stainless steel welded joint before and after surface ultrasonic rolling. (a) Weld zone. (b) Base metal.
Metals 10 01081 g008
Table 1. The chemical composition of T4003 ferritic stainless steel and ER308LSi welding wire (wt.%).
MaterialsCSiMnPSCrNiTiNFe
T4003≤0.03≤1.01.00–2.50≤0.04≤0.01511.00–13.000.30–1.00.1–0.35≤0.025Bal.
ER308LSi0.0180.611.910.0110.01719.849.95--Bal.
Table 2. Welding parameters of T4003 ferritic stainless steel plate.
Welding Current/AArc Voltage/VWire Feed Rate m/minWelding Rate mm/minGas Flow l/minStick Out/mmGap/mm
22022.89.236015120
Table 3. The variation of surface roughness of T4003 ferritic stainless steel welded joint before and after SURT (unit: μm).
SamplesWeld ZoneHAZBase Metal
Non-surface ultrasonic rolling sample0.5934.6711.081
1.8172.5772.083
1.2752.7963.087
0.6362.6993.361
0.9931.3311.192
Average value1.0602.8102.160
surface ultrasonic rolling sample0.2920.1070.390
0.3120.1430.282
0.3180.1260.159
0.2970.2280.154
0.3810.1760.148
Average value0.3200.1560.227
Table 4. Corrosion parameters of the samples derived from Tafel polarization curves.
Sampleβa (mV/dec)βc (mV/dec)Ecorr (V)icorr (10−7A/cm2)η (%)
weld-untreated68.719−37.030−0.61−2.410
weld-SURT54.941−20.171−0.41−0.50579.05%
base metal-untreated28.580−21.862−0.50−2.809
base metal-SURT51.824−24.130−0.46−1.18857.71%

