Article

Effect of Residual Stresses on the Fatigue Behaviour of Torsion Bars

Faculty of Mechanical Engineering, University of Maribor, Smetanova ul. 17, 2000 Maribor, Slovenia
*
Author to whom correspondence should be addressed.
Metals 2020, 10(8), 1056; https://doi.org/10.3390/met10081056
Submission received: 1 July 2020 / Revised: 28 July 2020 / Accepted: 29 July 2020 / Published: 5 August 2020
(This article belongs to the Special Issue Fatigue Limit of Metals)

Abstract

:
This article deals with the effect of residual stresses on the fatigue behaviour of torsion bars exposed to cyclic torsional loading with different effective loading ratios, R. The residual compressive stresses on the surface were induced during technological processes by cold surface rolling and torsional overloading (presetting) into the plastic region due to the increase in the elastic linear range for torque. In the paper, we consider two different technological processes for introducing compressive residual stress on the surface of same material. We analysed the stress states affected by different residual and applied stress using the Drucker-Prager criterion in order to determine the actual stress state. Results show that the fatigue limit can be achieved if the maximum principal stresses (combined from residual and applied stresses) do not overcome the safe stress zone. As soon as the maximum principal stress reaches the edge of the safe zone, the number of cycles to failure rapidly reduces. Experimental results show that the effective loading ratio Reff, and consequently the stress amplitude, varies through the cross section of the bar. This initiates the fatigue crack under the surface, in the highest amplitude stress zone, independent of the effective loading ratio Reff. Consequently, increasing the compressive residual stresses on the surface by a second technological process has no significant effect on fatigue crack initiation in situ far from the surface. Increasing the plastic torsional prestress can shift the maximum stress amplitude far from the surface, but a significant volume of material should remain elastically loaded in order to ensure balance with compressive stresses from the surface of the solid bar section.

1. Introduction

Torsion bars are often used as springs in suspensions to mitigate road surface irregularities and shock impact in vehicles and caterpillars [1]. In order to achieve higher linear characteristics of the suspension, compressive residual stresses are introduced in torsion bars [2]. Compressive residual stresses are usually introduced by cold rolling and plastic prestressing. This is common for spring torsion bars, i.e., the final products shown in Figure 1 [3]. The spring bar is initially formed with the necessary contour at assembly. It is then placed in a fixture that loads it exactly as it will be loaded in operation, but above its (shear) yield strength, to preset it. When the load is released, it springs back to a new shape, the one desired for assembly. However, the elastic recovery has now placed the yielded material into a residual stress state, which is in the opposite (compressive) direction from that of the applied load. Prestressing to the plastic range introduces compressive residual stresses under the surface and to balance them, tensional residual stresses arise in the elastic part of the cross section of the solid bar.
In the torsional spring bar, these compressive residual stresses at and under the surface will act to protect the surface against maximum applied shear stress. It is crucial for a torsion spring to survive the prescribed lifetime in the number of cycles with a given required torque [4]. This approach is useful for a torsion bar where the service torque is unidirectional.
Thus, it is still an open question as to how high the compressive residual stresses should be and how the distribution of residual stresses through the thickness can retard fatigue crack initiation and extend the number of cycles to failure of prestressed spring bars. In this paper, we analyse the effect of compressive residual stresses introduced into the torsion bar by two technological processes, described in literature for the first time in [3].
The first process, named technology A, consists of cold surface rolling and then twisting the torsion bar into a plastic region (presetting) with up to 4.3% of plastic strain at the surface. The second process, technology B, consists of twisting the torsion bar into the plastic region (presetting) to 2.15% strain, then cold rolling at the surface, and finalising with an additional presetting of 2.15% strain. The technological parameters are controlled in both processes. Cold surface rolling is performed in order to introduce compressive residual stresses into the thin surface layer of the torsion bar and to reduce surface roughness. Plastic presetting was performed to introduce compressive residual stress under the surface layer, but consequently the tensional residual stress zone appeared between the compression and the centre of the torsion bar cross section [3].
Perenda et al. [3,5] present the results of finite element method (FEM) analysis of cold surface rolling and presetting production processes. A newly developed nonlinear, combined isotropic-kinematic material model was used. On the basis of material properties (listed in Table 1), the material model was established and used in FEM numerical simulations to compare the results of numerical analysis with results obtained by measurement [3]. If the torsion bar presetting procedure was performed after surface rolling, it would eliminate the favourable compressive residual stresses in the longitudinal and circumferential (tangential) directions in the thin surface layer. The cold surface rolling process causes high compressive stresses at the surface of the torsion bar and makes the surface smoother to prevent crack initiation at the surface due to surface irregularities [6].
The residual coordinate stress components defined in [5], as shown in Figure 2, were used as the basis for the study.
The service stress components resulting from the dynamic testing of the torsion bar are added to residual stress components. The obtained stress tensor is transformed into the principal stress space, which is shown in the indicated failure criterion. The criterion for comparison shows both input modes of residual stresses for technology A and technology B [5]. From comparison of both diagrams in Figure 2a,b, it is obvious that a significant difference in residual stresses magnitudes and profiles occurred. The much more negative transversal residual stresses occurred at the surface of the torsional bar made via technology B. However, the shear residual stress τxy is positive on the surface and becomes negative below 2 mm under the surface for technology B, while in technology A, the shear residual stresses only became negative at a depth of 4 mm. Therefore, it is necessary to find out which technology provides a longer lifetime with respect to the different residual stress distribution.
There are several papers treating issues of biaxial loading with both torsion and axial forces on cylindrical specimens. A longer continued growth of crack and the crack-tip closure has been demonstrated for a mode III loading by Tschegg [7]. Makabe and Socie [8] tested 4340 steel under conditions simulating modes III and I loading. They figured out that the cracked branches do not continue symmetrically from the initial crack, due to the complex stress state. Yang and Kuang [9] studied the crack paths and their growth rates on S45 steel specimens under various combinations of torsion and constant axial force loads. They stated that the crack propagation angle is ~45° for various loading amplitudes; that the static tension axial force together with cyclic torsion causes the accelerated crack growth rate of a crack and lowers the service life; and that the compression axial force, together with torsion, considerably increases the service life and does not affect the crack propagation angle. It was also stated that the crack propagation direction depends on alternating stress amplitude and it does not depend on median stress. The authors Tanaka, Iwata and Akiniwa [10] tested hollow specimens made of lead-free solder, under torsion and a combination of torsion and compression loading in the axial direction. They concluded that initially the crack propagates in the direction of the maximum shear stress, and later in the direction perpendicular to the maximal principal stresses. Many micro-cracks are formed during the individual phases inside the material lattice, and they later form the single crack. Papuga and Halama [11] developed the Papuga criterion on the critical plane and results are compared with results of the Crossland and the Dang Van method. Zhang et al. [12] stated that the deterministic and the reliability judgments of the Drucker–Prager criterion are not conflicting; when the coefficient of the variations of the strength parameters is small, both the deterministic and the reliability judgments give the same judged result, but when the coefficients of the variation of the strength parameters are large, the results given by the two judgments greatly differ. Mrzyglod and Zielinski in [13] presented the modelling of multi-axial high-cycle fatigue phenomena by using the finite element method. The Dang Van fatigue criterion was chosen and implemented to investigate the structural optimization process. Peridas and Hills in [14] have reviewed the criteria for the fatigue crack initiation using the Dang Van Criterion. The effects of the degree of load reversal, overall load amplitude and stress concentration have been investigated. All three can be manipulated to provide calibration points for the fatigue line, or to cross-check existing data on an already calibrated fatigue line. The results provide a clear path for the extrapolation of experimentally determined crack initiation from one geometry to another. Bernasconi et al. [15] investigated the multi-axial fatigue behaviour of the 39NiCrMo3 steel by means of combined tension–compression and alternating torsion tests. Results were compared with predictions of different criteria. Authors in [16,17,18] discussed the mean stress effect.

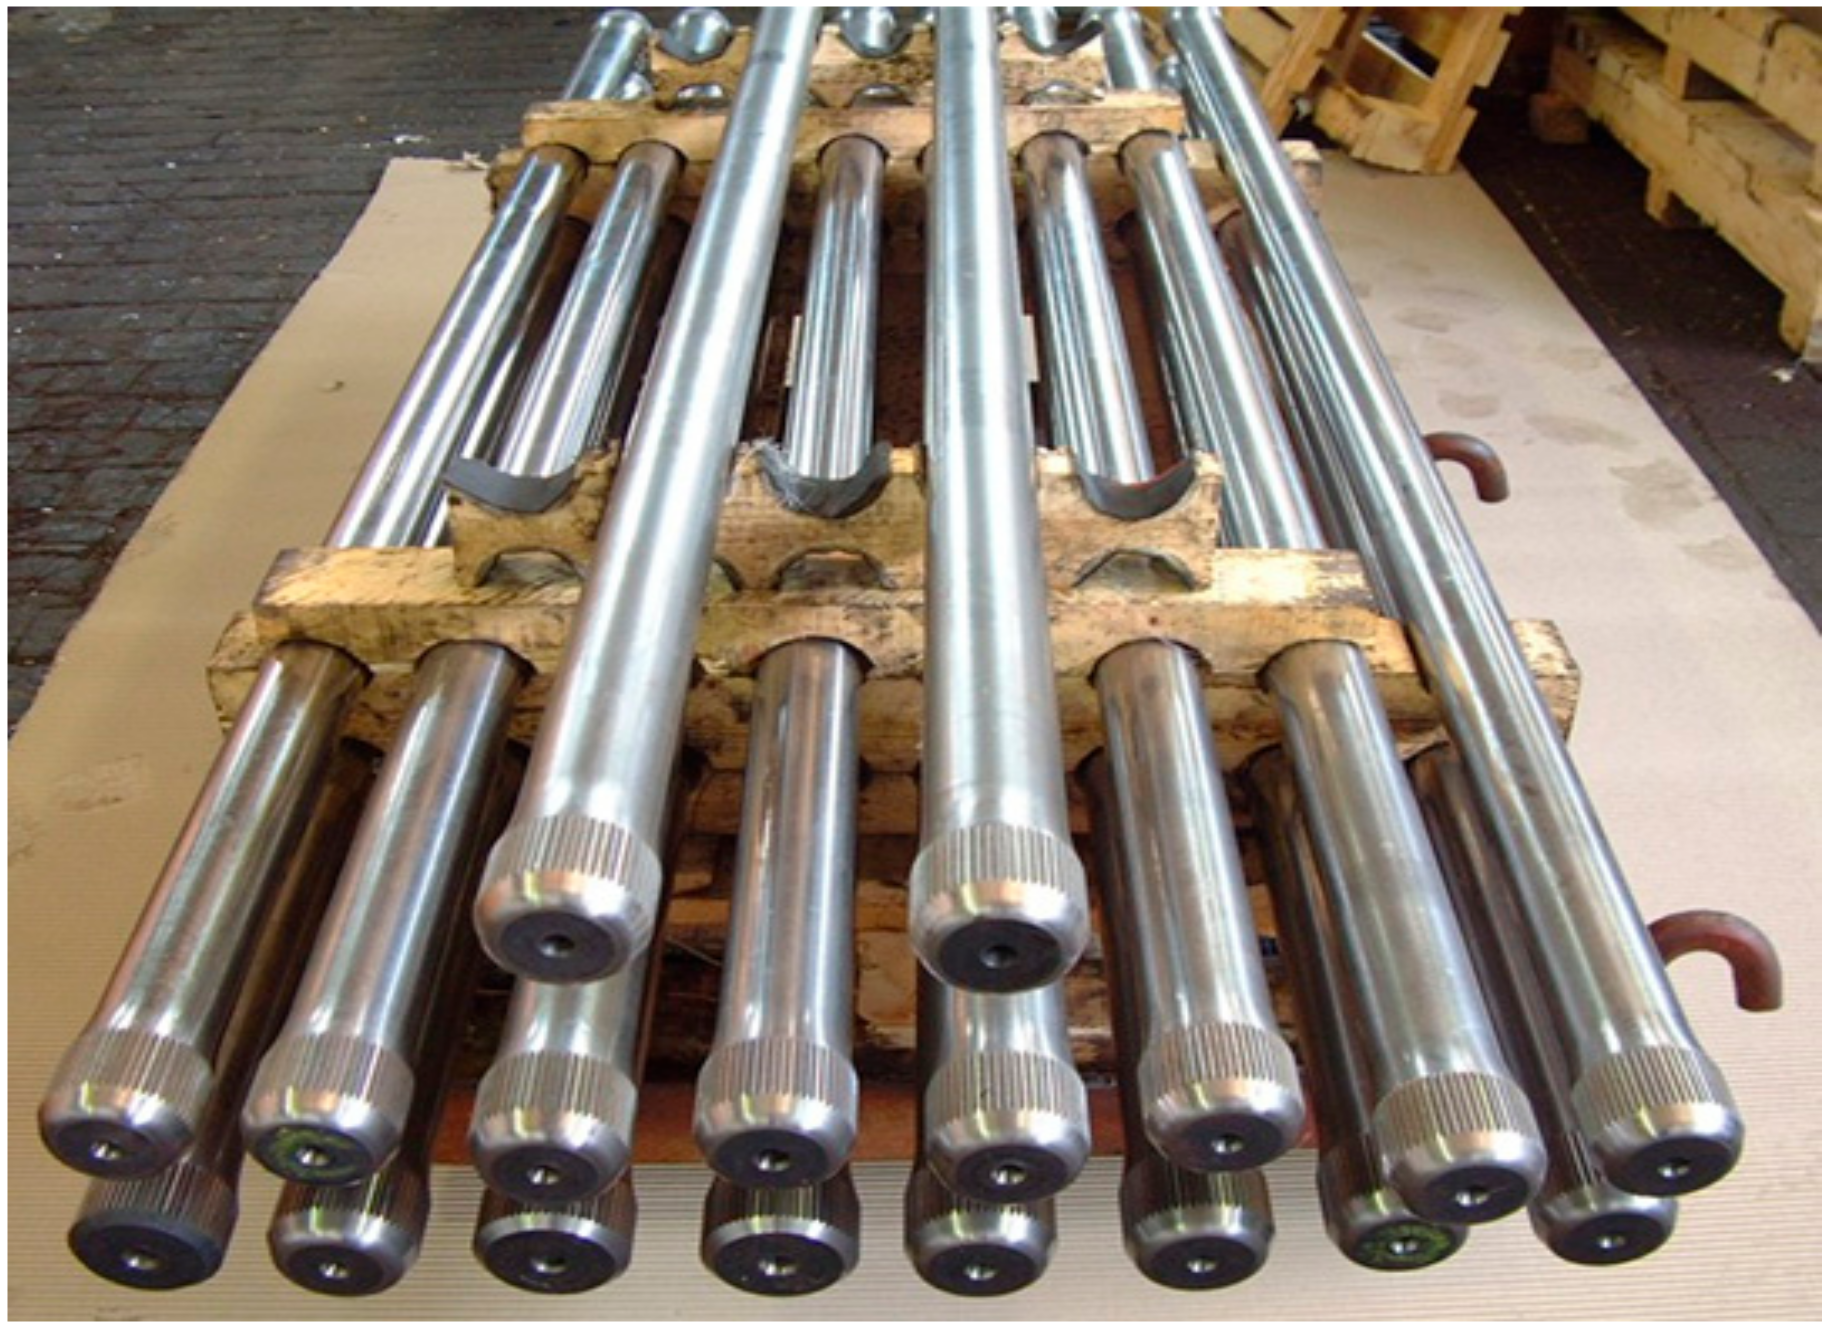
2. Descriptions of the Material and Manufacturing Technology

Torsion bars are made from high-strength fine-grain spring steel grade 150VCN (50CrV4 and by W.Nr. 1.8159 according to EN 10027-1). The mechanical characteristics and chemical composition as wt.% is listed in Table 1 and Table 2, respectively [4]. The used material was hot rolled, forged and soft annealed during the manufacturing process. The final shape and properties were achieved with the following mechanical processes; programmed turning, milling and polishing. The torsion bar had a diameter of 61.6 mm and length of 1750 mm. The spring’s surface was polished to a surface roughness of Ra = 0.2 μm. Torsion bars were hardened via the typical technology procedure to the required hardness level of 54 ± 1 HRC. Surface rolling and presetting were performed as described in [3]. These were torsion specimens with a diameter of 10 mm and a length of 250 mm. They were produced with the same technological process as torsion springs.
The dependence of fatigue limits vs. mean shear stress is possible to plot in the Smith diagram, as shown in Figure 3. It shows the Smith diagram based on the torsion test for the considered steel, showing all the actual fatigue ratios from R = 0 up to R = 0.33. It is possible to see that a positive effective loading ratio R gives a fatigue limit τf much lower than 800 MPa, e.g., for R = 0 the maximum amplitude is Δτ = 743 MPa [19].

3. Multi-Axial Fatigue Criterion

Experimental investigations in recent decades resulted in numerous hypotheses of multi-axial fatigue. In literature, many proposals of such criteria can be found [6,20,21]. From the point of view of applications to numerical optimisations, the most convenient are two groups, the first based on stress state invariants such as the Coulomb-Mohr, Drucker-Prager, Sines and Crossland criteria, and the second using average stresses or deformations in an elementary volume, such as the Dang Van criteria [22]. The invariant formulae usually consist of quantities related to hydrostatic and octahedral stresses. The use of these hypotheses allows one to determine the initiation point of the fatigue crack.
According to the hypothesis by D. C. Drucker (1918–2001) and W. Prager (1903–1980), hereafter D-P, a material fails when the condition
F ( I 1 , J 2 ) = α I 1 + J 2 k = 0
is fulfilled. Here, α and k are material parameters, and I1 and J2 are invariants of the amplitude stress tensor and of its deviator, respectively.
σ i j H = σ H δ i j = 1 3 σ k k δ i j
σ H = 1 3 σ 1 + σ 2 + σ 3 = 1 3 I 1
J 2 = 1 6 σ 1 σ 2 2 + σ 2 σ 3 2 + σ 3 σ 1 2
Accordingly, failure occurs when the octahedral amplitude shear stress τoct reaches a critical value which is linearly dependent on the hydrostatic (mean) stress in amplitude σH:
τ o c t = 6 α σ H + 2 3 k
The associated failure curve for the plane stress is an ellipse. The Drucker-Prager criterion can be used as a yield or as a fracture condition. For α = 0 it reduces to the von Mises yield condition [23]. The stress vector in an arbitrary plane considers residual stresses σx, σy and τxy, shown in Figure 3 for specific points from the surface and at 1, 2 and 3 mm under the surface of the torsion bar. The transformation of the coordinate stress tensor into the principal stress space takes place according to the following terms.
a)
Stress vector at an arbitrary plane:
p i = σ i j n j
at condition p i σ n i and τ = 0 .
b)
The direction cosines ni are determined by a system of homogeneous linear equations:
σ i j δ i j σ n j = 0   and   n i n i = 1
where σ are the eigenvalues, or principal stresses, determined by the condition
det σ i j δ i j σ = 0 σ 1 , σ 2 , σ 3
and the maximum shear stress:
τ max = σ 1 σ 2 2
The appropriateness of using this criterion can be justified by the following.
a)
The D-P criterion can be used as a yield and as a fracture condition.
b)
The D-P criterion is used in cases where we are dealing with high compressive stresses, which our case is.
c)
When we compared the results of several fatigue criteria [24,25,26], the highest safety factor is shown by the Drucker-Prager criterion.
d)
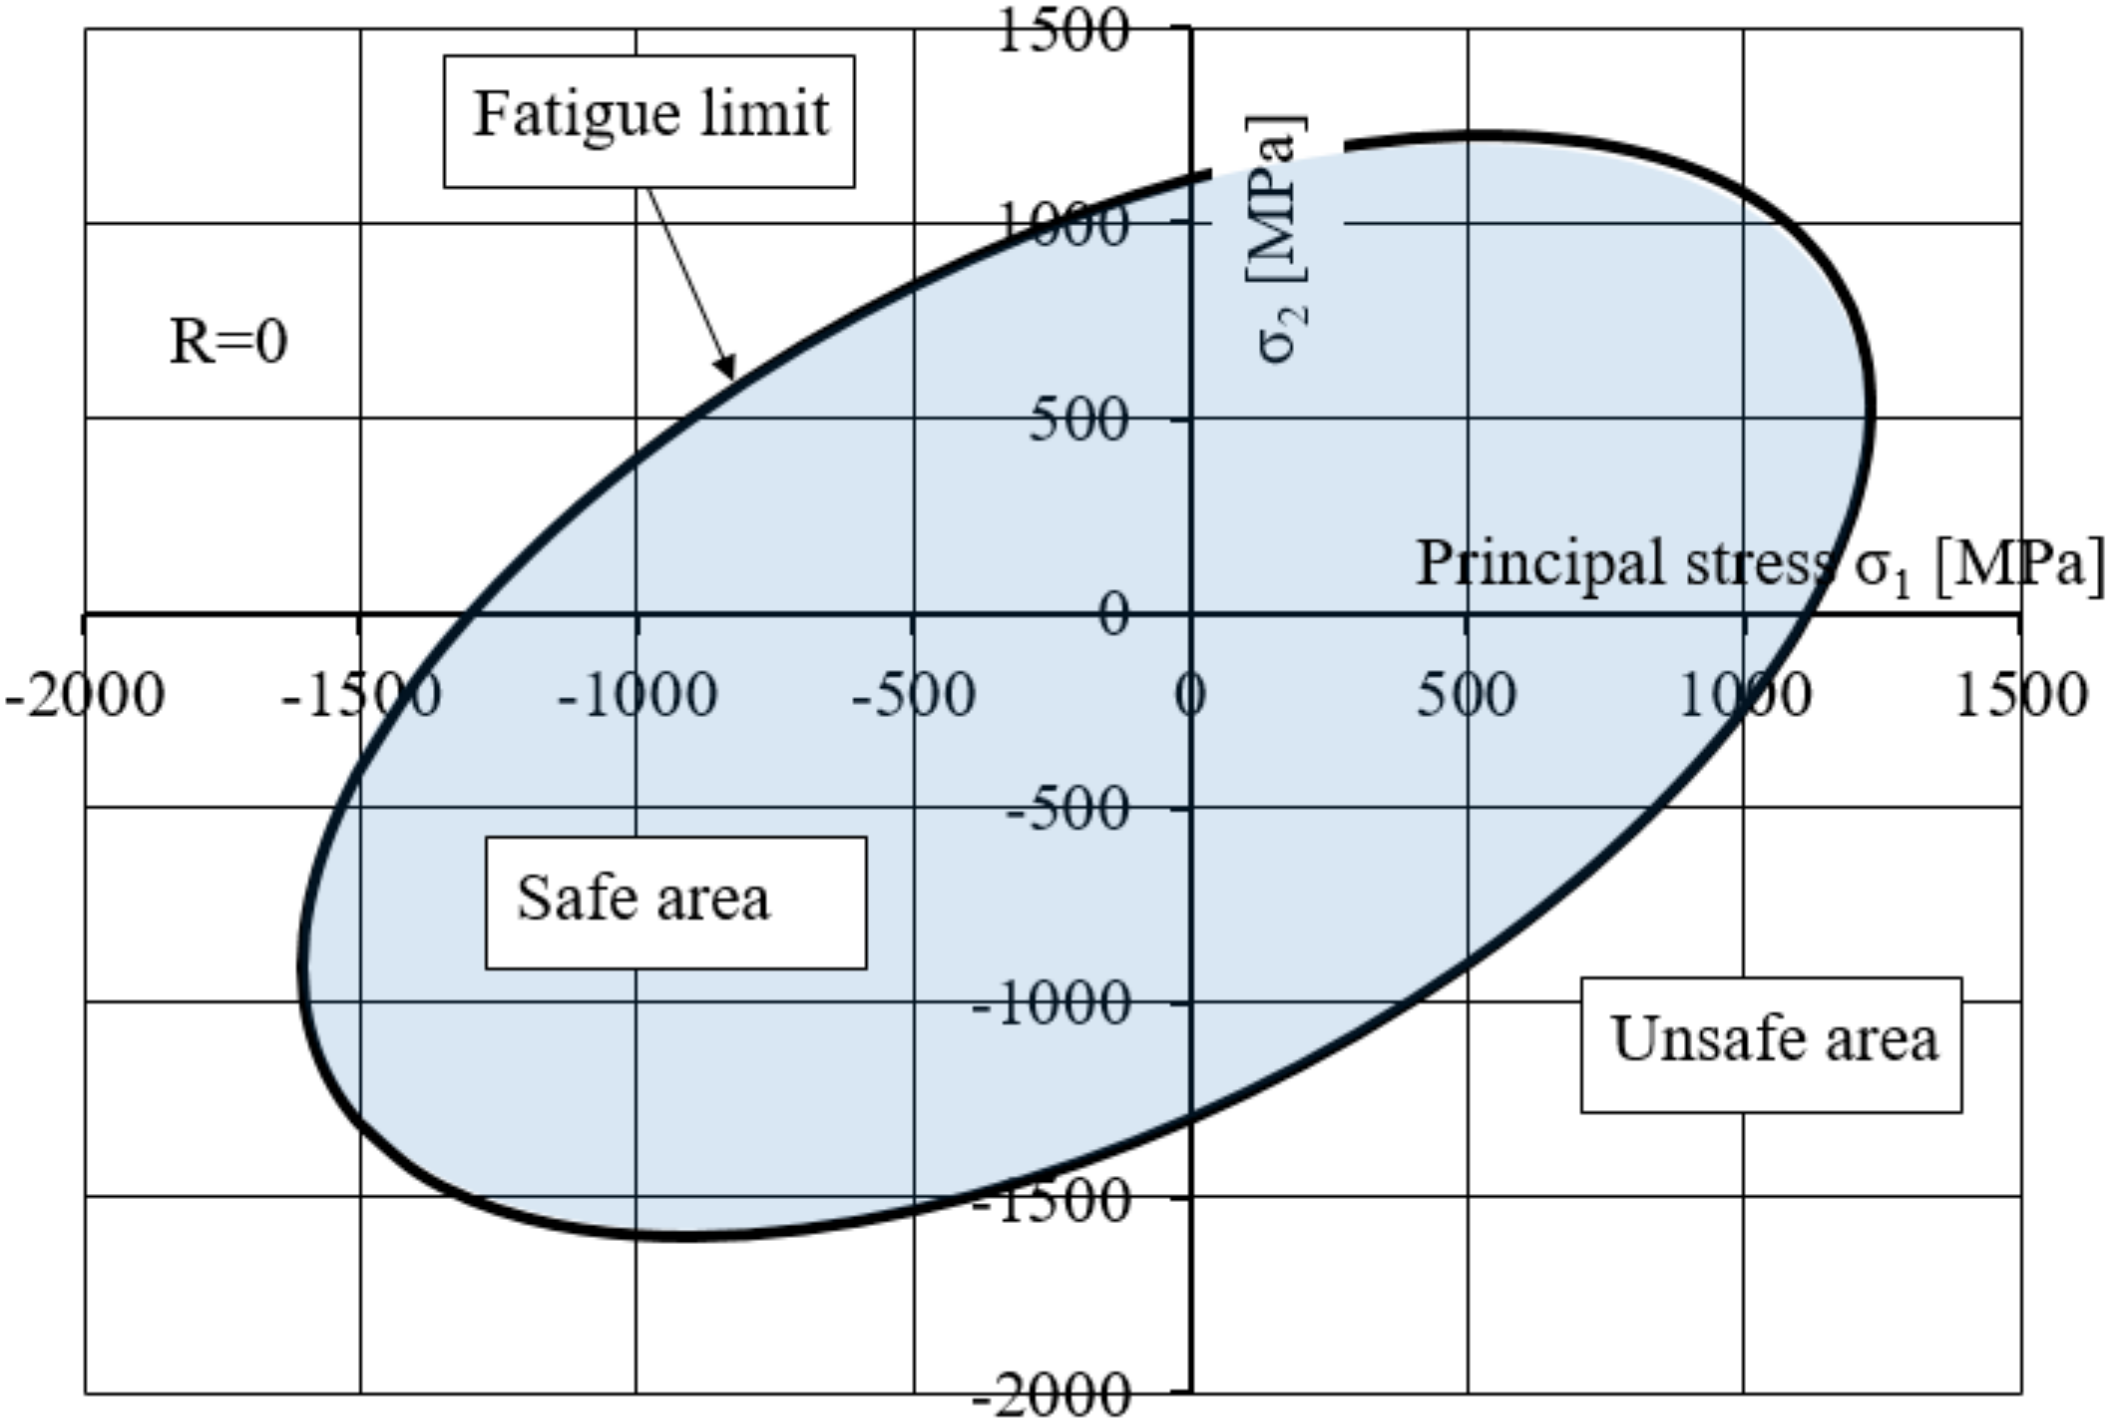
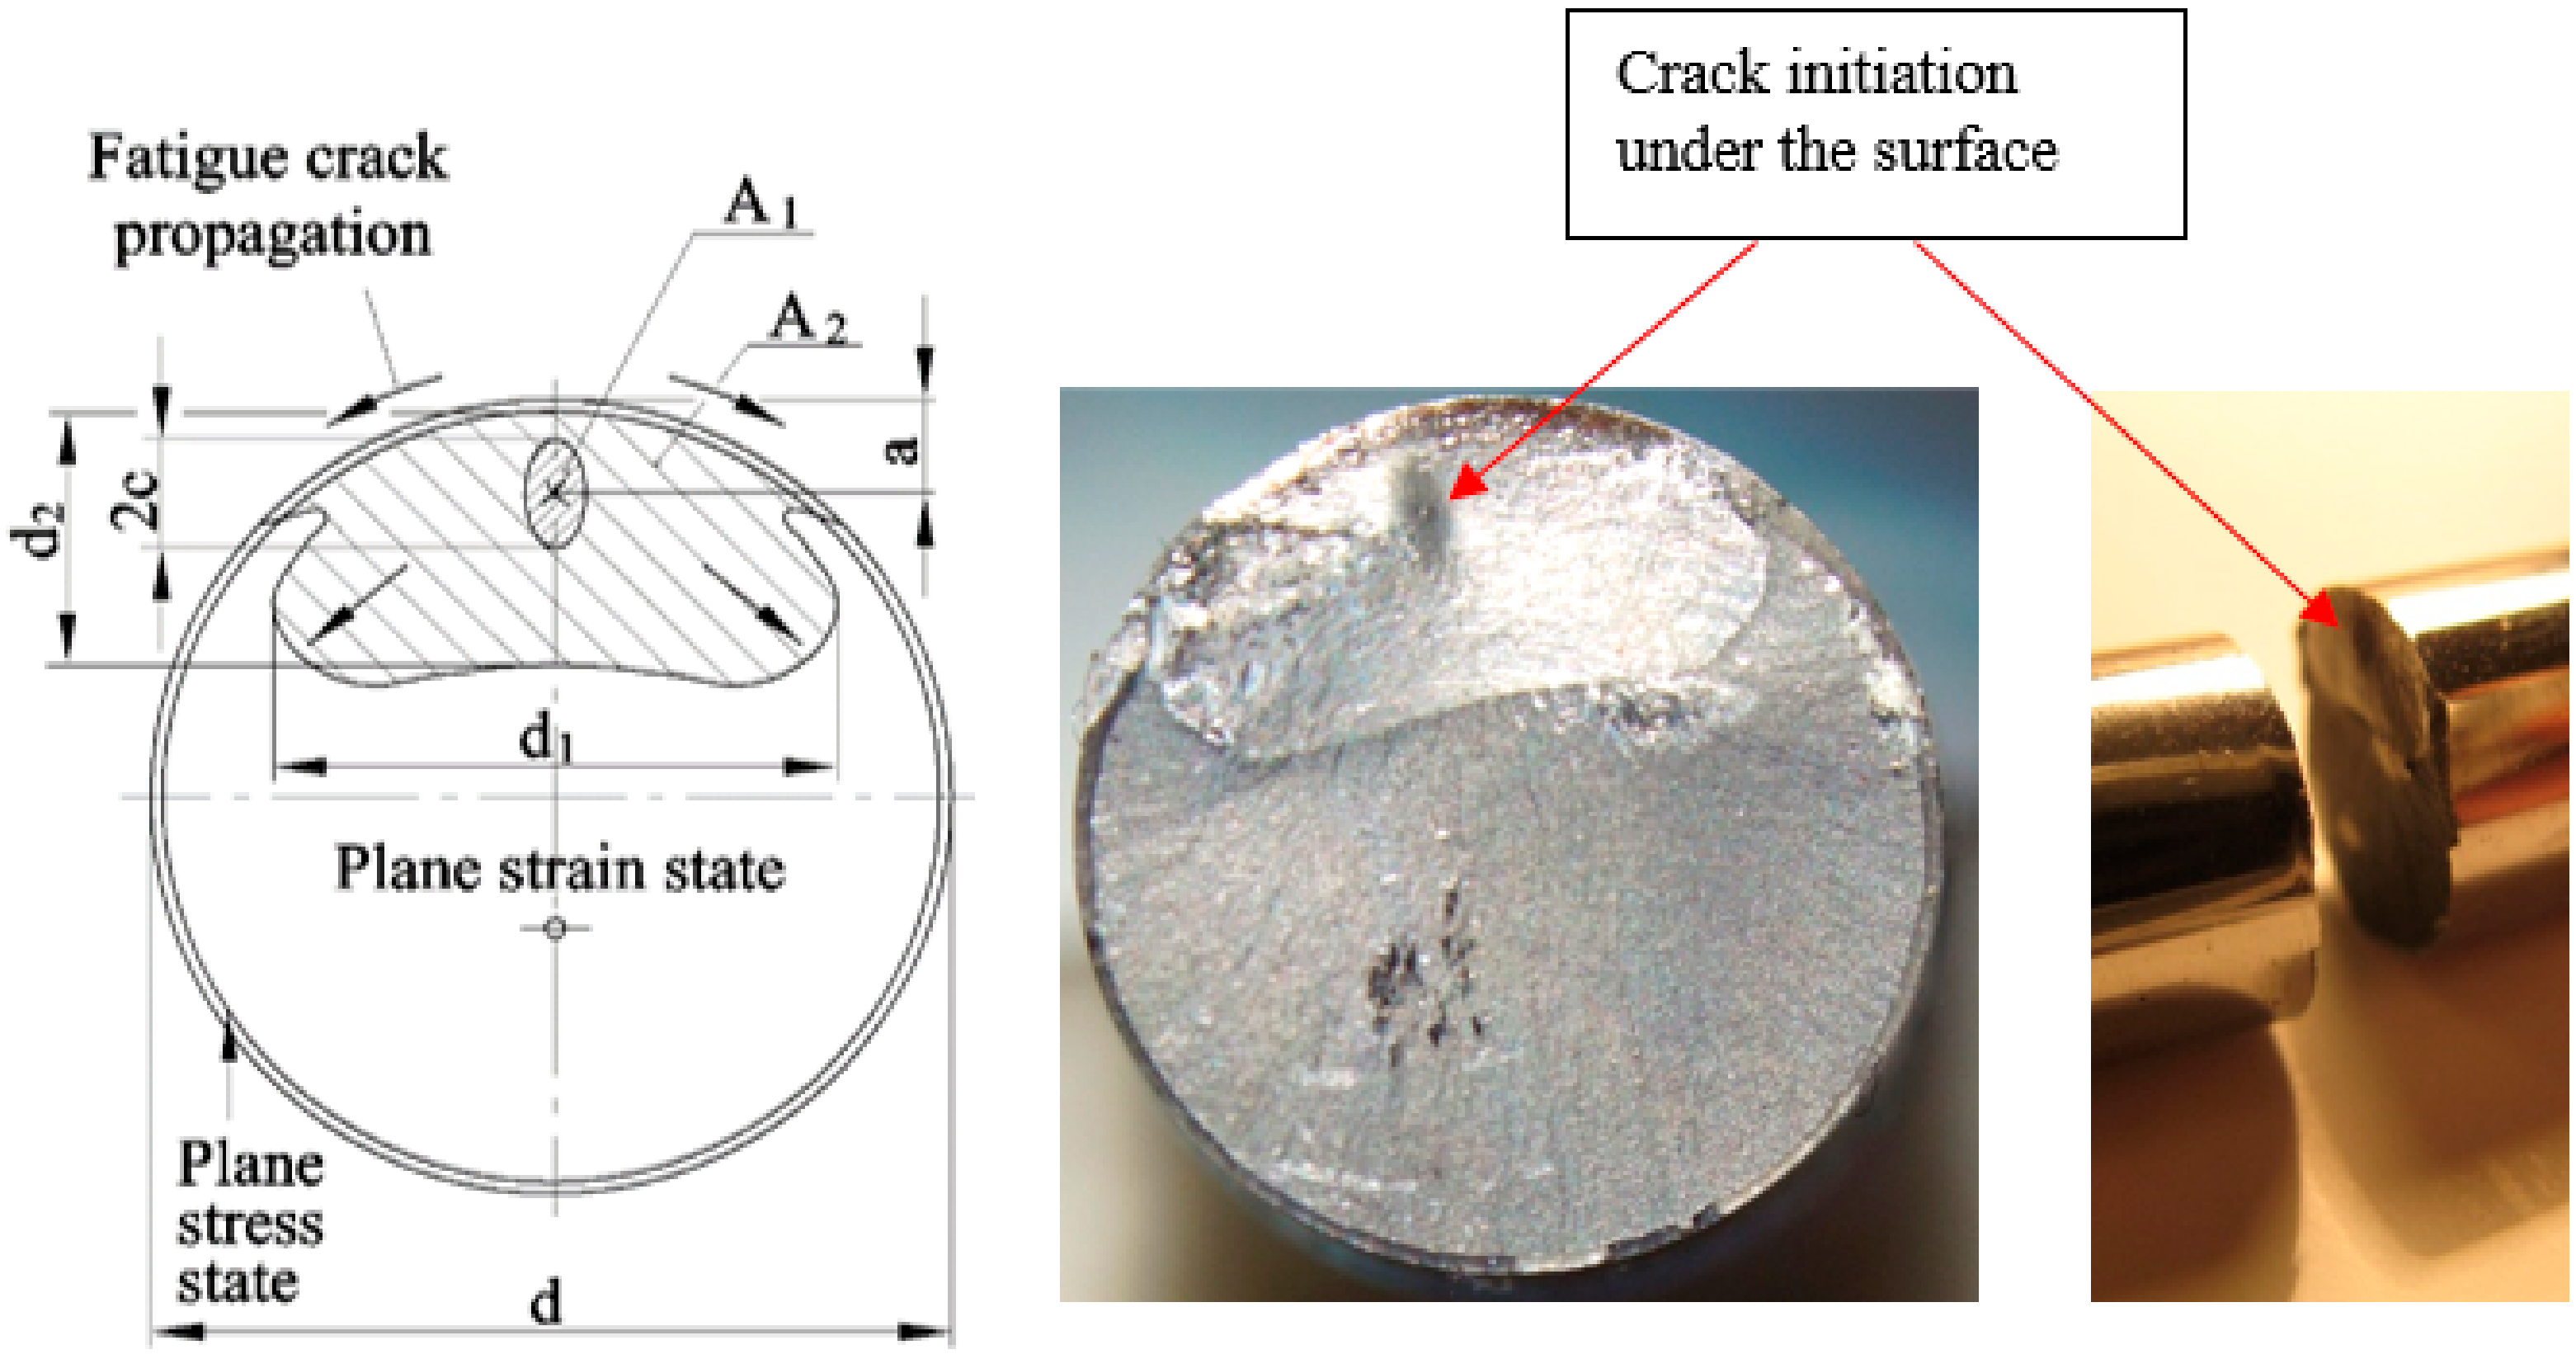
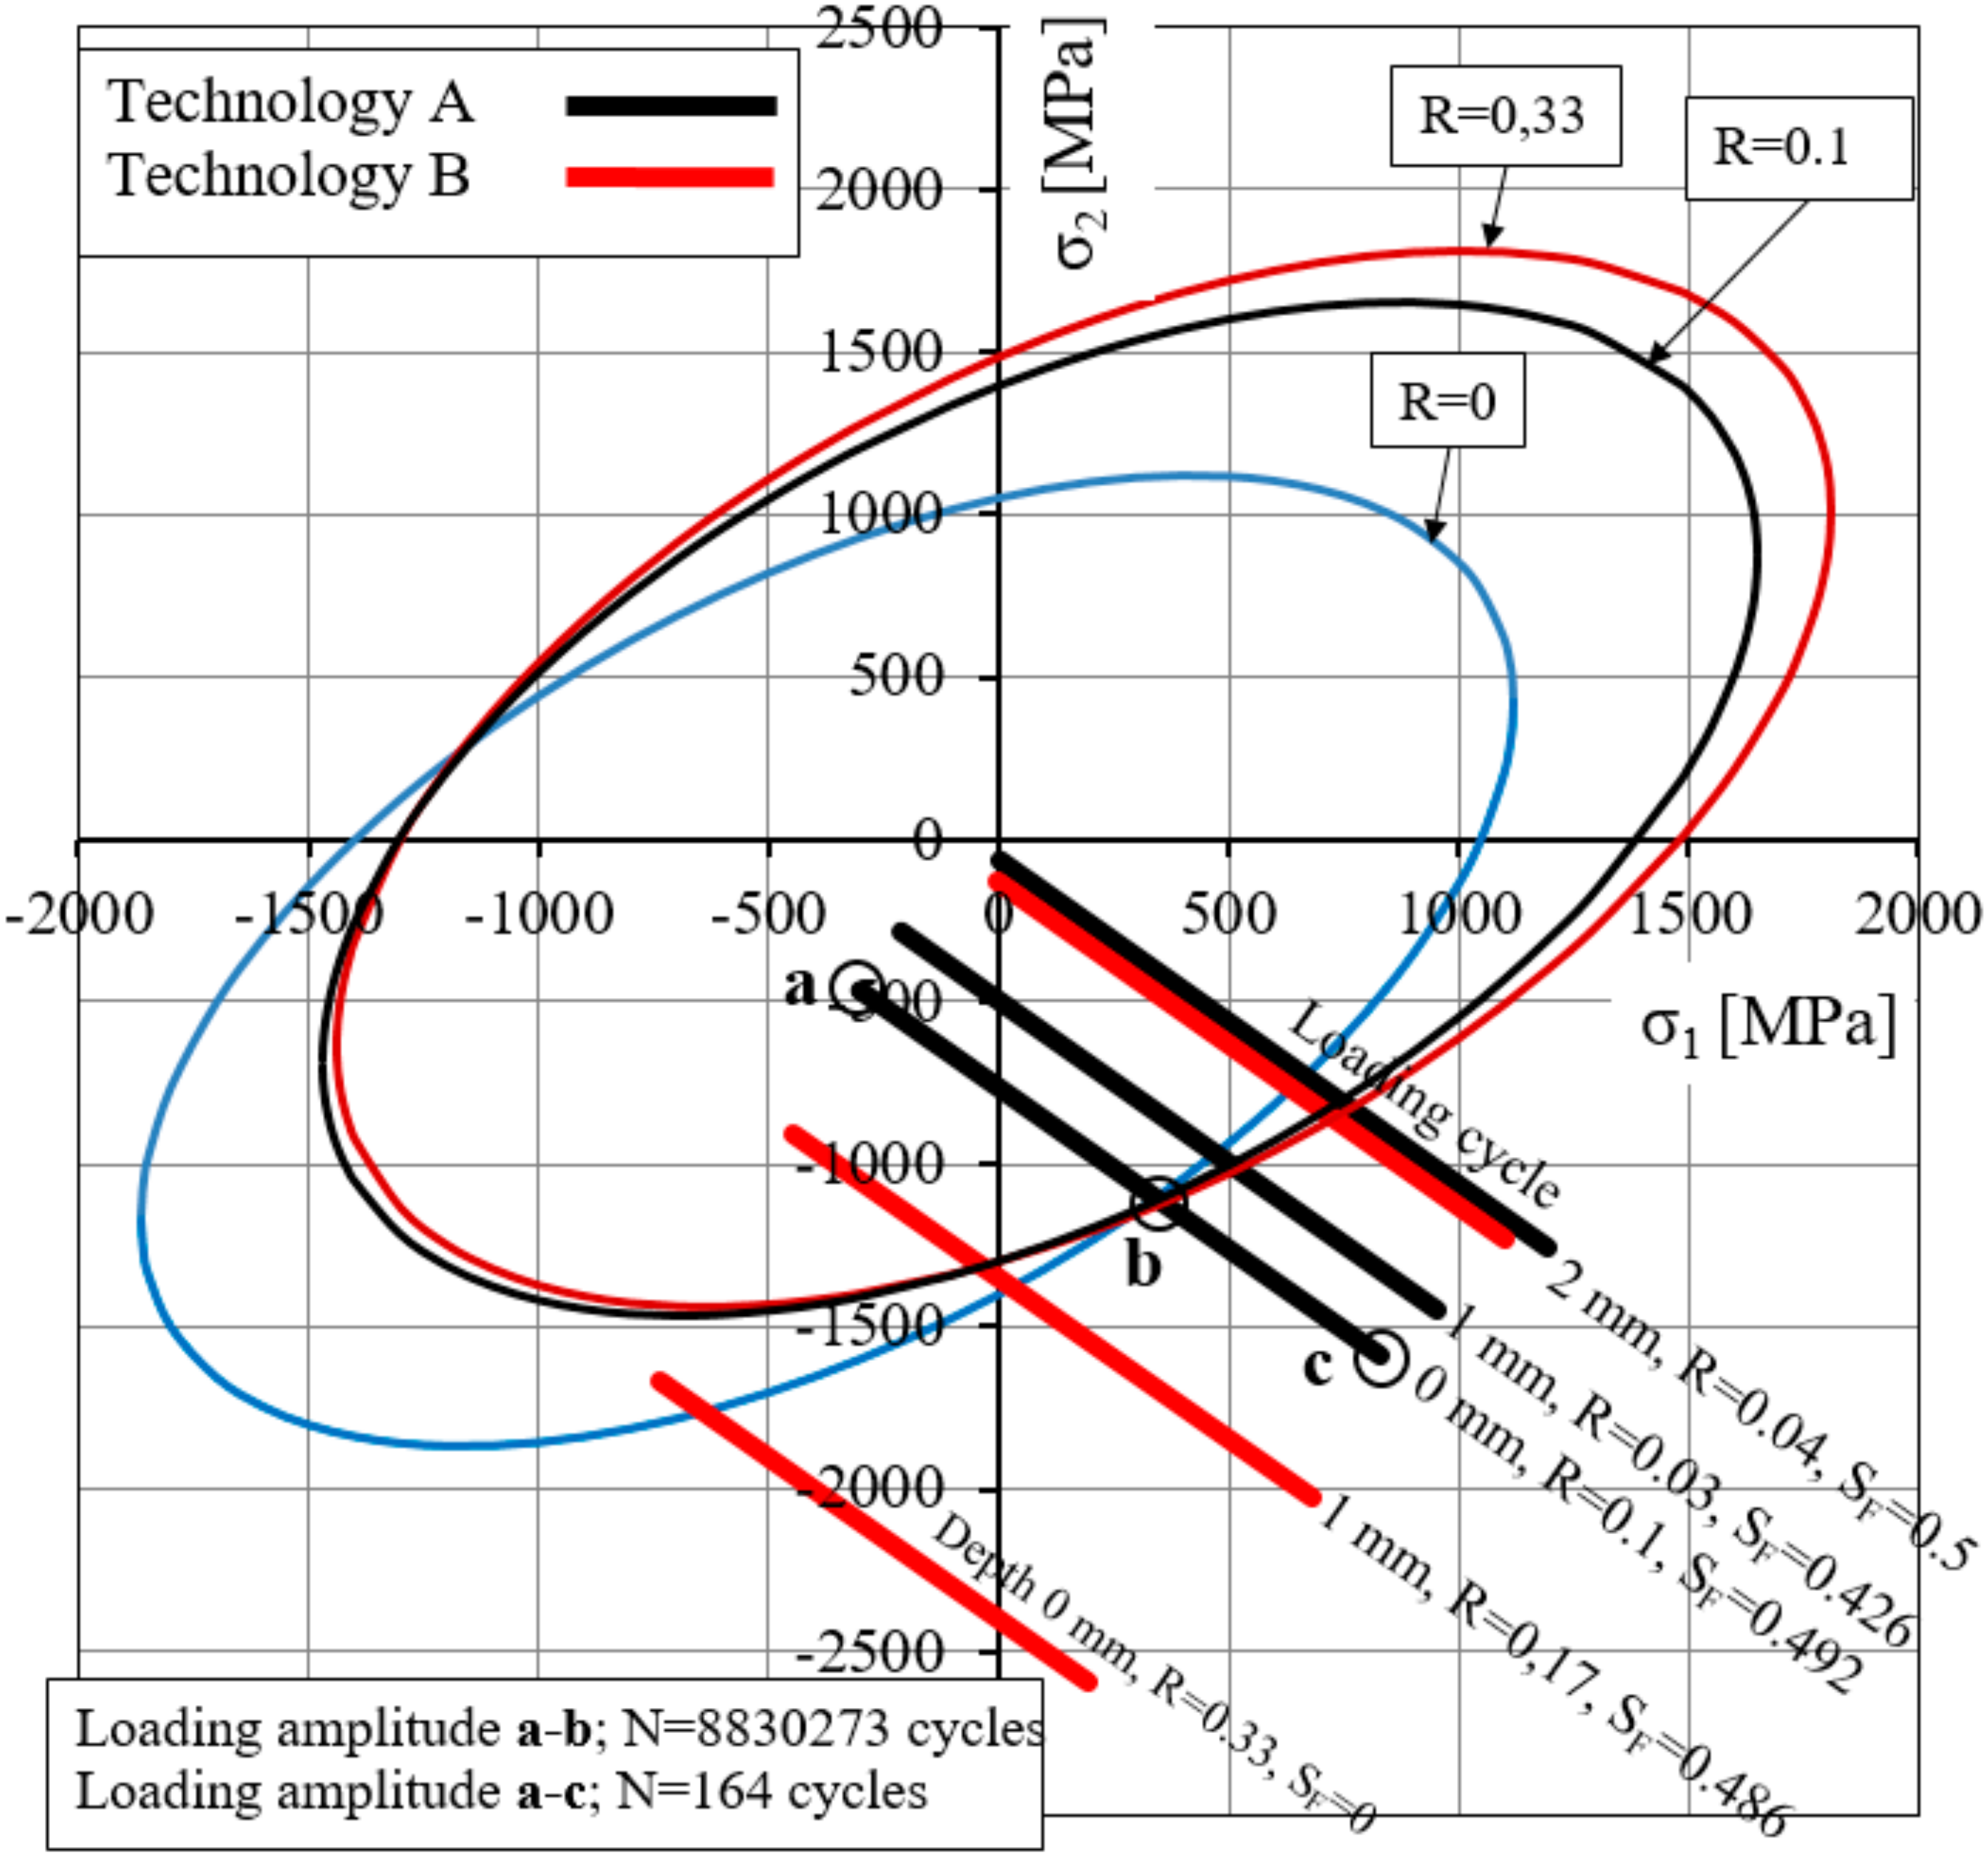
It has been found experimentally that in the case of the use of technology A, the initiation occurs below the surface of the torsion specimen. Using the D-P criterion, it is possible to show in the space σ1–σ2 that the safety factor is higher on the surface than below the surface, which corresponds to the experiment.
e)
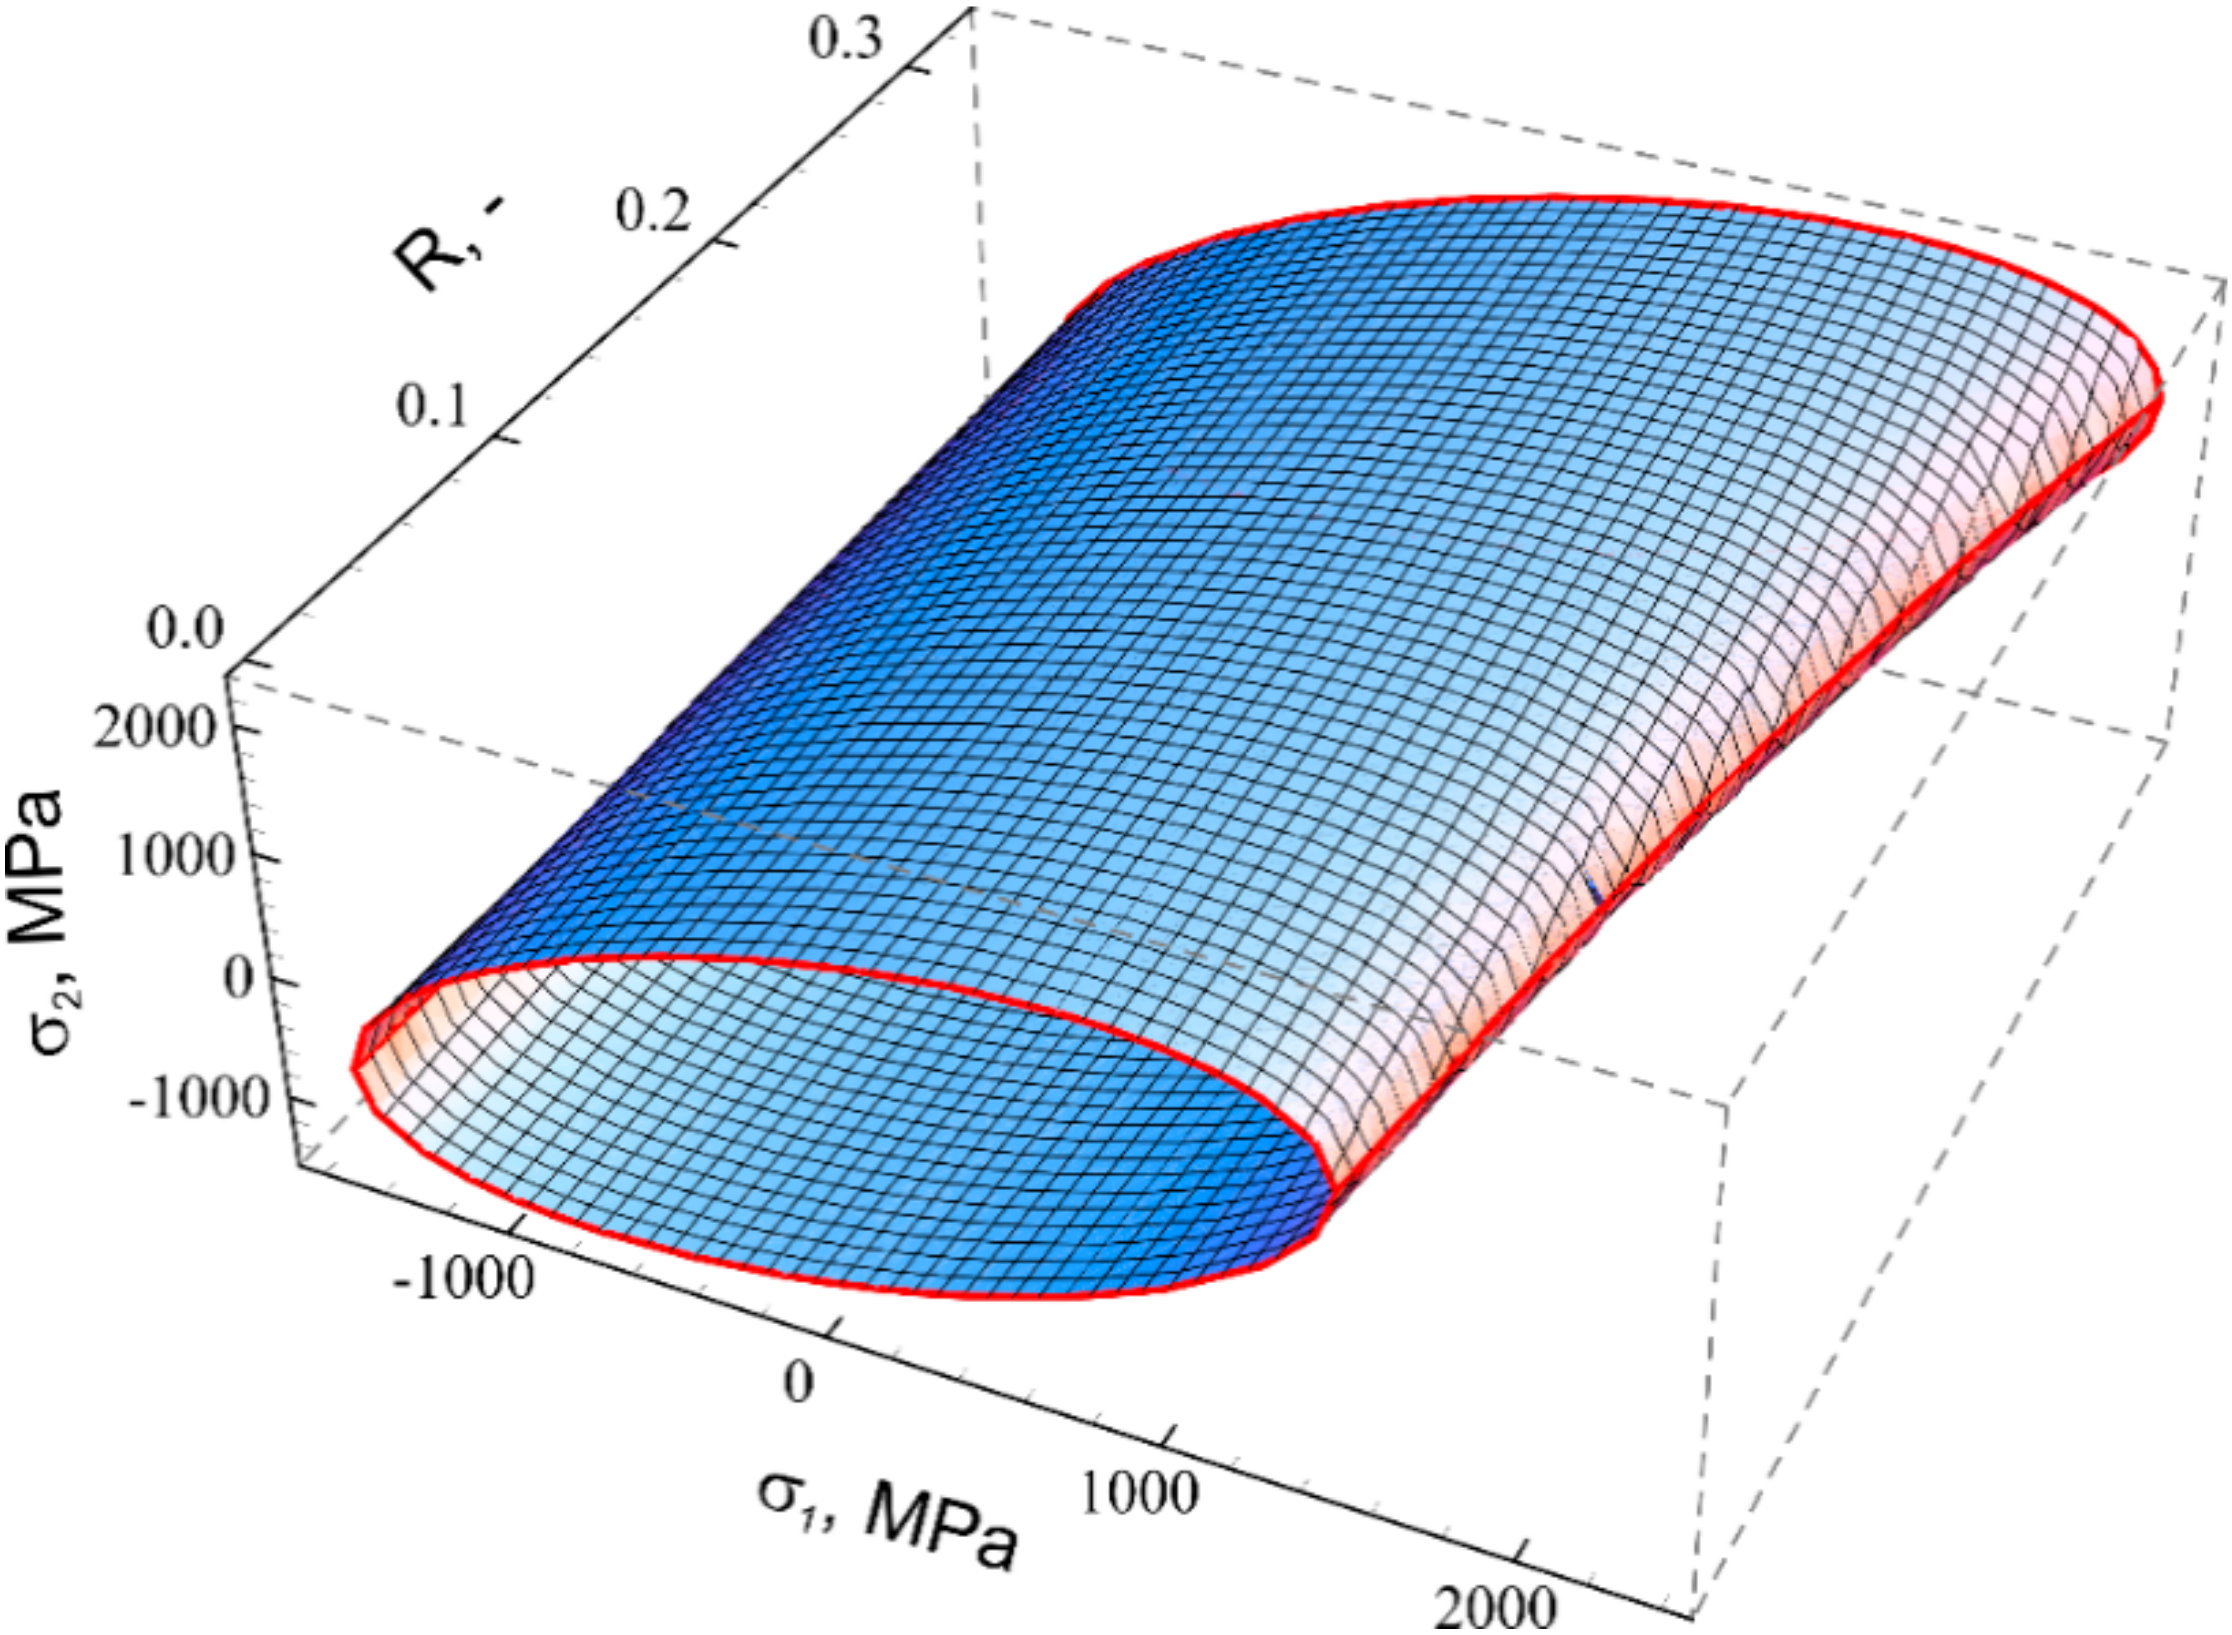
The service life of a torsion bar as a function of the Presetting strain and maximum shear stress on the surface during testing can be determined by a procedure defined by tests [4]. The calculated service life at the fatigue limit determined by the D-P criterion is 8,830,273 cycles, which belongs to the Very High Cyclic Fatigue (VHCF) and at the maximum load cycle 164 cycles. The service life decreases exponentially with the distance from the fatigue limit, as shown in Figure 4.
f)
Unlike the Coulomb-Mohr model, the Drucker-Prager failure surface is smooth and plots as a cylindrical cone in the principal stress space, according to Equation (1). In the plane, this is an ellipse, which prevents the singularity in the corners in the case of the C-M criterion, [12].
g)
Using the D-P criterion, it is possible to determine the safety factors on and below the surface of the torsion bar, and thus assess the suitability of the use of the technologies A and B.
Inside the fatigue limit zone there is the so-called safe area, and outside is the fatigue failure area, as shown in Figure 4. While the stress amplitude of the mechanical component remains inside the elliptical zone (the safe area), the fatigue limit will not be exceeded. However, if the fatigue cycle extends beyond the safe area, the mechanical component will have a limited lifetime. The curve represents the fatigue limit.
Figure 4. Safe area according to the D-P criterion for the ratio R = 0 (see Figure 5).
Metals 10 01056 g004
Figure 5. The safe area is inside the ellipsoid surface, σ1 and σ2 are shown as a function of the fatigue ratio, R; 0 ≤ R ≤ 0.3.
Metals 10 01056 g005

4. Lifetime Prediction

The model for service lifetime prediction is described and presented in paper [4]. The torsion bar lifetime prediction model considers the case where the fatigue crack was initiated under the surface. It is assumed that the plane stress condition dominates ( σ 3 = 0). For estimating the lifetime, Equation (10) is developed, which considers the presetting strain γ p s and the maximum fatigue stress for the loading ratio R = 0.1 at the surface of the torsion bar. The lifetime in the form of the number of cycles to failure is calculated by the following formula.
log N = log A 0 ( γ p s ) log τ c a l m ( γ p s )
where
  • N [cycles]  number of Cycles of the torsion bar,
  • A0 [-]  empirical constant,
  • m [-]  empirical constant,
  • τcal [MPa]  maximum calculated tangential stress on the surface of the torsion bar and
  • γps [rad]  maximum tangential strain at presetting on the surface of the torsion bar.
The constants A0 and m are expressed in the following terms with experimentally obtained empirical constants [4].
A 0 = 69686 e 82.019 γ p s   and
m = 5.5971 γ p s 0.2857 .

5. Results and Discussion

Figure 6a,b shows the effective shear stress as a function of the test loading angle up to a depth of 4 mm. The effective shear stress is the sum of the applied stress that occurs due to the load when using or testing the torsion bar and the residual stress, see Figure 2. The ratio between the effective minimum and the effective maximum shear stress during the loading cycle is the effective fatigue ratio R = τminmax, while the fatigue ratio at the applied torque is always Rapplied = 0, because the load at the preset torsion bars is always unidirectional from zero to maximum load. One can see from Figure 6a,b that the effective R ratio varies with depth. Therefore, the Drucker-Prager criteria describe a different elliptical boundary of the acceptable loading range, which determines the safe areas.
Figure 6a shows the change of the maximum effective shear stress vs. the twist angle for technology A, from 0 to 70 degrees for points at the surface (0 mm), and at depths of 1, 2, 3 and 4 mm, respectively. It is possible to recognise that each measured depth has a different effective loading ratio R and a different maximum loading amplitude Δτmax. The minimum effective loading ratio R is from 0.03 to 0.05 under the surface, but 0.16 to 0.33 on the surface itself. However, the maximum loading amplitude Δτxy occurred at 1 and 2 mm under the surface of the torsion bar.
Figure 6b shows the response of the effective shear stress for technology B vs. the twist angle from 0 to 70 degrees. We recognise behaviour similar to the case of technology A (Figure 6a). The maximum shear stress amplitude Δτmax also appeared under the surface, at the 2 mm deep point. The maximum shear stress amplitude Δτmax is slightly lower than for technology A at the same 2 mm depth point. The effective loading ratio R in technology B varies from R = 0.33 at the surface and from 0.05 to 0.1 inside the material. Therefore, it seems that the effective loading ratio R = 0.03 for the maximum shear stress amplitude is the same for both technologies.
It is obvious that the minimum effective shear stress occurred at different twist angle loads for different positions along the depth of the material. Therefore, each point in depth has its own effective loading ratio R = τminmax. The highest effective shear stress amplitude Δτmax appears under the surface where fatigue crack initiation can occur as shown in Figure 2. Figure 6a,b also shows that the starting twist angle from zero to ~7 degrees does not affect the maximum effective loading amplitude Δτmax, because the lowest stress τmin point appeared after some amount of twist angle was already applied (~9 degrees for technology A and 7 degrees for technology B). The plane stress state is present on the surface of the torsion bar spring, but for crack initiation the plane deformation state in the interior is relevant, as shown in Figure 2. In our case, points up to a depth of 3 mm are considered and a plane stress state is assumed for all these points. Inside the ellipse in Figure 4 is the fatigue limit zone and inside of that there is the so-called safe area, and outside is the fatigue failure area. While the stress amplitude of the mechanical component remains inside the elliptical zone (the safe area), the fatigue limit will not be exceeded. However, if the fatigue cycle extends beyond the safe area, the mechanical component will have a limited lifetime. The boundary line represents the fatigue limit.
However, due to compressive residual stress at the surface and under the surface, the fatigue amplitude is higher under the surface, as shown in Table 3. Table 3 gives the effective fatigue ratios, R, and maximum shear stress amplitude, depending on the manufacturing technology A and B and the main stress component, on the surface of the torsion bar and at depths of 0, 1 and 2 mm. The highest amplitude is Δτ = 1186 MPa at 2 mm in depth achieved by technology A.
In the case of using technology A, the fatigue crack starts inside the surface and propagates left and right under the surface up to a critical crack size where the bar suddenly fractures in the transverse direction, as shown in Figure 7 [4]. A plane stress state is present at the surface, while a plane strain state occurs inside the material, which causes a sudden failure of the torsion bar when the crack in the material reaches a critical size.
The numerical model has been generated by using Simula Abaqus software 2018 (Ver. 6.13, Simulia Dassault Systèmes SE, Vélizy-Villacoublay, France) 359270 continuum 3D, and 8-node finite elements were used. Figure 8 shows the numerical model and residual stress distribution τyz through the cylindrical specimen after torsional unloading at a maximum surface presetting shear strain of γps = 0.043, according to technology A. Two types of nonlinearities in the FEM analysis were taken into account. Material nonlinearity, which is covered by considering the true yield curve, and geometric nonlinearity, which takes into account the fact that the equilibrium within each load increment is achieved on the basis of the deformed geometry of the FEM structure. This equilibrium takes into account both nonlinearities by using the incremental iterative process and isotropic hardening.
Figure 9 shows the distribution of the residual shear stress across the cross section of a torsion specimen with a diameter of 10 mm after presetting according to technology A. Negative shear stress in the outer layers of the test specimen slows down the initiation and propagation of fatigue crack. In addition to the classical calculation of shear stresses, the values of the residual shear stress obtained by FEM analysis and the result of experimental measurements on the surface are also shown for comparison. All three values match fairly well.
Figure 10 shows the position of the loading cycles of the principal stresses σ1 and σ2 on the surface of the torsion bar, and 1 and 2 mm under the surface, with respect to the safe area according to the Drucker–Prager criterion, for fatigue ratios R = 0, 0.1 and 0.33. Figure 10 shows the Drucker–Prager criterion in the space of the principal coordinates, under the condition of the plane stress state, σ3 = 0, for the fatigue ratio of R = 0, obtained according to Equations (1)–(5). Data for both torsion bar technologies are shown. For the torsion bar made using technology A, the number of cycles to failure is calculated using Equation (10). For the loading cycle of a–c, the safety factor is SF = 0.492, and we obtain just 164 cycles to failure. If the load cycle was reduced to the maximum stress that coincides with the fatigue limit, i.e., a–b, the safety factor becomes SF = 1, and the lifetime would increase to 8.830.273 cycles, which falls within the high cyclic fatigue area.
The red and the black straight lines in Figure 10 represent a load cycle that takes into account the residual stresses and simultaneously the stresses due to the torsional load. The black line shows diagrams of the principal stresses when the torsion bar was made in accordance with technology A and the red one when the torsion bar was made in accordance with technology B. The principal stresses at the surface of the torsion bar and at depths of 0, 1 and 2 mm are indicated. If the entire stress cycle remains within the safe area, no crack initiation occurs.
Conversely, if the load cycle extends beyond the safe zone and undergoes the fatigue limit, fatigue crack initiation occurs. The closer the fatigue limit is, when the load cycle stops, the higher the lifetime of the torsion bar, and the longer the load cycle goes beyond the safe area, the less load cycles will occur until fracture.
Table 4 shows the safety factors depending on manufacturing technology, depth at the torsion bar, and the Drucker-Prager coefficients α and K. The safety factor is defined as the ratio between the fatigue limit and the maximum stress inside the loading cycle, i.e., SF = σfmax.
At the surface of the torsion bar there are very large compressive residual stresses, which are caused by the proper manufacturing technology. Compressive residual stresses are much higher when the torsion bar was produced using technology B. In the case of technology A, the residual stress in the longitudinal direction is approximately −450 MPa, while in the case of technology B, this is approximately −1700 MPa, as shown in Figure 2. The stress gradient is higher in the case of technology B, because at a depth of 2 to 3 mm all three components fall to zero. In the case of the technology A, the compressive stress drops is more favourable, because the compressive stress components on the surface are much smaller, while the shear residual stresses are the same. At first glance, technology B is better compared to technology A in terms of the fatigue life of the torsion bar. It is a well-known principle that compression does not contribute to the initiation and propagation of cracks, while tension directly initiates cracks and accelerates crack growth. Therefore, the hypothesis that the more compression we have at the surface, the greater the fatigue safety achieved is not quite correct, because both technologies A and B should ensure that the fatigue crack will start under the surface and the principal stresses in technology B, which take in account highest compressive residual stresses show a more critical behaviour and lower number of cycles to failure than technology A.
If we analyse in detail the stress state during the loading of the torsion bar in use as shown in Figure 10, it is obvious that some components cross the fatigue limit line. The residual stresses, as well as the stresses due to the torsional load when using the torsion bar, have been taken into account. The stress state in the torsion bar was transformed into the space of principal stresses by using Equations (6)–(8). Using the Drucker-Prager failure criterion, Equations (1)–(5), a fatigue limit was established between the safe and unsafe areas, Figure 4 and Figure 5. It was found that each of the stress components at the surface and inside the torsion bar corresponds to its fatigue ratio R, different from the shear range, as shown in Table 3. Therefore, the loading amplitude becomes larger in the case of compressive residual stresses than the provided fatigue limits in the existing Smith diagram, shown in Figure 3.
The individual principal stresses pass through the load cycle into the unsafe zone (Figure 10), which occurs in the tension and compression directions. The longer the stress exceeds the fatigue limit, the shorter the lifetime, and vice versa. In the tensile direction, the stress causes a direct crack initiation, while deep in the compression direction, the material additionally plasticises and destabilises the torsion bar, increases creep and indirectly leads to crack initiation and failure. Figure 10 shows the safety factors for both technologies up to 2 mm depth. In the case of technology A, there is a larger safety factor on the surface, SF = 0.492, than at a depth of 1 mm, where SF = 0.426. This fact causes the crack initiation to occur 1–2 mm below the surface, as shown by Figure 7 in [3] and Table 5. In the case of technology B, the entire load cycle on the surface falls out of the safe range, which means a safety factor SF = 0, and the total compressive stress reached a value of ~2600 MPa. This causes considerable additional plasticisation of the torsion bar. Therefore, the torsion bar is unstable and subject to creep. The function of the torsion bar is compromised and it fails quickly.
In the case of the torsion bar made with technology B, its safety factor SF = 0, as seen in Table 4. The lifetime of the torsion bar made with technology A can be estimated in advance depending on the tangential strain of the presetting and the magnitude of the load in use, using Equations (10)–(12). Figure 10 shows the comparison of the principal stresses for the torsion bar manufactured in accordance with technologies A and B, in the range of the fatigue limit for R = 0, 0.1 and 0.33. For technology A, the calculated lifetime is N = 164 cycles at the maximum operating stress and N = 8,830,273 cycles at the maximum stress coinciding with the fatigue limit. Comparing the stress cycles of the two types of torsion bars, we can see that black lines, technology A, are displaced more into the safe region than red lines corresponding to technology B. The spread of black lines is smaller than the red ones, which are scattered throughout the area. From the above, it can be argued that care must be taken in manufacturing not to introduce excessive compressive stresses, as this destabilises the material and causes the material to creep. The initial stress state caused by technological processes is compounded by the torsional stress. This torsional stress causes tension in one principal direction and compression in the other. This additionally loads the material in the direction of compression. Such a high compressive stress results in plasticisation during torsion bar service.
In σ Hoct space the oblique line fatigue limit is shown in Figure 11. The red and black vertical lines are the load cycles for technologies A and B, respectively, for 0, 1 and 2 mm in depth. Just as in Figure 10, the load cycles exceed the fatigue limit. The lower the hydrostatic stress, the higher the fatigue limit, if the line is tilted enough. Figure 11 shows the lines for R = −1, −0.5 and 0. The lines for R = −1 and −0.5 are inclined enough to increase the fatigue limit as the hydrostatic stress decreases, while the line R = 0 is almost horizontal. This means that the residual compressive stress has a positive effect at alternating torsional fatigue, while it has no effect at unidirectional torsional fatigue. This is another proof that technology B, which causes very high compressive stresses, is inferior to technology A.

6. Conclusions

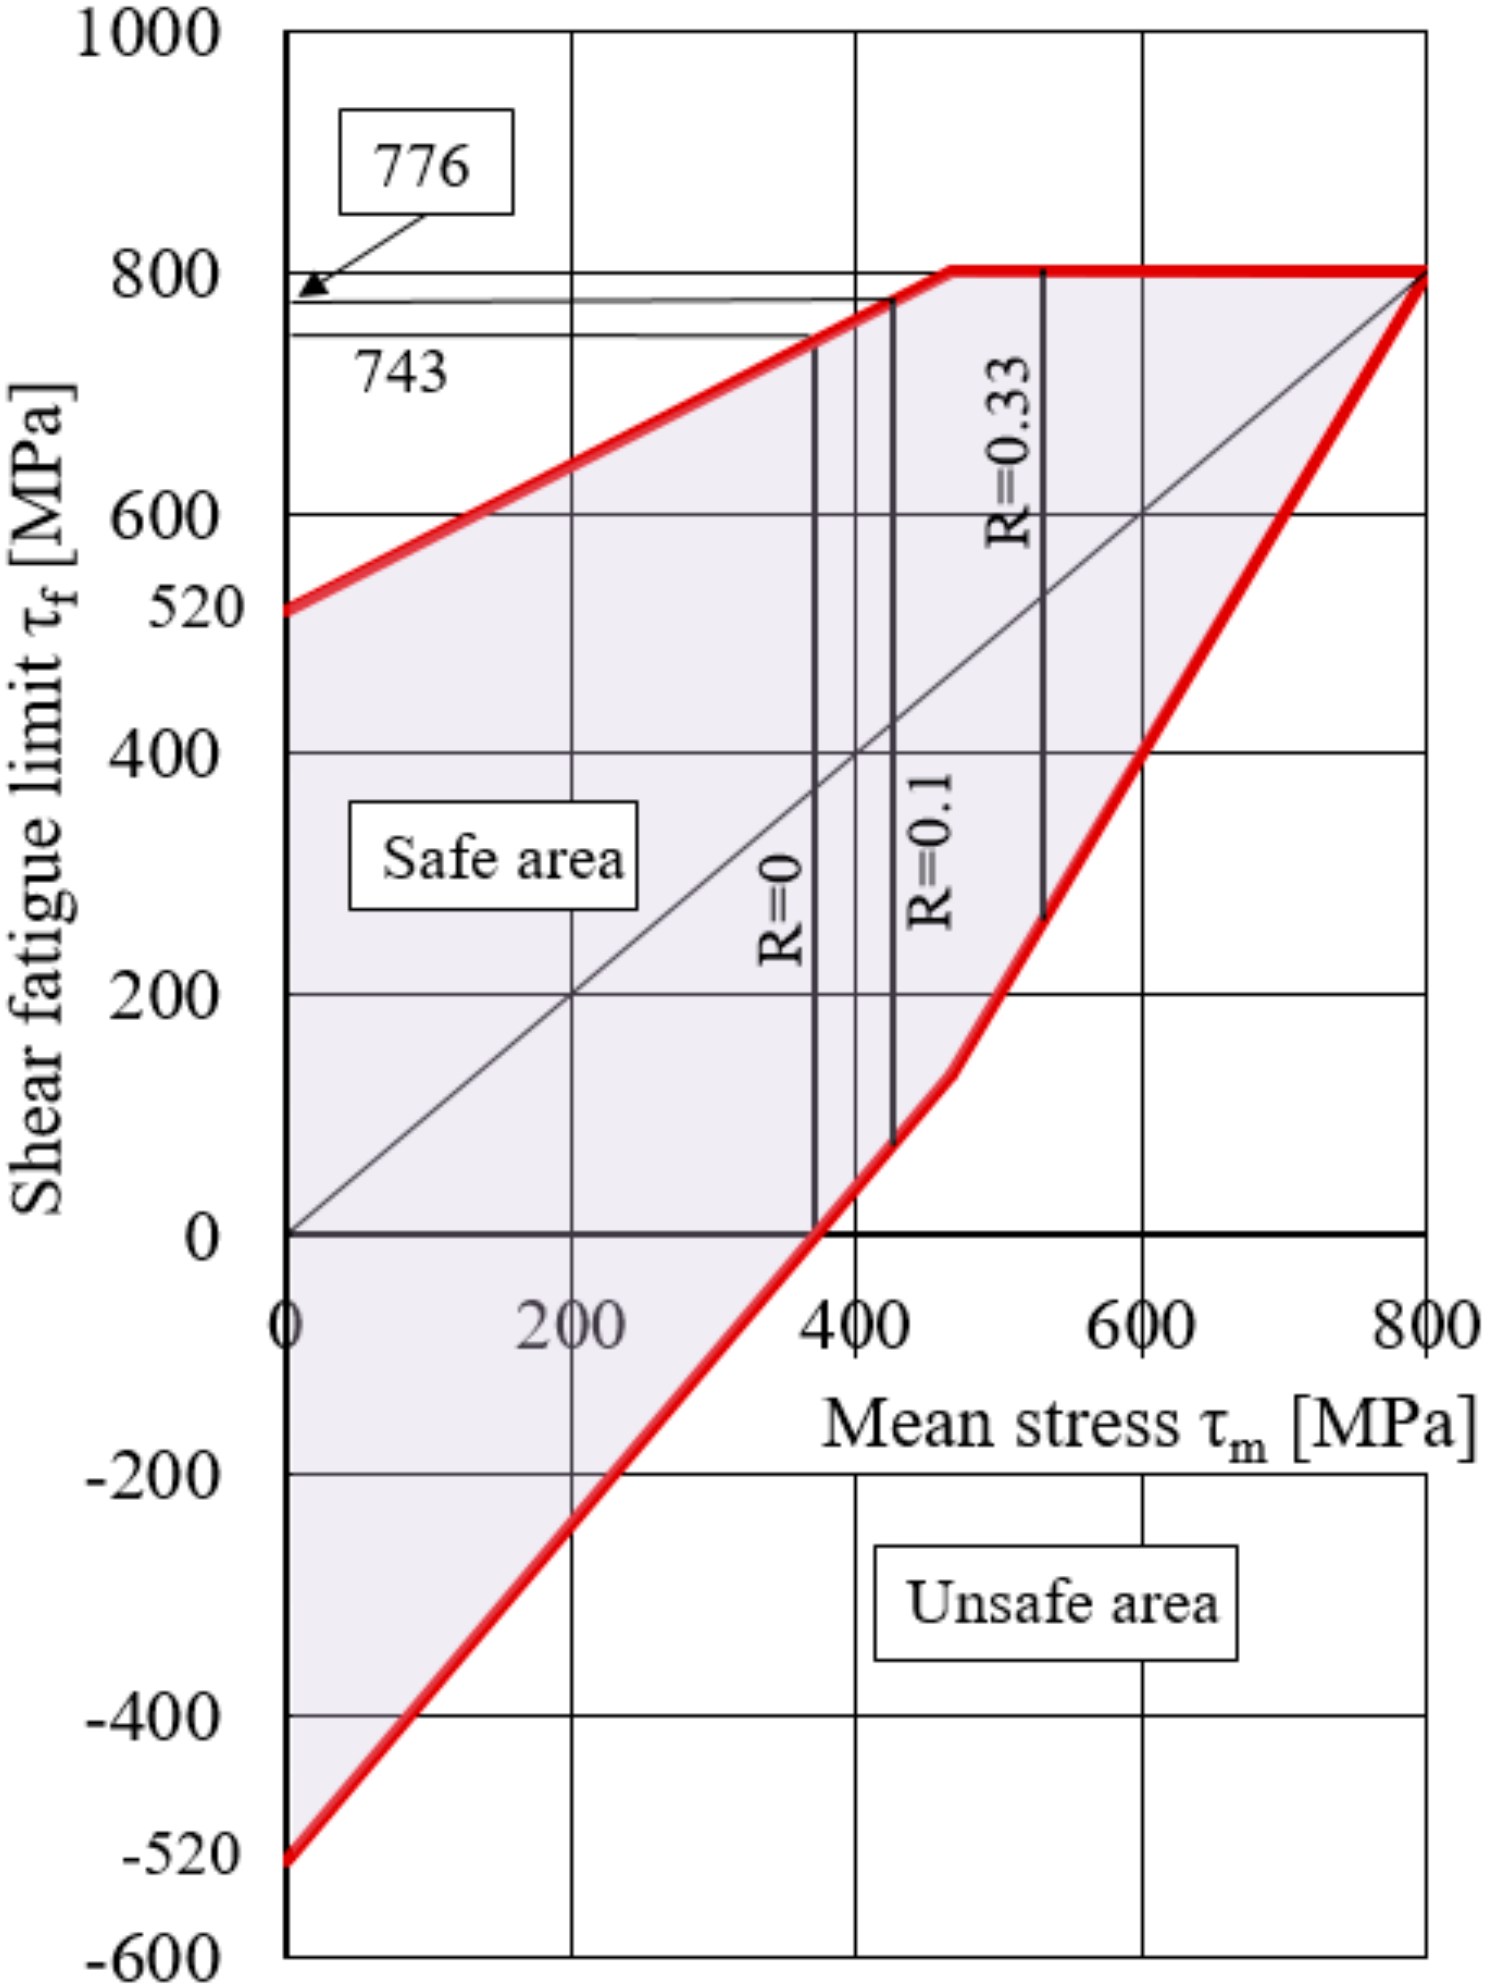
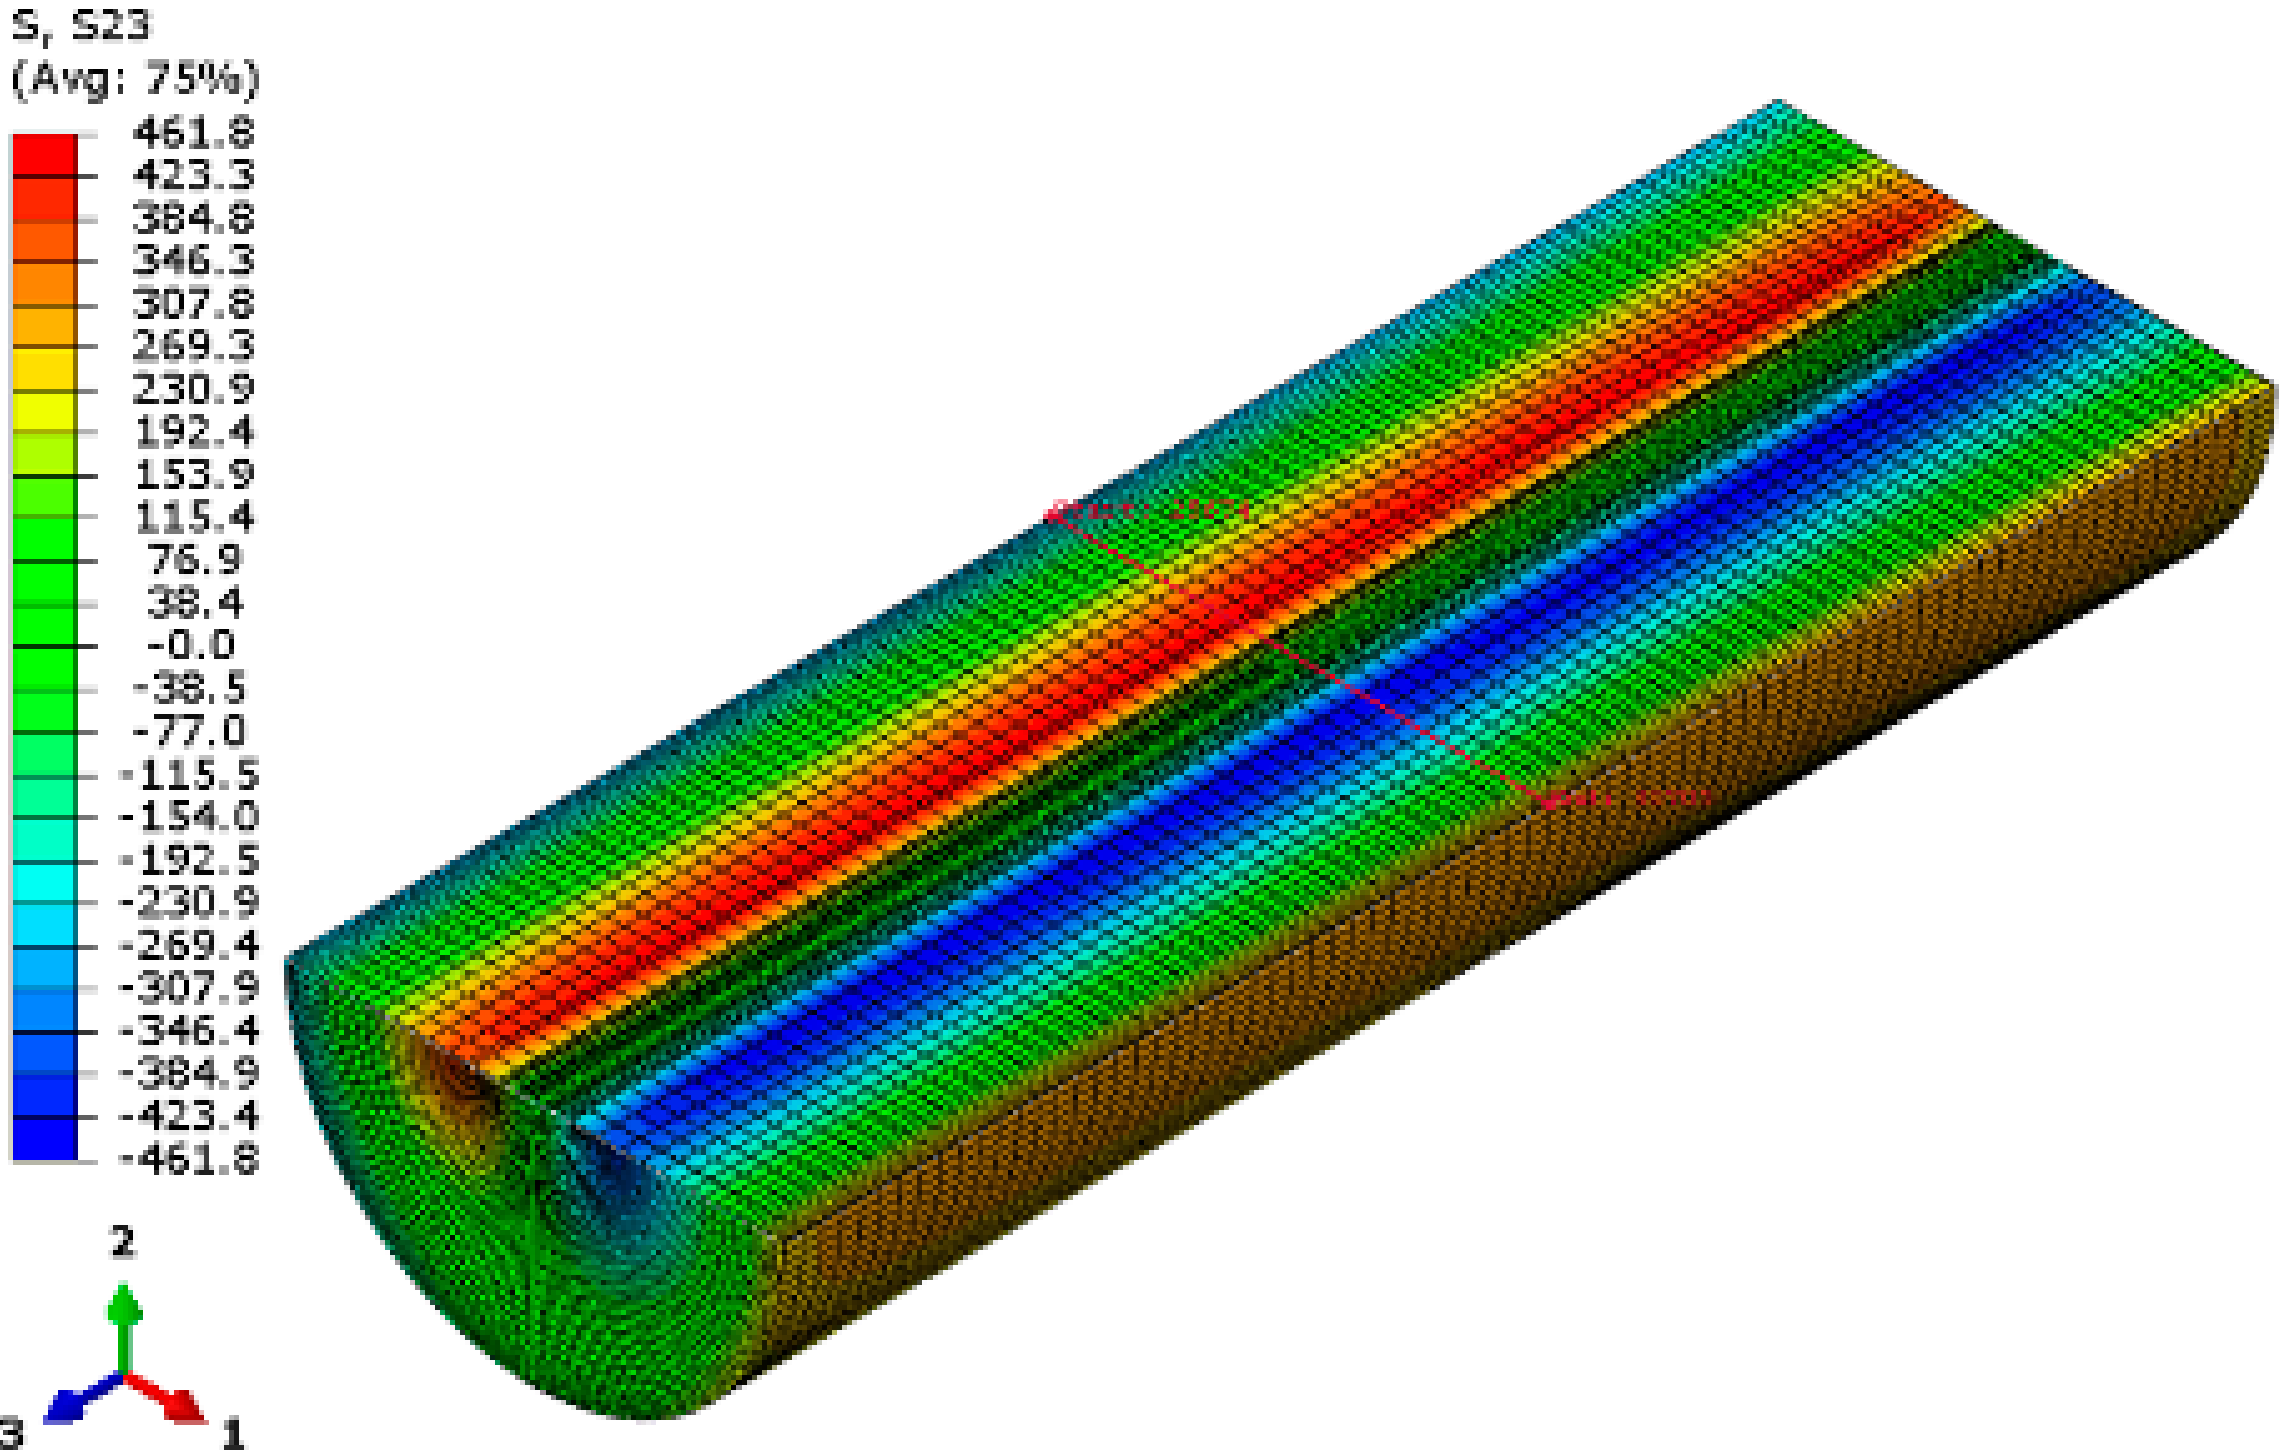
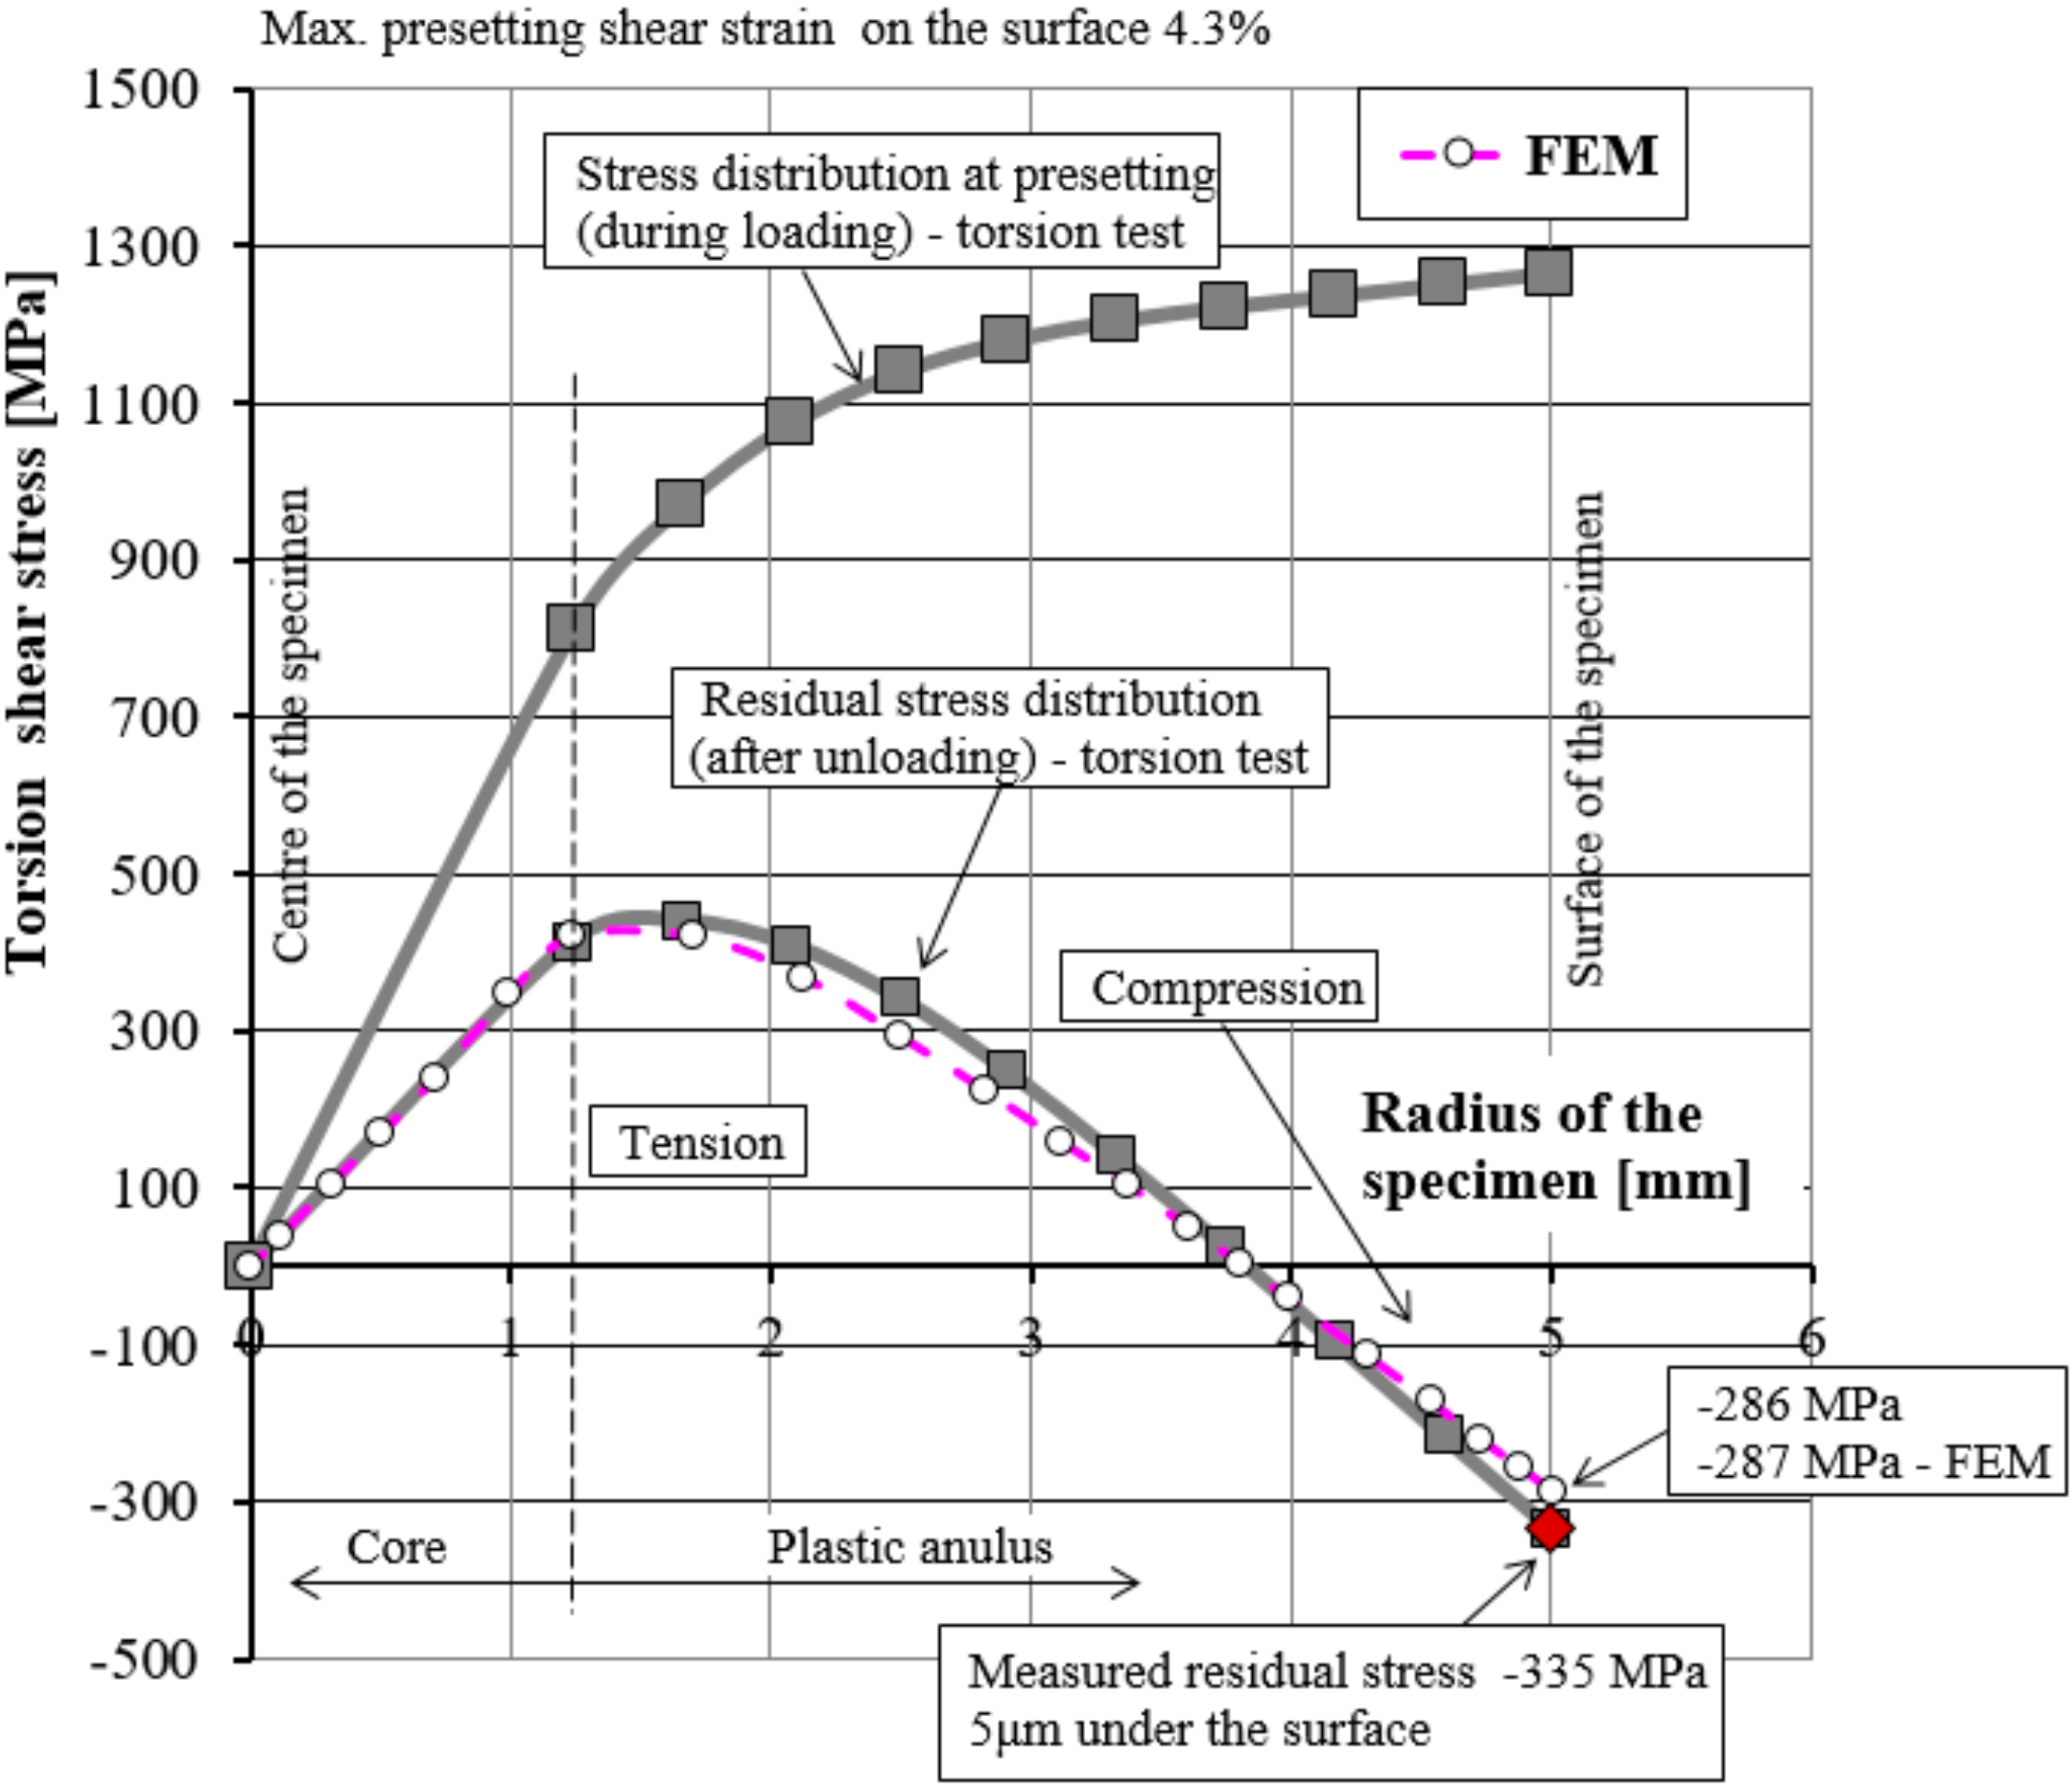
  • We analysed the stress state affected by different residual stress distributions and applied stresses using the Drucker–Prager criterion in order to determine the actual stress state of a torsional bar exposed to torque. Residual stresses and applied stress can be considered by the Drucker-Prager criterion in order to determine the principal stresses σ1, σ2 and the maximum amplitude of the shear stresses. The maximum amplitude of shear stresses appeared under the surface of the torsional bar (diameter 61.6 mm and length 1750 mm) under plane stress conditions (σ3 = 0), at a depth between 1 to 2 mm under the surface.
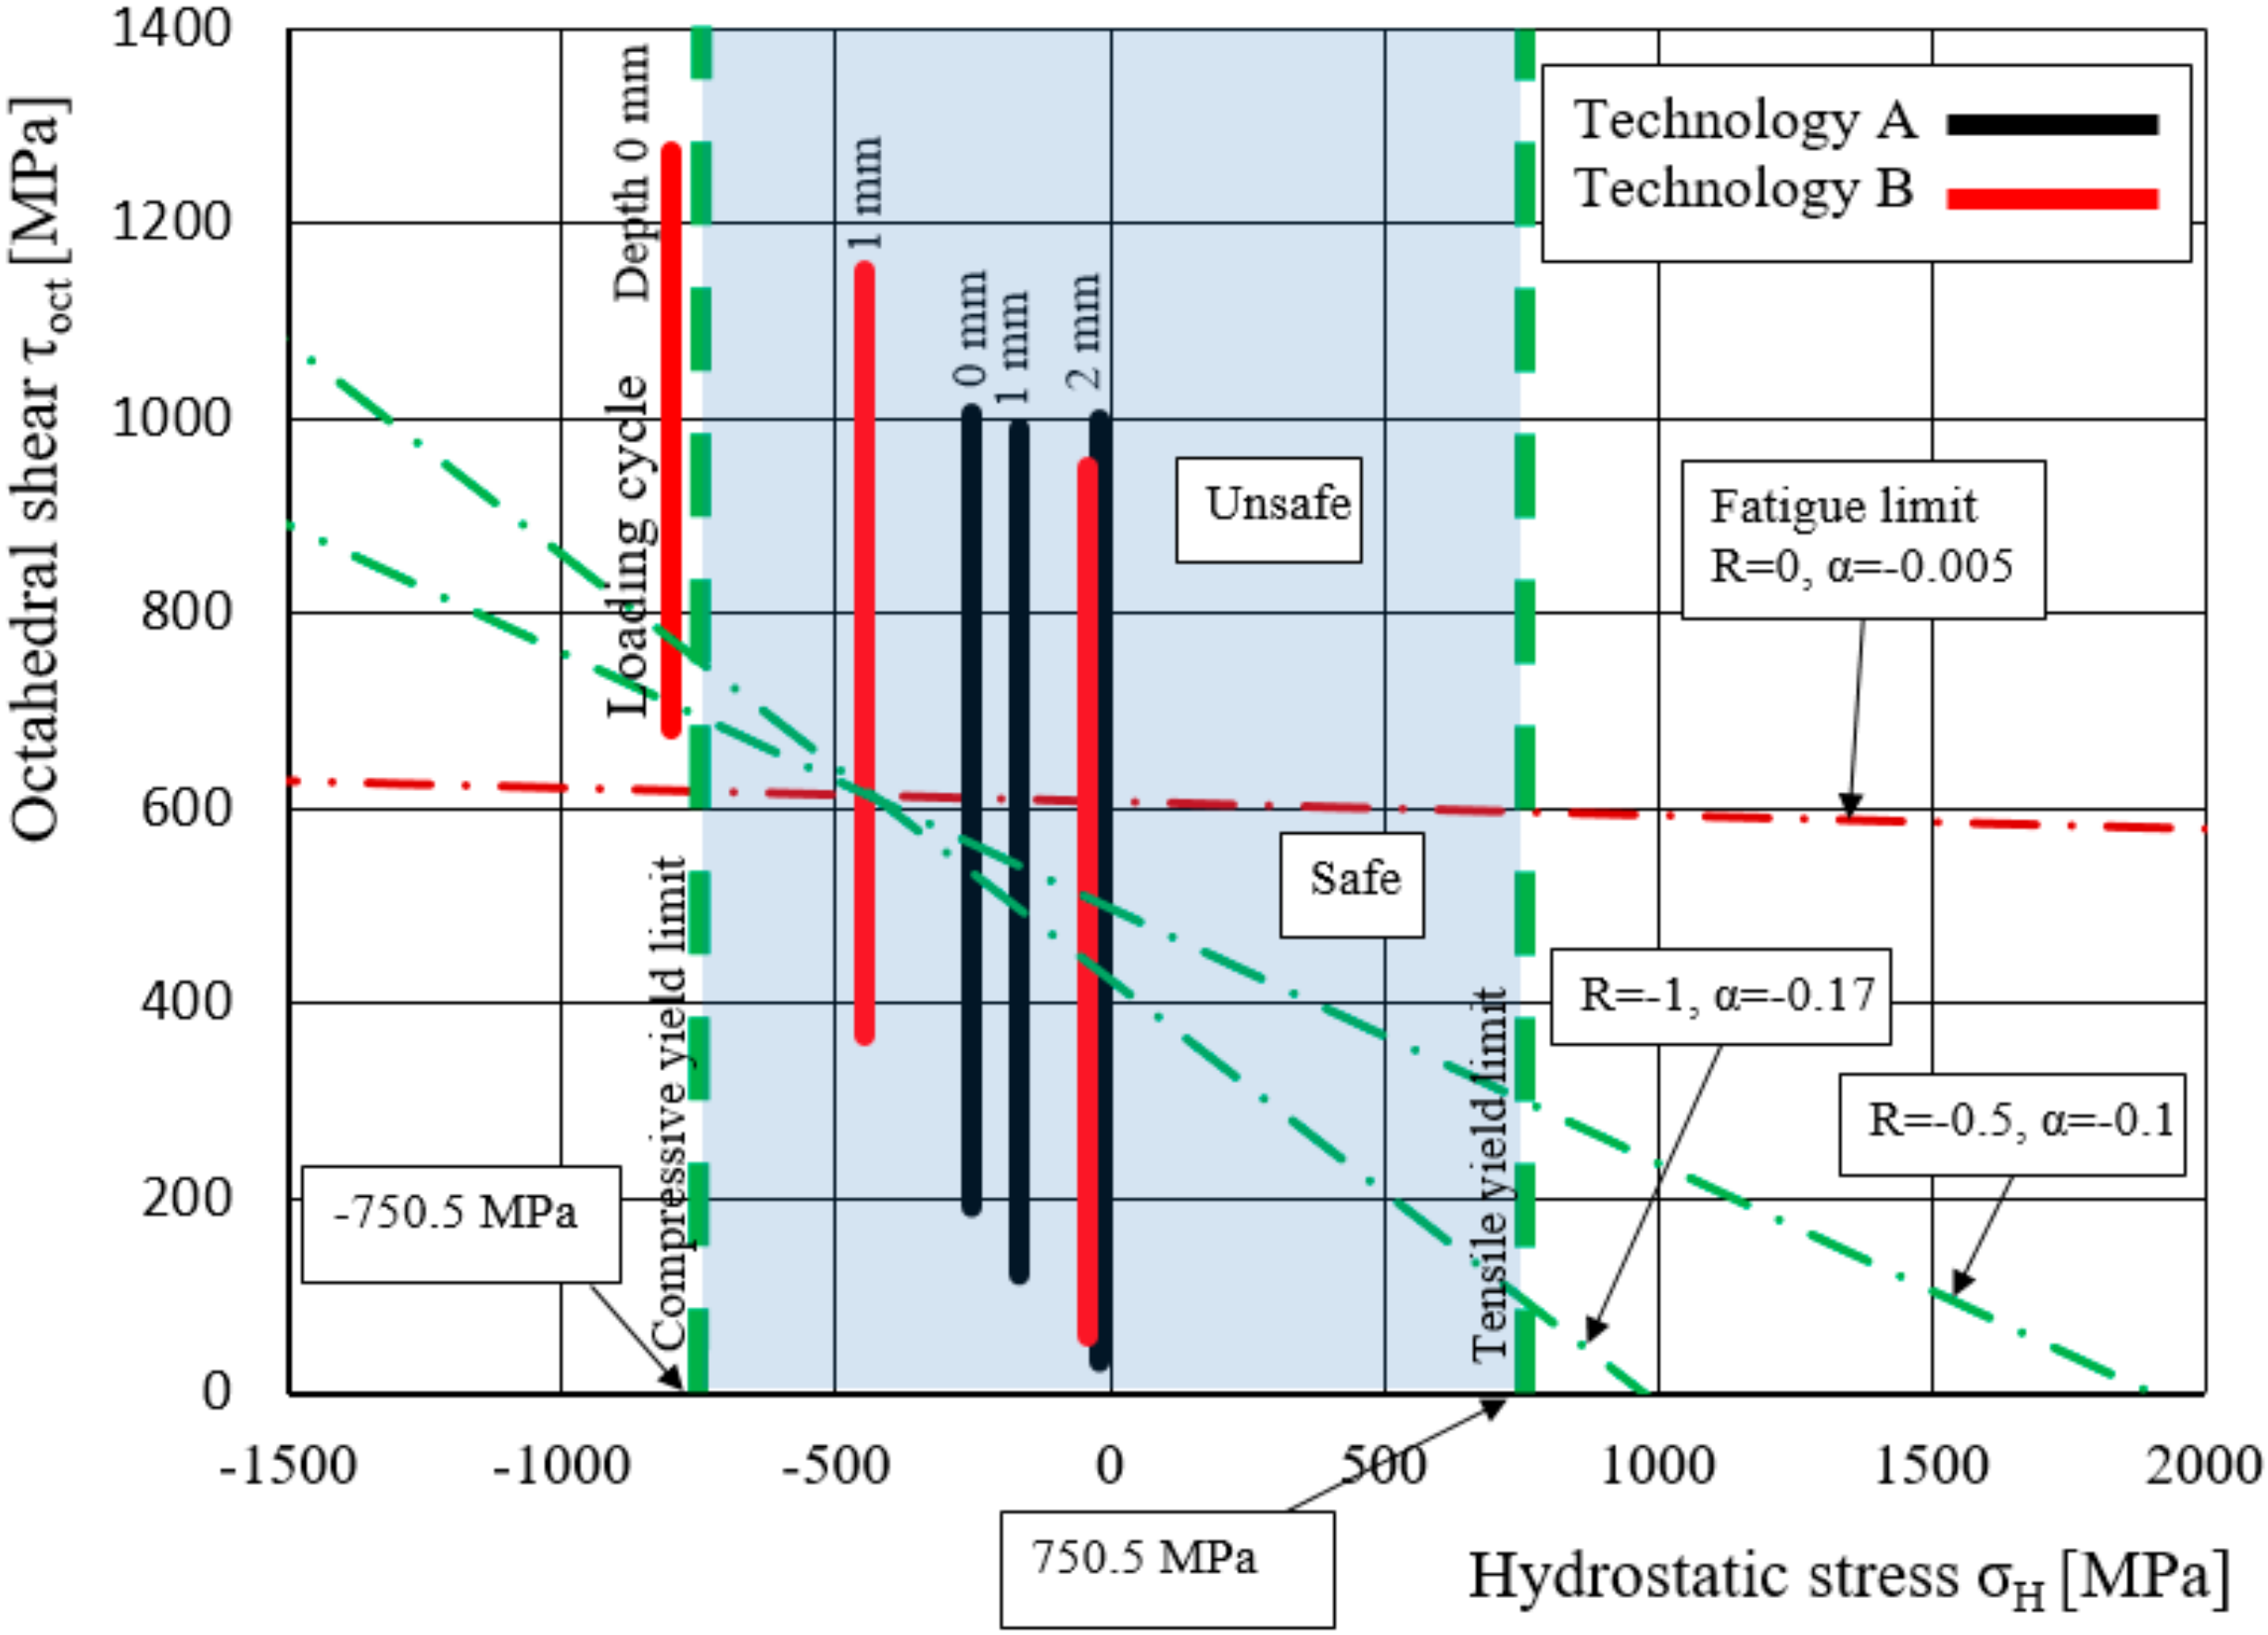
  • The results show that the fatigue limit can be achieved if the maximum principal stresses, resulting from residual stresses and the applied stress, do not overcome the safe stress zone. An additional increase of compressive residual stress near the surface redistributes the residual stresses in depth and can shift the loading amplitude of the principal stress far from the safe area in the Drucker-Prager criterion.
  • As soon as the maximum principal stress passes the edge of the safe zone, the number of cycles to failure rapidly reduces; from 8,830,273 cycle at the edge of the safe zone, to 164 cycles at the maximum operating stress. Experimental results proved that the effective loading ratio R and consequently the stress amplitude vary throughout the thickness of cross section of the bar. The location of the initiation of the fatigue crack is under the surface at the highest amplitude stress zone, regardless of the effective loading ratio R. The safety factor is higher below the surface (SF = 0.492) than on the surface (SF = 0.426), when the technology A is used.
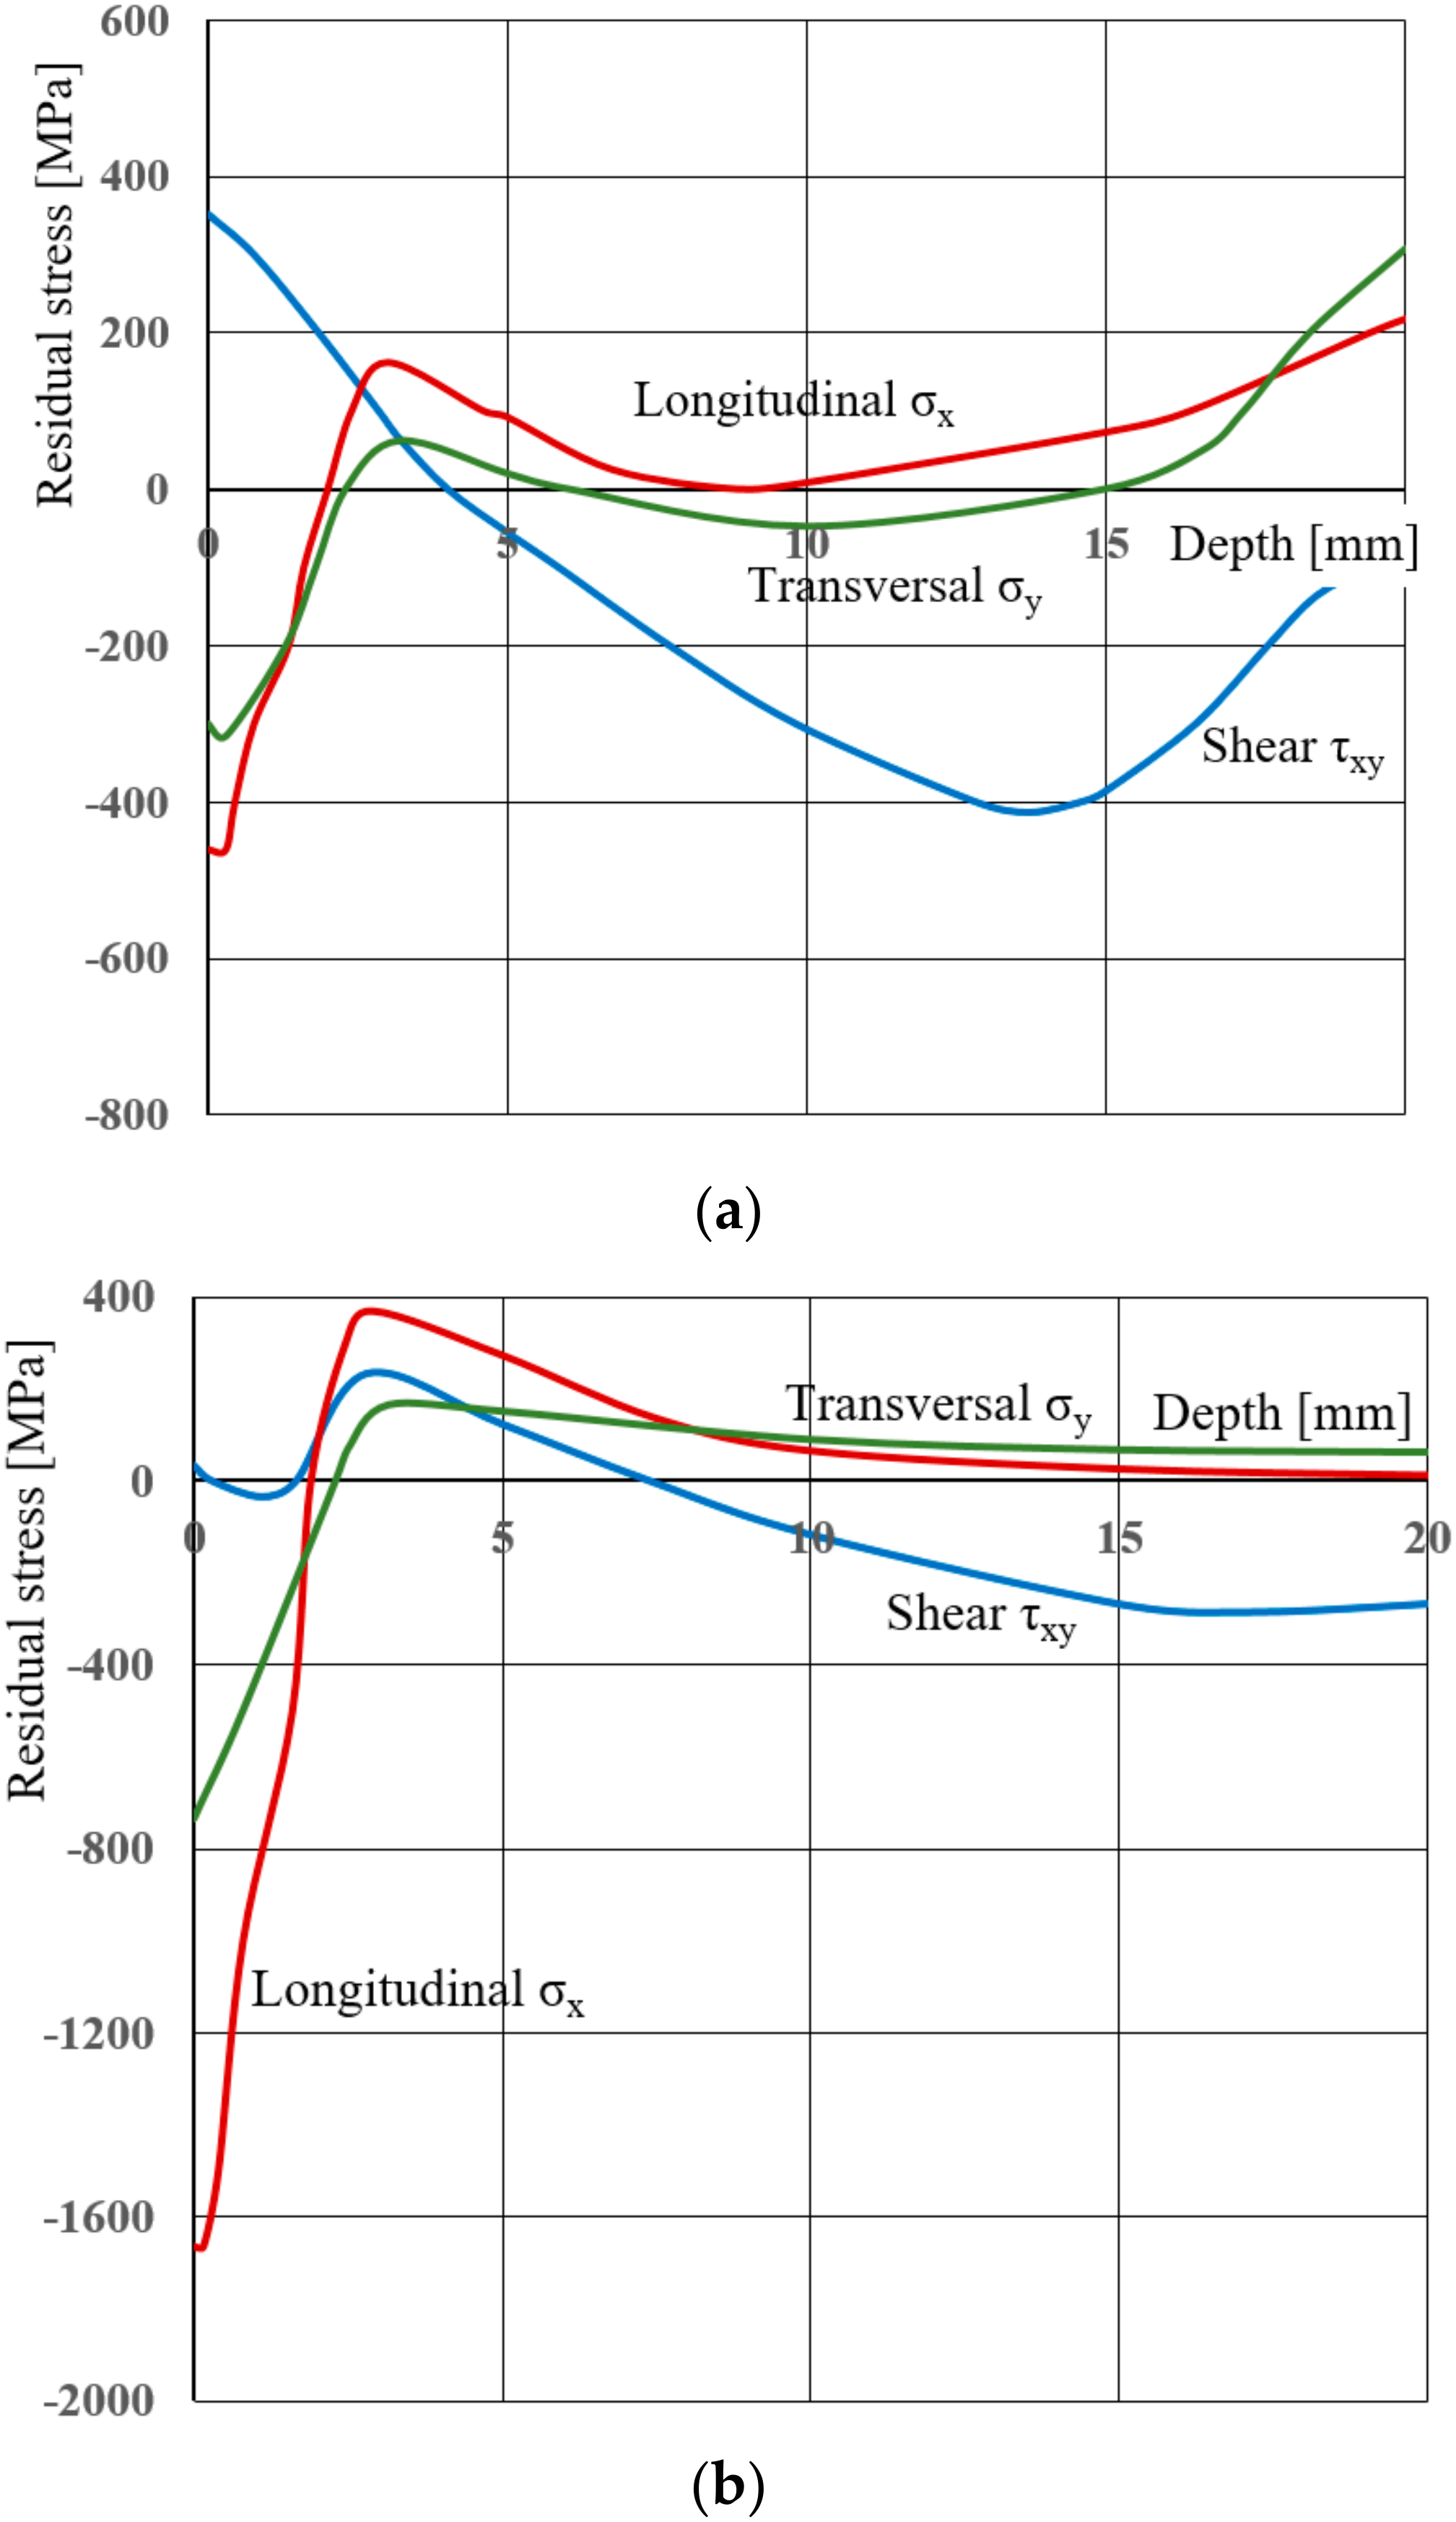
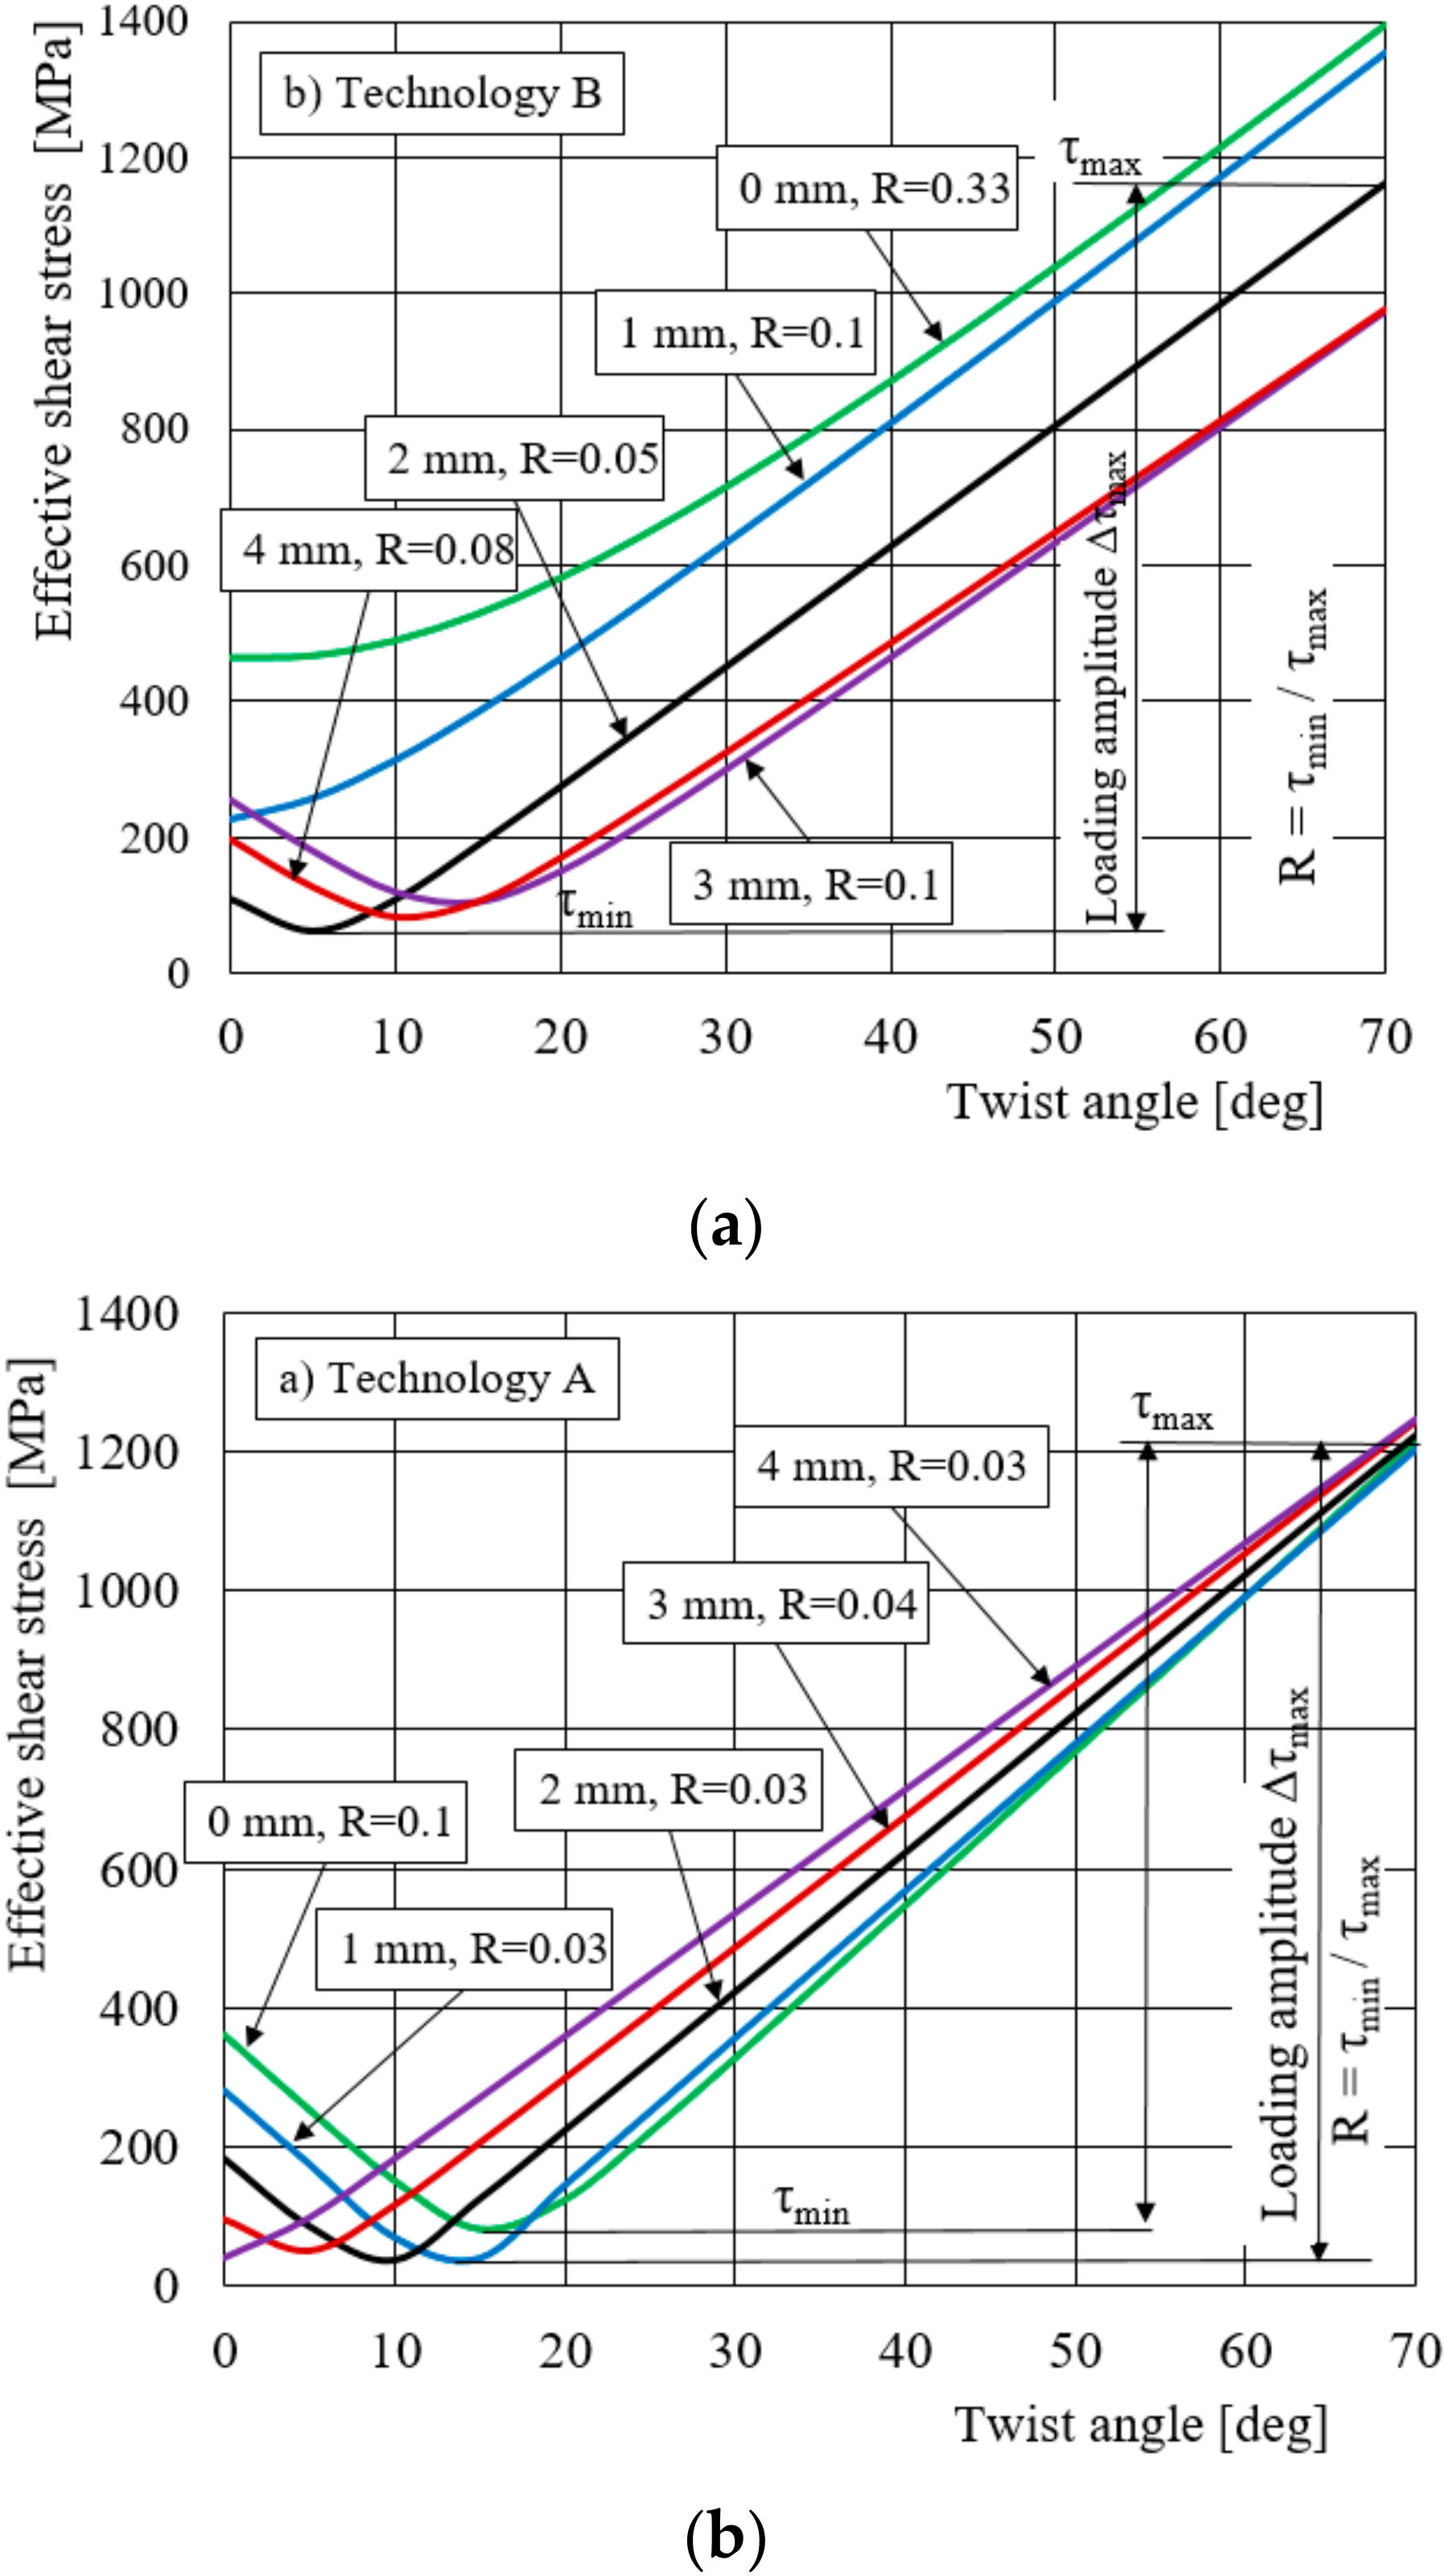
  • Consequently, increasing compressive residual stress at the surface by a technological process B has no significant effect on fatigue crack initiation in situ, far under the surface, shown in Figure 2. Increasing the plastic torsional presetting can shift the maximum stress amplitude into the interior far from the surface, but a significant volume of the material should remain elastically loaded in order to ensure a balance with compressive stresses from the surface of the solid bar section, see Figure 8. Therefore, there exists an optimum of compressive residual stresses induced by cold rolling and presetting, according to technology A for a required endurance of torsion bar.
  • Increasing the residual compressive stress has a positive effect on the increase in the fatigue limit at cyclic torsional fatigue R = −1, while it has no influence at unidirectional torsional fatigue R = 0, see Figure 11. This is another proof that technology B, which causes very high compressive stresses (2600 MPa), is inferior to technology A.

Author Contributions

The research was conceptualized and supervised by N.G. Formal analysis and methodology were provided by V.M. Investigative support and numerical analysis was performed by J.P. All authors have read and agreed to the published version of the manuscript.

Funding

This research did not receive external funding.

Acknowledgments

The authors would like to acknowledge the Slovenian Research Agency (ARRS) for financial support of the Research Program P2-0137 “Numerical and experimental analysis of mechanical systems”.

Conflicts of Interest

The authors declare no conflict of interest.

References

  1. Aernoudt, E.; Snoeys, R. Der Torsionsversuch, ein Verfahren zur Messung der plastischen Eigenschaften von Metallen. Drahtwelt 1973, 59, 170–177. [Google Scholar]
  2. Kloos, K.H.; Koch, M.; Kaiser, B. Eigenspannungsmessungen an unterschiedlich abgekohlten, kugelgestrahlten und torsionsschwellbeanspruchten Proben aus Federstahl. Werkstofftech 1986, 17, 350–356. [Google Scholar] [CrossRef]
  3. Perenda, J.; Trajkovski, J.; Žerovnik, A.; Prebil, I. Residual stresses after deep rolling of a torsion bar made from high strength steel. J. Mate. Process. Technol. 2014, 218, 89–98. [Google Scholar] [CrossRef]
  4. Močilnik, V.; Gubeljak, N.; Predan, J. Model for fatigue lifetime prediction of torsion bars subjected to plastic Pre-setting. Teh. Vjesn. Stroj. Fak. 2011, 18, 537–546. [Google Scholar]
  5. Perenda, J.; Trajkovski, J.; Žerovnik, A.; Prebil, I. Modeling and experimental validation of the surface residual stresses induced by deep rolling and Pre-setting of a torsion bar. Int. J. Mater. Form. 2016, 9, 435–448. [Google Scholar] [CrossRef]
  6. Zenner, H.; Simbürger, A.L.J. On the fatigue limit of ductile metals under complex multiaxial loading. Int. J. Fatigue 2000, 22, 137–145. [Google Scholar] [CrossRef]
  7. Tschegg, E.K. A contribution to mode III fatigue crack propagation. Mater. Sci. Eng. 1982, 54, 127–136. [Google Scholar] [CrossRef]
  8. Makabe, C.; Socie, D.F. Crack growth mechanisms in precracked torsion fatigue specimens. Fatigue Fract. Eng. Mater. Struct. 2001, 24, 607–615. [Google Scholar] [CrossRef]
  9. Yang, F.P.; Kuang, Z.B. Fatigue crack growth for a surface crack in a round bar under multi-axial loading condition. Fatigue Fract. Eng. Mater. Struct. 2005, 28, 963–970. [Google Scholar] [CrossRef]
  10. Tanaka, K.; Kato, T.; Akinawa, Y. Prediction of fatigue crack propagation behaviour from a pre-crack under combined torsional and axial loadings. In Proceedings of the International Conference on Fatigue Crack Paths, Parma, Italy, 18–20 September 2003. [Google Scholar]
  11. Papuga, J.; Halama, R. Mean stress effect in multiaxial fatigue limit criteria. Arch. Appl. Mech. 2019, 89, 823–834. [Google Scholar] [CrossRef]
  12. Zhang, L.; Liu, D.; Song, Q.; Liu, S. An analytical expression of reliability solution for Drucker-Prager criterion. Appl. Math. Mech. 2008, 29, 121–128. [Google Scholar] [CrossRef]
  13. Mrzyglod, M.; Zielinski, P.A. Numerical implementation of multiaxial high-cycle fatigue criterion to structural optimisation. J. Theor. Appl. Mech. 2006, 44, 691–712. [Google Scholar]
  14. Peridas, G.; Hills, D.A. Crack initiation: The choice of tests available to calibrate Dang Van’s criterion. Fatigue Fract. Eng. Mater. Struct. 2002, 25, 321–330. [Google Scholar] [CrossRef]
  15. Bernasconi, A.; Foletti, S.; Papadopoulos, I.V. A study on combined torsion and axial load fatigue limits tests with stresses of different frequencies. Int. J. Fatigue 2008, 30, 1430–1440. [Google Scholar] [CrossRef]
  16. Golos, K.M. Multiaxial fatigue criterion with mean stress effect. Int. J. Press. Ves. Pip. 1996, 69, 236–266. [Google Scholar] [CrossRef]
  17. Susmel, L.; Tovo, R.; Lazzarin, P. The mean stress effect on the high-cycle fatigue strength from a multiaxial fatigue point of view. Int. J. Fatigue 2005, 27, 928–943. [Google Scholar] [CrossRef]
  18. Wang, C.H.; Miller, K.J. The effect of mean shear stress on torsional fatigue behaviour. Fatigue Fract. Eng. Mater. Struct. 1991, 14, 293–307. [Google Scholar] [CrossRef]
  19. Susmel, L.; Lazzarin, P. A bi-parametric Wöhler curve for high cycle multiaxial fatigue assessment. Fatigue Fract. Mater. Struct. 2002, 25, 63–78. [Google Scholar] [CrossRef]
  20. Yu, T.; Teng, J.G.; Wong, Y.L.; Dong, S.L. Finite element modelling of confined concrete—I: Drucker-Prager plasticity model. Eng. Struct. 2010, 32, 665–679. [Google Scholar] [CrossRef]
  21. Pan, Y.; Liu, Y.; Qian, J.; Yang, Q. Integration Algorithms Based on Drucker-Prager Criterion and Application in Slope Stability Analysis. Const. Model. Geomater. 2013, 757–763. [Google Scholar] [CrossRef]
  22. Dang Van, K. Macro-Micro Approach in High-Cycle Multiaxial Fatigue. In Advances in Multiaxial Fatigue; ASTM STP 1191; McDowel, D.L., Ellis, R., Eds.; ASTM International: Philadelphia, PA, USA, 1993; pp. 120–130. [Google Scholar]
  23. Gross, D.; Seilig, T. Fracture Mechanics; Springer: Berlin/Heidelberg, Germany, 2016. [Google Scholar]
  24. Močilnik, V.; Gubeljak, N.; Predan, J. The influence of a static constant normal stress level on the fatigue resistance of high strength spring steel. Theor. Appl. Fract. Mech. 2017, 91, 139–147. [Google Scholar] [CrossRef]
  25. Močilnik, V.; Gubeljak, N.; Predan, J.; Flašker, J. The influence of constant axial compression pre-stress on the fatigue failure of torsion loaded tube springs. Eng. Fract. Mech. 2010, 77, 3132–3142. [Google Scholar] [CrossRef]
  26. Sines, G. Behaviour of metals under complex static and alternating stresses. In Metal Fatigue; Sines, G., Waisman, J.L., Eds.; Mc Graw Hill: New York, NY, USA, 1959; pp. 145–169. [Google Scholar]
  27. Močilnik, V.; Gubeljak, N.; Predan, J. Surface residual stresses induced by torsional plastic pre-setting of solid spring bar. Int. J. Mech. Sci. 2015, 92, 269–278. [Google Scholar] [CrossRef]
Figure 1. Set of torsion spring bars ready for delivery.
Metals 10 01056 g001
Figure 2. Residual stress components after surface rolling and presetting [3]: (a) Technology A and (b) Technology B.
Metals 10 01056 g002
Figure 3. Smith diagram for torsion dynamic loading of the actual material. The used fatigue ratios R = 0, R = 0.1 and R = 0.33 are drawn.
Metals 10 01056 g003
Figure 6. Effective maximum shear stress as a function of the test angle. (a) Technology A; (b) Technology B.
Metals 10 01056 g006
Figure 7. Fracture of the specimen oriented in the transversal direction of the specimen [4].
Metals 10 01056 g007
Figure 8. Numerical finite element method (FEM) model of the cylindrical specimen subjected to pure torsion at the maximum presetting shear strain of 4.3%, and the residual shear stress distribution after unloading, according to technology A.
Metals 10 01056 g008
Figure 9. Shear stress distribution over cross section of the specimen after the shear presetting strain of 4.3%, determined with an analytical and FEM1214 calculation and comparison between the calculated stress value at surface of the specimen and the measured one [27].
Metals 10 01056 g009
Figure 10. Principal stress components σ1 and σ2 during the loading amplitude in dependence of the D-P criterion 0, 1 and 2 mm under the surface of the torsion bar, comparing technologies A and B.
Metals 10 01056 g010
Figure 11. Fatigue criterion in the octahedral shear–hydrostatic stress space.
Metals 10 01056 g011
Table 1. Average mechanical properties of the torsion bar.
UTS Rm [MPa]Yield Strength
Rp0.2 [MPa]
Torsion Elastic Limit τe [MPa]Shear Modulus
G [GPa]
Modulus
E [GPa]
Tensile Fatigue Limit R = 0 [MPa]Tensile Fatigue Limit R = −1 [MPa]Torsion Fatigue Limit R = −1 [MPa]
20101570800801931200800520
Table 2. Chemical composition in wt. % of the used material, equal to that in [3].
Chemical Element:CSiMnNiCrMoVCuSP
Actual val.0.440.280.561.410.870.260.110.120.0020.009
Min.0.420.170.51.30.80.20.1000
Max.0.50.370.81.81.10.30.180.250.0020.009
Table 3. Effective fatigue ratios, R, for both manufacturing technologies of the torsion bar.
Depth [mm]012
TechnologyRΔτ [MPa]RΔτ [MPa]RΔτ [MPa]
Technology A0.1610980.0311830.031186
Technology B0.339310.16711270.051100
Table 4. Safety factor SF, and D-P coefficients α and K.
TechnologyDepth [mm]012
Technology AR/Δτ [MPa]0.1610980.0311830.031186
SF0.4920.4260.483
α−0.0380.00580.0058
K800743743
Technology BR/Δτ [MPa]0.339310.16711270.051100
SF00.4860.577
α−0.038−0.0380.0058
K800800743
Table 5. Calculated shear stress, shear presetting strains and predicted number of cycles for the technology A and fatigue amplitudes a–b and a–c (Figure 10) at a constant fatigue ratio R.
Amplitude’s End Points (Figure 10)Rτcal [MPa]γps
[rad]
N
[cycles]
SF
(safety factor)
a–b 0.110030.04388.830.2731
a–c15610.04381640.492

