Article

Analysis of Wall Thickness Eccentricity in the Rotary Tube Piercing Process Using a Strain Correlated FE Model

1
Department of Mechanics, Design and Industrial Management, University of Deusto, Avda Universidades 24, 48007 Bilbao, Spain
2
R&D Department, Tubos Reunidos Industrial, Barrio Sagarribai 2, 01470 Amurrio, Spain
*
Author to whom correspondence should be addressed.
Metals 2020, 10(8), 1045; https://doi.org/10.3390/met10081045
Submission received: 2 July 2020 / Revised: 21 July 2020 / Accepted: 29 July 2020 / Published: 3 August 2020
(This article belongs to the Special Issue Application of FEM-Simulation in Metal Forming)

Abstract

:
The wall thickness eccentricity is one of the most important weaknesses that appears in seamless tubes production, since this imperfection is subsequently transferred downstream through the manufacturing stages until the final product. For this reason, in this article a finite element model of the rotary tube piercing (RTP) process is developed aimed at analysing the wall thickness eccentricity imperfection. Experimental data extracted from the industrial process is used for the validation of the model, including operational process variables like power consumption and process velocity, and deformation variables as elongation and longitudinal torsion, originated by axial and shear strain respectively. The cause of longitudinal torsion is also analysed. The two most important conclusions derived from this study are: (I) the longitudinal torsion of the tube is a crucial parameter for the correct model validation, and (II) the combined effect between the uneven temperature distribution of the billet and the plug bending deformation is identified as the major cause of the wall thickness eccentricity flaw.

1. Introduction

Seamless tubes are produced for applications with a wide range of wall thickness and diameters up to 650 mm [1]. They present good homogeneity in the circumferential direction, making them resistant to internal pressure and torsion. In general, seamless tube production technologies start with the perforation of a billet previously heated in a rotary furnace. This perforation stage is performed in rotary tube piercing (RTP) mills, but there are different configurations depending on the number and shapes of the director rolls and guiding devices.
Piercing mills that count with two rolls are the most extended ones. In addition, they are sorted in Diescher’s or Stiefel’s mills when their guides are discs or shoes respectively [2]. Recently three-roll mills are becoming popular as they do not require guiding devices and tandem solutions have been evaluated [3]. However, the best quality for tubes with thick wall is obtained from two rolling mills with two guiding discs of Diescher type [4]. They are considered the rolling mean with the highest forming stability but present some drawbacks, namely, the wall thickness eccentricity. This wall thickness eccentricity is developed during the initial perforation and remains along the subsequent manufacturing stages until the final product. Thus, the reduction of the eccentricity in the RTP process would result in a relevant improvement of both process performance and product quality.
First finite element (FE) approaches to study the RTP process were 2D plane stress simplifications [5] and 3D models in steady-state approximations [6,7]. A three dimensional simulation of a Diescher mill under not steady conditions was conducted afterwards by Pater et al. [4]. However, the validation was conducted from experimental data generated in laboratory tests and there is no mention to the Mannessmann effect, which may lead to errors in the calculation of strain distribution. Lu et al. [8,9,10,11] presented an approximation by the use of 3D rigid-plastic finite element method (FEM), including simplifications as the exclusion of the shoes. The main contribution was to identify the area before the plug as the part where fractures are localised and a detailed study of the mean stresses in the working piece.
Pater et al. [12] analysed the influence of the piercing plug position and its shape on the process. It was stated that the plug position has an influence on the external and internal diameter deviations. Also the cross-rolling angles were analysed determining that bigger angles usually give better tolerances. This parametric analysis was graphically shown in a later publication [13], which presented as a novel issue the friction dependency on the slipping relative velocity between the rolls and material. However, the die coefficients were assumed and their validation responded only to the values of force exerted to the plug in a laboratory experiment.
More recent studies are focussed on increasing model accuracy by reducing assumptions on boundary conditions or by reproducing the different phenomena occurring in the RTP process. Murillo-Marrodán et al. [14] showed the importance of the correct selection of boundary conditions for the reliability of model results and conclusions. Another aspect that enhances the model accuracy is the correlation of strain. Mao et al. [15] combined a numerical study of a Tandem Skew Rolling Process with experimental tests to analyse strain parameters such as the wall thickness of the tube.
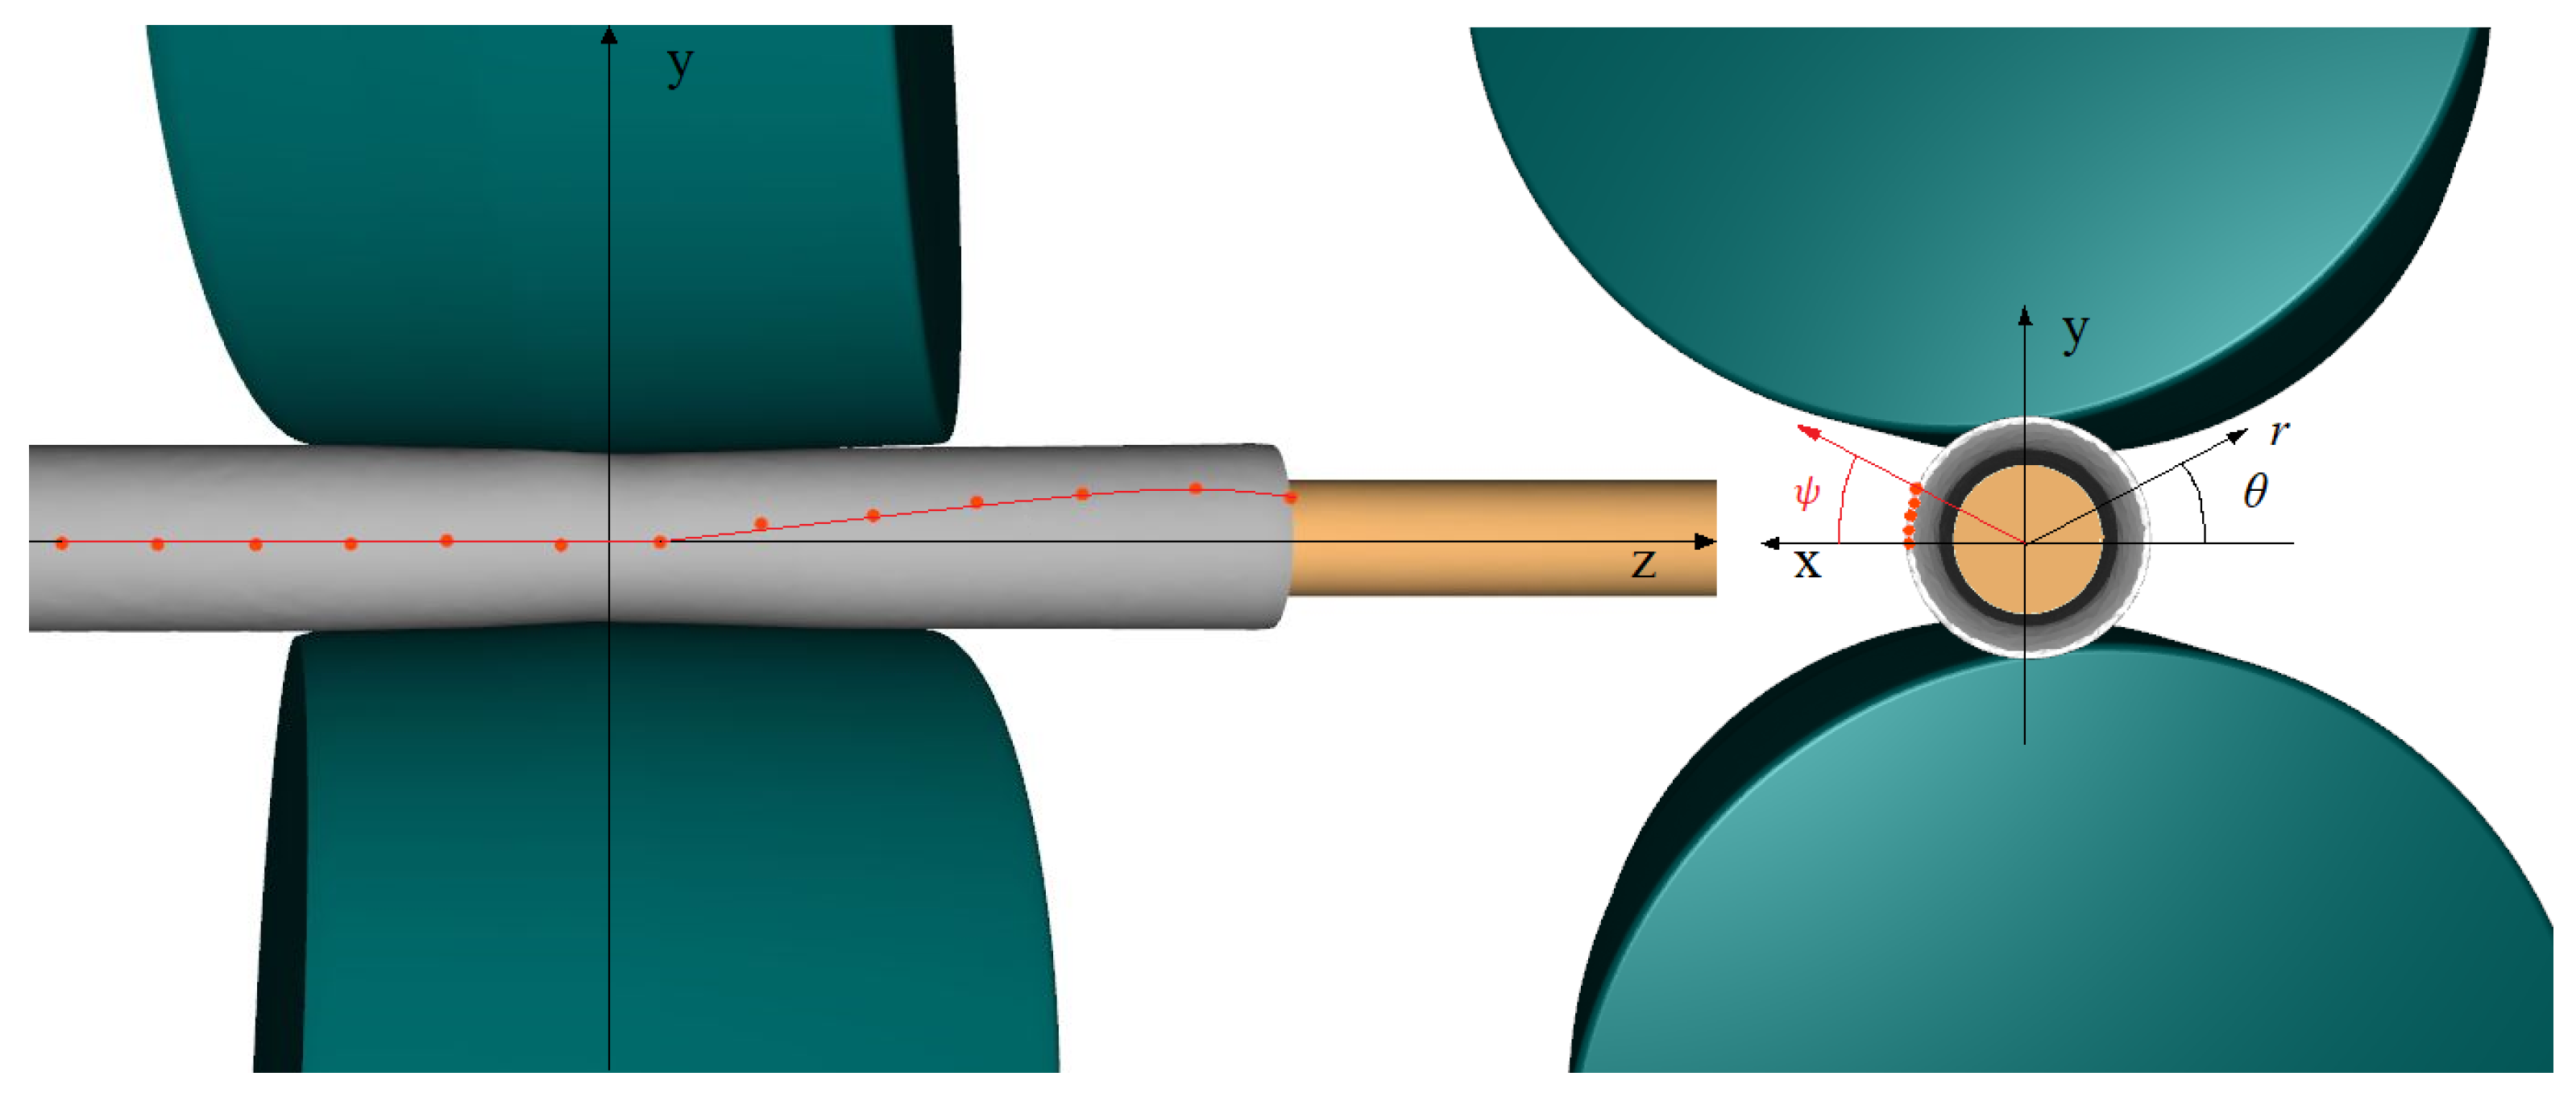
The RTP presents redundant characteristic deformations. One of them is the longitudinal torsion of the tube, which is an unwanted deformation along the billet length during the manufacturing process. Hayashi et al. [16,17] analysed experimentally the exsiting differences in terms of redundant shear deformation between barrel and tapered shaped rolls. In addition, the influence of the feed angle and cross-angle on the development of redundant deformation was further analysed. Then, in a posterior study [18], a skew angle was induced in the lateral discs to reduce the surface torsion. Komori et al. [19] analysed the shear strain of the material using a clay model of a cone-type piercing mill. However, there is not any theoretical evidence in the literature that explains why this redundant shear deformation is produced and there is not any available model that has reproduced this redundant strain.
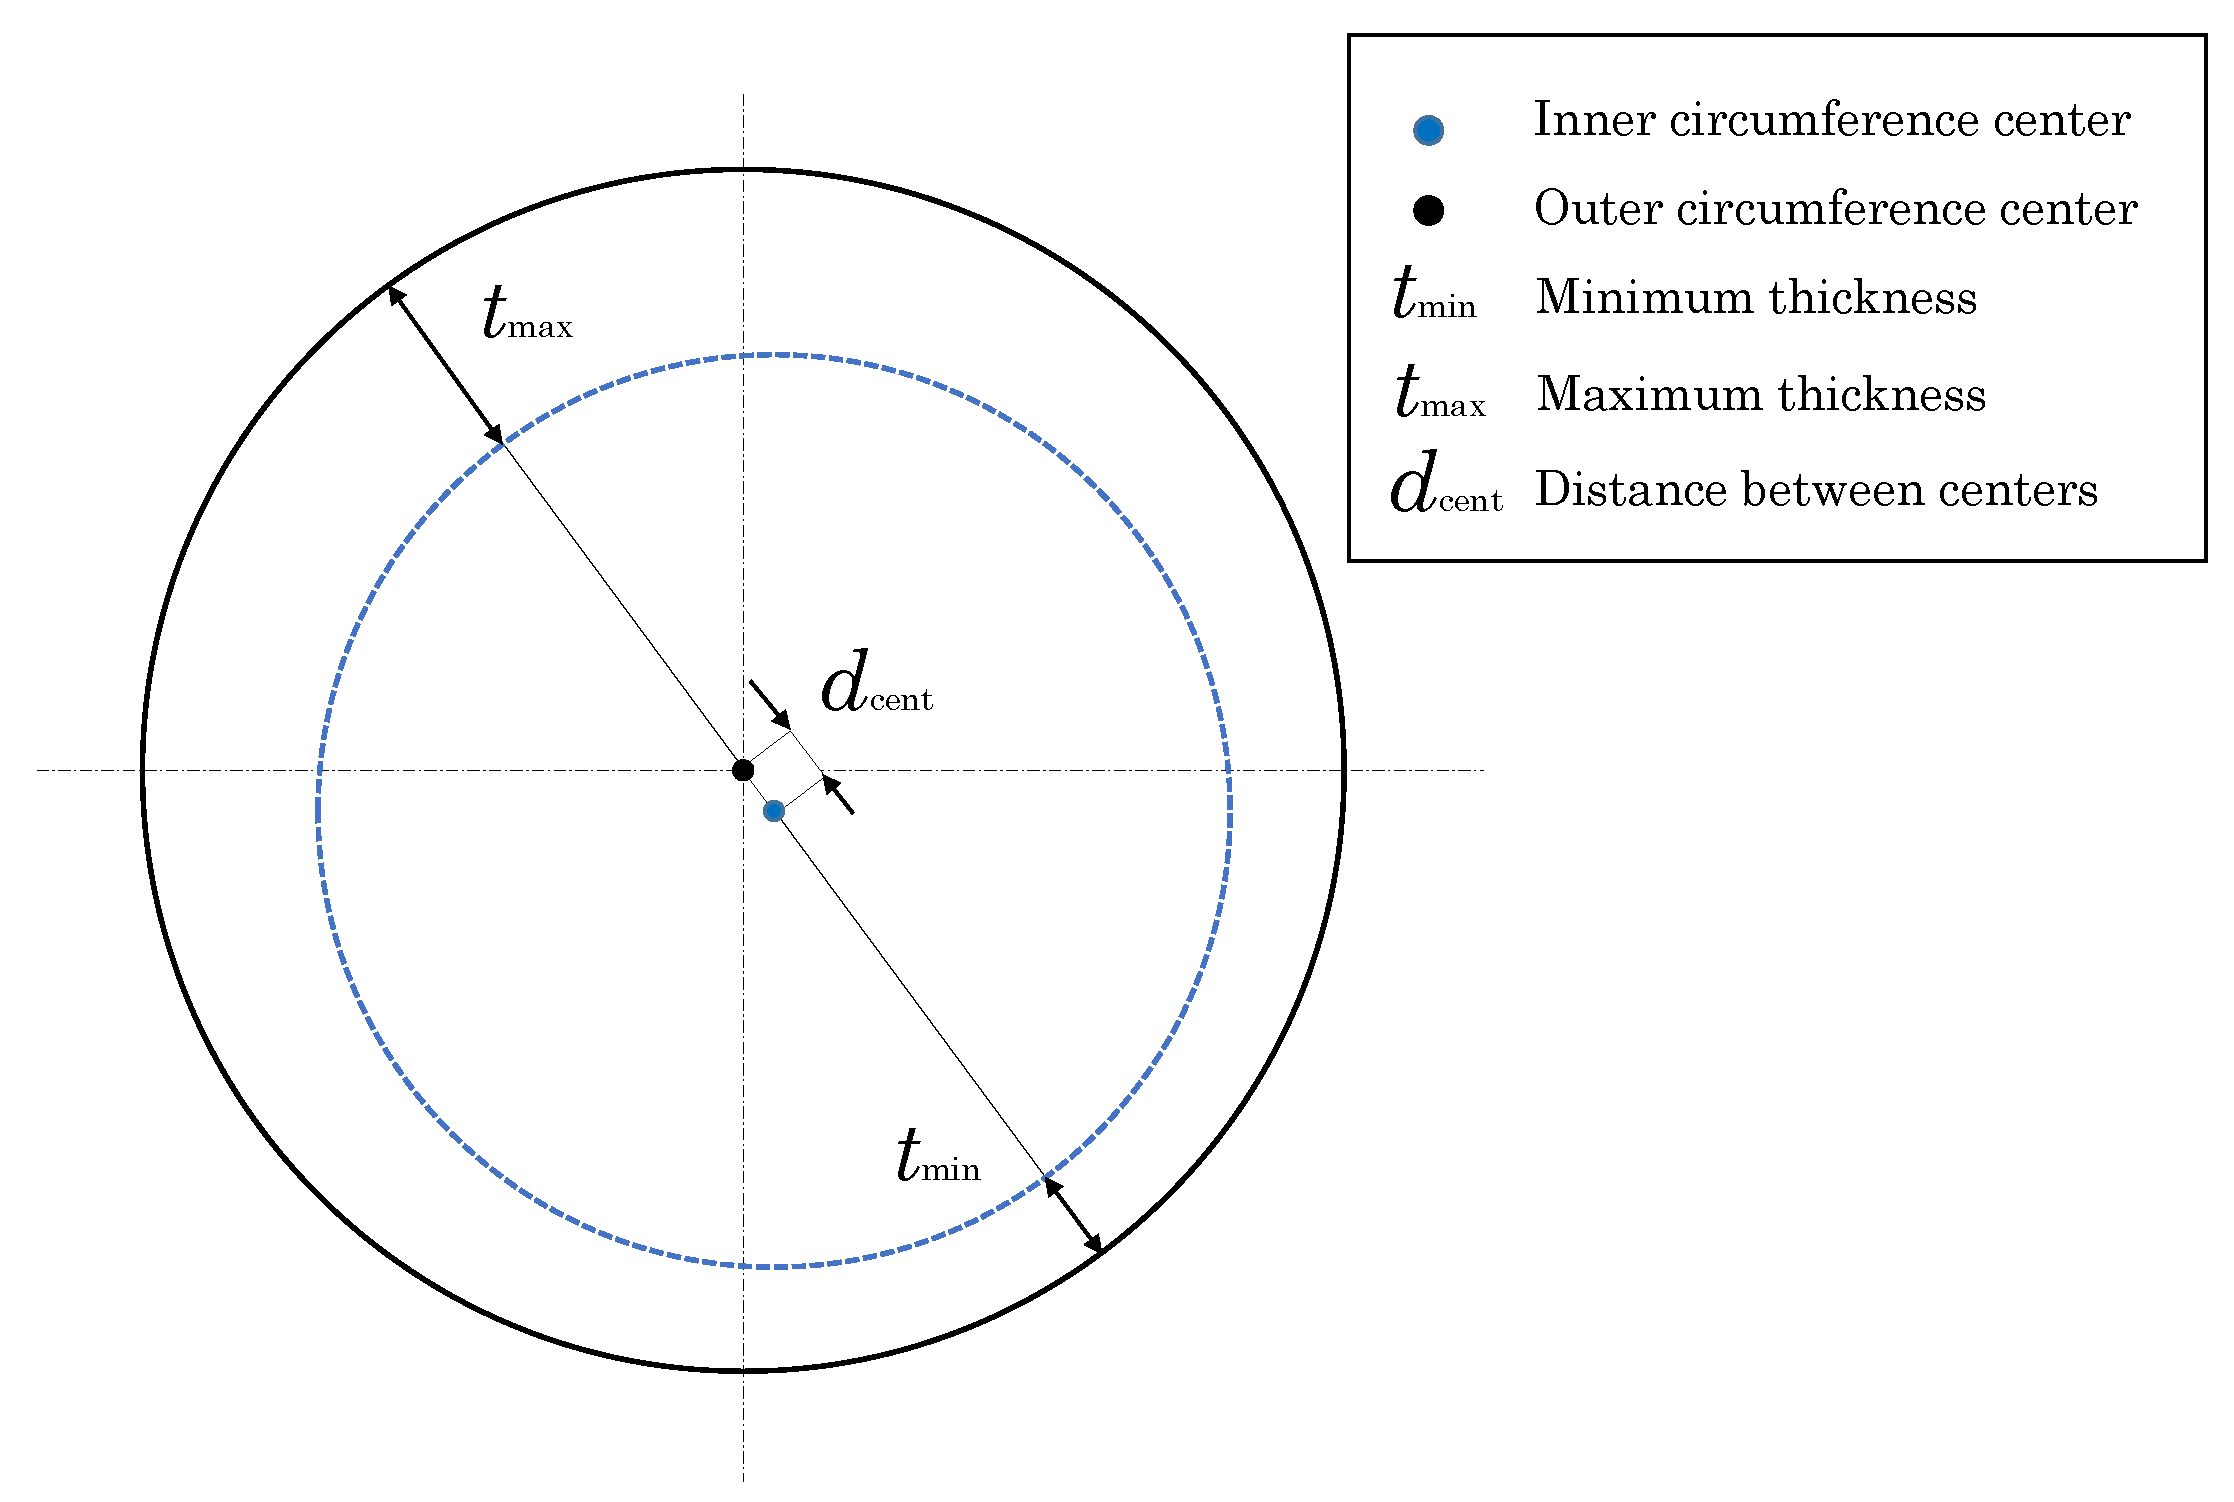
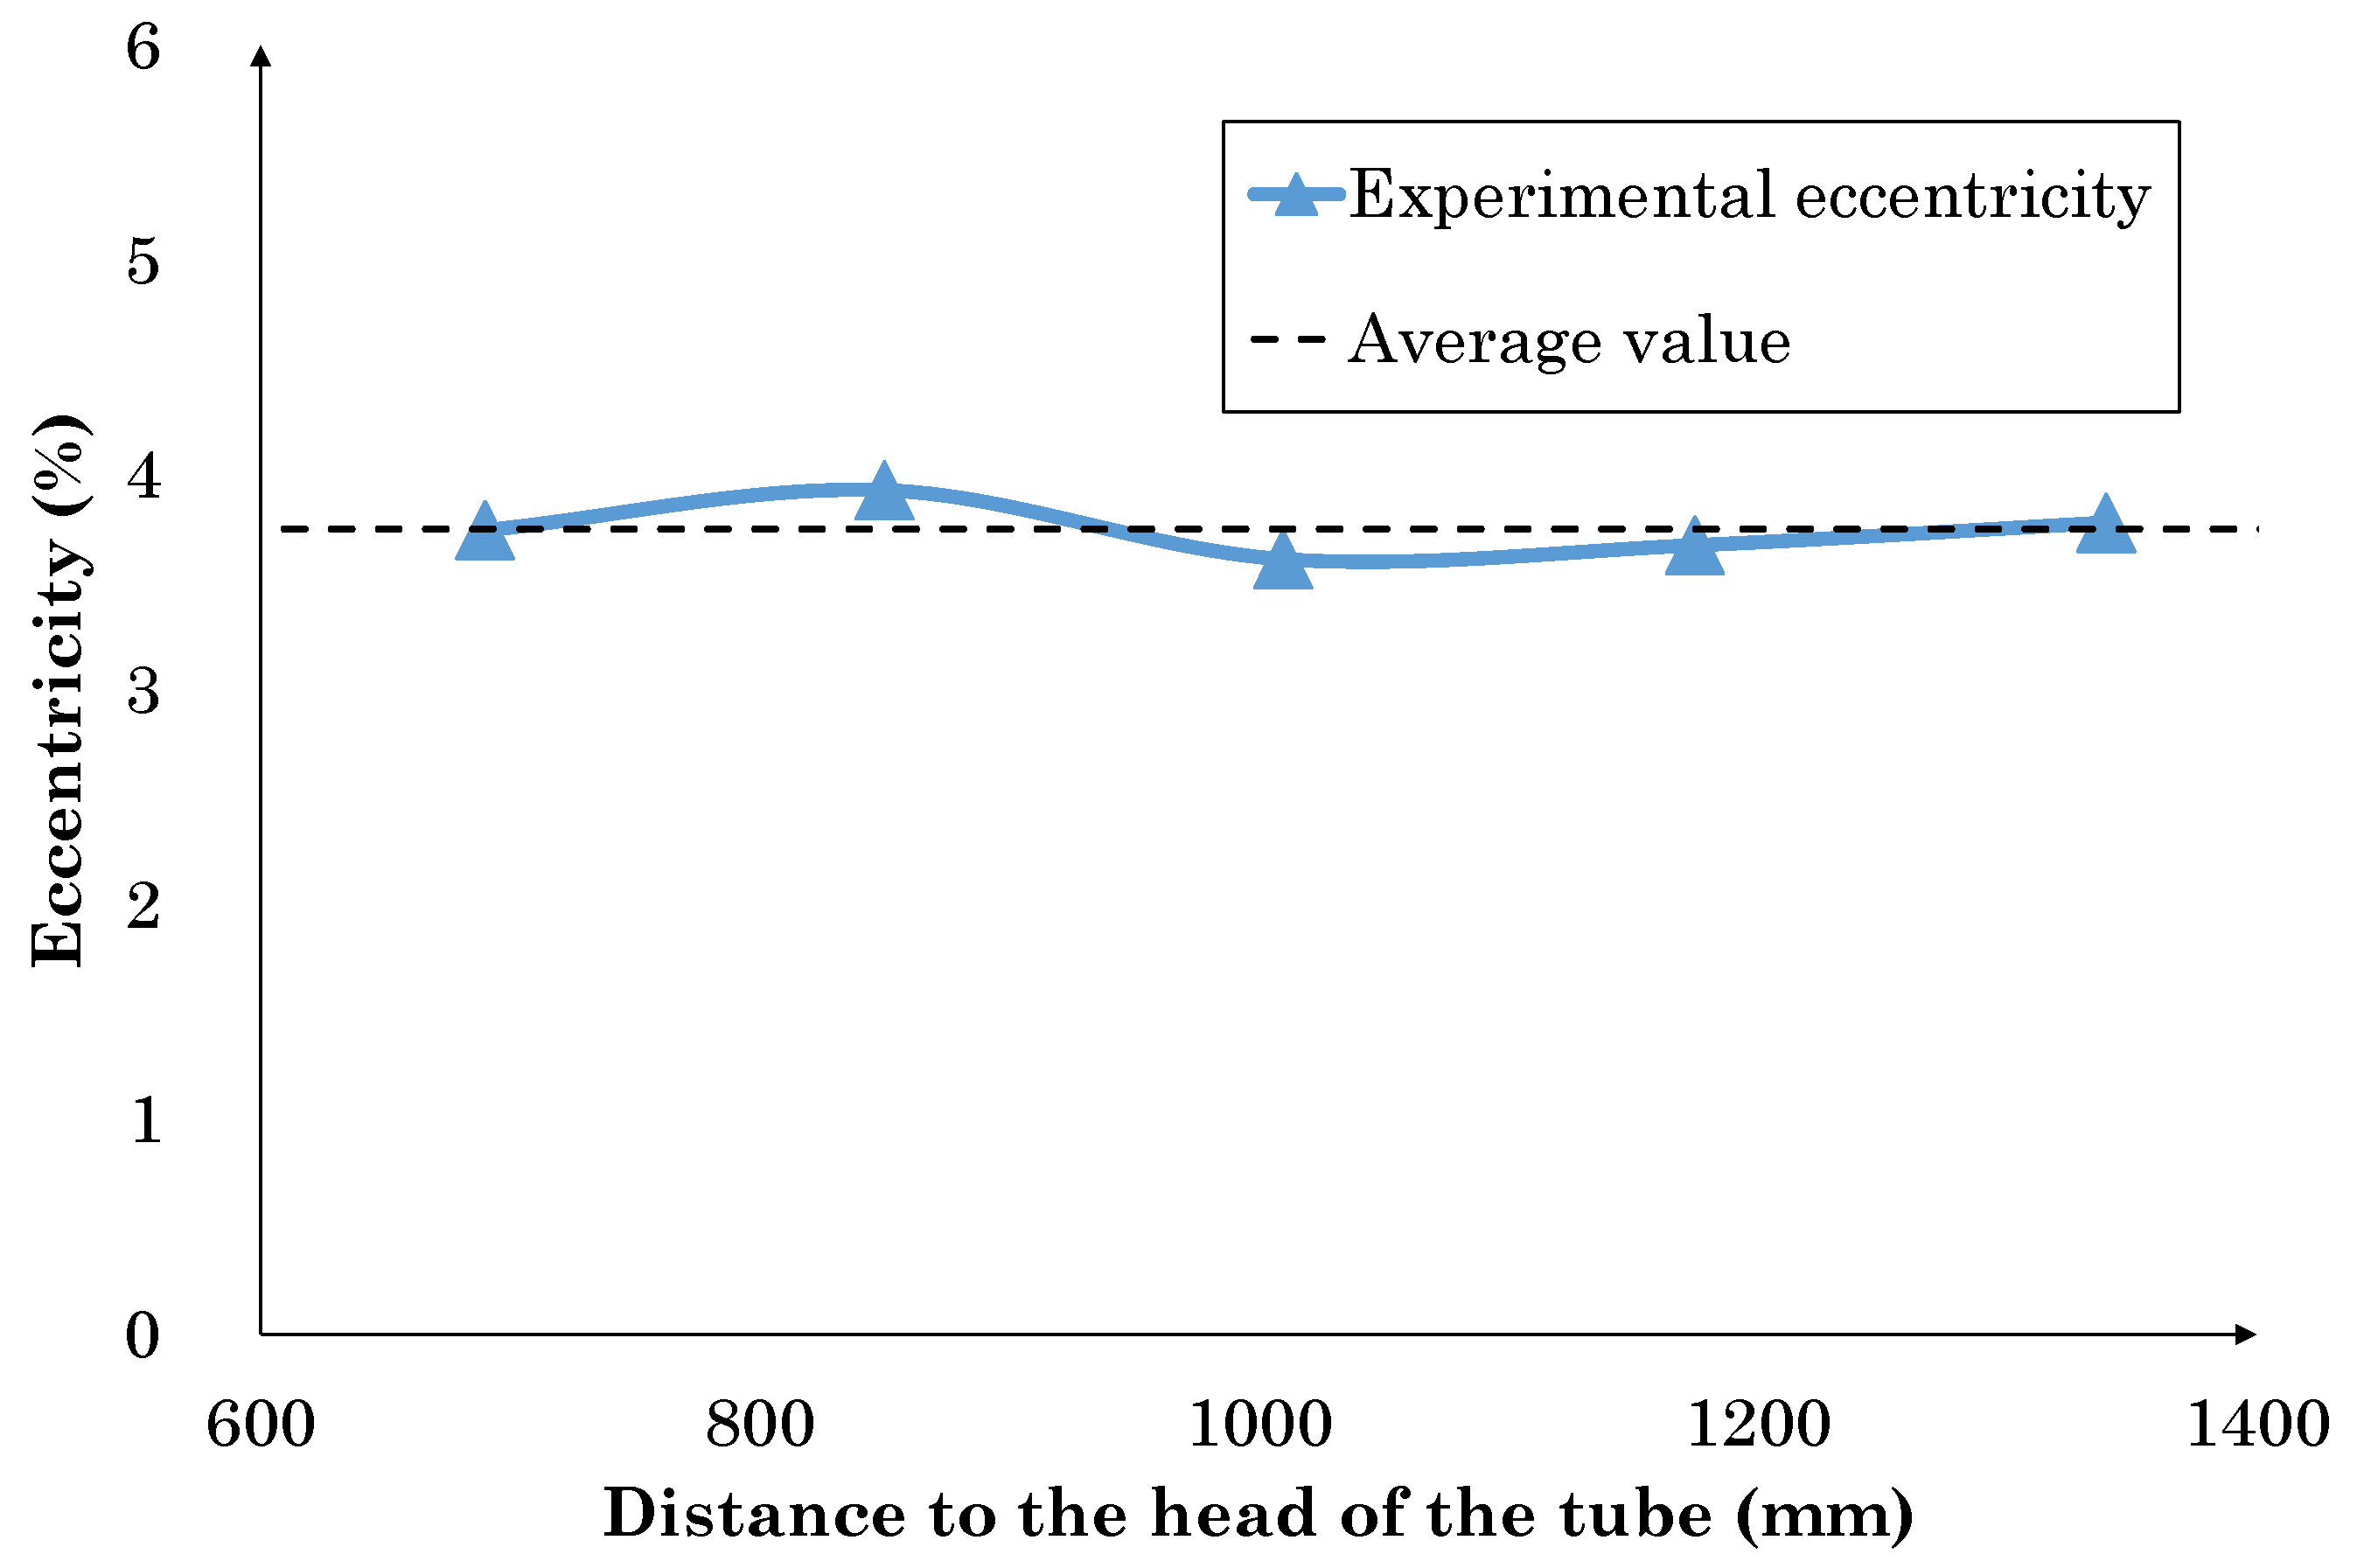
Regarding the wall thickness eccentricity, research efforts were conducted either to study the generation of this imperfection in the RTP process, either to correct it in the subsequent manufacturing stages. Lü et al. [20] associated the origin of the eccentricity on the heterogeneous heating of the billet in the furnace using a FE model. Yamane et al. [21] identified the misalignment of the tools as the main cause of wall thickness eccentricity using FE analysis. Guo et al. [22] developed a method for monitoring the eccentricity occurring on seamless tube piercing. Efforts conducted to correct the eccentricity in the subsequent manufacturing phases are relevant. Foadian et al. [23] proposed an alternative solution for the phase of tube drawing by changing the tilting angle and shifting value, while Jiang et al. [24] studied the reduction of eccentricity in the final manufacturing phase by inducing rotation in the tube.
In conclusion, the reviewed literature puts into evidence that the simulation of the the RTP process is valid for analysing and improving the manufacturing of seamless tubes. The wall thickness eccentricity limits process performance and some efforts have been conducted to analyse its cause. However, still many simplifications are applied to model the process due to its inherent complexity. Some authors point out the importance of strain, especially when analysing detailed geometrical aspects. However, the modelling of wall thickness eccentricity has not been accomplished with a strain validated model.
As a result, in this article the generation of wall thickness eccentricity flaw in the RTP process is analysed by means of a thermo-mechanical FE model, using the software FORGE® [
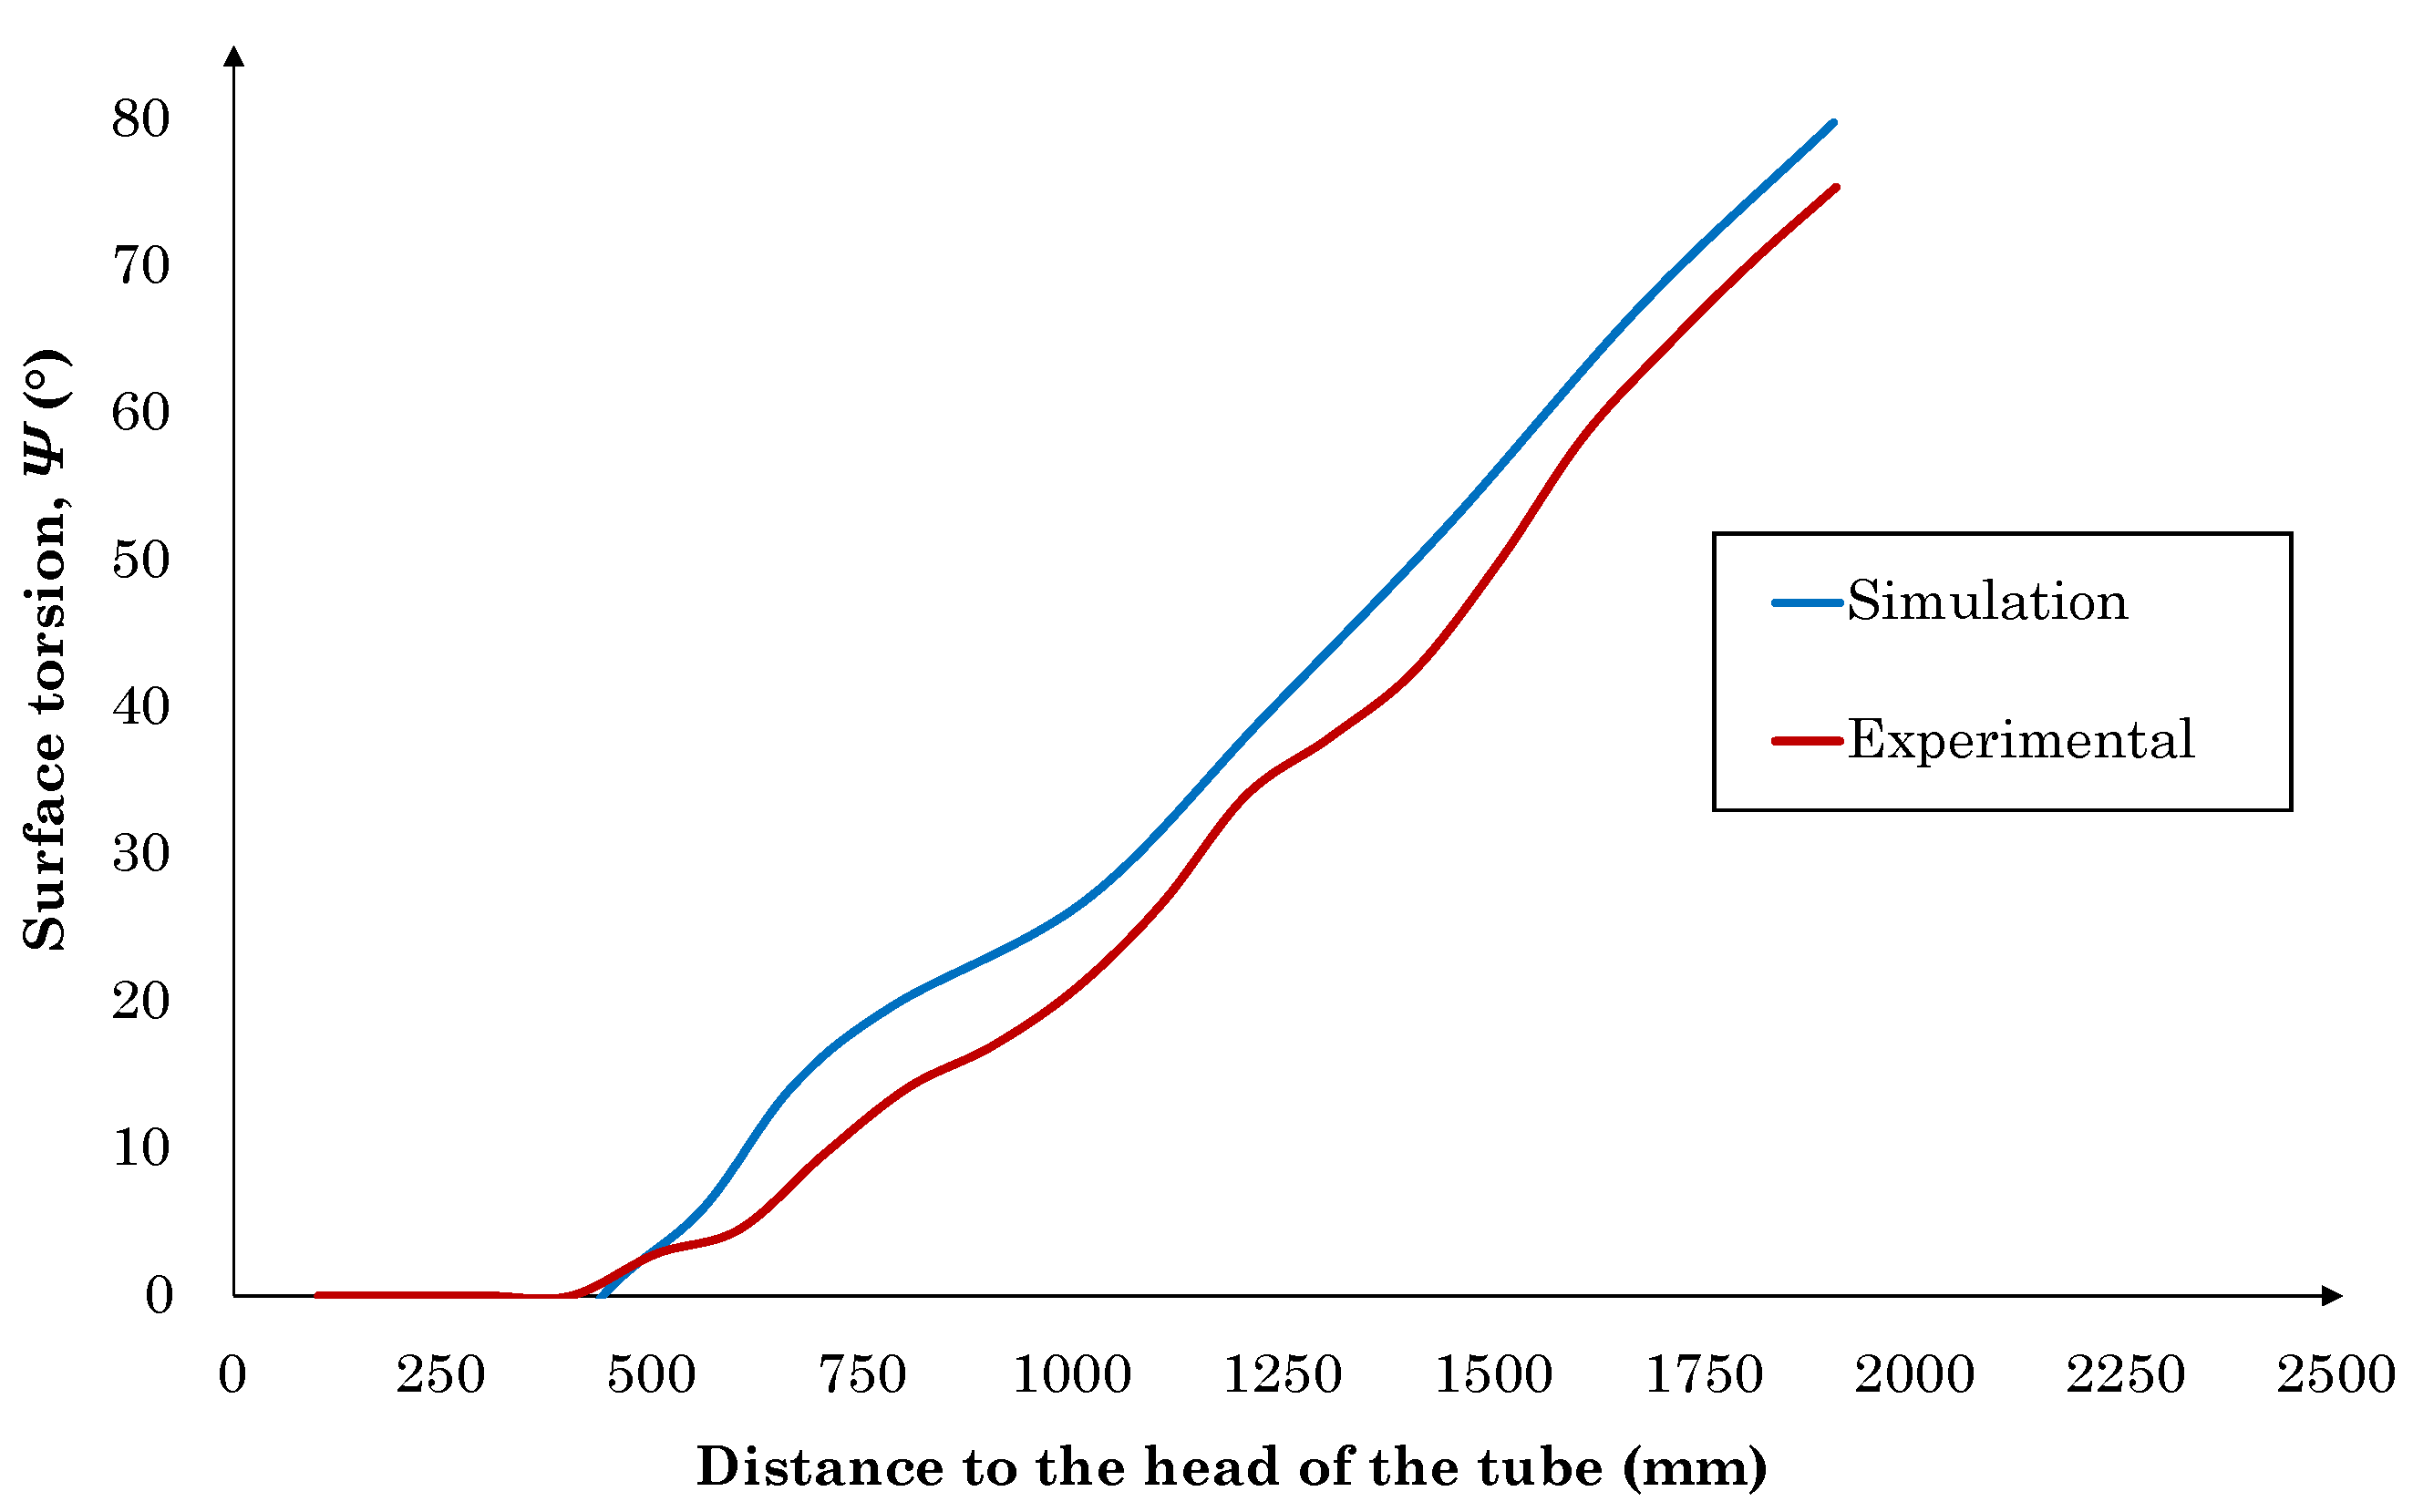
25]. The torsion of the tube linked to the redundant shear strain is assessed. Industrial data is used for the validation, while the soundness of strain is confirmed thanks to the correlation of the tube longitudinal torsion.

2. Methods

2.1. Experimental Methods

The experimental procedures are described in this section. An industrial rotary piercing mill was used to measure, first, a set of operational variables of the RTP process, which are used for the validation of the FE model. These variables are the force exerted by the Diescher discs, the power consumption of the machine and the average velocity of the tube. Then, experimental variables associated to the geometry and deformation of the tube are required for a strain correlated FE model. To this aim, the tube elongation, torsion and wall thickness were measured.

2.1.1. RTP Process Variables

The lateral Diescher discs are powered by means of a hydraulic system. The forces exerted were determinated from the increment of hydraulic pressure during the piercing of the billet, resulting in an average force of 10.36 kN in the steady phase.
The working rolls are driven by electric motors and their electric consumption during the operation was recorded and transformed into power using the motor operating voltage and the power factor. The mechanical performance of the RTP mill, and the electric performance of the motors were considered as 95% and 97% respectively. The average power consumption when the process reaches the steady phase yields 4727 kW.
Moreover, the manufacturing time and the initial length of the tube (1210 mm) were used to identify the average velocity of the tube, yielding 363 mm/s.

2.1.2. Tube Geometry

The length of the tube before and after the RTP operation (2511 mm) was compared, which yields the tube elongation ratio or axial strain ϵ z = 2.08 .
The tube torsion was measured during the RTP operation. This is associated to the redundant shear strain of the material along the piercing axis z as illustrated in Figure 1.
The shear strain γ θ z is given by
γ θ z = u θ z + 1 r u z u θ .
If any cross-section is assumed to rotate as a rigid disc, the second term of the right-hand side of Equation (1) can be neglected. Thus, the shear strain on the outer surface of the tube is given by
γ θ z = ρ o u t d ψ d z ,
where ρ o u t is the outer radius of the tube and d ψ / d z represents the twist angle per unit of length. In order to measure this shear deformation, a mark was made on a billet generatrix before the rotary tube piercing operation. The experimental longitudinal torsion induced in the rotary pierced tube surface is presented in Figure 2.
The twist angle was measured along the tube length every 100 mm. The extreme of the tube, known in the forthcoming as the head of the tube, was set as the reference point. In this way, the experimental result of longitudinal torsion was measured as function of the distance to head of the tube.
The wall thickness was measured in five different sections along the tube, eight equispaced data per section, by means of ultrasonics. The wall thickness eccentricity is calculated in each of the five cross-sections according to
e c ( % ) = t m a x t m i n t a v g 100 ,
where t m a x t m i n represents the distance d c e n t between the centres of the outer and inner circumferences of the cross-section (see Figure 3), and t a v g is the mean value of the eight thickness measured. The mean wall thickness of the tube, computed as the mean of the five t a v g obtained, results in 27.75 mm.
The results of the eccentricity along the tube are shown in Figure 4. The minimum, maximum and average values are 3.93%, 3.61% and 3.75% respectively, from which it can be concluded that this imperfection is fairly uniform along the tube.

2.2. Description of the FE Model

In this section the FE model of the rotary tube piercing mill developed in FORGE® (NxT 2.1, Transvalor S.A., Mougins, France) is presented. First, the rotary piercing mill is described, introducing the elements of the machine, their geometries, positions and kinematics. Then, the mesh of the simulation is provided. Finally, the thermo-mechanical properties of the materials and the initial and boundary conditions of the simulation are given.

2.2.1. RTP Mill Geometry and Kinematics

The architecture of the modelled piercing mill is presented in Figure 5.
The machine counts with two tapered rolls, two lateral Diescher discs, a mandrel and a guide. The mandrel, also known as plug, is placed between the rolls and lateral discs. The guide is positioned coaxially to this element. The billet, which is a round cylinder, enters to the machine through the guide thanks to the action of a thrust bench. The tapered rolls, whose rotation axis is misaligned, β (feed angle), rotate in similar directions forcing the billet forwards and compress it reducing its diameter. The mandrel generates the internal hollow space of the tube and, meanwhile, the lateral Diescher discs rotate in opposite directions, facilitating the advance of the material in the z direction and avoiding ovalisation defects. They give the name to this kind of rotary piercing mill (Diescher mill).
One of the characteristics of the rotary tube piercing process is the generation of a crack in the axis of the billet due to Mannesmann effect [26]. Therefore, in order reproduce this crack, a cavity of 2 cm diameter has been incorporated in the mesh of the billet. This is in agreement with the measures extracted from the crack of a billet, whose perforation was stopped, as illustrated in Figure 6.
The values of the additional geometry and kinematic parameters involved in the simulation of the rotary tube piercing process are listed in Table 1.

2.2.2. Meshing

The mesh of the FE model is described in this section. For those elements modelled as rigid, 2D triangular elements are used, while 3D tetrahedral P1+ linear elements with a bubble node are considered for the deformable ones. The rolls present an element size of 10 mm, the lateral Diescher discs 15 mm, the billet mesh size is 8 mm and the plug is meshed progressively from tetrahedrons of 4 mm in the tip of the plug to 30 mm in the extreme (the resulting mesh is shown in Figure 5).

2.2.3. Thermo-Mechanical Properties of the Materials

The material of the billet is a P91 steel, which was characterised experimentally by means of compression tests, performed at a temperature range of 900–1270 °C and at strain rates in the range of 0.005–10 s−1 [27]. The behaviour was defined as elasto-viscoplastic according to Hansel-Spittel model, given by
σ ¯ ( ϵ ¯ , ϵ ¯ ˙ , T ) = A exp ( m 1 T ) ϵ ¯ m 2 ϵ ¯ ˙ m 3 exp m 4 ϵ ¯ .
In this equation, σ ¯ represents the flow stress in MPa, ϵ ¯ stands for equivalent strain, ϵ ¯ ˙ is the equivalent strain rate in s−1, T is the temperature in degrees Celsius and A, m 1 , m 2 , m 3 and m 4 are the material parameters, whose values are shown in Table 2. The fitted model presents an average absolute relative error of 16.2% and an acceptable correlation with the experimental data (r2 = 0.953).
The thermal expansion of the billet is not considered during the heating and piercing operations, given its high computational cost and low impact on the results. However, the contraction of the tube after the RTP process is simulated to compare the geometry measures under similar conditions.
The plug behaviour is set as perfectly elastic. The thermal and mechanical properties of both materials is provided in Table 3.

2.2.4. Initial Conditions

The billet is heated in a rotary furnace before the RTP process leading to a non-homogeneous temperature distribution in the cross-section of the workpiece. The temperature distribution in the billet volume once it abandons the furnace was set from information supplied by an industrial partner internal report [28]. The cooling of the billet that occurs in the transport between the furnace and the guide of the RTP mill was simulated in order to obtain an accurate initial temperature distribution. The temperature distribution in the billet cross-section and the result of this cooling period in both cross-section and longitudinal direction are shown in Figure 7.
The ambient temperature was 50 °C, the temperature of the dies was set to 50 °C with the exception of the plug, which was set to 500 °C [28].
There is not any initial load in terms of stress or strain in the billet.

2.2.5. Boundary Conditions

The boundary conditions relative to friction in the contacts and the heat transfer through radiation, convection and contact between solids are presented. Regarding friction conditions, Constant shear friction model is used for the simulation of friction between the billet and the other components [13]. The shear stress τ is described by
τ = m K ,
where m is the friction factor and K is the material consistency, which is determined by
K = σ ¯ 3 .
Norton friction model is used for modelling the rolls-billet contact [30], it relates friction to the equivalent stress σ ¯ of the material according to
τ = α K v r e l p f 1 v r e l ,
where v r e l is the relative velocity, p f a coefficient similar to the material strain rate sensitivity index, m 3 , and α the friction coefficient. The friction coefficient values are summarised in Table 4.
The definition of the thermal boundary conditions was based on information found in the literature [31]. However, the information relative to the emissivity of the surface material under similar conditions is limited and thus, it was determined experimentally. To this aim, a thermocouple was placed in the interior of the billet after the heating cycle. Then, the emissivity was fitted as illustrated in Figure 8, yielding 0.5.
The thermal boundary conditions are shown in Table 5.

2.3. Validation

In order to validate the FE model previously described, in this section the simulation results are compared to the experimental data presented in Section 2.1, namely, force exerted by the Diescher discs, power consumption, tube average velocity, elongation ratio, average wall thickness and longitudinal torsion. The FE simulation of the RTP process should reproduce accurately these parameters, specially the longitudinal torsion of the tube, in order to have a strain-correlated simulation.

2.3.1. Validation of the RTP Process Variables

First, the simulated force of one of the lateral Diescher discs is compared to the experimental one in Figure 9. It reproduces the experimental trend, showing an average value of 11.03 kN with a deviation of 6.47%, which is reasonable for an industrial complex manufacturing process like this one.
The result of process power consumption is illustrated in Figure 10, in which the simulated curve shows a tendency similar to the experimental one: in both curves the power increases during 1.1 s from the beginning of the operation until reaching the steady phase of the operation. In this phase, the average power consumption of the simulation is 5121 kW, showing a difference with respect to the experimental result of 8.33%.
Regarding the tube average velocity, the result of the FE model is 358 mm/s, which results in a deviation of 1.38% with respect to the experimental one. The results of forces exerted by the Diescher discs, power consumption and tube average velocity confirm that the simulation is precise regarding these process parameters.

2.3.2. Validation of the Tube Geometry

Concerning the tube elongation ϵ z , the final length of the tube yields 2572 mm. It results in a simulated elongated ratio ϵ z = 2.13 , which leads to a difference of 2.4% with respect to the experimental result given in Section 2.1. Moreover, the average wall thickness along the simulated tube is 27.41 mm, which shows a deviation of 1.23%.
The results of tube elongation and wall thickness confirm that the FE model reproduces accurately the geometry of the pierced tube. However, a previous study suggests that the FE model could reproduce correctly the geometry of the tube, but not the shear strain [30]. In order to validate the tube shear strain, the longitudinal torsion is analysed next.
This parameter determines if the relation existing between the boundary conditions of the rolls and Diescher discs are well established. Hence, if the model reproduces the real tube deformation, it is considered valid for the analysis of wall thickness eccentricity. The simulated results of longitudinal torsion are compared to the experimental ones in Figure 11.
The simulation and experimental results of longitudinal deformation are positive in the rotation direction and present a similar linear trend. The mean slope of the simulated curve results in 54.8°/m showing a difference of 5.18% with the experimental value of 52.1°/m. Summarising, Table 6 gathers the comparison between experimental and simulated results. It can be concluded that the FE model is able to represent this complex industrial process.

3. Results and Discussion

3.1. Tube Torsion

In this section the numerical results of tube torsion are analysed and the cause of this undesired redundant deformation is investigated. The sliding velocity at this contact is illustrated in Figure 12.
The roll is divided into two regions: the initial region where the material is initially grabbed and the secondary region, which starts after the point of minimum separation between the rolls and corresponds to the output region of the piercing mill (coloured in red). The red dots are Lagrangian sensors, linked to the displacement of the material and thus, they represent the deformation of a generatrix of the billet during the rotary tube piercing process.
The tapered shape of the rolls results in a progressive increment of the tangential velocity of the roll as long as the radius is increasing along the contact with the billet. In the inlet region, the relative velocity in the contact ranges between 700–800 mm/s. This value is similar in the transition to the roll secondary region. However, in the secondary region, where the tube exits the piercing mill, the relative velocity decreases to values of 300–500 mm/s. This means that the tangential velocity of the material is faster in the secondary region. In addition, the diameter of the tube is not increased during the RTP process and thus, the angular velocity of the tube is also faster in the secondary region, which leads to the torsion of the tube (see the red dots in Figure 12). This difference in angular velocity of the tube between the initial and secondary region is caused by the effect of Diescher discs as it is explained hereafter.
The Diescher discs contain the lateral expansion of the material while it is pierced and contribute to the material advance in the piercing direction z. However, they also impede the rotating of the tube causing ultimately the longitudinal torsion. This can be appreciated in the absolute velocity distribution of the tube surface illustrated in Figure 13.
The tube advances and rotates providing a helical displacement of the material in the clockwise direction. At the sight of the velocity distribution, the material is accelerated at the contact with the rolls. In the initial region of the roll, the tube rotates at the velocity imposed by the rolls but it is slowed down in the contact with the Dieschers. However, in the secondary region, the material is accelerated in the contact with the rolls but it is not restricted by the Dieschers. This leads to a higher angular velocity, which causes the longitudinal torsion.
After the analysis, it can be stated that the positive longitudinal torsion is produced by the increase of roll tangential velocity in the roll secondary region, where the material rotation is not slowed by the friction with the Diescher discs. This leads the Lagrangian sensors, which initially conformed a generatrix, to be displaced in the circumferential direction of rotation reproducing the longitudinal tube torsion (positive shear strain).
Therefore, it is concluded that the tube shear deformation is strongly related to the friction conditions of the billet with both, Dieschers and rolls. The billet angular and tangential velocity is modified depending on these contacts and thus, it can be understood the importance of this parameter for model validation.

3.2. Wall Thickness Eccentricity

In this section, the results of tube wall thickness eccentricity are presented and the causes that lead to the development of this imperfection are analysed and discussed. The proposed variables for this analysis are the temperature distribution in the section of the billet and the plug deformation. In order to discern how each of them contributes to wall thickness eccentricity, three simulations have been carried out according to Table 7.
In the Base Simulation, which has already been validated and used for the analysis of the tube torsion, the temperature is unevenly distributed in the cross-section of the billet (see Figure 7) and the plug is set as elastic (see Section 2.2). In Simulation 2, the plug is set as rigid to assess the impact of the uneven temperature distribution on the eccentricity in the wall thickness. Finally, in Simulation 3, the plug is set as elastic but the temperature distribution in the section of the tube is homogeneous. The wall thickness eccentricity results of the three simulations and the experimental value are given in Figure 14.
In this figure, it can be pointed out that the Base simulation presents a wall thickness eccentricity that exceeds the experimental value of 3.75%. Simulation 2 shows a wall thickness eccentricity of 0.86%. Therefore, it can be concluded that the correction of the thermal gradient in the billet cross-section reduces drastically this imperfection (from 5.44% to 0.86%).
Also, it can be concluded that the same occurs when the plug is modelled as a rigid element. The result of Simulation 3 yields an average wall thickness eccentricity of 0.3%. Therefore, the defect is suppressed in this case despite of the severe thermal gradient existing in the tube cross-section.
According to the literature reviewed, there is not unanimity with respect to the causes of eccentricity in the tube wall thickness. However, the uneven heating of the billet and the misalignment of the tools are highlighted as the most probable reasons for the occurrence of this imperfection. Nevertheless, the results of the Base simulation provide evidence that wall thickness eccentricity is developed with all the tools perfectly positioned. In order to further analyse the cause of wall thickness eccentricity, a sensor is placed in the tip of the plug. The position of this sensor in the cross-section (xy coordinates) is illustrated at four different times during the steady phase of the RTP manufacturing process in Figure 15.
Figure 15 shows that the tip of the plug is displaced following the region where the material is hotter, this is to say, where the material is softer. First, in order to assess if that displacement is coupled to the soft region of the material, the frequency of the vertical and lateral displacements of the tip of the plug with time are compared to the rotation of the billet. The billet presents a rotation frequency of 8.24 Hz. The curves of both vertical and lateral displacements with time result in a similar period of T = 0.121 s, but different amplitudes. Hence, the displacement of the tip of the plug results in an ellipse with a rotation frequency of 8.26 Hz. Accordingly, the displacement of the plug and the rotation of the material presents similar frequency, which confirms the coupling between the soft material region and plug position.
Therefore, it can be concluded that the development of wall thickness eccentricity in seamless tubes is inherent to the RTP mill mechanics and linked to a combined effect between the elastic deformation of the plug and the uneven heating of the billet. During the rotary piercing process, the temperature of the material is not evenly distributed and thus, forces exerted on the plug are not balanced. Hence, the plug is deformed towards the region where the material presents the highest temperature (softer), which leads to the generation of this imperfection in the wall of the tube.
The position of the tip of the plug in the three considered simulations, during the steady phase of the RTP process, is illustrated in Figure 16.
On the one hand, Simulation 2 does not provide relevant information because the plug is set as rigid. On the other hand, important differences are found between the Base simulation and Simulation 3. In both cases, the displacement of the tip of the plug describes a similar distribution. However, the amplitude of the displacements is higher in the Base simulation. This observation indicates that the non-homogeneous distribution of temperature in the billet cross-section increases the deformation of the plug and thus, it is a necessary condition for the development of eccentricity in the tube wall thickness (see Figure 14).
In short, it has been put into evidence that the eccentricity flaw can be even developed with all the tools perfectly positioned. In addition, results confirm the coupling between the rotation of the soft material region and the plug deformation. The present study supports that the reduction of the thermal gradient in the billet cross-section or the increment in the plug stiffness independently leads to the reduction of the wall thickness eccentricity.

4. Conclusions

In this article, the wall thickness eccentricity developed in seamless tubes manufactured by means of rotary piercing mills has been addressed. To this aim, a strain correlated FE model has been proposed using the longitudinal torsion of the tube. The causes of the eccentricity in seamless tubes and also the tube torsion have been assessed. The following conclusions have been drawn from this study:
  • The use of experimental measures of tube deformation is required for the correct validation of the FE model of the RTP process. The tube longitudinal torsion is found to be an accurate deformation parameter to correlate the simulation results.
  • The positive tube longitudinal torsion is produced by the higher angular velocity of the tube at the roll secondary region. The friction of the tube with the lateral Diescher discs reduces the tube angular velocity in the initial roll region, while in the secondary region the rotation is not restricted and thus, the angular velocity increases.
  • The tube wall thickness eccentricity flaw may be developed even if all the tools are properly aligned. This finding seeds light on theories that identified the misalignment of the piercing mill tools as the only reason for this imperfection.
  • The uneven temperature distribution at the billet cross-section and the bending deformation of the plug are identified as the major causes of the wall thickness eccentricity. The individual reduction of one of them leads to a drastic reduction of this tube conformation imperfection.
  • The plug is deformed during the RTP process towards the material region that presents a higher temperature in the cross-section. This leads to an elliptical movement coupled to the billet rotation.

Author Contributions

Conceptualization, A.M.-M., E.G. and F.C.; methodology, A.M.-M. and J.B.; software, A.M.-M.; validation, A.M.-M., E.G. and J.B.; formal analysis, A.M.-M.; investigation, A.M.-M.; resources, E.G. and J.B.; writing—original draft preparation, A.M.-M.; writing—review and editing, E.G., J.B. and F.C.; supervision, E.G. and F.C.; funding acquisition, F.C. All authors have read and agreed to the published version of the manuscript.

Funding

This research was conducted under project No. PUE-2019-07, financed by the Department of Education, Basque Government.

Acknowledgments

The authors gratefully acknowledge the financial support of the Basque Government and Tubos Reunidos Industrial for providing relevant experimental data of the rotary tube piercing manufacturing process.

Conflicts of Interest

The authors declare no conflict of interest. The funders had no role in the design of the study; in the collection, analyses, or interpretation of data; in the writing of the manuscript, or in the decision to publish the results.

References

  1. Hashmi, M.S.J. Aspects of tube and pipe manufacturing processes: Meter to nanometer diameter. J. Mater. Process. Technol. 2006, 179, 5–10. [Google Scholar] [CrossRef]
  2. Cho, J.M.; Kim, B.S.; Moon, H.K.; Lee, M.C.; Joun, M.S. Comparative study on Mannesmann roll piercing processes between Diescher’s guiding disk and Stiefel’s guiding shoe. AIP Conf. Proc. 2013, 1532, 843–849. [Google Scholar] [CrossRef]
  3. Wang, F.J.; Shuang, Y.H.; Hu, J.H.; Wang, Q.H.; Sun, J.C. Explorative study of tandem skew rolling process for producing seamless steel tubes. J. Mater. Process. Technol. 2014, 214, 1597–1604. [Google Scholar] [CrossRef]
  4. Pater, Z.; Kazanecki, J.; Bartnicki, J. Three dimensional thermo-mechanical simulation of the tube forming process in Diescher’s mill. J. Mater. Process. Technol. 2006, 177, 167–170. [Google Scholar] [CrossRef]
  5. Ceretti, E.; Giardini, C.; Brisotto, F. 2D Simulation and Validation of Rotary Tube Piercing Process. AIP Conf. Proc. 2004, 712, 1154–1159. [Google Scholar] [CrossRef]
  6. Mori, K.; Yoshimura, H.; Osakada, K. Simplified three-dimensional simulation of rotary piercing of seamless pipe by rigid–plastic finite-element method. J. Mater. Process. Technol. 1998, 80–81, 700–706. [Google Scholar] [CrossRef]
  7. Komori, K.; Suzuki, M. Simulation of deformation and temperature in press roll piercing. J. Mater. Process. Technol. 2005, 169, 249–257. [Google Scholar] [CrossRef]
  8. Lu, L.; Wang, Z.X.; Wang, F.Z.; Zhu, G.Y.; Zhang, X.X. Simulation of tube forming process in mannesmann mill. J. Shanghai Jiaotong Univ. Sci. 2011, 16, 281–285. [Google Scholar] [CrossRef]
  9. Lu, L.; Wang, Z.X.; Wang, F.Z. Research of Force in Piercing Process by FEM Simulation. Adv. Mater. Res. 2012, 482–484, 62–65. [Google Scholar]
  10. Lu, L.; Wang, Z.X. Force Research of Piercing Process in Diescher’s Mill with Mechanical Properties by FEM Simulation. Adv. Mater. Res. 2013, 648, 174–177. [Google Scholar] [CrossRef]
  11. Lu, L.; Cui, H.X. Temperature Analysis of Piercing Process Based on Material Properties in Diescher’s Mill with Finite Element Method. Adv. Mater. Res. 2014, 830, 93–96. [Google Scholar] [CrossRef]
  12. Pater, Z.; Bartnicki, J.; Kazanecki, J. 3D finite elements method (FEM) Analysis of basic process parameters in rotary piercing mill. Metalurgija 2012, 51, 501–504. [Google Scholar]
  13. Pater, Z.; Kazanecki, J. Complex numerical analysis of the tube forming process using Diescher mill. Arch. Metall. Mater. 2013, 58, 717–724. [Google Scholar] [CrossRef]
  14. Murillo-Marrodán, A.; García, E.; Cortés, F. A Study of Friction Model Performance in a Skew Rolling Process Numerical Simulation. Int. J. Simul. Model. 2018, 17, 569–582. [Google Scholar] [CrossRef]
  15. Mao, F.; Wang, F.; Shuang, Y.; Hu, J.; Chen, J. Deformation Behavior and Experiments on a Light Alloy Seamless Tube via a Tandem Skew Rolling Process. Metals 2020, 10, 59. [Google Scholar] [CrossRef] [Green Version]
  16. Hayashi, C.; Yamakawa, T. Comparison of double and single piercing process in seamless steel tube manufacture. J. Soc. Mater. Sci. Jpn. 1997, 46, 143–150. [Google Scholar] [CrossRef] [Green Version]
  17. Hayashi, C.; Yamakawa, T. Influences of Piercing Ratio, Expansion Ratio, Feed, Cross and Skew Angles on Available Piercing Size Range in Rotary Piercing Process. ISIJ Int. 1998, 38, 1255–1261. [Google Scholar] [CrossRef]
  18. Hayashi, C.; Akiyama, M.; Yamakawa, T. Advancements in cone-type rotary piercing technology. J. Manuf. Sci. Eng. 1999, 121, 313–320. [Google Scholar] [CrossRef]
  19. Komori, K.; Mizuno, K. Study on plastic deformation in cone-type rotary piercing process using model piercing mill for modeling clay. J. Mater. Process. Technol. 2009, 209, 4994–5001. [Google Scholar] [CrossRef]
  20. Lv, Q.G.; Peng, L.Z.; Zhu, J.Q. Study on Wall Thickness Eccentricity of Seamless Steel Tube. Adv. Mater. Res. 2011, 148–149, 1071–1074. [Google Scholar] [CrossRef]
  21. Yamane, K.; Shimoda, K.; Yamane, A. Three-Dimensional Numerical Analysis of Rotary Piercing Process. In Proceedings of the XIV International Conference on Computational Plasticity: Fundamentals and Applications (COMPLAS 2017), Barcelona, Spain, 5–7 September 2017. [Google Scholar]
  22. Guo, W.; Chen, R.; Jin, J.J. Online eccentricity monitoring of seamless tubes in cross-roll piercing mill. J. Manuf. Sci. Eng. 2015, 137, 021007. [Google Scholar] [CrossRef] [Green Version]
  23. Foadian, F.; Carradó, A.; Palkowski, H. Precision tube production: Influencing the eccentricity and residual stresses by tilting and shifting. J. Mater. Process. Technol. 2015, 222, 155–162. [Google Scholar] [CrossRef]
  24. Jiang, Y.; Tang, H.; Zhang, X. Rotation mechanics and numerical simulation of hot rolling process under asymmetric rolls. Int. J. Mech. Sci. 2019, 151, 785–796. [Google Scholar] [CrossRef]
  25. Transvalor FORGE®. Library Catalog. Available online: www.transvalor.com (accessed on 30 June 2020).
  26. Pater, Z.; Tomczak, J.; Bulzak, T.; Wójcik, U.; Walczuk-Gągała, P. Rotational Compression of Cylindrical Specimen as a New Calibrating Test for Damage Criteria. Materials 2020, 13, 740. [Google Scholar] [CrossRef] [Green Version]
  27. Murillo-Marrodán, A.; Puchi-Cabrera, E.S.; García, E.; Dubar, M.; Cortés, F.; Dubar, L. An Incremental Physically-Based Model of P91 Steel Flow Behaviour for the Numerical Analysis of Hot-Working Processes. Metals 2018, 8, 269. [Google Scholar] [CrossRef] [Green Version]
  28. Barco, J. Rotary Furnace Research and Technology; TRI: Amurrio, Spain, 2015. [Google Scholar]
  29. Yaghi, A.H.; Hyde, T.H.; Becker, A.A.; Williams, J.A.; Sun, W. Residual stress simulation in welded sections of P91 pipes. J. Mater. Process. Technol. 2005, 167, 480–487. [Google Scholar] [CrossRef]
  30. Murillo-Marrodán, A.; García, E.; Cortés, F. Modelling of the cone-type rotary piercing process and analysis of the seamless tube longitudinal shear strain using industrial data. AIP Conf. Proc. 2019, 2113, 040003-1–041003-6. [Google Scholar] [CrossRef]
  31. Ghiotti, A.; Fanini, S.; Bruschi, S.; Bariani, P.F. Modelling of the Mannesmann effect. CIRP Ann. 2009, 58, 255–258. [Google Scholar] [CrossRef]
Figure 1. Measure of the shear strain component of deformation.
Metals 10 01045 g001
Figure 2. Longitudinal tube torsion: (a) view of the head of the tube and (b) view of the tail of the tube.
Metals 10 01045 g002
Figure 3. Representation of the wall thickness eccentricity imperfection in a section of a tube.
Metals 10 01045 g003
Figure 4. Experimental measure of wall thickness eccentricity.
Metals 10 01045 g004
Figure 5. Layout of the rotary tube piercing mill (one of the Diescher discs is not represented).
Metals 10 01045 g005
Figure 6. Section of a tube after 0.5 s of piercing operation.
Metals 10 01045 g006
Figure 7. Temperature of the billet: (a) cross-section before, (b) cross-section after the cooling period and (c) longitudinal distribution after the cooling period.
Metals 10 01045 g007
Figure 8. Fitting of the emissivity of the surface of the billet.
Metals 10 01045 g008
Figure 9. Comparison of the forces exerted by Diescher discs.
Metals 10 01045 g009
Figure 10. Comparison of power consumption of the rotary piercing machine.
Metals 10 01045 g010
Figure 11. Comparison of the longitudinal torsion of the tube.
Metals 10 01045 g011
Figure 12. Relative velocity in the roll-billet interface.
Metals 10 01045 g012
Figure 13. Absolute velocity distribution.
Metals 10 01045 g013
Figure 14. Numerical and experimental wall thickness eccentricity results of the three simulations.
Metals 10 01045 g014
Figure 15. Displacement of the tip of the plug to the softer region of the pierced material, the coordinates of the sensor in the xy plane is given.
Metals 10 01045 g015
Figure 16. Position of the tip of the plug during the RTP process.
Metals 10 01045 g016
Table 1. Parameters of the rotary piercing mill FE model.
ParametersMagnitude
Cross Angle, δ
Feed Angle, β 10°
Roll Diameter900 mm
Roll Angular velocity111 rpm
Diescher Diameter1700 mm
Diescher Angular Velocity24 rpm
Table 2. Hansel-Spittel constitutive model parameter values.
A m 1 m 2 m 3 m 4
12,582−0.00420.11630.1116−0.0007
Table 3. Thermal and mechanical material properties, data from [28,29].
Material PropertyBilletPlug
Density7450 kg/m37850 kg/m3
Poisson’s Ratio0.30.3
Young Modulus163 GPa190 GPa
Specific Heat708 J/kgK778 J/kgK
Thermal Conductivity41 W/mK35.5 W/mK
Thermal Expansion 1 × 10 5 °C−1-
Table 4. Coefficients of the friction models, data from [30].
DieFriction CoefficientMagnitude
Rolls α 0.27
Rolls p f 0.11
Dieschersm0.20
Plugm0.10
Table 5. Thermal boundary conditions.
Thermal Boundary ConditionsMagnitude
Emissivity0.5 (-)
Convection Heat Transfer Coefficient10 W/m2K [31]
Contact Conductance10,000 W/m2K [31]
Table 6. Simulation results and their difference to the experimental values.
ResultSimulationExperimentDifference (%)
Force of Dieschers11.03 kN10.36 kN6.47
Power of the Rolls5121 kW4727 kW8.33
Average Velocity of the Tube358 mm/s363 mm/s1.38
Elongation Ratio, ϵ z 2.132.082.40
Average Wall Thickness of the Tube27.41 mm27.75 mm1.23
Slope of the Tube Torsion54.8°/m52.1°/m5.18
Table 7. Wall thickness eccentricity FE models.
SimulationTemperature DistributionPlug Behavior
BaseUnevenElastic
2UnevenRigid
3HomogeneousElastic

