Article

Numerical Verification of Tests on the Influence of the Imposed Thermal Cycles on the Structure and Properties of the S700MC Heat-Affected Zone

Department of Welding Engineering, Silesian University of Technology, Konarskiego 18A, 44-100 Gliwice, Poland
*
Author to whom correspondence should be addressed.
Metals 2020, 10(7), 974; https://doi.org/10.3390/met10070974
Submission received: 30 June 2020 / Revised: 16 July 2020 / Accepted: 18 July 2020 / Published: 20 July 2020
(This article belongs to the Special Issue Fusion Welding)

Abstract

:
The article presents the results of studies on the influence of simulated thermal cycles parameters on the structure and properties of the heat-affected zone (HAZ) of thermo-mechanically rolled S700MC steel. For this purpose, resistance heating tests of the tested samples were carried out to determine the effect of maximum temperatures of the imposed thermal cycles with different maximum temperatures at a constant cooling time in the temperature range between 800 and 500 °C (t8/5) and to study the influence of changes of this time on the structure and hardness as well as the tensile strength, elongation and toughness of the simulated HAZ in S700MC steel. The results of the tests, were supported by the results of finite element method (FEM) analyses in the VisualWeld (SYSWELD Code) software of the ESI Group. Selected heat distributions during heating, distributions of individual metallurgical phases and hardness were compared with results from real tests. On the basis of the results presented, an attempt was made to explain the decrease in mechanical and plastic properties in the HAZ area caused by the influence of the welding heat cycle.

1. Introduction

Modern, dynamically developing industry is looking for new construction materials that can meet a set criteria regarding strength, mass, aesthetics and price. The expansion of new low-density materials based on aluminium, magnesium, titanium as well as an increasing share in the market of composite polymer materials has become a significant threat to the production of smelters. Steel mills have had to show significant activity in recent decades to meet market demands. The use of modern metallurgical technologies and metallurgical processing, as well as a new look at the significance and role of alloying elements used in steels, allowed the production of various steel groups with a wide range of mechanical and plastic properties [1,2,3,4,5]. The development of new grades of steel, especially high-strength low-alloy (HSLA) with a ferritic, ferritic–pearlitic, ferritic–bainitic, bainitic or tempered martensite structure, allowed for a significant reduction in the mass of elements and structures manufactured from them. The reduction of sheet thickness produced in thermo-mechanical rolling processes (TMCP) for the needs of the automotive, shipbuilding, oil industry while maintaining all existing operational parameters allows to achieve significant savings resulting from lower expenditure on material processing and lower transport costs. Alternative materials with respect to modern steel grades still have many limitations associated with high manufacturing costs, limited resistance to elevated temperatures and difficult joining processes [5,6,7,8,9,10].
These steels are also used in civil engineering. They have proved particularly useful in the production of the largest suspension bridges in the world, reducing the number of main supports and improving welding efficiency [11,12,13,14]. These steels are particularly suitable for the construction of buildings located in areas threatened by seismic shocks. Due to the high strength, resistance to dynamic loads and maintenance of these properties in chemically active environments, steels obtained in the thermomechanical rolling processes are perfectly suited for the construction of pipelines in hydroelectric plants or for the transport of oil from the bottom of the sea [14,15,16,17].
Modern steels manufactured by thermomechanical treatment must meet not only the strength requirements imposed on them, but also environmental and social requirements. Increasing the strength properties in these steels are associated with the use of alloy micro-additives, such as Nb, V, Ti, with a total content not exceeding 0.22% which cause grain fragmentation and allow precipitation processes to occur. These micro-additions are introduced to steels produced by conventional technology, but their fully effective use can only be achieved by applying thermoplastic treatment associated with the controlled course of hot rolling and subsequent controlled cooling of sheets to room temperature [18,19,20,21,22,23,24,25,26].
The influence of alloying micro-additives depends on their condition during hot plastic deformation. Micro-additives dissolved in a solid solution increase the recrystallization temperature of austenite, and by segregating grain boundaries, reduce their mobility. In contrast, micro-additions, emitted in the form of dispersive particles of MX-type interstitial phases on dislocations during plastic deformation, reduce the recovery rate and delay the course of static recrystallization and limit the growth of recrystallized austenite grains. Dispersive particles of secondary phases, inhibiting the movement of austenite grain boundaries, create the possibility of producing products with a fine-grained structure and the precipitation of steel hardening at lower temperatures in ferrite [17,18,19,20,21,22,23,24,25,26].
At present, fine-grained low-alloy structural steels obtained by conventional rolling or thermo-mechanically processed steels with a yield strength of up to 460 MPa and high-strength steels obtained after heat treatment are usually used in welded constructions. Heat-treated steels with a yield strength of 700 MPa and above have a carbon equivalent of 0.6% which makes welding difficult. Alloy components of the recommended filler material for these steels can adversely affect the plastic properties of the welded joint. In addition, pre-heating is required when welding such steels, which increases the cost of producing welded structures. The competition for this type of steel is thermo-mechanically processed steel with a high yield strength, which show a much lower real carbon equivalent (determined on the basis of chemical composition analysis) [27,28,29,30,31].
It should also be noted that the welding heat cycle significantly differs from the classic thermomechanical cycle, i.e., it is much sharper. Under the conditions of the thermal welding cycle, the carbide and nitride precipitates partially dissolve in the austenite, and the rapid cooling causes supersaturation of the α solution with micro-additives, carbon and nitrogen and/or their uncontrolled separation. To be able to influence the properties and structure of thermo-mechanically processed steel joints with high yield strength, it is necessary to carry out many tests to explain the impact of the welding process, welding parameters and welding consumables on the chemical composition, structure and precipitation phenomena (MX phases, aging), occurring in the area of the crystallized weld pool and HAZ. Understanding the precipitation processes that can occur in welds and HAZ and factors affecting them will definitely expand the possibility of using these steels for welded structures [19,20,21,22,23].
The aforementioned “complexity” of modern construction materials and the even shorter product life cycle among a successive model or solution changes mean that classic prototyping is both unprofitable and often unfeasible due to the time frame and rapidly increasing complexity of today’s products. Several years ago, 3D engineering software opened new opportunities for the engineering use due to the availability of appropriate computing power for computers. The orientation of modern software on the indicated technological processes additionally allows for much more flexible and full use of them in those industries for which they were intended. Ready solutions provided to engineers working on new products allow to quickly and unequivocally answer the bothering questions not only of themselves but also of economists, who nowadays also take active part at the design stage of machinery and equipment [32,33,34,35].
Constantly increasing material, manufacturing and personnel costs, further limit the freedom with which it was possible to conduct research work on new technical solutions several years ago. Specialized computer software is increasingly used, in addition to applications related to the documentation preparation stage in CAD/CAM software, to determine the behaviour of a structure or detail in precisely defined conditions of a given load [33,35].
Welding processes, as the most commonly used technique for joining structural elements and machines, further complicate the process of their construction. New materials and the thermal cycle associated with them affecting welding causes stress and deformation after welding. The type and distribution of stress and deformation depends on many factors—the method of fixing welding elements, mechanical and thermal properties, type of technology used, welding process parameters, type of joints designed, ambient temperatures and heating, etc. Obtaining an unfavourable residual stress distribution, which in normal conditions create a balanced system of internal forces, may have negative effects in the form of reducing the durability of the structure as well as the propensity to change properties during their operation. Also, deformations during and after welding may be the result of failure to meet the assumed dimensional deviations. It is connected with the necessity of applying additional repair procedures, such as straightening, which increases the total cost of the structure [33,34,36,37,38,39].
Simulations of welding processes allow the development of technology for the production of new products as well as changes and optimization of existing technologies, determination of the service life and detection of places particularly susceptible to damage during operation. It is also important to be able to check the impact of heat during repairs carried out by welding technologies. It also allows to minimize the number of trials and prototypes as well as the time needed to prepare production. This simply reduces production costs as well as the development of optimal technology [33,34,36].
Numerical simulations of welding processes are also one of the most difficult issues in the field of analysis using the finite element method. This is due to the presence of several factors. The basic one is the need to have extensive knowledge on the behaviour of materials subjected to the heat cycle of the welding process. Such data require not only extensive knowledge but also often access to a wide range of laboratory tests regarding the mechanical and thermo-metallurgical properties of the materials used. Also, knowledge about the welding process itself and the appropriate selection of boundary conditions is a big challenge for engineers who decide to apply this field of knowledge in their practical studies. However, even having extensive theoretical knowledge sometimes supported by extensive laboratory tests is not a sufficient condition for obtaining high accuracy of the results of numerical analyses using random tools. Software plays a key role in this case [33,34,35,36,37,38,39].
The described research used one of the most interesting systems developing in the market for software used for simulation; it is a package covering the area of welding and heat treatment applications: VisualWeld (SYSWELD) from the ESI GROUP, Paris, France. It enables simulation of welding processes in a very wide range: both without additional material and with additional material, by means of heat sources having physical contact with the welded element (friction welding, spot welding) as well as without contact (electric arc, laser beam, electron beam). The range of heat treatment that can be carried out is similarly wide. These are processes such as: tempering, hardening (laser, induction, electron beam, plasma, friction), surface hardening, carburizing and nitriding [33,34,36,37,38,39].
In obtaining results with a very high degree of correlation with real, material data at the software’s disposal is important. Typically, mechanical properties are defined as functions that depend on temperature and the content of individual phases. In addition to the thermo-mechanical data of the material’s, such as thermal conductivity, specific heat/enthalpy, density, Young’s modulus, Poisson’s ratio, yield strength or strengthening, metallurgical properties are also important. The system takes into account phase changes, kinetics for austenitic transformation during heating (TTA diagram) as well as transformations of ferrite, bainite and martensite during cooling (CCT, TTT diagram), Figure 1. The material bases in the SYSWELD package are constantly expanded with new materials and technologies [33,34,36]. The article investigated the influence of thermal cycles that allow obtaining the structure of the heat-affected zone in samples of thermo-mechanically rolled S700MC steel. Tests were carried out for two variants: the use of thermal cycles with a variable maximum temperature value and a constant temperature value of 1250 °C and changing cooling time t8/5 allowed to obtain information about the nature of the changes occurring in the heat-affected zone of the potential welded joint of this steel; this confirmed the thesis that S700MC steel is highly sensitive to thermal cycles.

2. Description of the Problem

2.1. Material Used for Research

The studies of the influence of the imposed thermal cycles on the properties and structure of the heat-affected zone of S700MC steel were carried out on 10 × 10 × 55 mm rectangular-shaped samples obtained by means of a standard industrial manufacturing process. Their chemical composition and properties are given in Table 1 and Table 2.
The S700MC steel is characterized by an unbalanced, fine-grained bainitic–ferritic structure and a relatively low carbon equivalent (at the level of 0.33%) which should indicate its good weldability. The high-strength properties of S700MC steel are ensured by a thermomechanical treatment process combined with the action of alloying micro-additives such as Ti, Nb and, in a small amount, V. The total content of alloying micro-additives was 0.17% by weight which did not exceed the permissible value of 0.22% for steel case with micro-additives.

2.2. Assumptions for Testing Structural Changes of S700MC Steel under the Conditions of Simulated Welding Heat Cycles

The tested S700MC steel had a very low carbon concentration (0.056%), which may have affected the reduction of the impact of austenite transformations under the influence of welding thermal cycles on the strength and plastic properties of welded joints (Table 2). For this purpose, the material database used in the calculations was also modified.
To determine the effect of maximum temperatures of the imposed thermal cycles with constant cooling time t8/5 (cooling time in the temperature range between 800 and 500 °C) and the effect of cooling time t8/5 cycle with a maximum temperature of 1250 °C on the structure and hardness of the simulated heat-affected zone of S700MC steel, heating samples were tested using a stand equipped with a resistive heating source and a thermal imaging camera, Figure 2. The samples obtained were subjected to impact tests, hardness measurement and metallographic microscopic tests. Material tensile test was carried out on round samples.
As already mentioned, in the first part a simulation of HAZ thermal cycles of S700MC steel was performed with the maximum cycle temperature range from 400 to 1300 °C every 100 °C (Table 3). The heating time was in the range of 2.3 to 5.6 s. The cooling time t8/5 thermal cycles with a maximum temperature Tmax above 800 °C was maintained between 11 and 15 s. This cooling time range resulted from the analysis of the phase transformation studies of austenite in cooling time, i.e., the CCT diagram. In this t8/5 time range, the S700MC steel was characterized by a bainitic–ferritic structure with a relatively small grain and a hardness similar to that of the initial/base material.
During the test, the temperature was recorded as a function of time and the following parameters were determined:
Tmax—maximum cycle temperature;
tn—time of sample heating from 50 °C to Tmax
t8—time after which the temperature decreased to 800 °C;
t5—time after which the temperature decreased to 500 °C;
t8/5—sample cooling time in the temperature range 800–500 °C, (Table 3).
In the second stage of research, tests were carried out on simulations of thermal cycles with different cooling times t8/5 allowing for obtaining a different microstructure in a simulated HAZ, Table 4.
The conducted research was also supported by the results of numerical analyses of selected, described cases as, on the one hand, verification of the results obtained and, on the other, an indication of the possibility of a significant reduction in the time spent on work and necessary to perform real tests due to the use of modern computational techniques based on the finite element method in VisualWeld (SYSWELD Code) software from the ESI Group. Selected heat distribution during heating, distribution of individual metallurgical phases and hardness were compared with results from real tests.

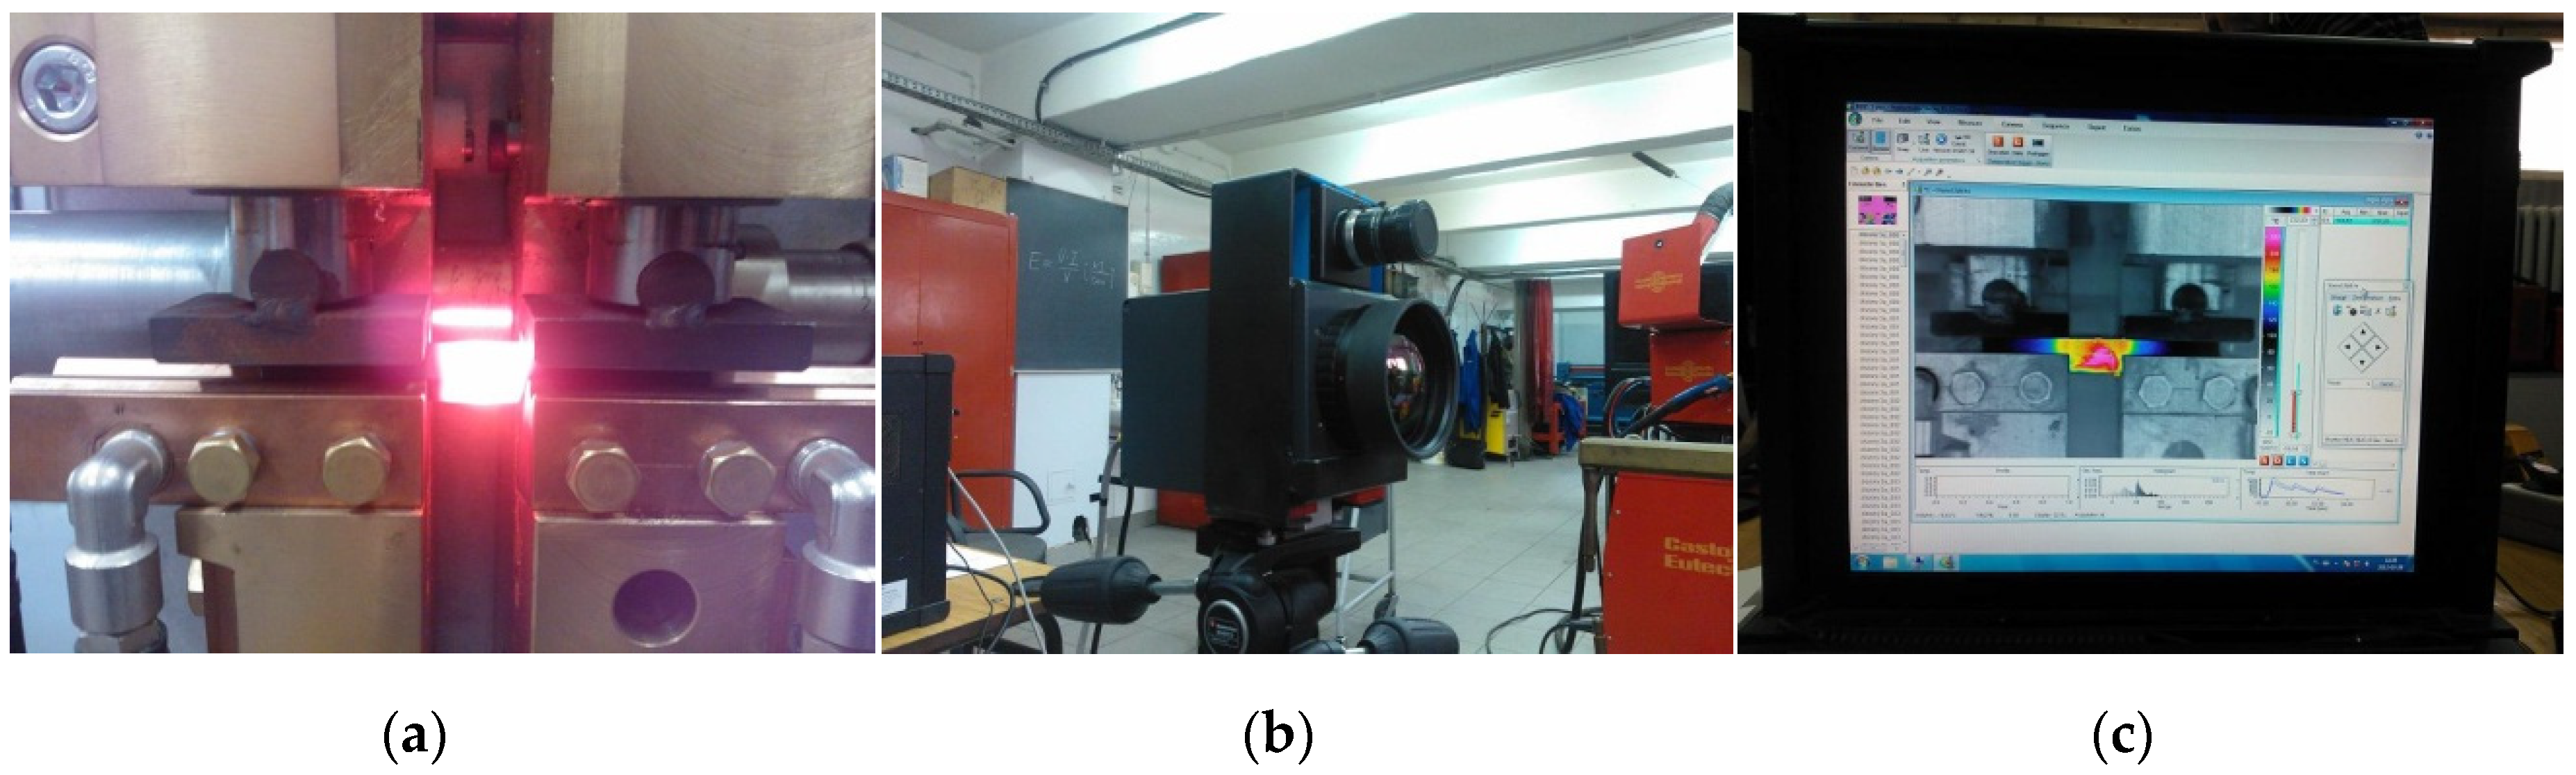
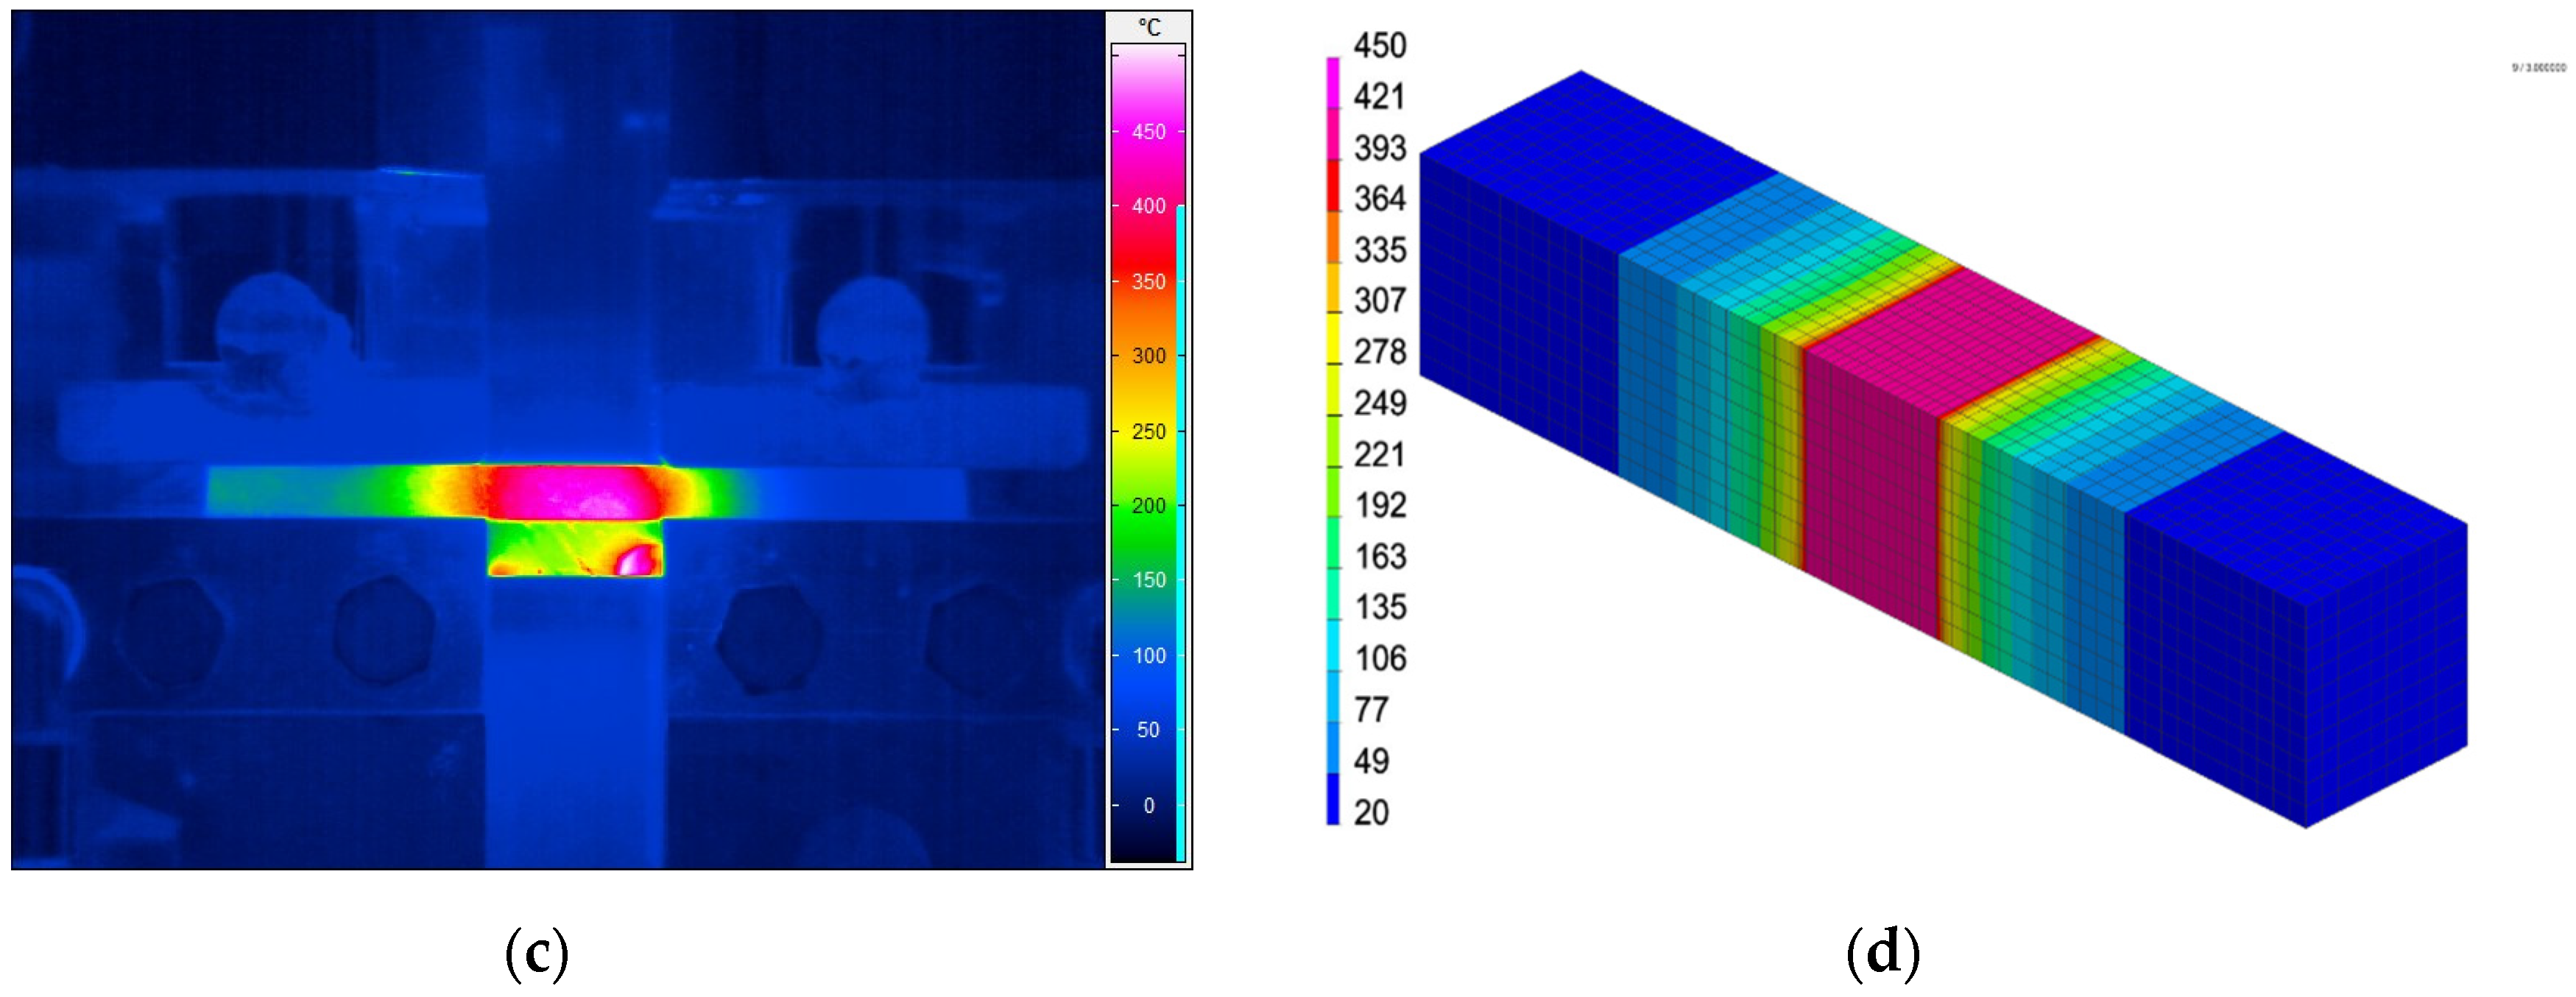
2.3. Testing Equipment

In order to determine the influence of the maximum temperature of the thermal cycle on the properties of individual HAZ areas of the tested steel, tests with the imposed thermal cycles were carried out on a specially constructed test stand, equipped with a resistive heating source, Variocam Head HR (InfraTec GmbH, Dresden, Germany) thermal imaging camera and temperature distribution field recording system with Irbis 3 plus software (InfraTec GmbH, Dresden, Germany), allowing for the control of the camera’s parameters and recording thermographic images in external memory.
The thermal imaging camera used had an uncooled matrix of bolometric detectors, enabling the acquisition of thermographic images with a resolution of 640 × 480 pixels and temperature measurement in the range from −40 to 2000 °C. The camera was equipped with a lens with a focal length of f = 50 mm, which at a distance of the lens from the tested sample of 460 mm allowed a field of view of 140 × 110 mm and a spatial resolution of a thermographic image (IFOV) of 0.25 mm (Figure 2). For temperature measurement, the camera was configured to obtain the lowest possible measurement uncertainty. In addition to environmental parameters, such as ambient temperature and humidity, atmosphere transmittance of 1.0 was adopted and the average emissivity for steel was set at 0.9. The emissivity is a key parameter that determines the accuracy of temperature measurement using a thermographic camera, and it depends on the temperature and surface condition of the observed object. Prior to testing, tests were carried out to determine the emissivity of the samples, which ranged 0.5–0.9 for the observed surface in the temperature range from 100 to 900 °C. During the thermal cycle simulation, the surface properties of the sample changed because of the formation of an oxide layer, which further increased the emissivity value. The results of preliminary simulations of the thermal cycle of test samples confirmed that the adopted emissivity value allows obtaining reliable results burdened with an average relative temperature measurement error not exceeding 10%. The video track ran at a height of 1550 mm. The tests were carried out at an air temperature of 23.7 °C and an air humidity of 65.7%.

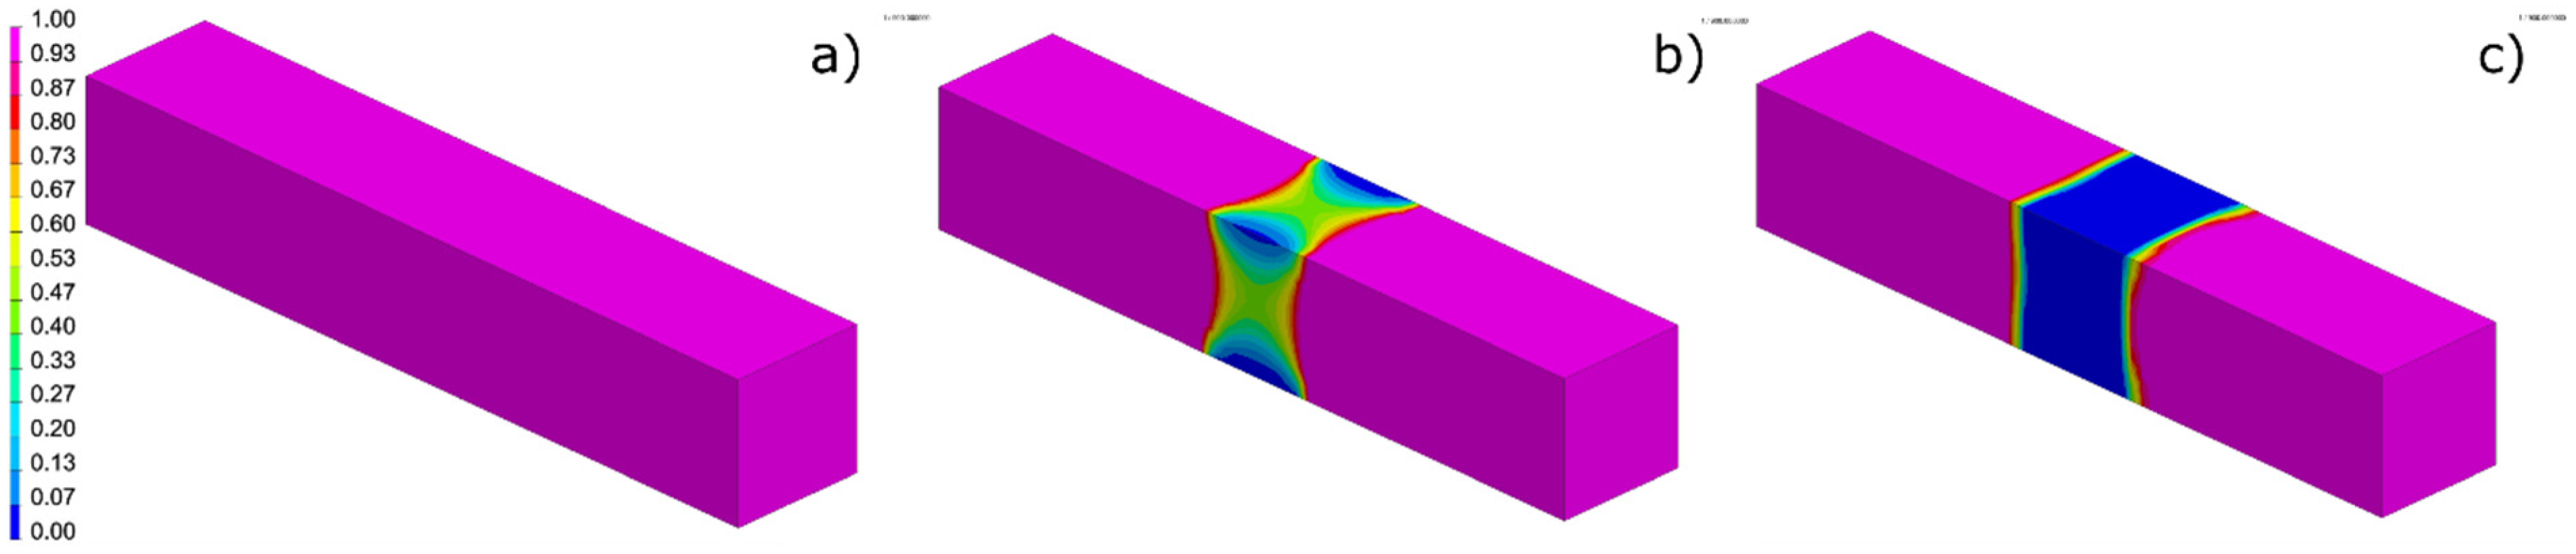
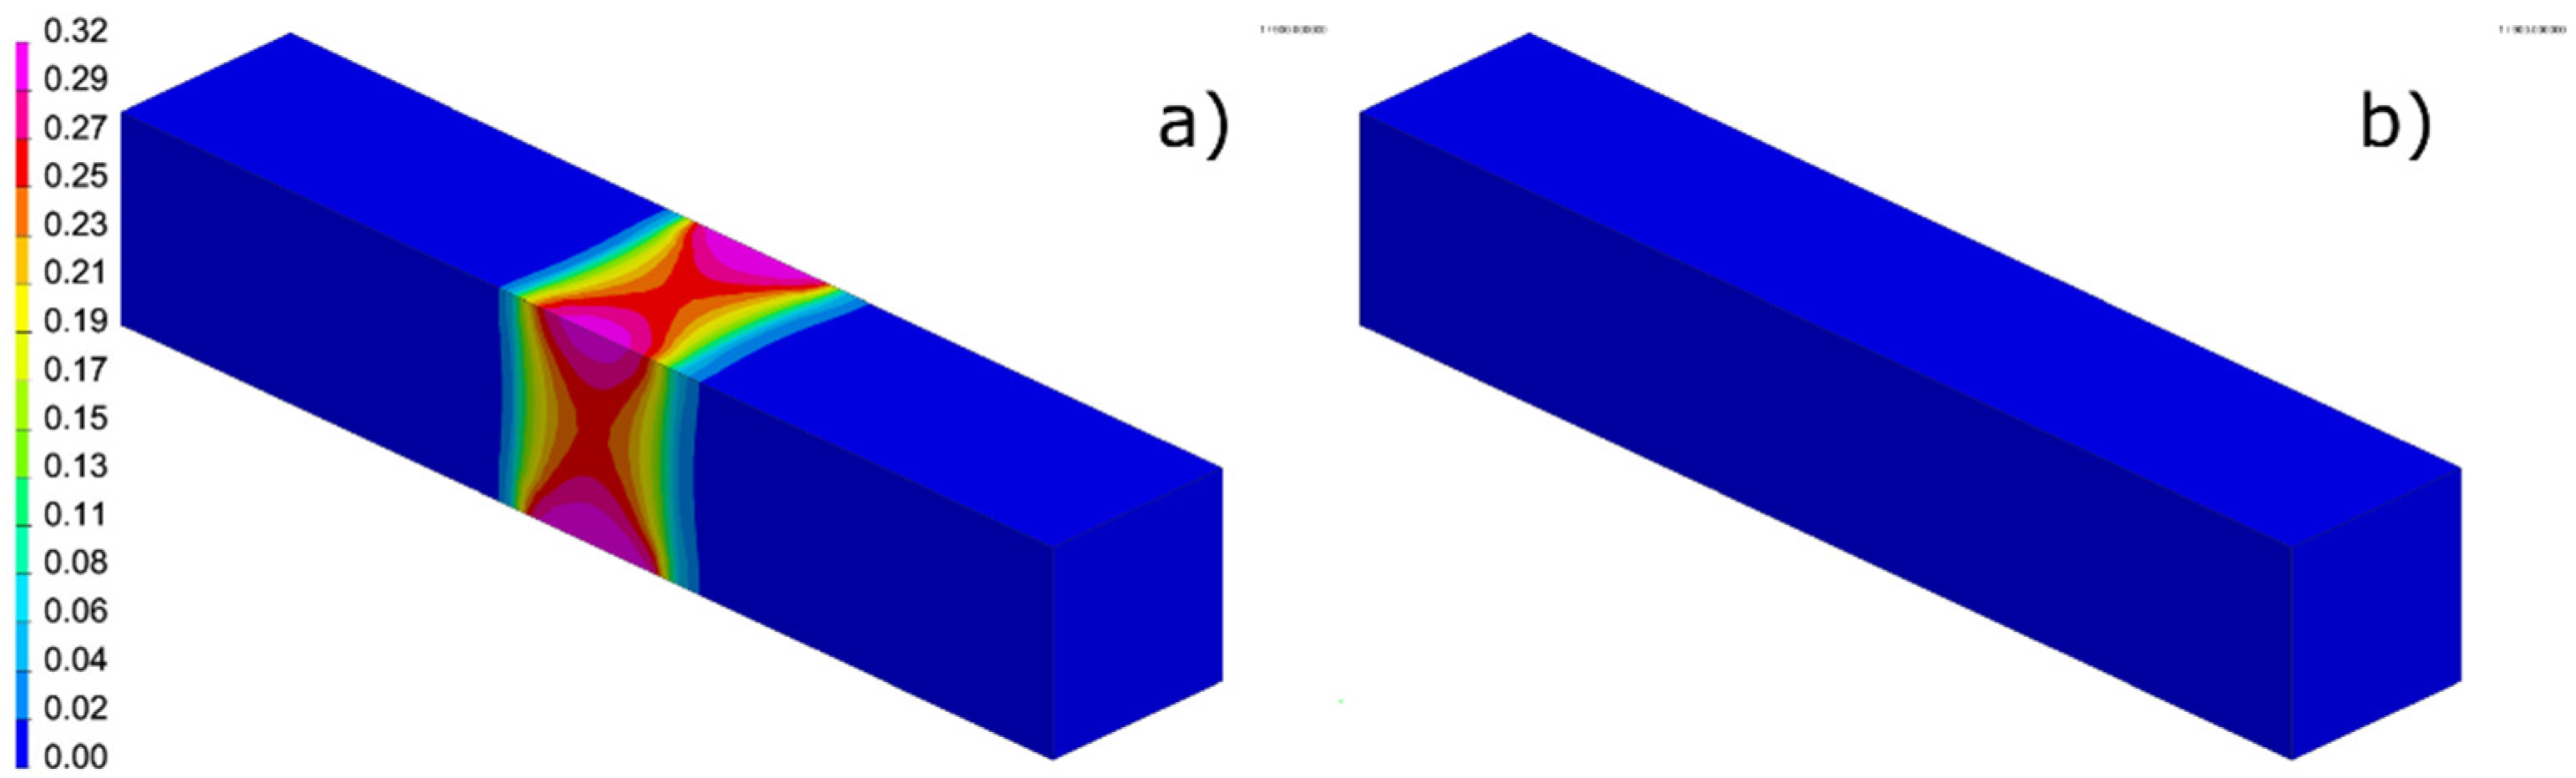
2.4. Computational Model

To perform numerical analyses in the VisualWeld environment, a three-dimensional discrete model of a rectangular cuboid with dimensions of 10 × 10 × 55 mm was made, consisting of 6500 SOLID elements and 7986 nodes. The boundary conditions in the model were adopted to faithfully convey heat dissipation to the environment at 20 °C by convection and radiation. Boundary conditions for fixing were determined so that the model could deform freely while being permanently attached at one end (Figure 3). Since no mechanical analyses were carried out, this is of secondary importance for the presented considerations. To reproduce the behaviour of the material in the conditions of a variable heat cycle, a specially prepared material database was used, containing material data enabling the prediction of metallurgical phase distribution, depending on temperature changes.
The calculations were based on the “transient” technique, and the thermal cycle forcing was applied on selected model nodes as a function of “Imposed Thermal Cycle” [34]. This function allows, instead of the welding heat source model usually used in simulations of welding processes, to set any thermal cycle in the form of temperature value in time (Figure 4). This cycle can be set both on individual elements and on their group. When using this technique, it is important to correctly map the heating curve and maximum temperature values as well as such selection of boundary conditions related to cooling to obtain simulation results consistent with real ones. In the described case, it is convenient because it is possible to precisely set the heating speed and maximum temperature of the cycle in accordance with the assumptions adopted in the tests.

3. Tests and Simulations Results

3.1. The Studies of the Influence of the Thermal Cycle Maximum Temperature on the Properties of Simulated HAZ in S700MC Steel

As already mentioned, tests of thermo-mechanically simulated thermal cycles at HAZ were carried out for the cases where the thermal cycle was t8/5 for cycles, the maximum temperature over 800 °C ranged from 11 to 15 s and the heating time to the maximum value was in the range from 2.3 to 5.6 s. The imposed thermal cycles ranged from 400 to 1300 °C every 100 °C. Based on the above recommendations and the measured actual thermal cycles, thermo-metallurgical analyses of the discussed cases were carried out using “reference” set cycle cycles (ITC400 to ITC1300) (Figure 5, Table 3). The model was calibrated and validated in accordance with the recorded thermographic images, which confirmed the compliance of the proposed calculation method with the actual results obtained during the tests (Figure 6, Figure 7 and Figure 8).
The microscopic metallographic tests of simulated HAZ areas showed that in the maximum cycle temperature range from 400 to 900 °C, the S700MC steel was characterized by a fine-grained bainitic–ferritic structure, which corresponded well with the results obtained by finite element analysis. Above the maximum cycle temperature −900 °C, there was a strong growth of the grain and it went up to 1300 °C. Microscopic studies also revealed the presence of large carbonitrides in the areas of all simulated HAZs, which proves their high thermal stability, Table 5.
As a result of numerical analyses, information was also obtained on the distribution of individual metallurgical phases and maximum their contents in the HAZ area in the analysed cases. Selected analysis results were compared with the results of metallographic tests (Figure 9, Figure 10 and Figure 11, Table 5 and Table 6).
Hardness measurements carried out by the Vickers method at a test load of 1 kg showed in the range from 400 to 900 °C practically small changes and values similar to the hardness of the native material. When the temperature of the maximum heat cycle increased above 900 °C, the material softened to approximately 230 HV1 (Table 6, Figure 12).
Based on the metallurgical phase distributions and the calculated cooling times t8/5, VisualWeld (SYSWELD) also allows you to calculate the hardness distribution. The results of selected analyses are presented and compared with the results of real measurements in Figure 12 and Figure 13.

3.2. The Studies on the Influence of Stimulated Thermal Cycles with a Maximum Temperature of 1250 °C and Variable Cooling Time t8/5 on the Structure and Properties of HAZ in S700MC Steel

The next stage of the tests were tests with the imposed thermal cycles with cooling times t8/5 successively: 1.82, 3, 5, 10, 15, 30, 60 and 120 s and the maximum temperature of the thermal cycle Tmax = 1250 °C. The proposed cooling time t8/5 corresponded to the characteristic cooling times on the CCT diagram. The microscopic metallographic tests carried out confirmed the compliance of the obtained structures with the structures resulting from the developed CCT diagram. With a short cooling time, below 10 s, a mixture of bainite and low-carbon martensite occurred. The cooling time in the range from 10 to 20 s provides a bainitic-ferritic structure, the closest to the steel structure in the initial state. Further extension of the cooling time leads to an increase in the ferrite content in the structure, above the cooling time of 100 s, the steel had a ferritic-bainitic structure (Table 7). Based on the phase transformation tests of S700MC steel under the conditions of simulated thermal conditions, the CCT diagram with a supplementary graph was determined regarding changes in HV5 hardness as a function of cooling time t8/5 (Figure 14). The latter is particularly important in the light of the considerations made.
Numerical analyses were also carried out for t8/5 times (TC1: t8/5 = 1.82 s, TC1: t8/5 = 3 s, TC2: t8/5 = 5 s, TC3: t8/5 = 10 s, TC4: t8/5 = 15 s, TC5: t8/5 = 30 s, TC6: t8/5 = 60 s and TC7: t8/5 = 120 s) and the maximum temperature of the imposed thermal cycle Tmax = 1250°C. As a result of numerical analyses, information was obtained on the distribution of individual metallurgical phases and their maximum contents in the HAZ area in the analysed cases. Selected analysis results were compared with the results of metallographic tests (Figure 15, Figure 16 and Figure 17).
As in the case of numerical analyses of the influence of the maximum temperature of the imposed thermal cycle on the hardness of the HAZ obtained, in the case of analyses with a variable cooling time t8/5, the results obtained were close to the values measured on real samples (Figure 18 and Figure 19).

3.3. Mechanical Properties Tests

In order to determine the impact of thermal cycle parameters on the mechanical properties of thermo-mechanically simulated HAZ areas, tests were also carried out in the form of a static tensile test and impact test. A static tensile test for round samples, taken from HAZ areas of steel subjected to thermal cycles in the maximum temperature range from 400 to 700 °C, showed a tensile strength value similar to that of the native material. As the maximum temperature of the heating cycle increased, there was a clear decrease in the HAZ tensile strength compared to the parent material—up to 100 MPa. The values of HAZ elongation heated up in the temperature range from 400 to 700 °C were at the level of 12%, with the elongation of native material about 16%. As the HAZ heating temperature increases, the elongation decreases to approx. 6% (Figure 20). Impact tests on obtained HAZ areas carried out at −30 °C showed a significant effect of the maximum temperature of the thermal cycle on the plastic properties of steel. Heat affected zone areas heated from 400 to 700 °C had a lower impact strength compared to the impact strength of the parent material at 20 °C. In the temperature range 800–900 °C, there was a decrease in hardness and a sharp increase in impact strength to the value of approximately 300 J/cm2 (Figure 21).
A static tensile test of round samples taken from steel specimens subjected to thermal cycles at a temperature of 1250 °C, at different cooling times, showed a small effect of the cooling time t8/5 on the strength properties of the S700MC steel HAZ areas. During the entire cooling time range - from 3 to 120 s—the HAZ tensile strength was less than that of the parent material. The achieved elongation values at the level of 7% were much lower than the elongation of the native material—16% (Figure 22).
Impact tests carried out at −30 °C of thermo-mechanically simulated HAZ, subjected to thermal cycles with a maximum temperature of 1250 °C and different cooling times, showed a sharp and significant decrease in plastic properties in relation to the initial material, regardless of the cooling time t8/5, Figure 23.

4. Results Discussion

Preliminary tests carried out in the form of a comparison of recorded thermal cycles and calculated temperature field distributions in the tested samples allowed the calibration of calculation models but also confirmed the usefulness of the proposed calculation method in support of further considerations.
Real tests and numerical simulations allowed determining the HAZ behaviour of S700MC steel subjected to the effect of a simulated welding heat cycle. Microscopic metallographic studies of simulated HAZ areas heated by cycles of different Tmax showed that in the maximum cycle temperature range from 400 to 900 °C, HAZ of S700MC steel is characterized by a fine-grained bainitic-ferritic structure. Above the maximum cycle temperature of 900 °C, there was a strong grain growth and it progressed to 1300 °C (Table 5). When analysing the results obtained by numerical simulations, it can also be seen that the calculated metallurgical phase distributions confirm the results obtained during metallographic tests (Figure 7, Figure 8 and Figure 9, Table 6). The content of the ferritic phase increases with increasing maximum cycle temperature accompanied by a slight decrease in the content of bainitic phase at the maximum value of the tested cycle temperature. The increase in the content of the ferritic phase and the disappearance of the initial (bainitic–ferritic) phase was also associated, as can be seen both from the results of actual hardness measurements and the calculated distributions, to a decrease in hardness in the area of the simulated heat-affected zone associated with the increase in the maximum temperature of the thermal cycle (Figure 11 and Figure 12). The hardness of the HAZ areas heated in the maximum cycle temperature range from 400 to 900 °C did not change and was similar to the hardness of the native material. When the temperature of the maximum heat cycle increased above 900°C, the material softened to approximately 230 HV1 (Figure 12). The calculated hardness values differed from those measured by a maximum of 23 HV units.
According to the CCT diagram, a martensitic transformation occurred in the S700MC steel, but this did not result in a significant increase in hardness (Figure 14) relative to the hardness of the parent material. It allows to state that the carbon present in the solution, to a small extent, takes part in the strengthening of steel and is also not the dominant factor in phase transitions. The S700MC steel has low hardenability due to the low concentration of unbound carbon (about 0.03%) and other alloying elements. With a short cooling time, martensite was formed, but it was low-carbon martensite which did not reduce the plasticity of steel (Figure 22). The hardness measurements carried out in the whole range of analysed cooling times t8/5 did not show the tendency of S700MC steel to cold cracking (the maximum measured hardness does not exceed values of 270 HV5) (Figure 19). As the cooling time increased, the hardness decreased, which was mainly caused by an increase in the ferrite content in the structure of the steel under test and grain growth. Hardness in the HAZ area decreased from 265 HV, with cooling time of several seconds to 190 HV, with cooling time above 60 s (Figure 14 and Figure 19). The relatively small differences in the maximum hardness values seem to confirm the thesis that in the case of S700MC steel phase transformations, γ-α and the value of the carbon equivalent cannot constitute the basis for assessing its weldability. The hardness values obtained in the HAZ area below 270 HV1, regardless of the cooling time, indicate that this area is not prone to cold cracking. Also, in this case, the results of numerical analyses seem to confirm the results obtained in real samples. Similarly calculated metallurgical phase distributions reflect the character of the described transformations and correspond well with the results of microscopic metallographic tests (Figure 15, Figure 16, Figure 17 and Figure 18, Table 7).
Tests of thermo-mechanically simulated HAZ areas, heated to different maximum temperatures, showed their significant diversity in terms of strength and plastic properties. Strength properties after exceeding the temperature of the thermal cycle with a maximum temperature of 600 °C decrease in relation to the native material (Figure 20), which is associated primarily with grain growth. The plastic properties of simulated HAZ (especially impact strength) depend on the durability of strengthening phases, their dispersion and on aging processes. The HAZ areas heated from 400 to 700 °C were characterized by lower impact strength than the native material at 20 °C which should probably be associated with the aging processes, diffusion of carbon and nitrogen atoms at close distances to the dislocation nuclei and their immobilization. In the temperature range of 800–900 °C, there was a decrease in hardness and a rapid increase in impact toughness to 300 J/cm2 which should be associated with the disappearance of secretory strengthening through coagulation of the precipitates and the passage of strengthening components to the matrix and grain recrystallization processes. Test results of thermo-mechanically simulated HAZ areas heated to different maximum temperatures have shown that the real HAZ is characterized by variable strength and plastic properties on its cross-section. The most adverse changes were noted in the area heated to a temperature above 1000 °C, when the impact strength was reduced to a few J/cm2. Research on the impact of the cooling time t8/5 on the HAZ property heated to a maximum temperature of 1250 °C confirmed that this relationship remains in the entire range of the tested cooling times (Figure 23). The thermal cycle at a temperature of about 1250 °C causes a loss of properties acquired as a result of thermomechanical treatment.
Such a rapid decrease in the impact toughness of areas heated to high temperature, regardless of the cooling time, should be associated with an increase in the number of dissolved strengthening phases in the matrix and their re-uncontrolled separation in the form of numerous fine-dispersion precipitations in the matrix of several nm which cause steel to strengthen. The obtained results were consistent with the earlier analysis of the HAZ properties heated to various maximum cycle temperatures (Figure 20 and Figure 21). Very low impact strength of the high-temperature part of HAZ, regardless of the cooling time t8/5, and a slight change in hardness together with the extension of the cooling time confirm the thesis that the properties of HAZ are determined by the durability of strengthening phases and the change of their dispersion, and the role of phase transformation of austenite is less important (Figure 22 and Figure 23).
A static tensile test of round samples taken from steel subjected to thermal cycles at 1250 °C, at different cooling times, also showed a small effect of the cooling time t8/5 on the strength properties of the HAZ of S700MC steel. During the entire analysed cooling time range, from 3 to 120 s, the HAZ tensile strength was less than that of the native material. As the cooling time increased from 3 to 120 s, the tensile strength decreased from 720 to 640 MPa. This decrease in strength should be associated primarily with the increase in the ferrite content in the structure and grain growth in the high-temperature, simulated HAZ area (Figure 11, Table 6). The achieved elongation values of 7% are much lower than the elongation of the native material—16% (Figure 22).
The research shows that the actual HAZ on its cross-section is characterized by variable properties. Heat affected zone areas heated in the 800–900 °C temperature range are characterized by the highest impact strength. The most dangerous HAZ area with low plasticity is its high-temperature, coarse-grained part, heated above 1200 °C. The disappearance of the secretory strengthening effect, reduction of grain growth and, consequently, reduction of the HAZ overheating section is visible here.
Therefore, the welding process should be carried out in such a way as to minimize the width of adverse HAZ areas. The presented research and analyses also show that the processes related to the γ-α allotropic transformation that occur in S700MC steel during cooling cannot constitute the basis for assessing its welding properties. In such cases, it is particularly important to learn the mechanisms responsible for the behaviour of this type of materials and, after the calibration and validation of numerical models, to include them in the design process of the structure. The use of numerical analyses in the design of technological processes, where the rules used so far cease to work, is basically the only currently available and correct direction, allowing the safe and effective use of these modern materials.

5. Conclusions

The presented tests and numerical analyses showed that an increase in the maximum temperature of the thermal cycle also causes an increase in the ferrite content and a decrease in the bainite content in the HAZ area (Figure 9, Figure 10 and Figure 11, Table 5 and Table 6). Low heating temperatures (up to approximately 600–700 °C), during which the bainitic structure undergoes the tempering process, do not change the hardness values. The lack of hardness changes along with the increase in tempering temperature is associated with a low concentration of elements’ increasing hardenability, especially carbon.
Thus, aging processes have a dominant impact on steel properties in this temperature range, which is confirmed by the results of impact tests (Figure 21). With increasing tempering temperatures from 100 °C, impact strength increases from 15 to 38 J/cm2 at 600 °C but is still lower than the impact strength of the base material at ambient temperature (50 J/cm2). In the temperature range of 700–1000 °C, the secretion strengthening effect disappears, as a result of coagulation of the precipitates, their coherence disappears and the internal stresses decreases. In addition, the recrystallization processes that occur reduce the hardness (Figure 12) and increase the impact strength even up to 280 J/cm2. A further increase in the temperature of the thermal cycle causes partial dissolution of the precipitates in the matrix, and with the slow cooling process, the micro-additive strengthening releases again, but in an uncontrolled manner, resulting in a decrease in impact strength to a few J/cm2 (Figure 21).
In the case of the analysis of the effect of the cooling time t8/5, numerical analyses and metallographic tests showed that as the cooling rate decreased, the ferrite content in the examined HAZ area increased and bainite decreased (Figure 16 and Figure 17). The hardness of the simulated areas together with the increase in the cooling time from 3 to 120 s slightly decreased by about 40 HV (Figure 19), which indicates the secondary role of austenite phase transformations in controlling the strength and plastic properties of welded joints.
Therefore, the tests of the influence of cooling time t8/5 of the HAZ area heated to 1250 °C allow to conclude the dominant role of strengthening phases in the assessment of weldability of thermo-mechanically processed steels with high yield strength. In addition to the statement above, high-temperature thermal cycles, irrespective of the cooling time t8/5, cause in HAZ a decrease in impact toughness to the level of a few J/cm2 (Figure 23). The impact strength decrease in this area is caused by the durability of strengthening phases and their re-separation during cooling.
To conclude, it should be risked that low impact strength, regardless of the cooling time t8/5 should indicate that the CCT diagram of S700MC steel cannot be the basis for an unambiguous assessment of its weldability. When welding thermo-mechanically treated steels with a high yield strength, preheating before welding is not necessary, on the contrary it can lead to deterioration of strength properties and plasticity of welded joints. Also, for repair welding, the introduction of additional heat to the material should be kept to a minimum. Repeated influence of the heat cycle during repair welding leads to a decrease in HAZ strength and plastic properties due to the fact of grain growth, aging processes and an increase in the concentration of dissolved strengthening components in the matrix. Similar to the above, in the case of welded joints of thermo-mechanically processed steels with a high yield strength, it is not recommended to carry out heat treatment after welding to stabilize the shape, as this reduces the strength and plastic properties of HAZ.

Author Contributions

Conceptualization, J.G.; Data curation, A.K. and T.P.; Formal analysis, T.K.; Investigation, J.G., A.K. and T.P.; Methodology, T.K.; Writing–original draft, T.K.; Writing–review & editing, J.G and T.K. All authors have read and agreed to the published version of the manuscript.

Funding

This research received no external funding.

Conflicts of Interest

The authors declare no conflict of interest.

References

  1. Flaxa, V.; Shaw, J. Material applications in ULSAB-AVC. Steel Grips 2003, 1, 255–261. [Google Scholar]
  2. Mikia, C.; Homma, K.; Tominaga, T. High strength and high performance steels and their use in bridge structures. J. Constr. Steel Res. 2002, 58, 3–20. [Google Scholar] [CrossRef]
  3. Lee, C.; Shin, H.; Park, K. Evaluation of high strength TMCP steel weld for use in cold regions. J. Constr. Steel Res. 2012, 74, 134–139. [Google Scholar] [CrossRef]
  4. Shipitsyn, S.; Babaskin, Y.; Kirchu, I.; Smolyakova, L.; Zolotar, N. Microalloyed steel for railroad wheels. Steel Transl. 2008, 38, 782–785. [Google Scholar] [CrossRef]
  5. Rak, I.; Gliha, V.; Koçak, M. Weldability and toughness assessment of Ti-microalloyed offshore steel. Metall. Mater. Trans. A 1997, 28, 199–206. [Google Scholar] [CrossRef]
  6. Chang, K.; Lee, C.; Park, K.; Um, T. Experimental and numerical investigations on residual stresses in a multi-pass butt-welded high strength SM570-TMCP steel plate. Int. J. Steel Struct. 2011, 11, 315–324. [Google Scholar] [CrossRef]
  7. Grajcar, A.; Matter, P.; Stano, S.; Wilk, Z.; Różański, M. Microstructure and hardness profiles of bifocal laser-welded DP-HSLA steel overlap joints. J. Mater. Eng. Perform. 2017, 26, 1920–1928. [Google Scholar] [CrossRef] [Green Version]
  8. Morawiec, M.; Różański, M.; Grajcar, A.; Stano, S. Effect of dual beam laser welding on microstructure-property relationships of hot-rolled complex phase steel sheets. Arch. Civ. Mech. Eng. 2017, 17, 145–153. [Google Scholar] [CrossRef]
  9. Mician, M.; Harmaniak, D.; Novy, F.; Winczek, J.; Moravec, J.; Trsko, L. Effect of the t(8/5) Cooling Time on the Properties of S960MC Steel in the HAZ of Welded Joints Evaluated by Thermal Physical Simulation. Metals 2020, 10, 229. [Google Scholar] [CrossRef] [Green Version]
  10. Grajcar, A.; Różański, M.; Kamińska, M.; Grzegorczyk, B. Effect of gas atmosphere on the non-metallic inclusions in laser-welded TRIP steel with Al and Si additions. Mater. Tehnol. 2016, 50, 945–950. [Google Scholar] [CrossRef]
  11. Skowronska, B.; Chmielewski, T.; Golanski, D.; Szulc, J. Weldability of S700MC steel welded with the hybrid plasma. Manuf. Rev. 2020, 7, 4. [Google Scholar] [CrossRef] [Green Version]
  12. Chmielewski, T.; Golański, D. The role of welding in the remanufacturing process. Weld. Int. 2015, 29, 861–864. [Google Scholar] [CrossRef]
  13. Kurc-Lisiecka, A.; Lisiecki, A. Laser welding of the new grade of advanced high-strength steel Domex 960. Laser 2017, 199, 204. [Google Scholar] [CrossRef]
  14. Kurc-Lisiecka, A.; Piwnik, J.; Lisiecki, A. Laser welding of new grade of advanced high strength steel STRENX 1100 MC. Arch. Metall. Mater. 2017, 62, 1651–1657. [Google Scholar] [CrossRef] [Green Version]
  15. Hever, M.; Schröter, F. Modern steel–high performance material for high performance bridges. In Proceedings of the 5th International Symposium on Steel Bridge, Barcelona, Spain, 5–7 March 2003; pp. 80–81. [Google Scholar]
  16. Rakshe, B.; Patel, J. Modern High Strength Nb-Bearing Structural Steels, Forming Processes. Available online: www.researchgate.net/publication/337670047_Modern_high_strength_Nb-bearing_structural_steels/link/5de427b9299bf10bc33759dc/download (accessed on 20 June 2020).
  17. Willms, R. High strength steel for steel constructions. In Proceedings of the Nordic Steel Construction Conference—NSCC, Malmo, Sweden, 2–4 September 2009; pp. 597–604. [Google Scholar]
  18. Nishioka, K.; Ichikawa, K. Progress in termomechanical control of steel plates and their commercialization. Sci. Technol. Adv. Mater. 2012, 13, 1–20. [Google Scholar]
  19. Dimatteo, A.; Lovicu, G.; Desanctis, M.; Valentini, R.; Solina, A. Correlations between microstructures and properties of transformation induced plasticity steels. Steel Grips 2006, 4, 143–147. [Google Scholar]
  20. Adamczyk, J. Development of the microalloyed constructional steels. J. Achiev. Mater. Manuf. Eng. 2006, 14, 9–20. [Google Scholar]
  21. Yan, W.; Shan, Y.; Yang, K. Effect of TiN inclusions on the impact toughness of low-carbon microalloyed steels. Metall. Trans. A 2006, 37A, 2147. [Google Scholar] [CrossRef]
  22. Chen, B.; Yu, H. Hot ductility behaviour of V-N and V-Nb microalloyed steels. Int. J. Miner. Metall. Mater. 2012, 19, 525. [Google Scholar] [CrossRef]
  23. Misra, R.D.K. Influence of vanadium on grain boundary segregation of phosphorus in iron and iron-carbon alloys. Bull. Mater. Sci. 1991, 14, 1309–1322. [Google Scholar] [CrossRef] [Green Version]
  24. Portera, D.; Laukkanenb, A.; Nevasmaab, P.; Rahkab, K.; Wallin, K. Performance of TMCP steel with respect to mechanical properties after cold forming and post-forming heat treatment. Int. J. Press. Vessel. Pip. 2004, 81, 867–877. [Google Scholar] [CrossRef]
  25. Zhao, M.; Yang, K.; Shan, Y. The effects of thermo-mechanical control process on microstructures and mechanical properties of a commercial pipeline steel. Mater. Sci. Eng. A 2002, 335, 14–20. [Google Scholar] [CrossRef]
  26. Skowrońska, B.; Szulc, J.; Chmielewski, T.; Sałaciński, T.; Swiercz, R. Properties and microstructure of hybride Plasma+MAG welded joints of thermomechanically treated S700MC steel. In Proceedings of the 27th Anniversary International Conference on Metallurgy and Materials (METAL), Brno, Czech Republic, 15–17 May 2018. [Google Scholar]
  27. Tomkow, J.; Fydrych, D.; Rogalski, G.; Labanowski, J. Temper Bead welding of S460N steel in wet welding conditions. Adv. Mater. Sci. 2018, 18, 5–14. [Google Scholar] [CrossRef] [Green Version]
  28. Tomkow, J.; Labanowski, J.; Fydrych, D.; Rogalski, G. Cold cracking of S460N steel welded in water environment. Pol. Marit. Res. 2018, 25, 131–136. [Google Scholar] [CrossRef] [Green Version]
  29. Hildebrand, J.; Werner, F. Change of structural condition of welded joints between high-strength fine-grained and structural steels. J. Civ. Eng. Manag. 2004, 2, 87–95. [Google Scholar] [CrossRef]
  30. Górka, J. Influence of welding thermal cycling on the join properties of S 700MC steel treated using thermomechanical method. In Proceedings of the 15th International Conference on Experimental Mechanics, Porto, Portugal, 22–27 July 2012; pp. 197–198. [Google Scholar]
  31. Górka, J. Microstructure and properties of the high-temperature (HAZ) of thermo-mechanically treated S700MC high-yield-strength steel. Mater. Tehnol. 2016, 50, 617–621. [Google Scholar]
  32. Górka, J. Analysis of simulated welding thermal cycles S700MC using a thermal imaging camera. In Advanced Materials Research; Trans Tech Publications Ltd.: Bäch, Switzerland, 2014. [Google Scholar]
  33. Welding Simulation User Guide, Sysweld Manual ESI Group. Available online: https://www.esigmbh.de/downloads/ESI/Dokumente/Welding/The_Welding_Simulation_Solution_210408 (accessed on 19 July 2020).
  34. Kik, T. Computational Techniques in Numerical Simulations of Arc and Laser Welding Processes. Materials 2020, 13, 608. [Google Scholar] [CrossRef] [Green Version]
  35. Kik T, Heat Source Models in Numerical Simulations of Laser Welding. Materials 2020, 13, 2653. [CrossRef]
  36. Kik, T.; Moravec, J.; Novakova, I. New method of processing heat treatment experiments with numerical simulation support. Modern technologies in industrial engineering V. In Proceedings of the ModTech 2017 International Conference, Sibiu, Romania, 14–17 June 2017. [Google Scholar]
  37. Kik, T.; Gorka, J. Numerical simulations of S700MC laser and hybrid welding. In Laser Technology 2018: Progress and Applications of Lasers; International Society for Optics and Photonics: Bellingham, DC, USA, 2018. [Google Scholar] [CrossRef]
  38. Kik, T.; Górka, J. Numerical simulations of laser and hybrid S700MC T-joint welding. Materials 2019, 12, 516. [Google Scholar] [CrossRef] [Green Version]
  39. Gietka, T.; Ciechacki, K.; Kik, T. Numerical Simulation of Duplex Steel Multipass Welding. Arch. Metall. Mater. 2016, 61, 1975–1983. [Google Scholar] [CrossRef] [Green Version]
Figure 1. The SYSWELD solver architecture [39].
Metals 10 00974 g001
Figure 2. Test stand for simulation and recording of thermal welding cycles: (a) resistance welding machine, (b) thermal imaging camera, (c) computer station screen.
Metals 10 00974 g002
Figure 3. Numerical model with marked area of nodes on which the heat cycle of the heating process (“LOAD”) was given and the boundary conditions of sample clamping.
Metals 10 00974 g003
Figure 4. A scheme of load the mesh nodes with the defined thermal cycle when using the “Imposed Thermal Cycle” calculation technique.
Metals 10 00974 g004
Figure 5. Forcing cycles (ITC) and calculated (STC) inside the heat-affected zone (HAZ) for thermal cycles with the maximum temperature from 400 to 1300 °C (Table 3).
Metals 10 00974 g005
Figure 6. Comparison of (a) the registered and (b) the calculated thermal cycle as well as (c) the thermographic image and (d) the result of the numerical analysis in the form of temperature distribution for the thermal cycle with Tmax = 400 °C.
Metals 10 00974 g006aMetals 10 00974 g006b
Figure 7. Comparison of (a) the registered and (b) the calculated thermal cycle as well as (c) the thermographic image and (d) the result of the numerical analysis in the form of temperature distribution for the thermal cycle with Tmax = 900 °C.
Metals 10 00974 g007
Figure 8. Comparison of (a) the registered and (b) the calculated thermal cycle as well as (c) the thermographic image and (d) the result of the numerical analysis in the form of temperature distribution for the thermal cycle with Tmax = 1200 °C.
Metals 10 00974 g008
Figure 9. The calculated initial phase distributions (bainite–ferrite) for a thermal cycle with a maximum temperature equal to: (a) 400 °C, (b) 900 °C and (c) 1200 °C (Table 6).
Metals 10 00974 g009
Figure 10. The calculated bainite distributions for a thermal cycle with a maximum temperature of: (a) 400 °C, (b) 900 °C, and (c) 1200 °C (Table 6).
Metals 10 00974 g010
Figure 11. The calculated ferrite distributions for a thermal cycle with a maximum temperature of: (a) 400 °C, (b) 900 °C and (c) 1200 °C (Table 6).
Metals 10 00974 g011
Figure 12. Comparison of the real and calculated results of measurements of hardness in thermo-mechanically and numerically simulated HAZ areas of S700MC steel.
Metals 10 00974 g012
Figure 13. The results of numerical analyses of hardness distributions of selected S700MC steel samples heated with a maximum cycle temperature of: (a) 400 °C, (b) 900 °C and (c) 1200 °C.
Metals 10 00974 g013
Figure 14. The results of hardness HV5 measurements in thermo-mechanically simulated HAZ areas of S700MC steel.
Metals 10 00974 g014
Figure 15. The calculated martensite distributions for: (a) TC0—maximum 31.5% and (b) TC1—0.4%, (others 0%).
Metals 10 00974 g015
Figure 16. The calculated bainite distributions for: (a) TC0—maximum 77.7%, (b) TC1—maximum 84.9%, (c) TC3—maximum 68%, (d) TC6—maximum 46.6%.
Metals 10 00974 g016
Figure 17. The calculated ferrite distributions for: (a) TC0—maximum 31%, (b) TC1—maximum 35.4%, (c) TC3—maximum 44.2%, (d) TC6—maximum 56.3%.
Metals 10 00974 g017
Figure 18. The results of numerical analyses of HAZ hardness distributions of selected S700MC steel samples heated with the thermal cycle with a maximum temperature about 1250 °C and cooling times t8/5: (a) TC0 1.82 s, (b) TC1 3 s, (c) TC4 30 s and (d) TC6 60 s.
Metals 10 00974 g018
Figure 19. The comparison of the real and calculated results of hardness measurements in the thermo-mechanically and numerical simulated HAZ areas of S700MC steel.
Metals 10 00974 g019
Figure 20. Tensile strength and relative elongation of steel S700MC thermo-mechanically simulated HAZ in dependence of the maximum temperature of applied thermal cycle.
Metals 10 00974 g020
Figure 21. Toughness of steel S700MC thermo-mechanically simulated HAZ area at –30 °C in dependence of maximum temperature of applied thermal cycle.
Metals 10 00974 g021
Figure 22. Tensile test and relative elongation of steel S700MC thermo-mechanically simulated HAZ area in of cooling time t8/5, the maximum temperature of thermal cycle was approximately 1250 °C.
Metals 10 00974 g022
Figure 23. Toughness of S700MC steel thermo-mechanically simulated HAZ area at temperature −30 °C in dependence of cooling time t8/5, the maximum temperature of the thermal cycle was approximately 1250 °C.
Metals 10 00974 g023
Table 1. Chemical composition according to PN EN 10149-2 and mechanical properties of thermo-mechanically rolled S700MC steel.
Chemical Composition, % wg.
C
Maximum
Si MaximumMn
Maximum
P
Maximum
S
Maximum
Al
Minimum
Nb
Maximum *
V
Maximum *
Ti
Maximum *
B
Maximum
Mo
Maximum
Ce **
Maximum
0.120.602.100.0080.0150.0150.090.200.220.0050.500.61
Mechanical properties
Tensile strength,
Rm (MPa)
Yield strength
Re (MPa)
Elongation
A5 (%)
Toughness
(J/cm2) (−20 °C)
82276819135
* Total content of Nb, V and Ti should not exceed maximum 0.22%. ** Ce—carbon equivalent.
Table 2. Chemical composition of used S700MC steel 10 mm thick sheets.
Chemical Composition, % wg
CMnSiSPAlNbTiVN *Ce
0.0561.680.160.0050.010.0270.0440.120.006720.33
* N—content in ppm, nitrogen determined by high-temperature extraction.
Table 3. Parameters of imposed thermal cycles with variable maximum temperature.
Specimen DesignationTemperature, Tmax (°C)Time tn (s)Time t8 (s)Time t5 (s)Time t8/5 (s)
SetActual
TC400_14003822.9---
TC400_24533.2---
TC400_34403.2---
TC500_15005182.7---
TC500_25522.7---
TC500_34802.8---
TC600_16006192.6---
TC600_25952.1---
TC600_35962.2---
TC700_17007202.8---
TC700_27202.4---
TC700_37362.1---
TC800_18008072.73.316.413.1
TC800_27932.72.714.712.0
TC800_38132.83.120.417.3
TC900_19009043.46.619.312.7
TC900_29293.67.419.812.4
TC900_39123.67.319.812.5
TC1000_1100010174.312.723.911.2
TC1000_210204.111.923.711.8
TC1000_310374.311.624.813.2
TC1100_1110011364.413.625.612.0
TC1100_210864.212.823.610.8
TC1100_310993.912.423.310.9
TC1200_1120012035.715.929.213.3
TC1200_211785.415.629.213.6
TC1200_311915.315.630.013.6
TC1300_1130012825.218.833.014.2
TC1300_212855.920.134.914.8
TC1300_312755.720.635.914.2
Table 4. Parameters of imposed thermal cycles with variable cooling time between 800 and 500 °C.
Specimen DesignationCooling Time between 800 and 500 °C (t8/5) (s)Maximum Temperature of Thermal Cycle (°C)
TC01.821250
TC13
TC25
TC310
TC415
TC530
TC660
TC7120
Table 5. Microstructure of S700MC steel HAZ areas as a function of temperature Tmax.
Metals 10 00974 i001 Metals 10 00974 i002 Metals 10 00974 i003
Tmax = 400 °CTmax = 500 °CTmax = 600 °C
Metals 10 00974 i004 Metals 10 00974 i005 Metals 10 00974 i006
Tmax = 700 °CTmax = 800 °CTmax = 900 °C
Metals 10 00974 i007 Metals 10 00974 i008 Metals 10 00974 i009
Tmax = 1000 °CTmax = 1100 °CTmax = 1200 °C
Table 6. The content of individual metallurgical phases calculated for simulation of sample heating depending on the maximum values of the set temperature of the thermal cycle (Table 3, Figure 9, Figure 10 and Figure 11).
Phase/CycleTC400TC700TC800TC900TC1000TC1100TC1200
Martensite0000000
Bainite0020.1157.39 60.4562.3957.56
Ferrite0010.29 38.97 40.90 41.5947.32
Initial phase (bainite–ferrite)10010033.371.79000
t8/5 were from 11 to 14, 8 s. Designation of the specimens: np. TC400—cycle Tmax = 400 °C.
Table 7. The microstructure of HAZ of S700MC steel as a function of cooling time t8/5 for a cycle of the maximum temperature about 1250 °C.
Metals 10 00974 i010 Metals 10 00974 i011 Metals 10 00974 i012
time t8/5 = 1.82 s
matensite
time t8/5 = 3.40 s
martensite + bainite
time t8/5 = 5.38 s
martensite + bainite
Metals 10 00974 i013 Metals 10 00974 i014 Metals 10 00974 i015
time t8/5 = 10.20 s
bainite + martensite
time t8/5 = 15.92 s
bainite + small amounts of ferrite
time t8/5 = 20.86 s
bainite + ferrite
Metals 10 00974 i016 Metals 10 00974 i017 Metals 10 00974 i018
time t8/5 = 29.98 s
bainite + ferrite
time t8/5 = 58.70 s
bainite + ferrite
time t8/5 = 97.18 s
ferrite + bainite

