Abstract
Tungsten carbide–cobalt (WC–Co) agglomerated powder is widely used for additive manufacturing and spray coating, and a reduction in internal gaps in the powder is required to obtain a product of high quality. In this paper, we investigate plasma effects on agglomerated powder when WC–12%Co powder is directly subjected to direct current (DC) arc plasma treatment to reduce gaps in the WC–Co powder. We obtain a plasma-treated powder with reduced gaps among WC particles. Furthermore, plasma-treatment improves the sphericity of the powder particles, due to the spheroidization effect, so that the percentage of plasma-treated particles exceeding 95% sphericity is 50%, which is 1.7 times that of raw powder. Concern regarding the possible generation of W2C by plasma treatment is unfounded, with W2C levels kept very low according to X-ray diffraction (XRD) analysis, showing a value of 0.0075 for the area ratio W2C(002)/WC(100). XRD analysis also reveals that plasma treatment relaxes residual strains in the powder. From these results, the DC plasma treatment of WC agglomerated powder produces a spherical powder with fewer gaps and strains in the powder, making it more suitable for additive manufacturing while suppressing decarburization.
1. Introduction
Composites of tungsten carbide (WC) and cobalt (Co) are among the materials known as cemented carbides, which have been widely used for various engineering components in industry, such as press dies, jigs, and rock drills due to their hardness, wear and corrosion resistance, and thermal stability in high-temperature conditions [1,2,3]. However, these requirements make conventional processing of such WC composites difficult, making the processing of such materials time- and cost-intensive, while restricting the final geometry. In particular, the recent demand for products with increasingly complex shapes has been very difficult to meet using conventional processing techniques. For these reasons research on unconventional WC manufacturing techniques has increased in recent years. Among the candidate technologies enabling the manufacture of complex-shaped parts in WC are additive manufacturing (AM) techniques, such as powder bed fusion (PBF) and directed energy deposition (DED), for which several studies have been carried out using WC [4,5,6,7]. However, internal defects such as a porosity and cracks have remained problematic, and practical solutions have not been obtained.
For AM process, the characteristics of the material powder play a significant role in process stability and final part performance. For example, Ng et al. reported that the presence of pores in material powder affected porosity in a product after solidification [8]. For this reason, it is important to use a powder that is free of internal porosity and residual gas. Furthermore, spherical powders with high flowability, packing density, and appropriate particle size distribution are required for AM powder techniques. In the AM process for WC, the use of fine powders is also required to improve sintering and mechanical properties for WC, although finer particles tend to show lower flowability. Therefore, agglomerated powder is often applied in AM processes, since agglomerated powders exhibit spherical shape and consist of fine primary particles of ~1 m size. However, agglomerated powder tends to exhibit numerous internal gaps and contain a large quantity of residual gas. These factors are thought to be among the reasons for the porosity found in the resulting AM products.
In order to obtain a WC agglomerated powder without the internal gaps that generate porosity in resulting AM products, we have proposed a direct current (DC) arc plasma treatment for a powder of WC with Co binder. In our previous study using DC arc plasma processing, we succeeded in spheroidizing an irregularly shaped stainless powder and in reducing internal defects of the stainless steel powder [9]. In this technique, the powder can be heated in a high-temperature plasma in a short time, for a powder–plasma total exposure time of a few milliseconds. Therefore, by applying the present technology to WC powder processing, internal defects can be reduced while suppressing the decarburization phenomenon caused by the heating of WC. To our knowledge, no study has yet investigated the properties of DC arc plasma-treated WC–Co powders in detail. Hence, it is important to determine how DC arc plasma treatment affects the characteristics of WC–Co powder. In the present study, we investigate the characteristics of DC arc plasma-treated WC–Co powder, using DC arc plasma treatment at a higher processing power than in the previous study, in which stainless steel powder was treated. The powder properties are characterized in terms of surface morphology, particle size distribution, internal defects, and crystallinity. Plasma-treated powder applications in additive manufacturing processes are discussed in the framework provided by the obtained material characterization.
2. Materials and Methods
In this study, we used a spray-dried tungsten carbide (WC–12 mass% Co) powder as a raw material, supplied by Powlex Corporation (Gunma, Japan). The raw powder was an aggregative WC and Co powder with a D50 of 38 m.
The raw tungsten carbide powder was treated by the DC arc plasma processing system shown in Figure 1. The processing system consisted of a water-cooled processing chamber with a plasma gun, a powder feeder, a plasma control system, and a control system for processing gas. Prior to spheroidization processing, vacuum pumping of the processing chamber (10 Pa) was repeated three times to reduce concentrations of oxygen and nitrogen in the chamber. After vacuum pumping, argon gas was charged in the chamber to a pressure of 80–90 kPa. The DC arc plasma was generated by argon gas with a flow rate of 15 standard liters per minute (SLM), and the plasma was blown out from the nozzles of the plasma gun installed in the processing chamber. In this study, a power of 13 kW was inputted into the DC-Arc plasma. The nozzle of the plasma gun had holes to feed the powder particles to the arc plasma. The raw powder stored in the powder feeder was transported to the plasma gun by argon gas flow at a flow speed of 5 SLM, and the powder was injected into the arc plasma at the powder flow rate of 5.3 g/min through the holes on the plasma gun nozzle. The injected powder particles were exposed to the plasma and were heated while the particles passed through the plasma region. The particles that reached their melting point became molten droplets. Melting reduced the porosity of the particles, since shrinkage occurred due to surface tension, which was applied to the surfaces inside, and outside, of the melted particle. Furthermore, surface tension transformed the shapes of melted particles to a spherical shape. Finally, the melted particles solidified outside of the plasma, and the treated particles were stored in the collector pot.
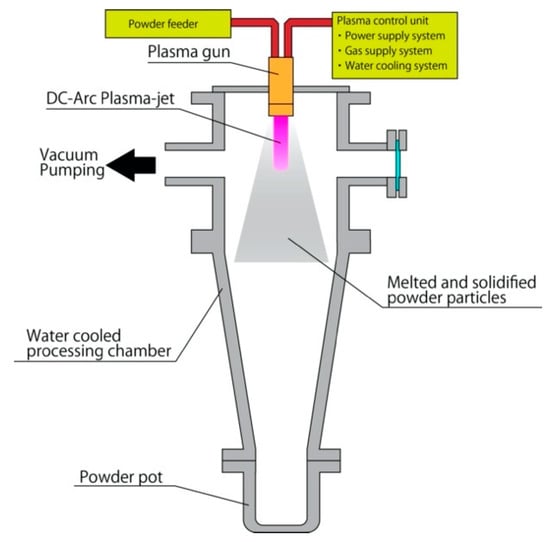
Figure 1.
Schematic view of DC arc plasma processing system.
In order to investigate the effect of melting due to plasma heating, we analyzed the powder morphology of the interiors and exteriors of the powder, the particle size distribution, the sphericity and structural evolution of the powder particles. The powder morphology and microstructural investigations were carried out using a ZEISS (Jena, Germany) UltraPlus scanning electron microscope (SEM) with energy dispersive X-ray spectroscopy (EDS). Conductive resin samples, in which the powders were buried, were prepared for the observation of powder cross-sections. Polishing of the sample surface was performed using a series of waterproof abrasive papers (#400, #800, #1000, #1500, #2000, and #3000), and the final samples were precisely polished with two kinds of buff comprising a diamond abrasive grain of 1 m diameter and colloidal silica of 0.08 m diameter. The polished surfaces were observed with a KEYENCE (Osaka, Japan) VHX-5000 optical microscope to ensure consistent polishing quality.
For both the raw powder and plasma-treated powder, particle sphericity was quantified through image analysis of the scanning electron microscopy (SEM) micrographs. The sphericity of each particle was obtained by dividing the circumference of a perfect circle of the same area of the particle cross-section by the circumference of the particle cross-section itself. Therefore, a perfectly spherical particle would have a sphericity value of 1, while less spherical particles would have values between 0 and 1. Calculation of particle sphericity was performed using the software program ImageJ (public domain, National Institutes of Health). Particle size distribution was analyzed on a SHIMADZU (Kyoto, Japan) SALAD2000 laser particle size analyzer.
The structural evolution of the plasma-treated powder was examined using a RIGAKU (Tokyo, Japan) MiniFlex X-ray diffractometer (XRD). For both raw powder and plasma-treated powder, the grain size was estimated using the Williamson–Hall method [10]. In this method, crystallite size and microstrain are estimated according to,
where β is the diffraction peak broadening at half peak height, λ (nm) is the wavelength of the X-ray, <D> (nm) is the crystallite size, ε is the microstrain, and θ (°) is the diffraction angle. By defining ∆K = β cosθ/λ, α = 1/<D>, and K = 2sinθ/λ, Equation (1) is simplified as
This XRD profile allowed estimation of the lattice constants of WC, which has hexagonal crystal structure, for the raw powder and the plasma-treated powder. For a hexagonal crystal system, the relation between the Bragg angle θ and Miller indices h, k, and l is expressed as,
where a and c are lattice constants. The lattice constants a and c were calculated by Cohen’s method [11,12] in this study.
3. Results
3.1. Powder Morphology
A SEM micrograph of the starting raw powder is shown in Figure 2a. The WC–12%Co particles exhibited a rounded shape, with few irregularly shaped particles observed. The typical morphology of WC–12%Co powder particles after DC arc plasma treatment is shown in Figure 2b. The plasma-treated powder particles also exhibit spherical shape, with irregularly shaped particles still observed. From these SEM images, the mean particle size of plasma-treated powder seems to be smaller than that of the raw powder, and spherical particles seem to be more common after plasma treatment. The differences in particle size and particle sphericity were examined in greater detail using laser particle size analysis, and SEM image analysis, respectively.
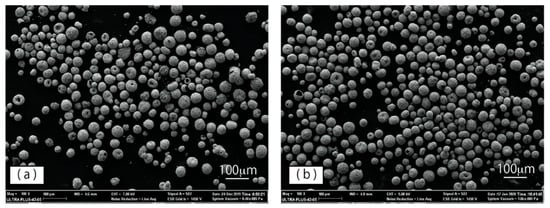
Figure 2.
Morphology of WC–12%Co powders: (a) raw powder and (b) plasma-treated powder.
Figure 3a,b shows profiles of particle size distribution of the raw powder and the plasma-treated powder, respectively. The D50 value of the plasma-treated powder is 34 μm, lower than that of the raw powder of 38 μm.
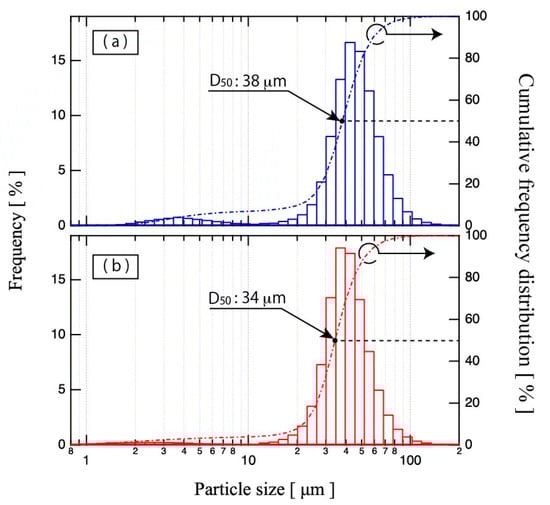
Figure 3.
Particle size distributions of (a) raw powder and (b) plasma-treated powder.
In the raw powder results, the particle size distribution was bimodal; one mode reflecting a finer-particle-size subset from 1 to 10 μm and a second mode reflecting a coarser-particle-size subset from 10 to 160 μm. These two profile subsets still remained after plasma treatment. However, the peak intensity of the finer profile subset was reduced by plasma treatment. In contrast, the peak intensity of the coarser profile subset was increased by plasma treatment. It is inferred that large-diameter particles became smaller, due to shrinkage via gap reduction and particle splitting by plasma jets, while the number of small particles decreased via fusion to large particles and evaporation. Consequently, plasma treatment sharpened the particle size distribution and improved the uniformity.
The sphericities of the raw and the plasma-treated powders were analyzed using the SEM images. Figure 4 shows the sphericity plot of each powder. The 0.9 sphericity threshold and 0.95 sphericity threshold are indicated by a dashed black line, and solid black line, respectively. The raw powder particles plotted in the ≥0.5 sphericity region and were concentrated in the ≥0.8 sphericity region. In contrast, the plasma-treated particles were concentrated in the ≥0.9 sphericity region. Although, a few particles exhibiting low sphericity also occurred in the plasma-treated powder. Furthermore, the percentage of particles exceeding sphericity thresholds of 0.9 and 0.95 were calculated from Figure 5. The percentage of particles of sphericity exceeding 0.9 is 48% for raw powder and 73% for plasma-treated powder. The percentage of particles of sphericity exceeding 0.95 is 29% for raw powder and 50% for plasma-treated powder. Therefore, the percentage of particles of sphericity exceeding 0.95 in the treated powder is 1.7 times that in the untreated powder, suggesting that plasma treatment produced high-sphericity particles from the raw powder’s lower-sphericity particles. In sum, plasma-treated powder exhibits higher sphericity and higher particle size uniformity than raw powder. The improvement of powder sphericity enhances its flow-ability and apparent density as described in Table 1. The flow-ability and the apparent density were evaluated from the Hall flow test of ASTM B213, and the apparent density ASTM B212, respectively. The flowability of the plasma-treated powder was 11.3 s/50 g, which was 1.6 times faster than that of the raw powder. The apparent density of the treated powder also improved from 7.6 to 11.0 g/cm3.
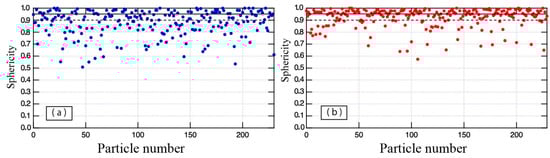
Figure 4.
Sphericity plots of (a) raw powder and (b) plasma-treated powder.
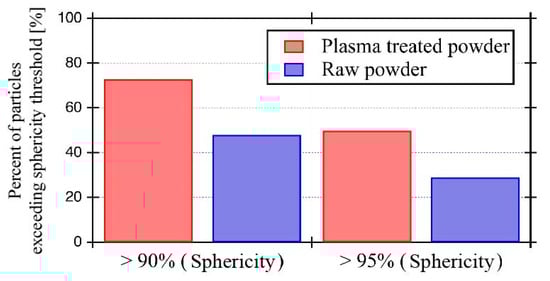
Figure 5.
Percentage of particles with sphericity exceeding 90% and 95% thresholds in each powder.

Table 1.
Flow-ability and apparent density of the raw powder and the treated powder.
Table 1 Differences of the flow-ability and apparent density between the raw powder and the plasma treated powder.
Additionally, differences in surface morphology were evident between the raw powder and the plasma-treated powder. High-magnification SEM images of WC–Co particles are shown in Figure 6. Figure 6a,b shows typical surface images of WC–Co aggregated particles of the raw powder and the plasma-treated powder, respectively. In a WC–Co particle of the raw powder, the primary particles of about 1 μm are aggregated, and gaps occur among particles. In contrast, primary particles of the plasma-treated powder exhibited slightly larger diameters, with more angular shapes. These results suggest that recrystallization and grain growth occurred due to the plasma heating. Furthermore, we observed that the gaps among the WC–Co particles in the plasma-treated powder were filled with a material. The material filling the gaps among WC particles was identified using EDX analysis, based on elemental mapping of tungsten and cobalt shown in Figure 7c,d, respectively. Carbon mapping is also shown, in Figure 7b. From these elemental mapping results, angular particles were identified as WC composites since carbon and tungsten were detected on the angular particles without detection of cobalt. On the other hand, tungsten did not appear in the gaps among angular particles, although cobalt and a small amount of carbon were detected. From these results, it was determined that cobalt (blue) filled in the gaps among WC particles.
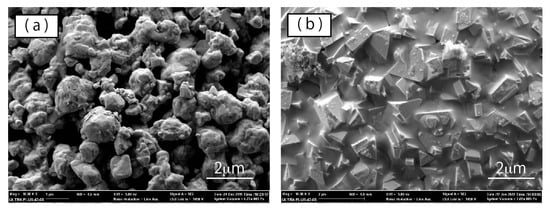
Figure 6.
High-magnification SEM images of WC–Co particle surfaces of (a) raw powder and (b) plasma-treated powder.
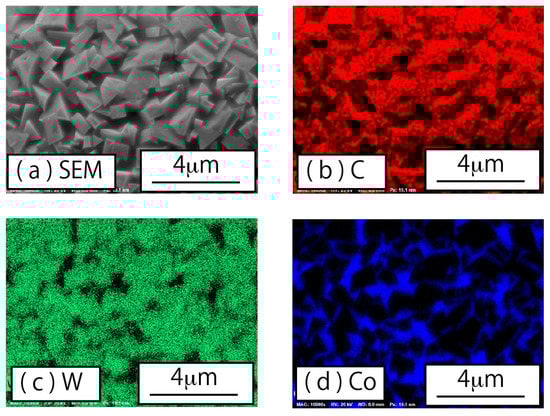
Figure 7.
Elemental mappings on the surface of a plasma-treated WC–Co particle: (a) SEM image, (b) carbon mapping, (c) tungsten mapping, and (d) cobalt mapping.
In order to examine the powder particles’ interior state, cross-sectional observation was carried out using SEM with EDX analysis. Figure 8a,b shows typical cross-sectional SEM images of the raw powder, and the plasma-treated powder, respectively. In the SEM image of the raw powder, many small gaps occur within the WC–Co particle. Both small and large gaps occur in some of the particles. As seen in Figure 8a,b, the number of small gaps was much smaller in the plasma-treated powder than in the raw powder. Although larger gaps did not disappear during plasma treatment, radial shrinkage of large gaps was observed in the plasma-treated powder. The elemental mapping results for the plasma-treated powder cross-section are shown in Figure 9. Here, cobalt was found to be distributed among the WC particles, and as observed on the particle surface, cobalt filled the gaps among the WC particles.
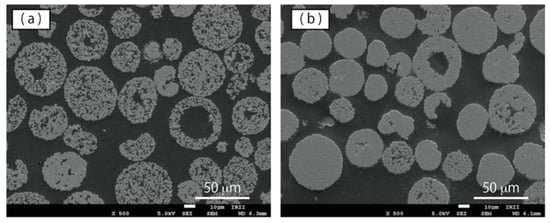
Figure 8.
SEM observation of cross section of WC–12%Co powder particles: (a) raw powder, and (b) plasma-treated powder.
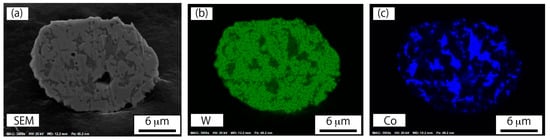
Figure 9.
Elemental mappings on a cross-section for a plasma-treated WC–12%Co particle: (a) SEM image, (b) tungsten mapping, and (c) cobalt mapping.
3.2. Compression Test for the WC-Co Powders
We have conducted a compression test for the raw powder and the plasma-treated powder using a SHIMADZU (Kyoto, Japan) MCT510 micro-compression tester. A diamond flat punch tip with a 50 m diameter was used in this compression test. The WC-Co particle was compressed in the load control mode at a rate of 5 mN/s. The maximum load was fixed at 500 mN for the raw powder and 1500 mN for the plasma-treated powder. Figure 10 shows the typical load-displacement curve of (a) the raw powder and (b) the plasma-treated powder. As observed in Figure 10, compressed WC-Co particles was always broken after compression test, suggesting that tensile fracture occurred in all case. The tensile strength was calculated according to , where St is the tensile strength, A is the particle diameter, and Fc is the fracture load [13]. The Fc is the load when sudden large increase of displacement occurs. Since the WC-Co powders were agglomerated powder, the agglomerated powder collapsed due to the tensile stress when a displacement jump occurred. The Fc of the raw powder and the plasma treated powder are 175 mN, and 959 mN, respectively. Table 2 shows average values of the diameter of tested particle and the calculated tensile strength. As Table 2 shows, tensile strength of the plasma treated powder was significantly increased, compared to the raw powder. The St of the treated powder is 4.8 times that in the untreated powder, suggesting that plasma treatment produced high-tensile strength particles from the raw powder’s particles with low binding force.
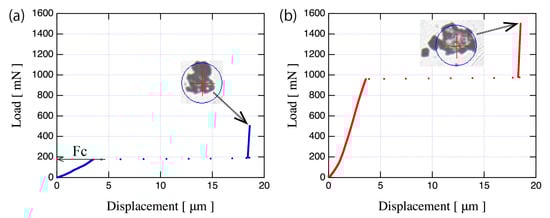
Figure 10.
Typical load-displacement curves of (a) the raw powder and (b) the plasma treated powder with the pictures of tested WC–12%Co particle after compression test.
Table 2.
Diameter and tensile strength achieved in the compression test.
3.3. Crystalline Structure
Figure 11 shows the XRD patterns for various diffraction angles 2θ of (a) 30–120°, (b) 39.0–40.5°, (c) 42.0–46.0°, and (d) 47.0–50.0°. In these figures, the filled circle represents an XRD peak corresponding to the WC phase, while the filled triangle represents an XRD peak corresponding to the Co phase. XRD patterns of the raw powder are represented by the blue solid line, while those of the plasma-treated powder are represented by the red solid line. In Figure 11a, mainly WC phases were observed in both powders, and with weak evidence of Co peaks found around 2θ angles of 44, 51, and 92°. The observed WC peaks of the plasma-treated powder were shifted to small angles compared to those of the raw powder, as shown in Figure 11d, in which the peak corresponds to the (101) surface of the WC phase. This result implies that plasma treatment has changed the WC lattice spacing. Therefore, Cohen’s method [12] was used to calculate the lattice constant of WC for the raw powder and the plasma-treated powder in order to estimate the strain induced in WC by plasma treatment. Since WC is known to have a hexagonal crystal structure, the a- and c- axes of WC crystals in both powders were calculated from the obtained XRD profiles using Equation (2). The calculated lattice constants are shown in Table 3. As Table 3 shows, there was no significant difference in the c-axis: a-axis ratio between the two powders. These results provide no evidence of an increase in the lattice constant due to anisotropic force applied to the WC crystal. Furthermore, the lattice constants in the plasma-treated powder were both larger than in the raw powder. Indeed, the lattice constants of the plasma-treated powder obtained from the XRD analysis closely match the values obtained for the raw powder, and the WC peak of plasma-treated powder is consistent with the high-crystallinity WC peak shown in Figure 11d. These findings suggest that strains in the agglomerated powder may have been relieved by plasma treatment.
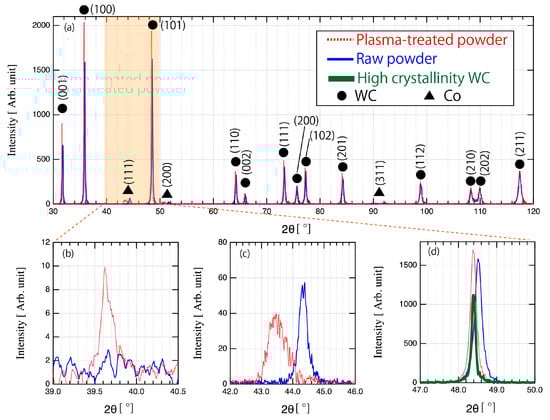
Figure 11.
XRD profiles of raw powder and plasma-treated powder at various diffraction angles: (a) 30 to 120°, (b) 39.0 to 40.5°, (c) 42.0 to 46.0°, and (d) 47.0 to 50.0°. Red dashed line, blue solid line, and green bold line indicate the plasma treated powder, the raw powder, and the high crystallinity WC powder, respectively.
Table 3.
Calculated lattice constants of the raw powder and the plasma-treated powder.
Microstrain and crystallite size were also analyzed from the XRD result using the Williamson–Hall plot shown in Figure 12. The red circles indicate the plasma-treated powder, while the blue triangles indicate the raw powder. According to Equation (2), the microstrain and crystallite size correspond respectively to the slope, ε, and intercept, α, of a linear approximation of the plot of K. The ε and α show smaller values in plasma-treated powder, than in raw powder. This decrease in ε and α implies that the crystallites of the plasma-treated powder are larger than that of raw powder, and that microstrain is lower. These results are also consistent with the consideration of plasma-treatment-related strain relaxation of the agglomerated powder. In other words, these results indicate that strain is relieved by the heat treatment and by the improved crystallinity through crystal growth.
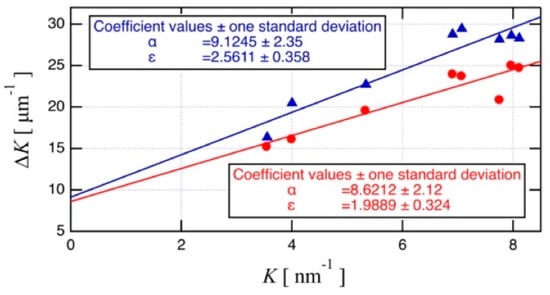
Figure 12.
Williamson–Hall plot for the plasma-treated powder (red circles) and the raw powder (blue triangles).
A W2C peak corresponding to 39.8° was observed after plasma treatment (Figure 11b). Although, the peak intensity was 0.005 times that of the WC(100) peak, with a W2C(002)/WC(100) area ratio of 0.0075. This result suggests that decarburization by plasma heating was minimal. Significant changes in the shape of the Co peak were also observed for plasma-treated powder. Figure 11c shows the Co peak observed around a 2θ/θ angle of 42°. In the plasma-treated powder, a broadening of the peak width and a shift of the peak position toward smaller angle measures were observed. Furthermore, the Co profile became slightly tailed in the direction of larger angle measures. Hence, plasma treatment may have caused a change in the crystal structure of Co or the formation of compounds composed of tungsten, cobalt, and carbon.
4. Discussion
4.1. Identification of Co Peaks
In XRD analysis, we observed peaks for WC, W2C, and Co on the XRD profile of the plasma-treated powder. In addition, the observed shape of the Co peak suggests the occurrence of compounds and transformation of Co crystal structure. It is known that α-Co, β-Co, and β-Co(WC) peaks occur within the 42–45° range, corresponding to compounds of W, Co, and C, namely Co6W6C and Co3W3C [14].
Systematic study of the effect of sintering temperature on phase composition was carried out by Kurlov et al. [15,16,17]. According to their data based on submicrocrystaline WC-submicropowder, the α-Co peak disappeared beyond a sintering temperature of 1070 K, while a β-Co peak appeared around a diffraction angle of 44°. In addition to the β-Co peak, a Co6W6C peak was also observed around a diffraction angle of 40–41° at a sintering temperature of 1070 K. When the sintering temperature increased to 1170 K, a new Co6W6C peak appeared around a diffraction angle of 44°. Furthermore, Co3W3C peaks appeared around diffraction angles of 40–40.5° and 42–43° with increasing sintering temperature. The β-Co(WC) solid solution peak also appeared in XRD patterns at sintering temperatures from 1370 to 1870 K. The β-Co(WC) peak shifted slightly to smaller diffraction angles than the β-Co peak because of dissolution in β-Co, which caused the lattice constants to increase.
Meanwhile, in the present study, no XRD peaks appeared around 40–40.5° or 42–43°. Based on this evidence, the plasma-treated WC powder is unlikely to harbor a Co3W3C phase. It also seems that Co6W6C is not contained in the Co peak observed in Figure 11b, given the absence of the Co6W6C peak around 40–41°, which would be expected to be observed along with the Co6W6C peak around 44°. Thus, α-Co, β-Co, and β-Co(WC) may be included in the Co peak. In order to identify these peaks, EBSD analysis was carried out, and the obtained phase map for plasma-treated powder is shown in Figure 13. Based on this WC phase map, WC hexagonal crystals are most abundant, and the abundance of cubic W2C crystals is very low in comparison. This quantitative trend in WC and W2C is consistent with the results obtained from XRD analysis. On the other hand, the phase map of Co indicate that the abundance of Co for cubic crystals is higher than that for hexagonal crystals. This result indicates that much of the α-Co observed in the XRD profile of the raw powder with hexagonal crystal structure was transformed into β-Co by plasma heating. Therefore, the small peaks in the Co-peak tail are likely those of α-Co based on the Co phase ratio results. On the other hand, the broad peak is inferred to represent β-Co(WC). It is known that the grain growth of cemented carbide is generally caused by Ostwald ripening [18]. According to Ostwald ripening, the dissolution of fine WC particles in liquid Co occurs during WC grain growth in re-melting and solidification processes. In fact, grain growth was observed in the present study as shown in Figure 5, suggesting the possible presence of dissolved WC in Co. This possibility would be expected to produce solid Co with a significant quantity of WC in solid solution, since the molten particles solidify rapidly outside the plasma. Therefore, the observed Co peak in this study is inferred to be a convolution of a small of α-Co peak and a broad β-Co(WC) peak.
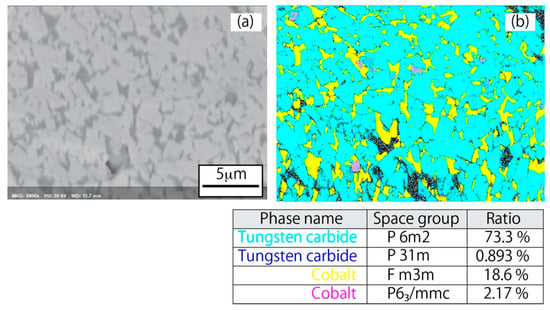
Figure 13.
(a) SEM picture; and (b) EBSD phase map of powder cross-section for the plasma-treated WC–12%Co powder.
4.2. Processing Behavior of Plasma-Treated Powder Particles
In this study, DC arc plasma treatment for agglomerated WC–Co powder was carried out, in order to reduce the defects inside individual powder particles, and to lend insight into the melting and solidification behavior of WC–Co powder under plasma treatment. Consequently, we have succeeded in forming WC–Co particles without significant defects and without decarburization. These results can be attributed to the very high wettability of WC and Co with 0° of contact angle, the difference in melting point between Co (1495 °C) and WC (2870 °C), and the equivalence of the melting point of WC and the boiling point of Co (2870 °C). The processing behavior of WC–Co is illustrated in Figure 14. The powder particles injected into the plasma are heated instantly, and the cobalt first melts due to the difference in their melting points. Since the wettability between WC and Co is 0°, the molten Co fills the gap between the WC particles, while wetting the surface of the WC particles. Then, the WC particles begin to melt when the Co and WC are heated to 2870 °C, which is the melting point of WC and the boiling point of Co. In this phase, some of the WC dissolves in the Co, and the grain growth of WC particles occurs as shown in Figure 5. Finally, the powder exiting the plasma is cooled rapidly and solidifies into a spherical, low-defect, high tensile strength solid powder.
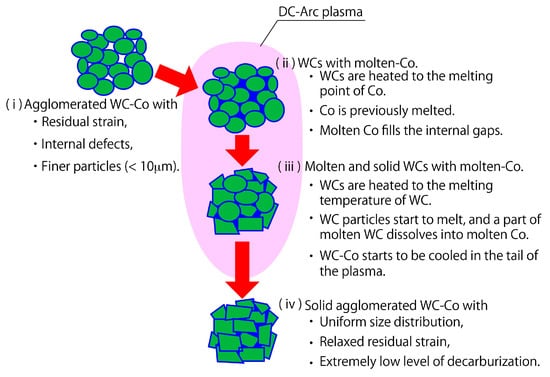
Figure 14.
Morphological changes of a WC-Co agglomerated powder during the plasma process.
In addition, we found that DC arc plasma treatment mitigates the strain of agglomerated powder particles. In these melting and solidification processes, heating of WC particles by the plasma and recrystallization of WC occurred simultaneously, leading to crystallite size increase and microstrain reduce as actually observed in plasma-treated powder. Apparently, plasma treatment can mitigate the strains in agglomerated powder particles while yielding WC powders of improved crystallinity.
4.3. Availability of Plasma-Treated Powder as Raw Material for Additive Manufacturing Technology
As mentioned in the introduction, powders for AM (additive manufacturing) processes require high sphericity, uniform particle distribution, and low-defect particle interiors. In particular, it has been reported that defects, such as porosity in the raw material powder can produce porosity in AM products, and destructive cracking can occur, due to the generated porosity [19,20]. Despite the typically numerous gaps it exhibits among primary particles (Figure 5 and Figure 7), agglomerated spherical powder remains widely used in the AM process for cemented carbides because of its high sphericity, high fluidity, and relatively high melting efficiency. As long as it continues to rely on raw WC agglomerated powder, the AM process will not be able to completely suppress the porosity and cracks caused by defects in the raw powder.
The results obtained in this study suggest that plasma treatment of agglomerated powders can produce powders with properties suitable for the AM process, while retaining the advantages of agglomerated powders. DC arc plasma treatment is expected to reduce the porosity in AM products by reducing the gaps occurring in the raw agglomerated powder. By effectively melting the cobalt, which is the binder material, a binder Co layer is efficiently obtained to fill in voids among WC particles, while suppressing decarburization by suppressing the equivalent heat input. Plasma treatment of raw powder is expected improve the mechanical properties of AM products, not only via porosity reduction, but also via an increase in the sphericity of particles and the alleviation of residual strain within individual powder particles. In future work, we plan to verify the effectiveness of plasma-treated powder use in the improvement of AM products’ mechanical properties by conducting a fabrication test of cemented carbide using the plasma-treated powder and investigating the physical properties of the fabricated objects in detail.
5. Conclusions
In this study, we carried out DC plasma treatment on agglomerated WC–Co powder, in order to obtain a low-defect powder and to gain insight into the melting behavior of WC–Co. We obtained the following results.
- (1)
- We succeeded in obtaining a low-defect powder of high sphericity with minimal decarburization.
- (2)
- Porosity reduction was found to proceed by filling of gaps among WCs by molten cobalt.
- (3)
- Concerns regarding the vaporization of cobalt and changes in WC–Co compositional ratios during high-temperature plasma treatment were found to be unwarranted, as defects in WC–Co were effectively reduced without significant change in the WC–Co chemical compositional ratio under the applied treatment conditions.
These findings demonstrate the effectiveness of DC arc plasma treatment as a technique for WC–Co powder applications.
Author Contributions
Conceptualization, H.I. and Y.F.; data curation, H.I.; formal analysis, H.I. and T.Y.; investigation, H.I. and T.Y.; methodology, H.I.; project administration, Y.F.; resources, T.Y., Y.Y. and J.Y.; Supervision, H.O.; Validation, H.I., H.O. and H.S.; Visualization, H.I. and T.Y.; Writing–original draft, H.I.; Writing–review & editing, H.I., H.O., H.S., T.Y., Y.Y., J.Y. and Y.F. All authors have read and agreed to the published version of the manuscript.
Funding
This research received no external funding.
Conflicts of Interest
The authors declare no conflict of interest.
References
- Cornwall, R.G.; German, R.M. WC-Co enjoys proud history and bright future. Metal Powder Rep. 1998, 53, 7–8. [Google Scholar]
- Gu, D.; Meiners, W. Microstructure characteristics and formation mechanisms of in situ WC cemented carbide based hardmetals prepared by Selective Laser Melting. Mater. Sci. Eng. A 2010, 527, 7587–7592. [Google Scholar] [CrossRef]
- Al-Aqeeli, N.; Saheb, N.; Laoui, T.; Mohammad, K. The synthesis of nanostructured WC-based hardmetals. J. Nanomater. 2014, 2014, 640750. [Google Scholar] [CrossRef]
- Kumar, S. Manufacturing of WC-Co moulds using SLS machine. J. Mater. Process. Technol. 2009, 209, 3840–3848. [Google Scholar] [CrossRef]
- Gu, D.; Shen, Y. Processing and microstructure of submicron WC-Co particulate reinforced Cu matrix composites prepared by direct laser sintering. Mater. Sci. Eng. A 2006, 435, 54–61. [Google Scholar] [CrossRef]
- Gu, D.; Shen, Y. WC-Co particulate reinforcing Cu matrix composites produced by direct laser sintering. Mater. Lett. 2006, 60, 3664–3668. [Google Scholar] [CrossRef]
- Gu, D.D.; Shen, Y.F.; Dai, P.; Yang, M.C. Microstructure and property of sub-micro WC–10%Co particulate reinforced Cu matrix composites prepared by selective laser sintering. Trans. Nonferrous Met. Soc. China 2006, 16, 357–362. [Google Scholar] [CrossRef]
- Ng, G.K.; Jarfors, A.E.; Bi, G.; Zheng, H.Y. Porosity formation and gas bubble retention in laser metal deposition. Appl. Phys. A 2009, 97, 641–649. [Google Scholar] [CrossRef]
- Itagaki, H.; Hirose, S.; Hanada, K. Spherical particles with and without attached nanoparticles formed by DC arc spheroidization of irregularly shaped stainless-steel powder. Jpn. J. Appl. Phys. 2020, 59, SJJG01-1–SJJG01-8. [Google Scholar] [CrossRef]
- Williamson, G.K.; Hall, W.H. X-ray line broadening from filled aluminium and wolfram. Acta Metall. 1953, 1, 22–31. [Google Scholar] [CrossRef]
- Cohen, M.U. Precision lattice constants from X-ray powder photographs. Rev. Sci. Instrum. 1936, 7, 155. [Google Scholar] [CrossRef]
- Cohen, M.U. Precision lattice constants from X-ray powder photographs. Rev. Sci. Instrum. 1935, 6, 68–74. [Google Scholar] [CrossRef]
- Yoshio, H.; Yukitoshi, O.; Hideo, K. Rapid Determination of the Tensile Strength of Rocks with Irregular Test Pieces. J. Min. Metall. Inst. Jpn. 1965, 81, 1024–1030. [Google Scholar]
- Kurlov, A.S.; Rempel, A.A. Effect of sintering temperature on the phase composition and microhardness of WC-8wt.% Co cementedcarbide. Neorg. Mater. 2007, 43, 602–607. [Google Scholar] [CrossRef]
- Kurlov, A.S.; Gusev, A.I. Tungsten Carbides, 1st ed.; Springer International Publishing: Cham, Switzerland, 2013; pp. 198–213. [Google Scholar]
- Kurlov, A.S.; Rempel, A.A. Effect of WC nanoparticle size on the sintering temperature, density, and microhardness of WC-8 wt.% Co alloys. Neorg. Mater. 2009, 45, 380–385. [Google Scholar] [CrossRef]
- Kurlov, A.S.; Gusev, A.I.; Rempel, A.A. Vacuum sintering of WC-8wt.% Co hardmetals from WC powders with different dispersity. Int. J. Refract. Metals Hard Mater. 2011, 29, 221–231. [Google Scholar] [CrossRef]
- Voorhees, P.W. Theory of Ostwald ripening. J. Stat. Phys. 1985, 38, 231–252. [Google Scholar] [CrossRef]
- Tammas-Williams, S.; Withers, P.J.; Todd, I.; Prangnell, P.B. The influence of Porosity on Fatigue Crack Initiation in Additively Manufactured Titanium Components. Sci. Rep. 2017, 7, 7308. [Google Scholar] [CrossRef] [PubMed]
- Yufan, Z.; Kenta, A.; Yohei, D.; Kenta, Y.; Akihiko, C. Significance of powder feedstock characteristics in defect suppression of additively manufactured Inconel 718. Addit. Manuf. 2020, 34, 101277. [Google Scholar]
© 2020 by the authors. Licensee MDPI, Basel, Switzerland. This article is an open access article distributed under the terms and conditions of the Creative Commons Attribution (CC BY) license (http://creativecommons.org/licenses/by/4.0/).