Article

Characterization of Hot Deformation Behavior and Dislocation Structure Evolution of an Advanced Nickel-Based Superalloy

1
High Temperature Materials Research Labs, School of Material Science and Engineering, University of Science and Technology Beijing, Beijing 100083, China
2
Fracture and Reliability Research Institute, Tohoku University, 6-6-11 Aza-Aoba, Aramaki, Aoba-ku, Sendai 980-8579, Japan
*
Author to whom correspondence should be addressed.
Metals 2020, 10(7), 920; https://doi.org/10.3390/met10070920
Submission received: 16 June 2020 / Revised: 24 June 2020 / Accepted: 4 July 2020 / Published: 9 July 2020
(This article belongs to the Special Issue Advances in Superalloys and High Temperature Intermetallics)

Abstract

:
The hot deformation behavior of an advanced nickel-based Haynes282 superalloy was systematically investigated employing isothermal compression tests in the sub-solvus and super-solvus temperature with various strain rates. The influence of deformation temperature and strain rate on the microstructure was studied by transmission electron microscope. The results reveal that the interaction between work hardening and dynamic softening did not reach equilibrium under lower deformation temperature and higher strain rate. The active energy of alloy is around 537.12 kJ/mol and its hot deformation constitutive relationship equation was expressed. According to the processing map and microstructure observations, two unsafe flow instability domains should be avoided. The optimum hot processing condition for homogeneous and fine dynamic recrystallization grains are obtained. TEM micrograph observations indicated that deformation temperature and strain rate affected recrystallization by affecting the evolution of dislocation substructures within the alloy. The nucleation and growth of DRX grains can be promoted by the relatively high deformation temperature and low strain rate. The main mechanism of dynamic recrystallization nucleation preferred to discontinuous dynamic recrystallization and the typical feature of discontinuous dynamic recrystallization showed grain boundary migration nucleation. The findings improve the understanding of hot deformation behavior and dislocation substructures evolution of the superalloy, which benefits the accurate control of microstructures of nickel-based superalloys, and tailors the properties of final components used in the land-based gas turbine.

1. Introduction

As an advanced wrought nickel-based superalloy strengthened by precipitation of the γ’ phase, HAYNES 282 (hereinafter referred to as HY282) alloy possesses excellent high temperature strength with good fabricability. Several Ni-based superalloys, such as Waspaloy, Rene’41, and Inconel 740H, are widely used in key components of aero engine and gas turbine due to their excellent mechanical properties and high resistance to oxidation/corrosion, while they have fabricability problems [1]. Recently, the development of heavy-duty gas turbine, spaceflight and aviation technology has put forward strict requirements on the comprehensive performance of combustor and burning cylinders [2,3]. Thus, HY282 alloy was designed in the form of a thin strip to meet the performance requirements at higher operating temperatures. Obtaining uniform fine grains during hot working is one of the ultimate goals to improve the stability and strength of HY282 alloy thin strip. Although Haynes International developed the HY282 alloy, its deformation behavior combined with microstructure evolution has not been systematically reported until now.
In recent years, much research has been done on the determination of the processability and the optimal deformation parameters of nickel-based superalloys [3]. Under investigation, the true stress-true strain curves and the constitutive modeling equations are often used to explain hot deformation behaviors of superalloys [4,5]. The power dissipation map, instability map, the combined processing map and microstructure evolution at different temperatures and strain rates were studied to find out the instability problems represented by an adiabatic shear band and wedge cracking. However, as an advanced HY282 alloy, the research on the optimized hot working parameters and the relationship between dislocations features and the deformation mechanism has rarely been reported.
In this work, the isothermal compression test of HY282 alloy was performed in a wide range of temperatures and strain rates. Based on this, the deformation parameters that are more suitable for the alloy composition can be determined, thereby generating the ideal microstructure. The hot deformation behavior was investigated by analyzing true stress-true strain curves, establishing the constitutive equation and processing maps. Then, examination of the microstructure was conducted by optical microscopy (OM) and transmission electron microscopy (TEM). Further, the optimized hot working parameters were obtained, and the mechanism of dynamic recrystallization behavior was discussed. The results will be useful for precise preparation of HY282 alloy to be thoroughly applied in the heavy duty gas turbine industry, and so on.

2. Materials and Methods

2.1. Materials

As received composition of HY282 alloy is shown in Table 1. The experimental alloy was formed by vacuum induction melting and vacuum arc remelting processes and then subsequently hot-forged into a 15-cm diameter cylinder billet. The compressive test used cylindrical specimens with a diameter of 10 mm and a length of 15 mm were cut from the billet by an electric discharge wire cutting method.

2.2. Methods

Cylindrical samples with a diameter of 10 mm and a length of 15 mm were isothermally compressed by a Gleeble-3800 thermo-mechanical simulator (DSI, Poestenkill, NY, USA) over a range of temperatures and strain rates. The specific hot-deformation conditions of as-received samples were summarized in Table 2. The samples were rapidly heated up to the target temperature at a rate of 10 °C/s and held for 5 min before deformation to eliminate the temperature gradient. Then, in order to keep the deformed microstructures, these specimens were immediately compressed axially to a maximum true strain of 0.7 (by control its engineering strain 50%) and then water quenched. After deformation, these specimens were sectioned hallway through to the centers and parallel to the compression axis for recrystallized grains and dislocations analysis.
The grain microstructure evolution at various hot-deformation conditions was thoroughly characterized by using OM (CARL ZEISS, Oberkochen, Germany). After the standard preparation, these specimens for OM observation were etched for 4–8 min with a solution consisting of 2.5–4.5 g KMnO4 + 10–15 mL H2SO4 + 90–100 mL H2O at 100 °C. To investigate the interrelationship between the dislocation substructure and the DRX nucleation mechanism in the hot-deformed samples, the transmission electron microscope (TEM) was employed with FEI TECNAII G2-F20 (JEOL, Tokyo, Japan) equipment. Thick foils with 5 mm diameter were firstly machined form the previously deformed specimens, and then ground into 50–60 μm thin foils. Subsequently, small discs with 3 mm diameter were punched out from the thin foils by grounding deformation specimens, and electro-polished using a solution of 4–8% HClO4 + 80% C2H5OH.

3. Results and Discussion

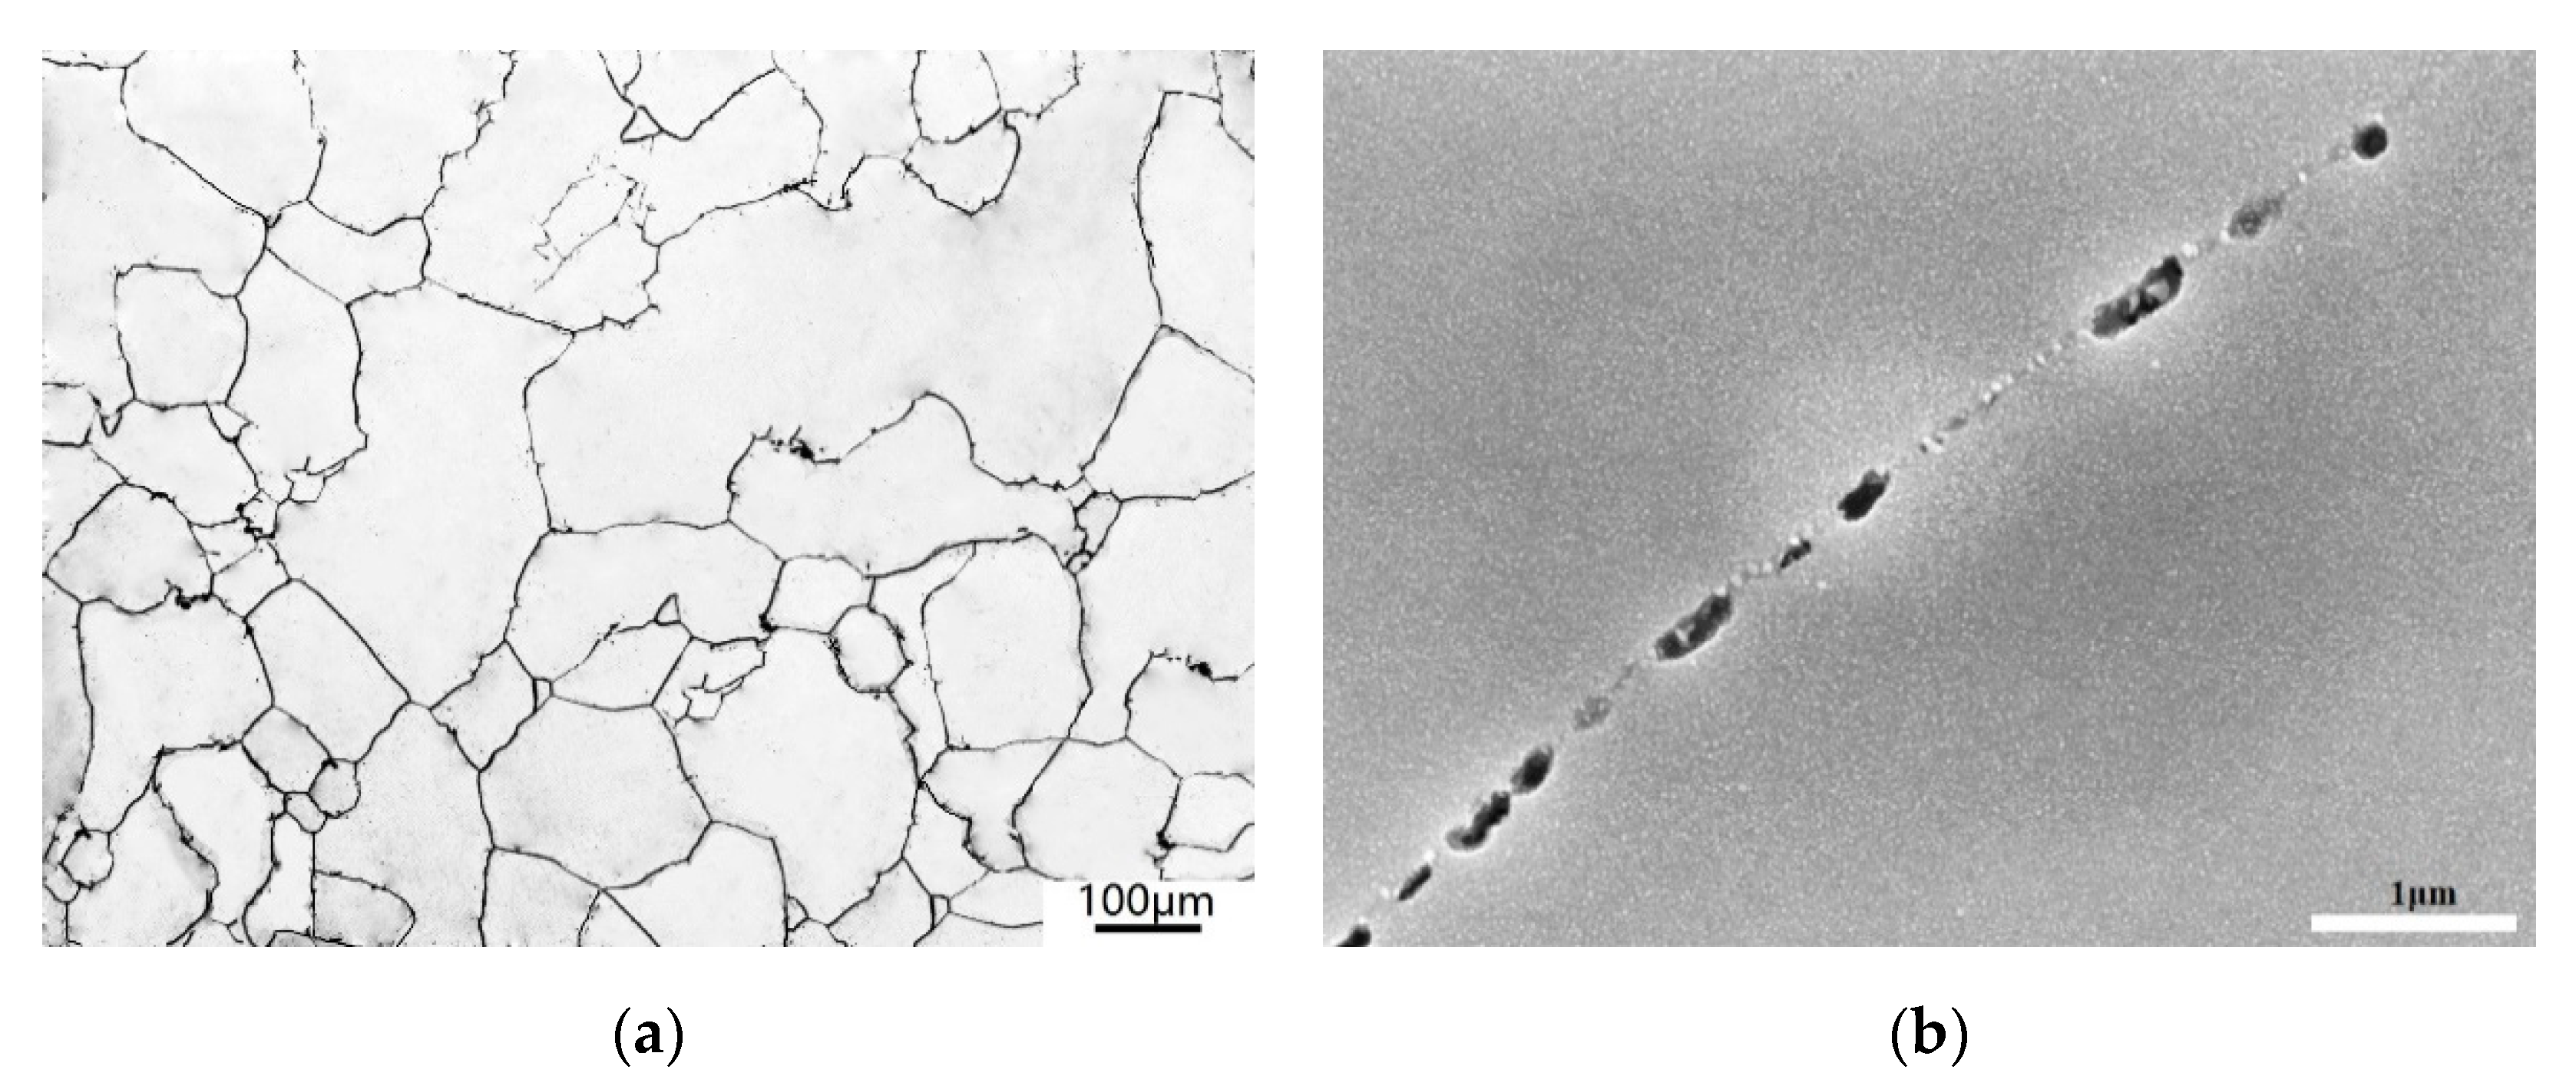
3.1. Initial Microstructure
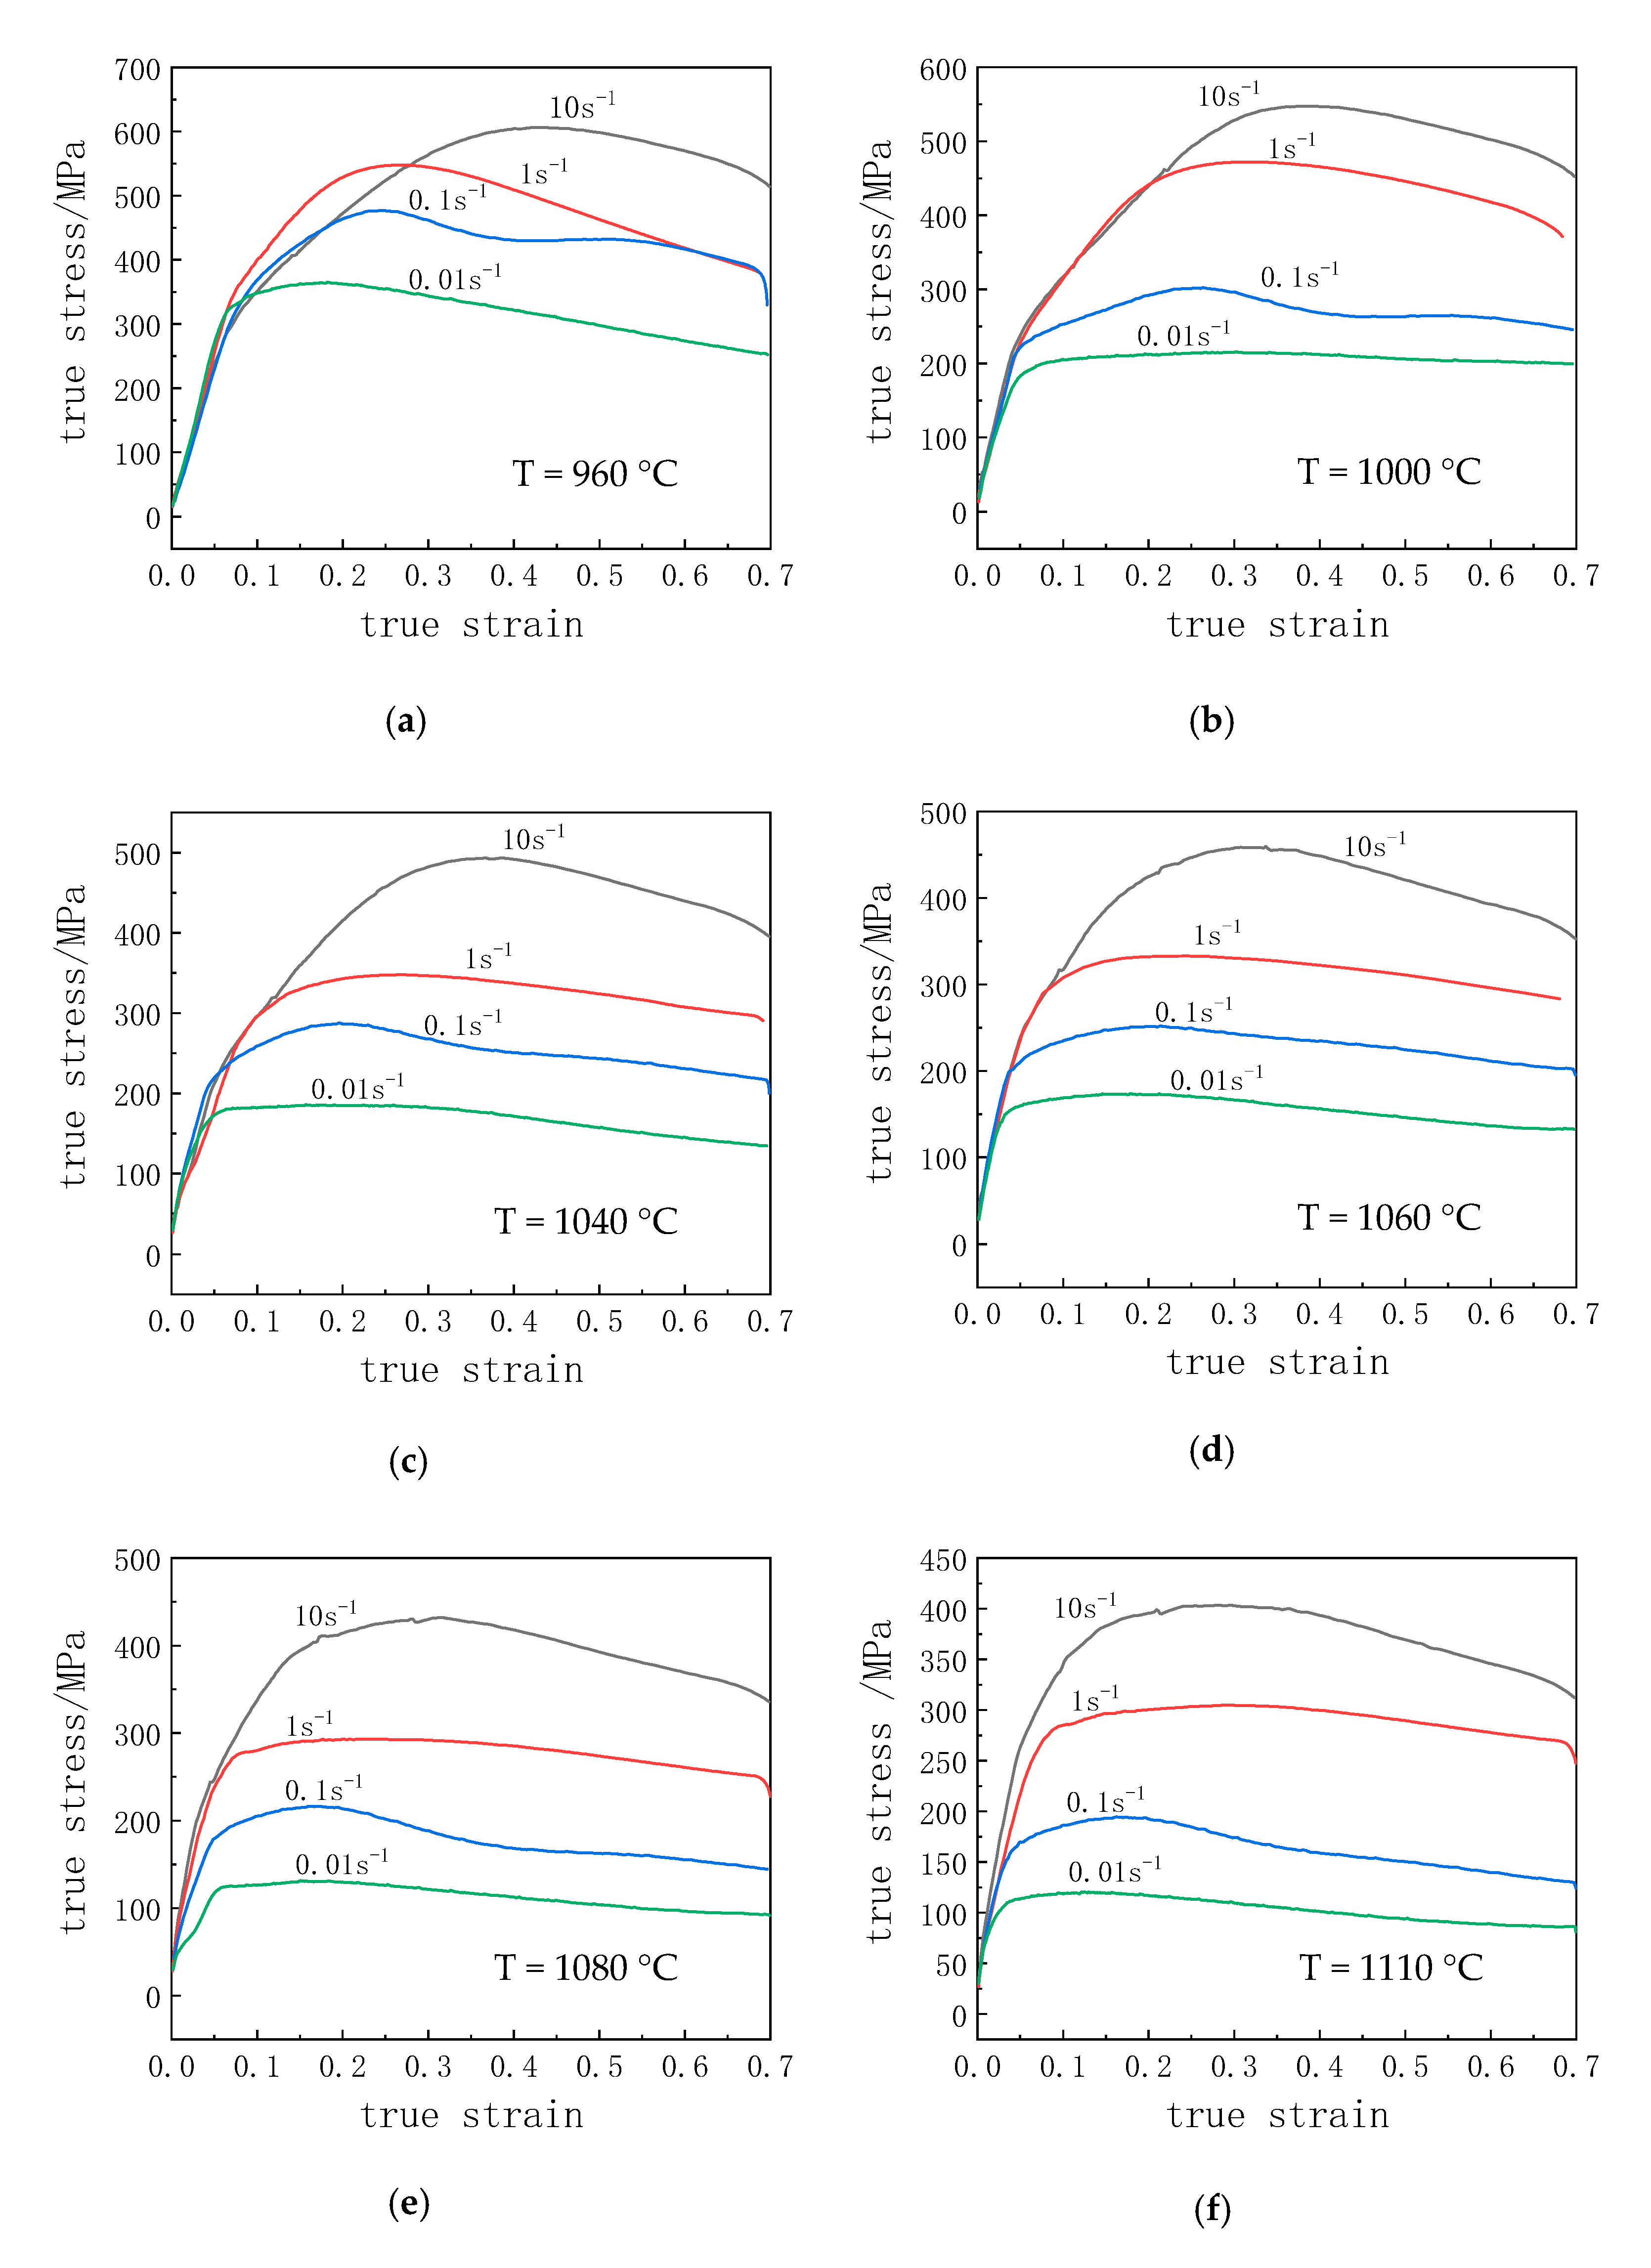
As shown in Figure 1a, the initial microstructure of HY282 alloy before hot compression mainly consists of equiaxed grains with a mean grain size of about 120μm (corresponding to ASTM No. grain grade = 3). Further scanning electron microscope (SEM) observation of the sample in Figure 1b showed that black block carbides were clustered along the grain boundaries in the alloy, and the circular γ´ phase was uniformly dispersed in the matrix.

3.2. Flow Behavior

Figure 2 shows the typical flow curves of HY282 alloy at various test conditions from 960 to 1180 °C. The temperature range should be enough to get a response from the whole deformation in practice production. The curves at strain rates less than about 1 s−1 are consistent with the generally reported behavior of other nickel materials under hot deformation process. The flow stress increased rapidly to a peak value, and then gradually decreased until it reached a relatively stable state under larger strain. The reason why the curve reaches a steady state is that the interaction between work hardening and dynamic softening reaches equilibrium. This is a typical characteristic of dynamic recrystallization under hot deformation conditions [6]. Either at the strain rate of 10 s−1 or the temperature of 960 °C, the flow curve after peak stress showed a continuous downward trend. However, when the strain is close to 0.7, the flow stress tends to be steady after reaching its peak under other deformation conditions. Flow curve instability indicates incomplete dynamic recrystallization under low temperature and high strain rate conditions [7].
Under the same strain rate, the peak stress decreased with an increasing deformation temperature. Some literature similarly reported that the average kinetic energy of atoms and the critical cutting stress governed by a crystal slip could be reduced at higher deformation temperature, which led to the decrease of dislocation density and offset of work hardening [8]. Besides, the peak stress increases with an increasing strain rate at the same temperature. The reason for this was that the formation of dislocation structure accelerates due to increased strain rate, and the force between atoms and dislocation rapidly forms the internal stress field and energy barrier, which leads to the rapid accumulation of strain energy. Furthermore, the reduction of deformation time is not conducive to the complete carrying of the intergranular slip, dislocation movement, slip from unfavorable orientation to favorable orientation, and diffusion creep. Meanwhile, as the strain rate increases, the plastic deformation in the alloy cannot be fully developed [9].

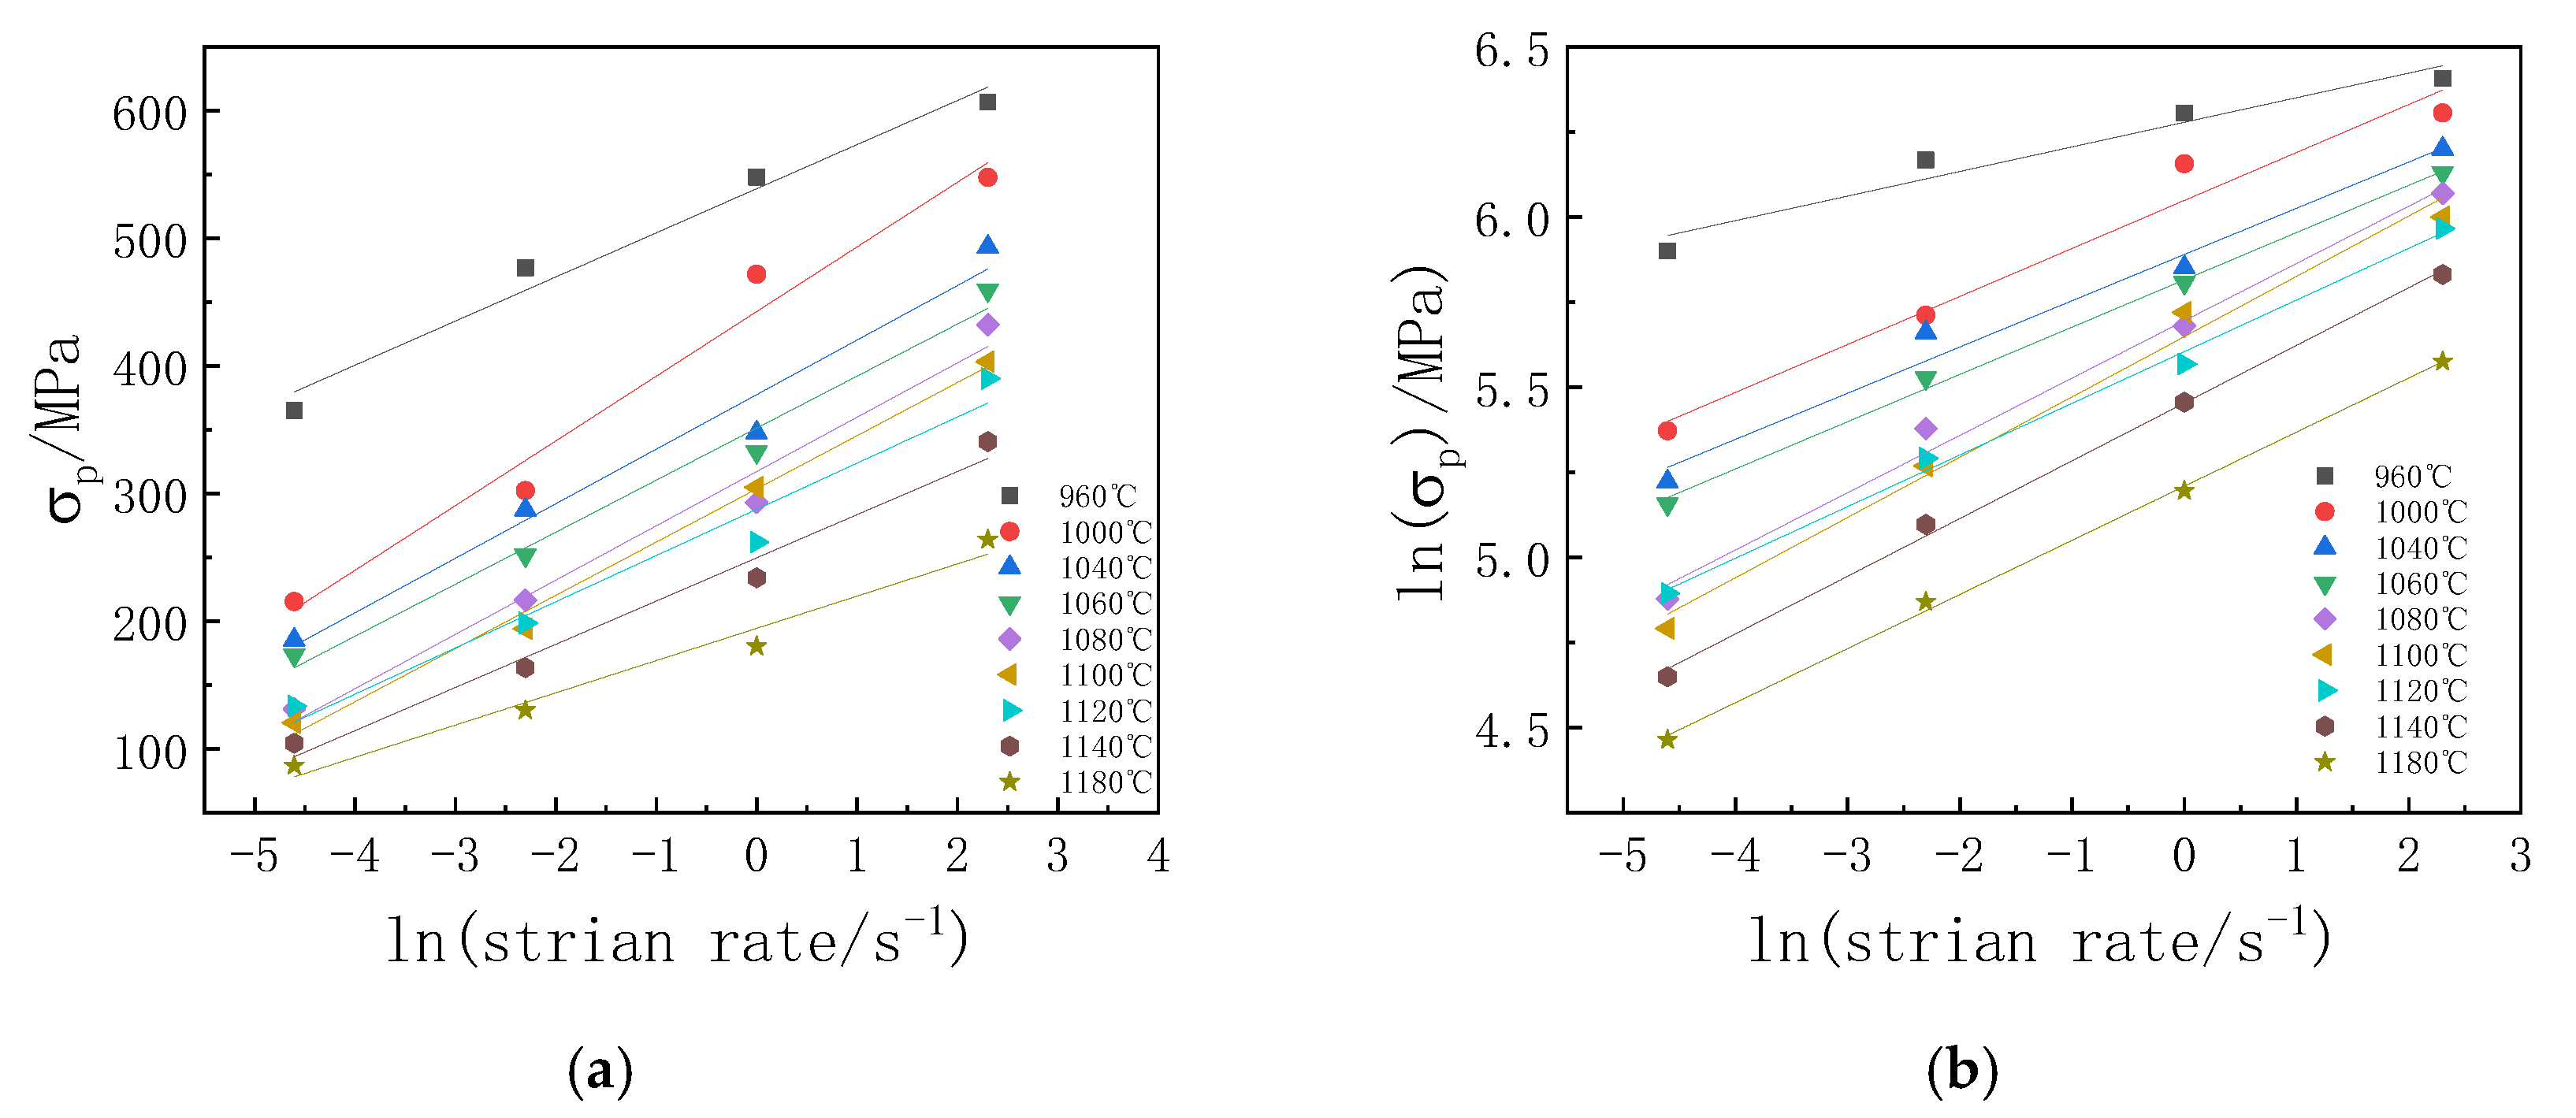
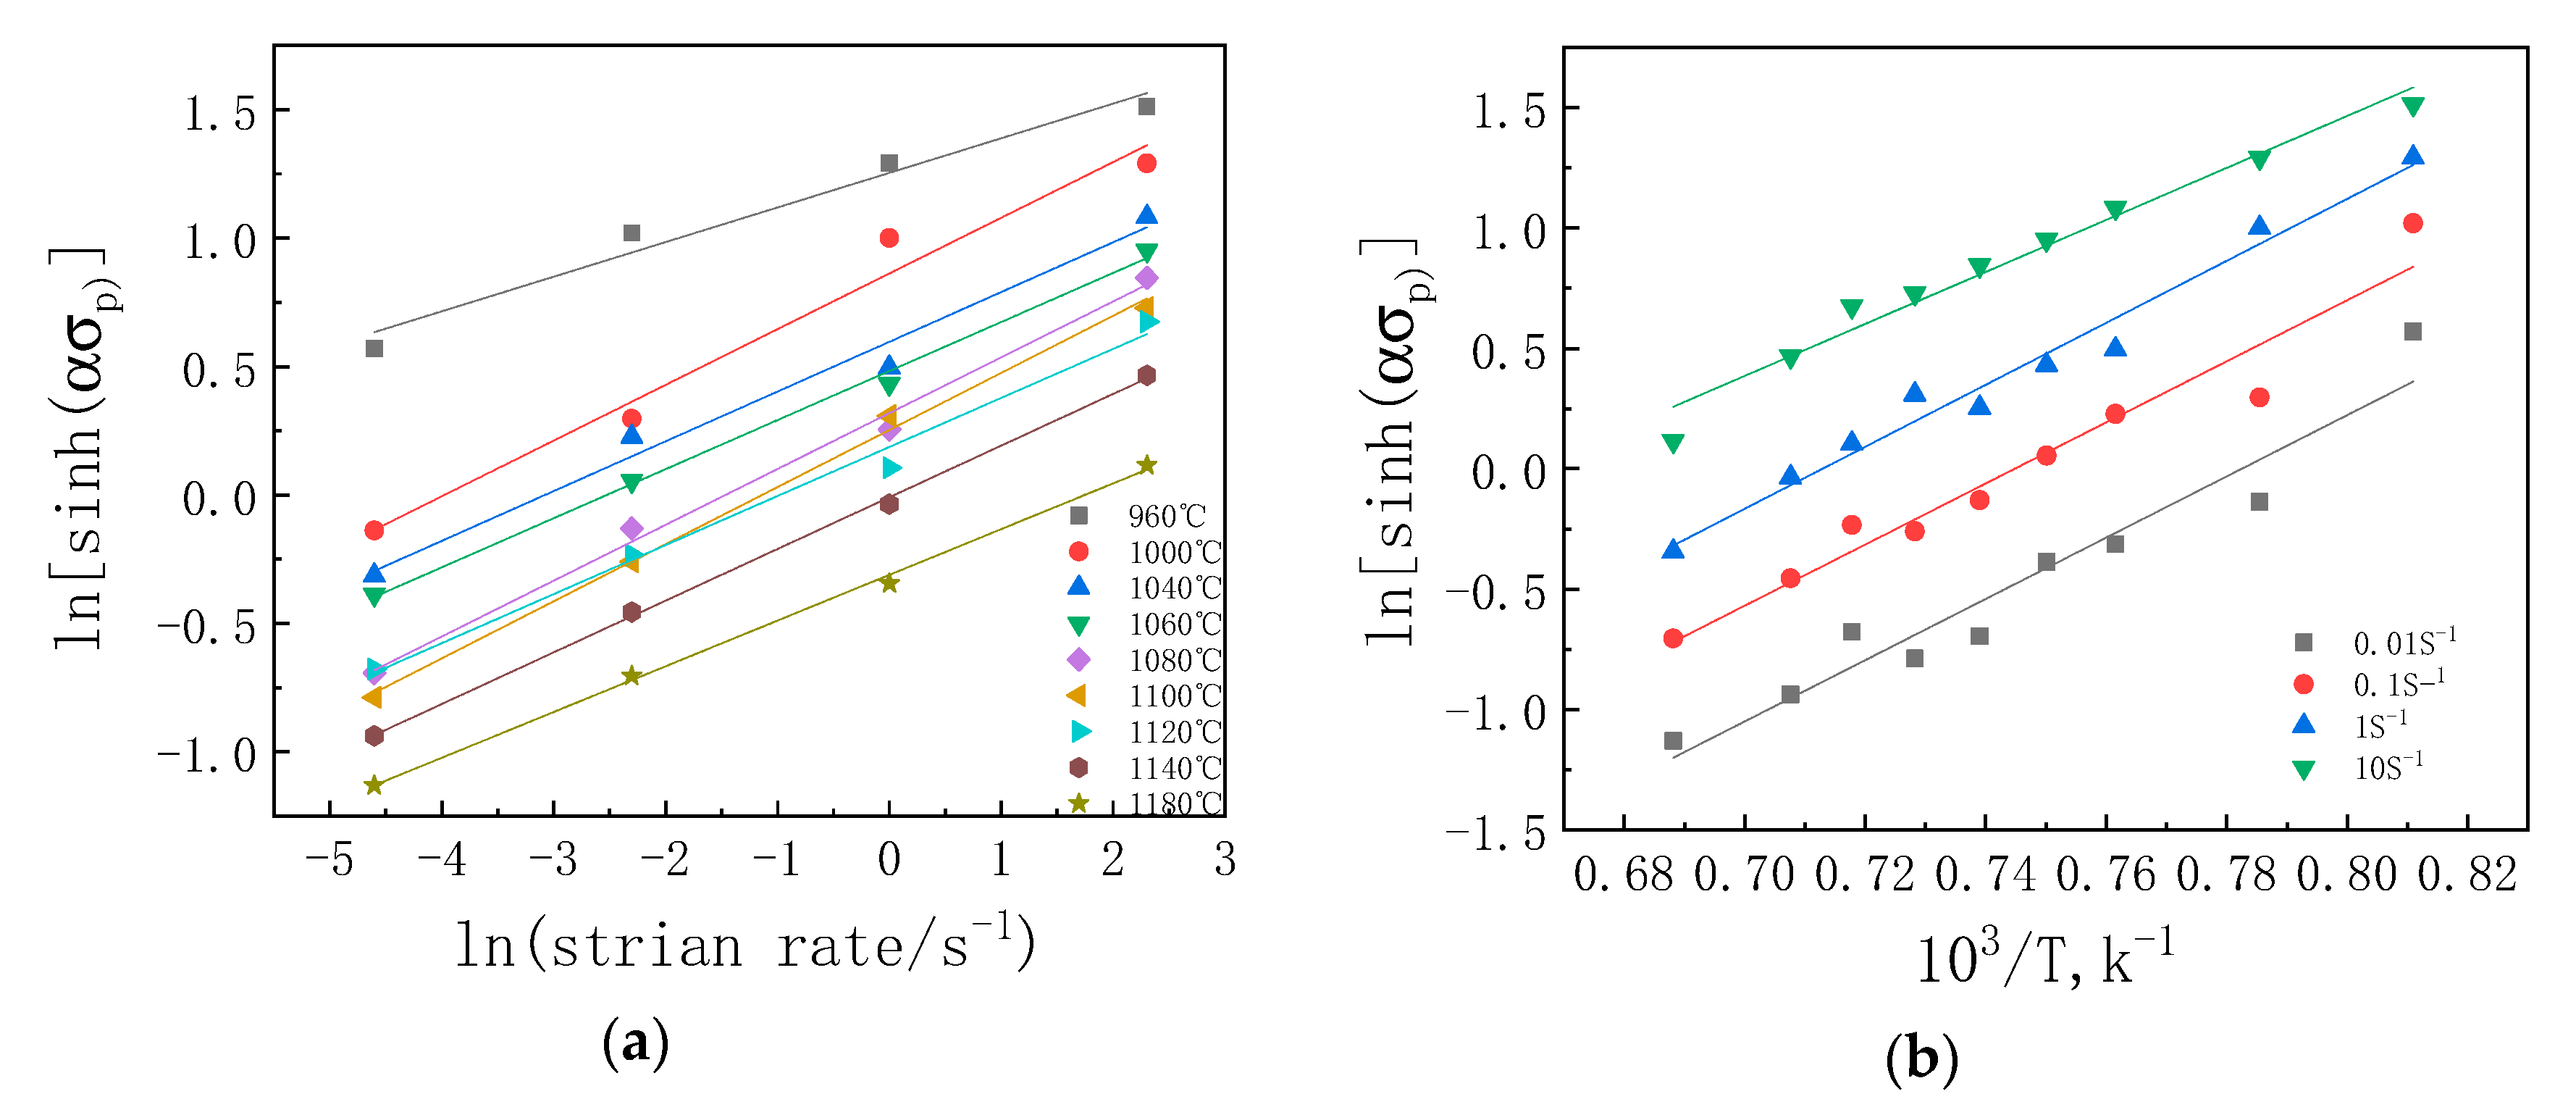
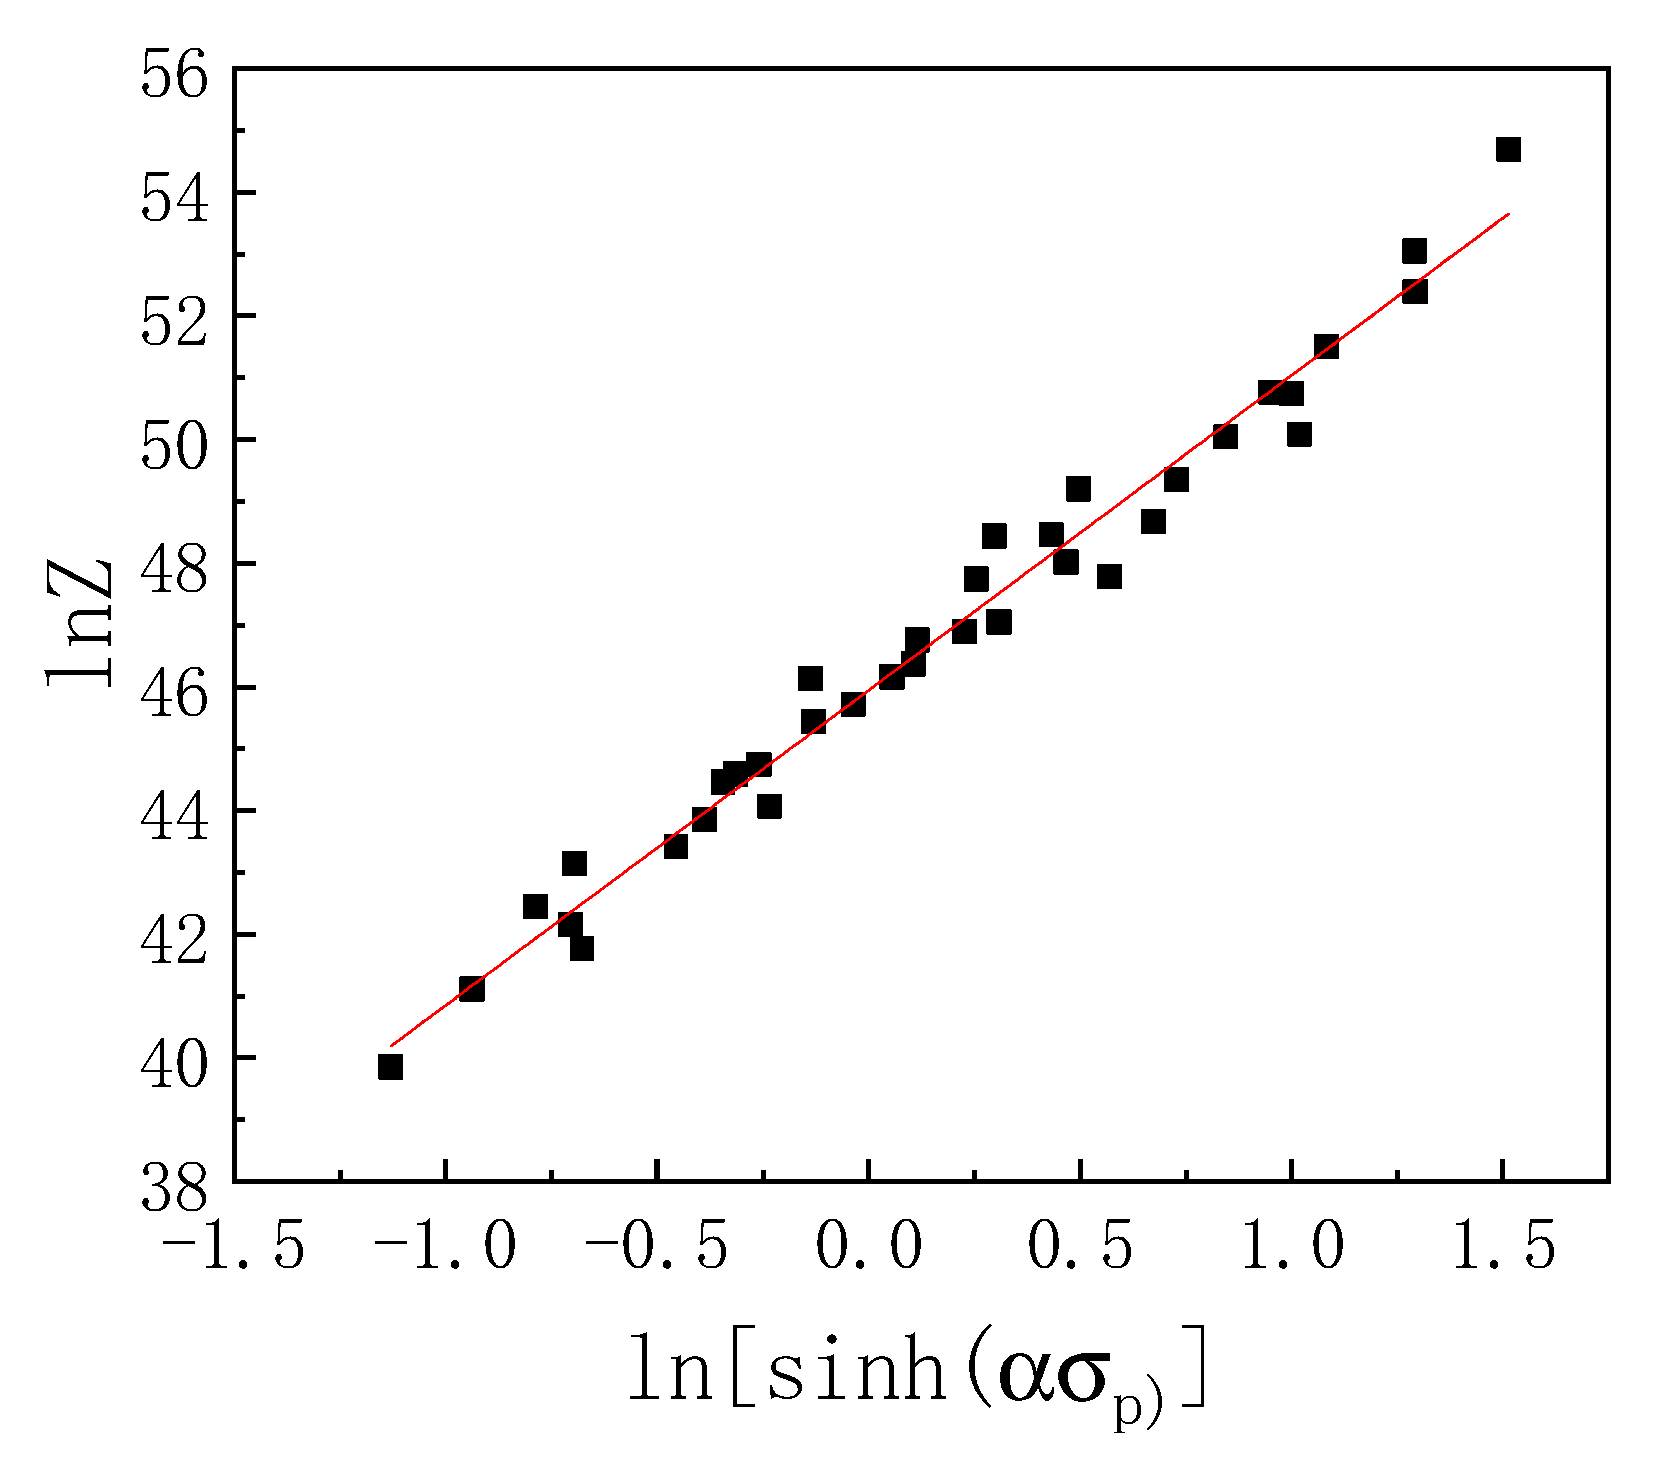
3.3. Constitutive Equation

To reveal the relationship between stress and deformation conditions, the Arrhenius equation was applied to describe the relationship between temperature, strain rate, and flow stress [10]:
ε ˙ = A F ( σ ) exp ( Q R T )
F ( σ ) = { σ n 1 exp ( β σ ) sinh ( α σ ) n α σ < 0.8 α σ > 1.2 f o r a l l σ
Generally, the kinetics of dynamic recrystallization (DRX) of Ni-based superalloy were influenced by deformation temperature and strain rate, the Zener Hollomon parameter (Z) was extensively employed to interpret the effects of temperature and strain rate on the flow stress [11]:
z = ε ˙ exp ( Q R T )
The variables in Equations (1)–(3) were defined in Table 3. The variations of peak stress with deformation temperature and strain rate are shown in Figure 3. The values of the A and α in Table 2 are the material constants, and Q can be acquired by regression analysis. The average slopes of the lines in Figure 3a,b were calculated by linear fittings to get the values of β = 0.02677 and n1 = 7.31945, and then α = 0.00366 was deduced. Based on the intercepts and slopes of the lines in Figure 4, the calculated values of n and Q are as follows: n = 5.26 and Q = 537.12 kJ/mol, respectively. It must be pointed out that the changes in the slopes of the curves indicate that different deformation mechanisms exist in the area. Figure 5 shows a good linear correlation between the Z parameters and the peak stress with a high regression coefficient R2 = 0.97813. The intercept of the line in Figure 5 (ln A) is calculated to be 45.95 by fitting the data, and then A = 9 × 10¹⁹ is obtained. Finally, the hot deformation constitutive equation of HY282 alloy could be expressed as:
ε ˙ = 9 × 10 19 [ sinh ( 0.00366 σ ) ] 5.26 exp ( 537.13 R T )

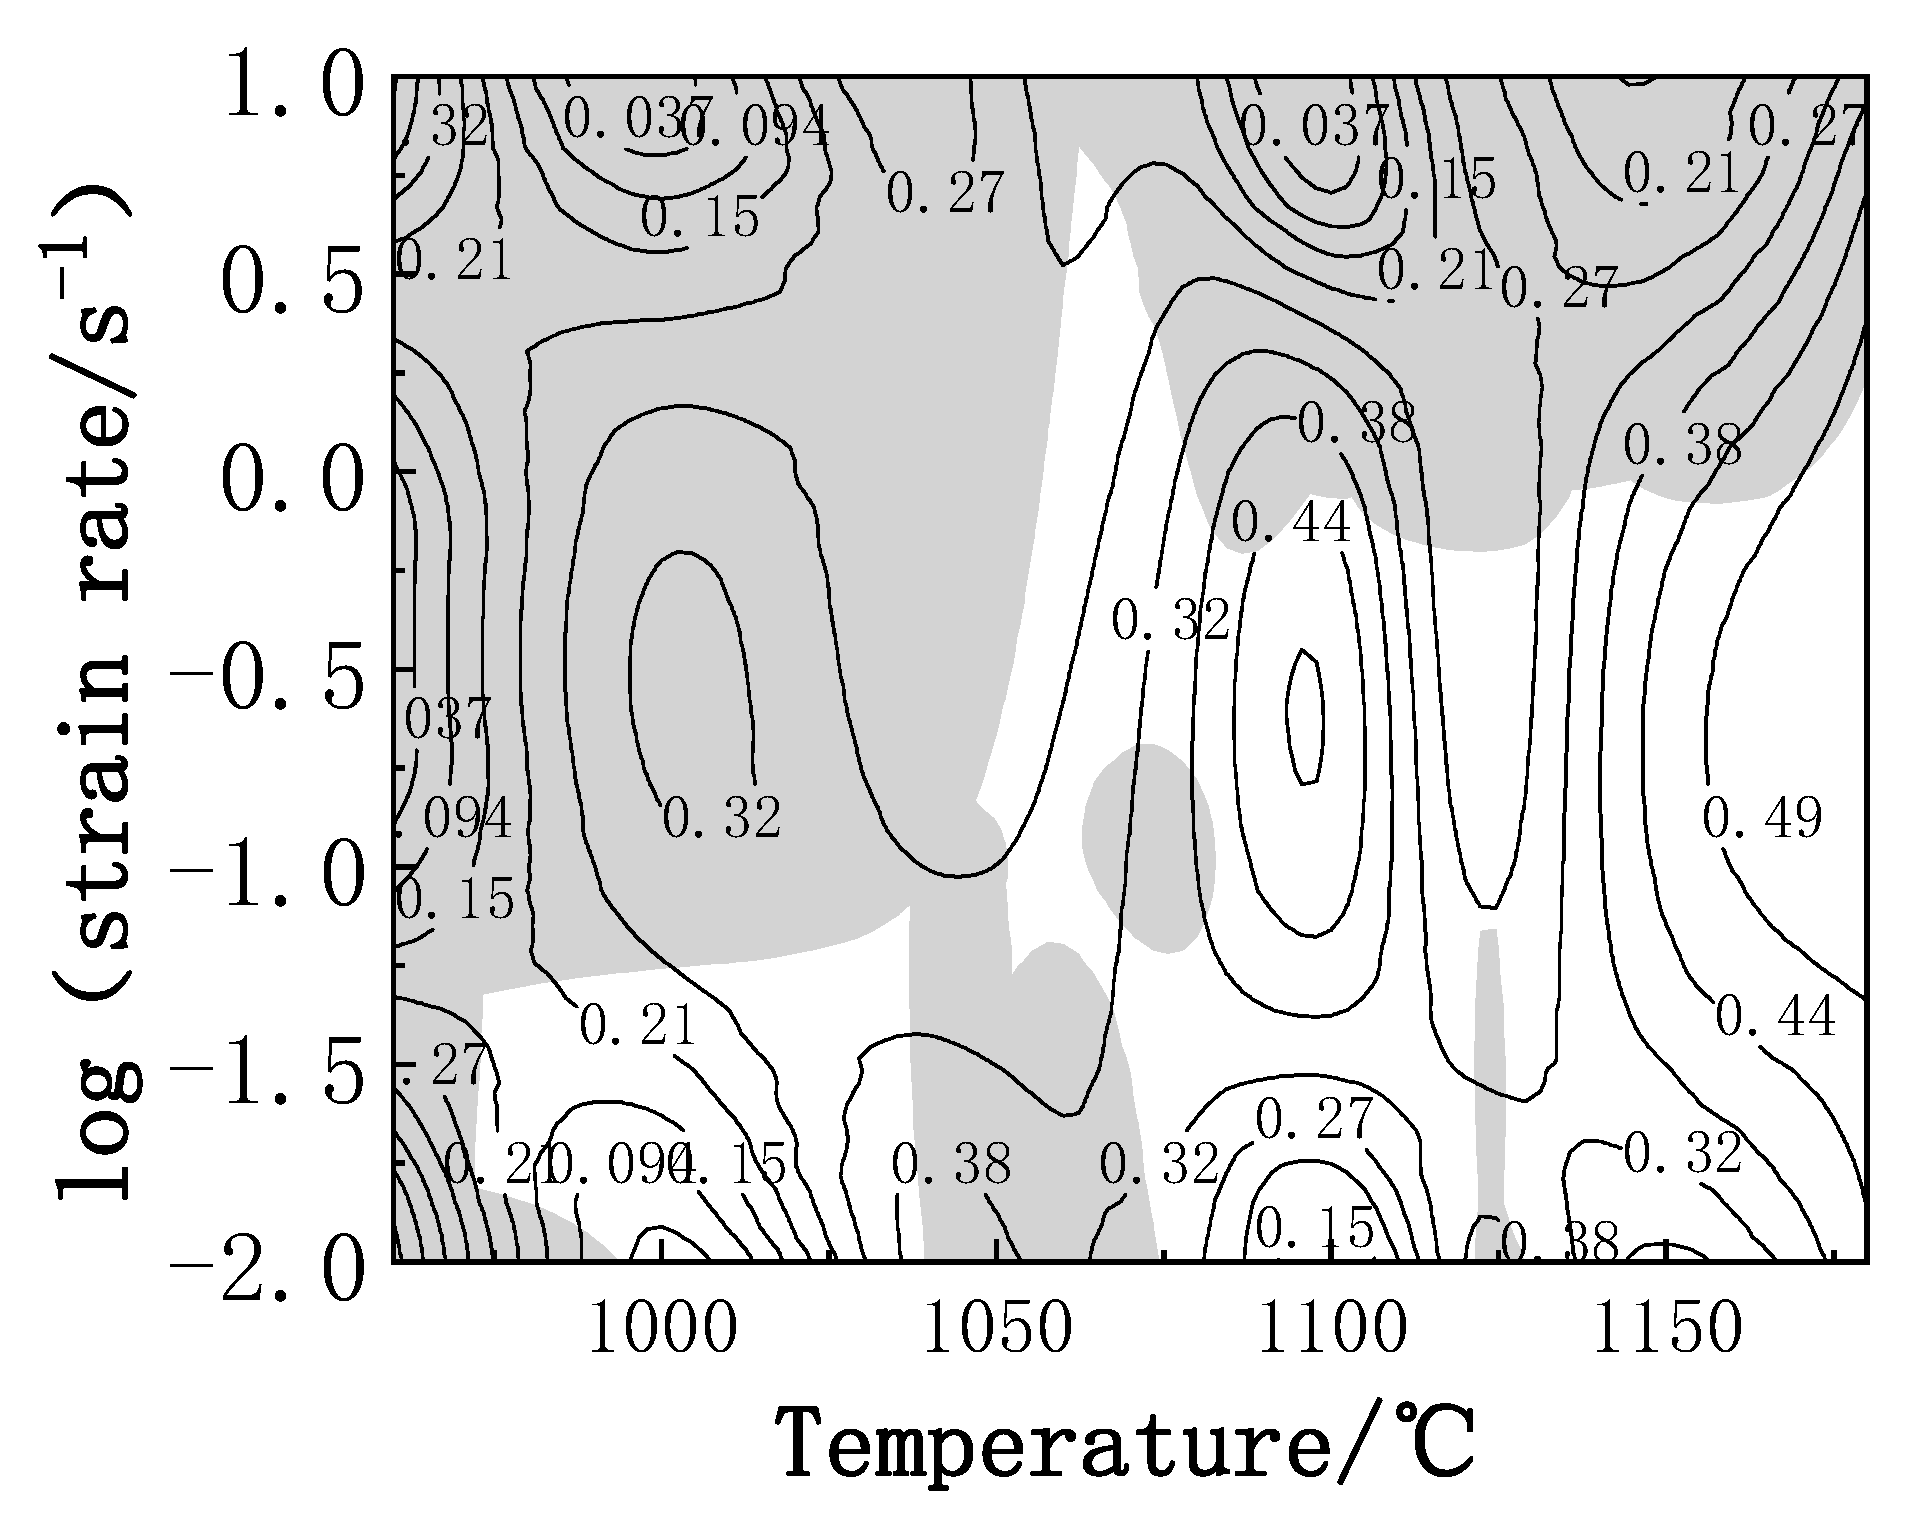
3.4. Characterization of Processing Map

Combining with the evolution of microstructure, we have built a series of processing maps based on the dynamic material model developed by Prasad et al., in which they described the dynamic material model in detail. According to the models, the workpiece was regarded as an energy dissipative system, and the instantaneous power P was dissipated through temperature rising (G content) and microstructure evolution (J co-content). Therefore, the total absorbed power P can be determined as [12,13,14]:
P = σ ε ˙ = G + J = 0 ε ˙ σ d ε ˙ + 0 σ ε ˙ d σ
The introduction of the power dissipation efficiency (η) determined by the strain rate sensitivity can reflect the ratio of the power needed for the microstructural evolution:
η = J J max = 2 m m + 1
The value of m is defined as the following equation:
m = J G = ( log σ ) ( log ε ˙ )
The value of η varies with the deformation temperature and the strain rate, which reflects the power dissipation rate. Meanwhile, for distinguishing the flow instabilities domains, an instability criterion was proposed by Prasad as follows [14]:
ξ ( ε ˙ ) = ln [ m m + 1 ] ln ε ˙ + m < 0
When ξ ( ε ˙ ) < 0 , the workpiece will enter a state of instability, and the flow instability can be predicted to take place, such as flow localization, adiabatic shear band and wedge cracking. Superimposing the instability map on the power dissipation map can generate a processing map. Based on superalloy hot working processes, the processing maps could aid design and control to optimize workability and to get the desired microstructure [14,15].
The processing maps of HY282 alloy deformed at the different strains of 0.2, 0.4, 0.6 and 0.7 are shown in Figure 6a–d, respectively. The η value is a percentage of the numerical on contours, while the shaded areas represent the flow insecurity domain. It can be seen that the power dissipation efficiency is very sensitive to strain, forming temperature and strain rate. The distribution characteristics of the power dissipation are similar, but the location and area of the shaded domains are changing continuously with strain. Obviously, no matter how much true strain is, there is always a flow instability domain located at the temperature of 960–1050 °C and a strain rate of 1–10 s−1. A void formed inside the alloy when it was deformed at low temperature and high strain rate regions, and many dislocations were accumulated around the solute atoms. Then, the stress field immediately generated by the high dislocation density caused the interfacial lattice distortion, resulting in stress concentration. Moreover, the dislocation pile-up could not be mutually canceled by dislocation climb and cross-slip in time, which further caused the interfacial lattice distortion. When the stress intensity exceeds the alloy strength, recrystallization cracks will occur, causing the alloy to fracture [16]. It is also reported that the instability of the matrix is related to the incompletely recrystallized structure, and the non-uniformly deformed structure easily becomes the site of defect initiation [17].
For nickel-based alloy, the efficiency of power dissipation between 30% and 40% corresponds to dynamic recrystallization, and the efficiency of power dissipation between 20% and 30% corresponds to dynamic recovery [18]. When the strain was 0.2, the flow instability regions consisted of two parts: one was in the low-temperature region, and the other one was in high strain rate region. In this case, the driving force of the internal dislocation motion of the alloy may be insufficient due to the slight strain, so the flow instability regions are located in the low-dissipation zone. Besides, there was a dynamic recovery zone 1 with the η value of 0.29 and a dynamic recrystallization zone A with the η value of 0.34. The reason why the dissipated power in zone 1 was relatively low was that the deformation mechanism was mainly based on the base slip at low temperature, and only a few cylinder slips and cone slip were driven in a favorable orientation, resulting in low recrystallization power. When the strain increased to 0.4, as shown in Figure 6b, the number of flow instability regions increased to five, and the total dissipated power increased. Two stable regions with greater efficiency of power dissipation occurred in the strain rate range of 0.01–0.3 s−1 and the temperature range of 1000–1020 °C and 1120–1150 °C. At the strain of 0.6, as shown in Figure 6c, the instability regions were concentrated in the high strain rate of 1–10 s−1, which was divided into three different regions: low-temperature range of 980–1020 °C, medium temperature range of 1075–1100 °C and high-temperature range of 1140–1180 °C. Two small domains with a high η value of 0.31 appeared on both sides of the shaded area in the upper left corner. The reason for this was that the storage energy accumulated in the alloy for the dynamic recrystallization nucleation was accompanied by an increase in strain [19]. At the stain of 0.7, as shown in Figure 6d, it can be seen from the flow curve as shown in Figure 2 that the equilibrium between work hardening and dynamic softening has been reached and two instability domains were observed in the processing map: the first flow instability domains occurs around 960–1160 °C/0.3–10 s−1; the secondary flow instability domains occurs around 1040–1175 °C/0.01–0.1 s−1. Also, it revealed a greater efficiency of power dissipation around 1150–1180 °C/0.01–0.1 s−1, with a peak η value of 0.49 at 1160 °C and 0.1 s−1, which can be regarded as a safe region for the hot working process.
All processing maps at different strains should be considered due to the continuous hot working process. The processing maps under all different strains can be superimposed to get a comprehensive map, as shown in Figure 7. It predicts two instability domains: domain 1 occurred around 960–1050 °C/0.1–10 s−1 and 1075–1180 °C/1–10 s−1; domain 2 occurred around 1035–1075 °C/0.01–0.1 s−1. To avoid potential deformation defects, hot working is not recommended in the above areas of instability. Xiong and Zhou et al. also used a similar method to research the instability of other alloys [19,20].

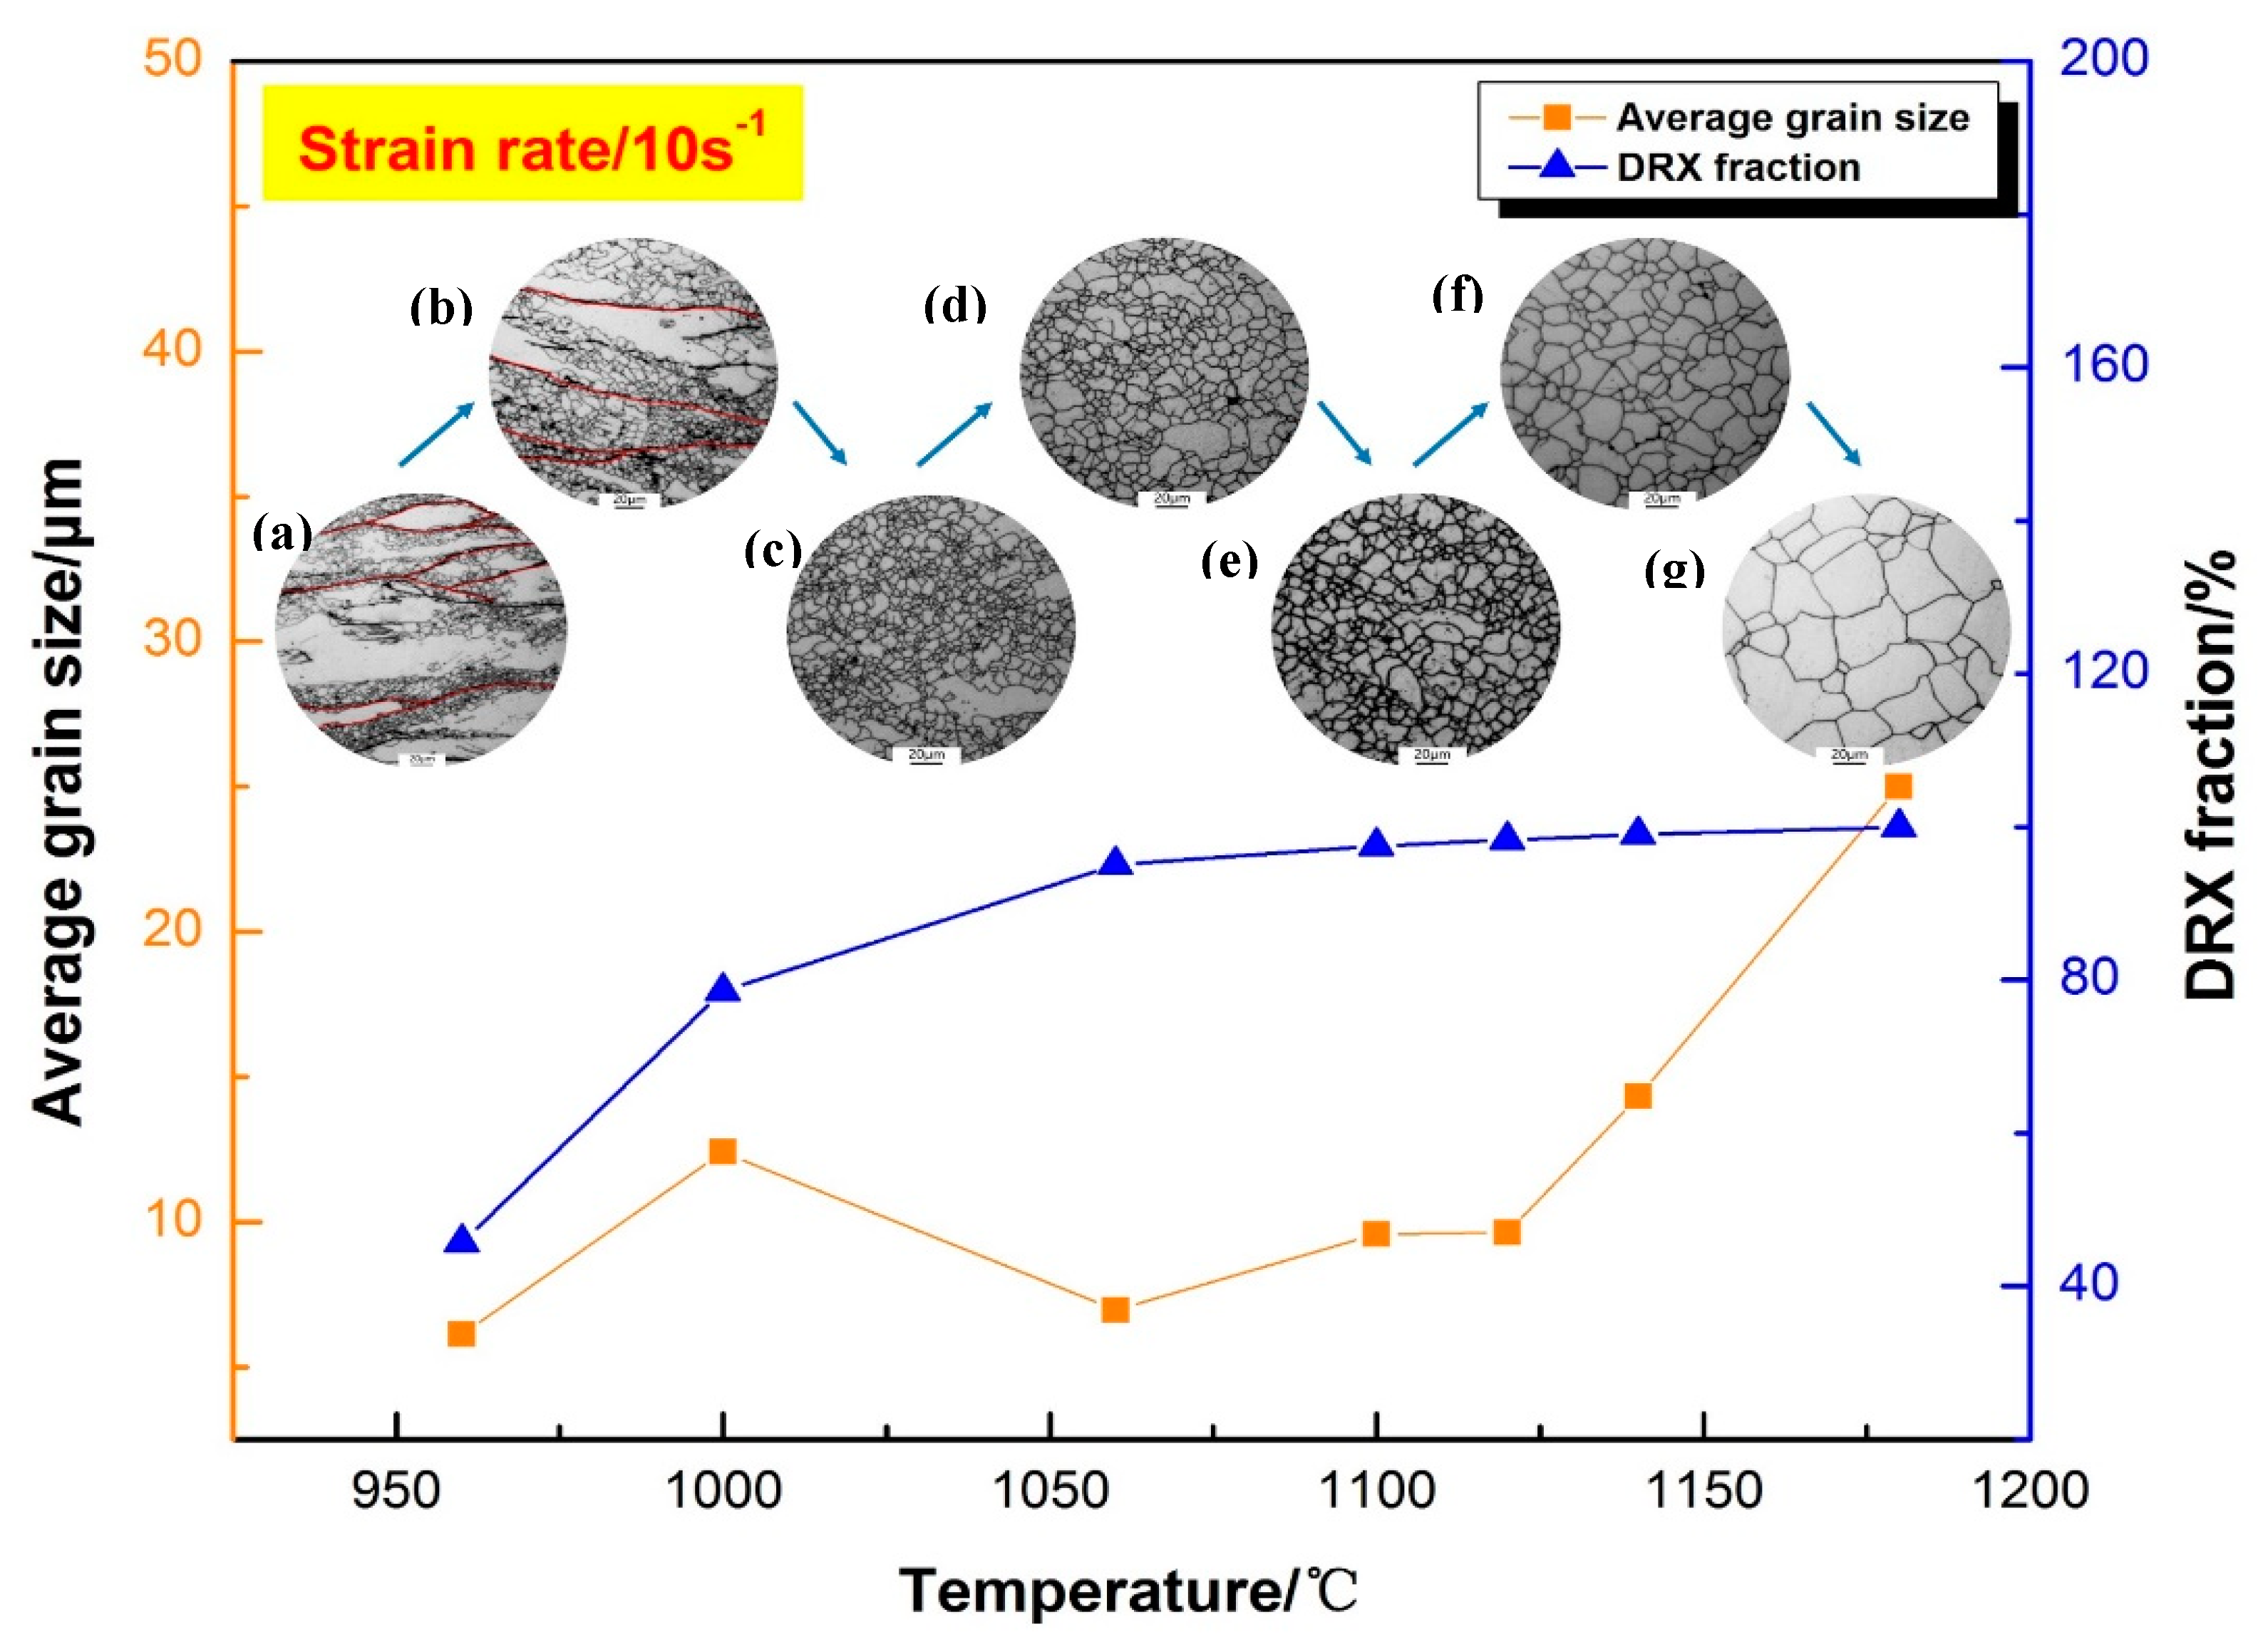
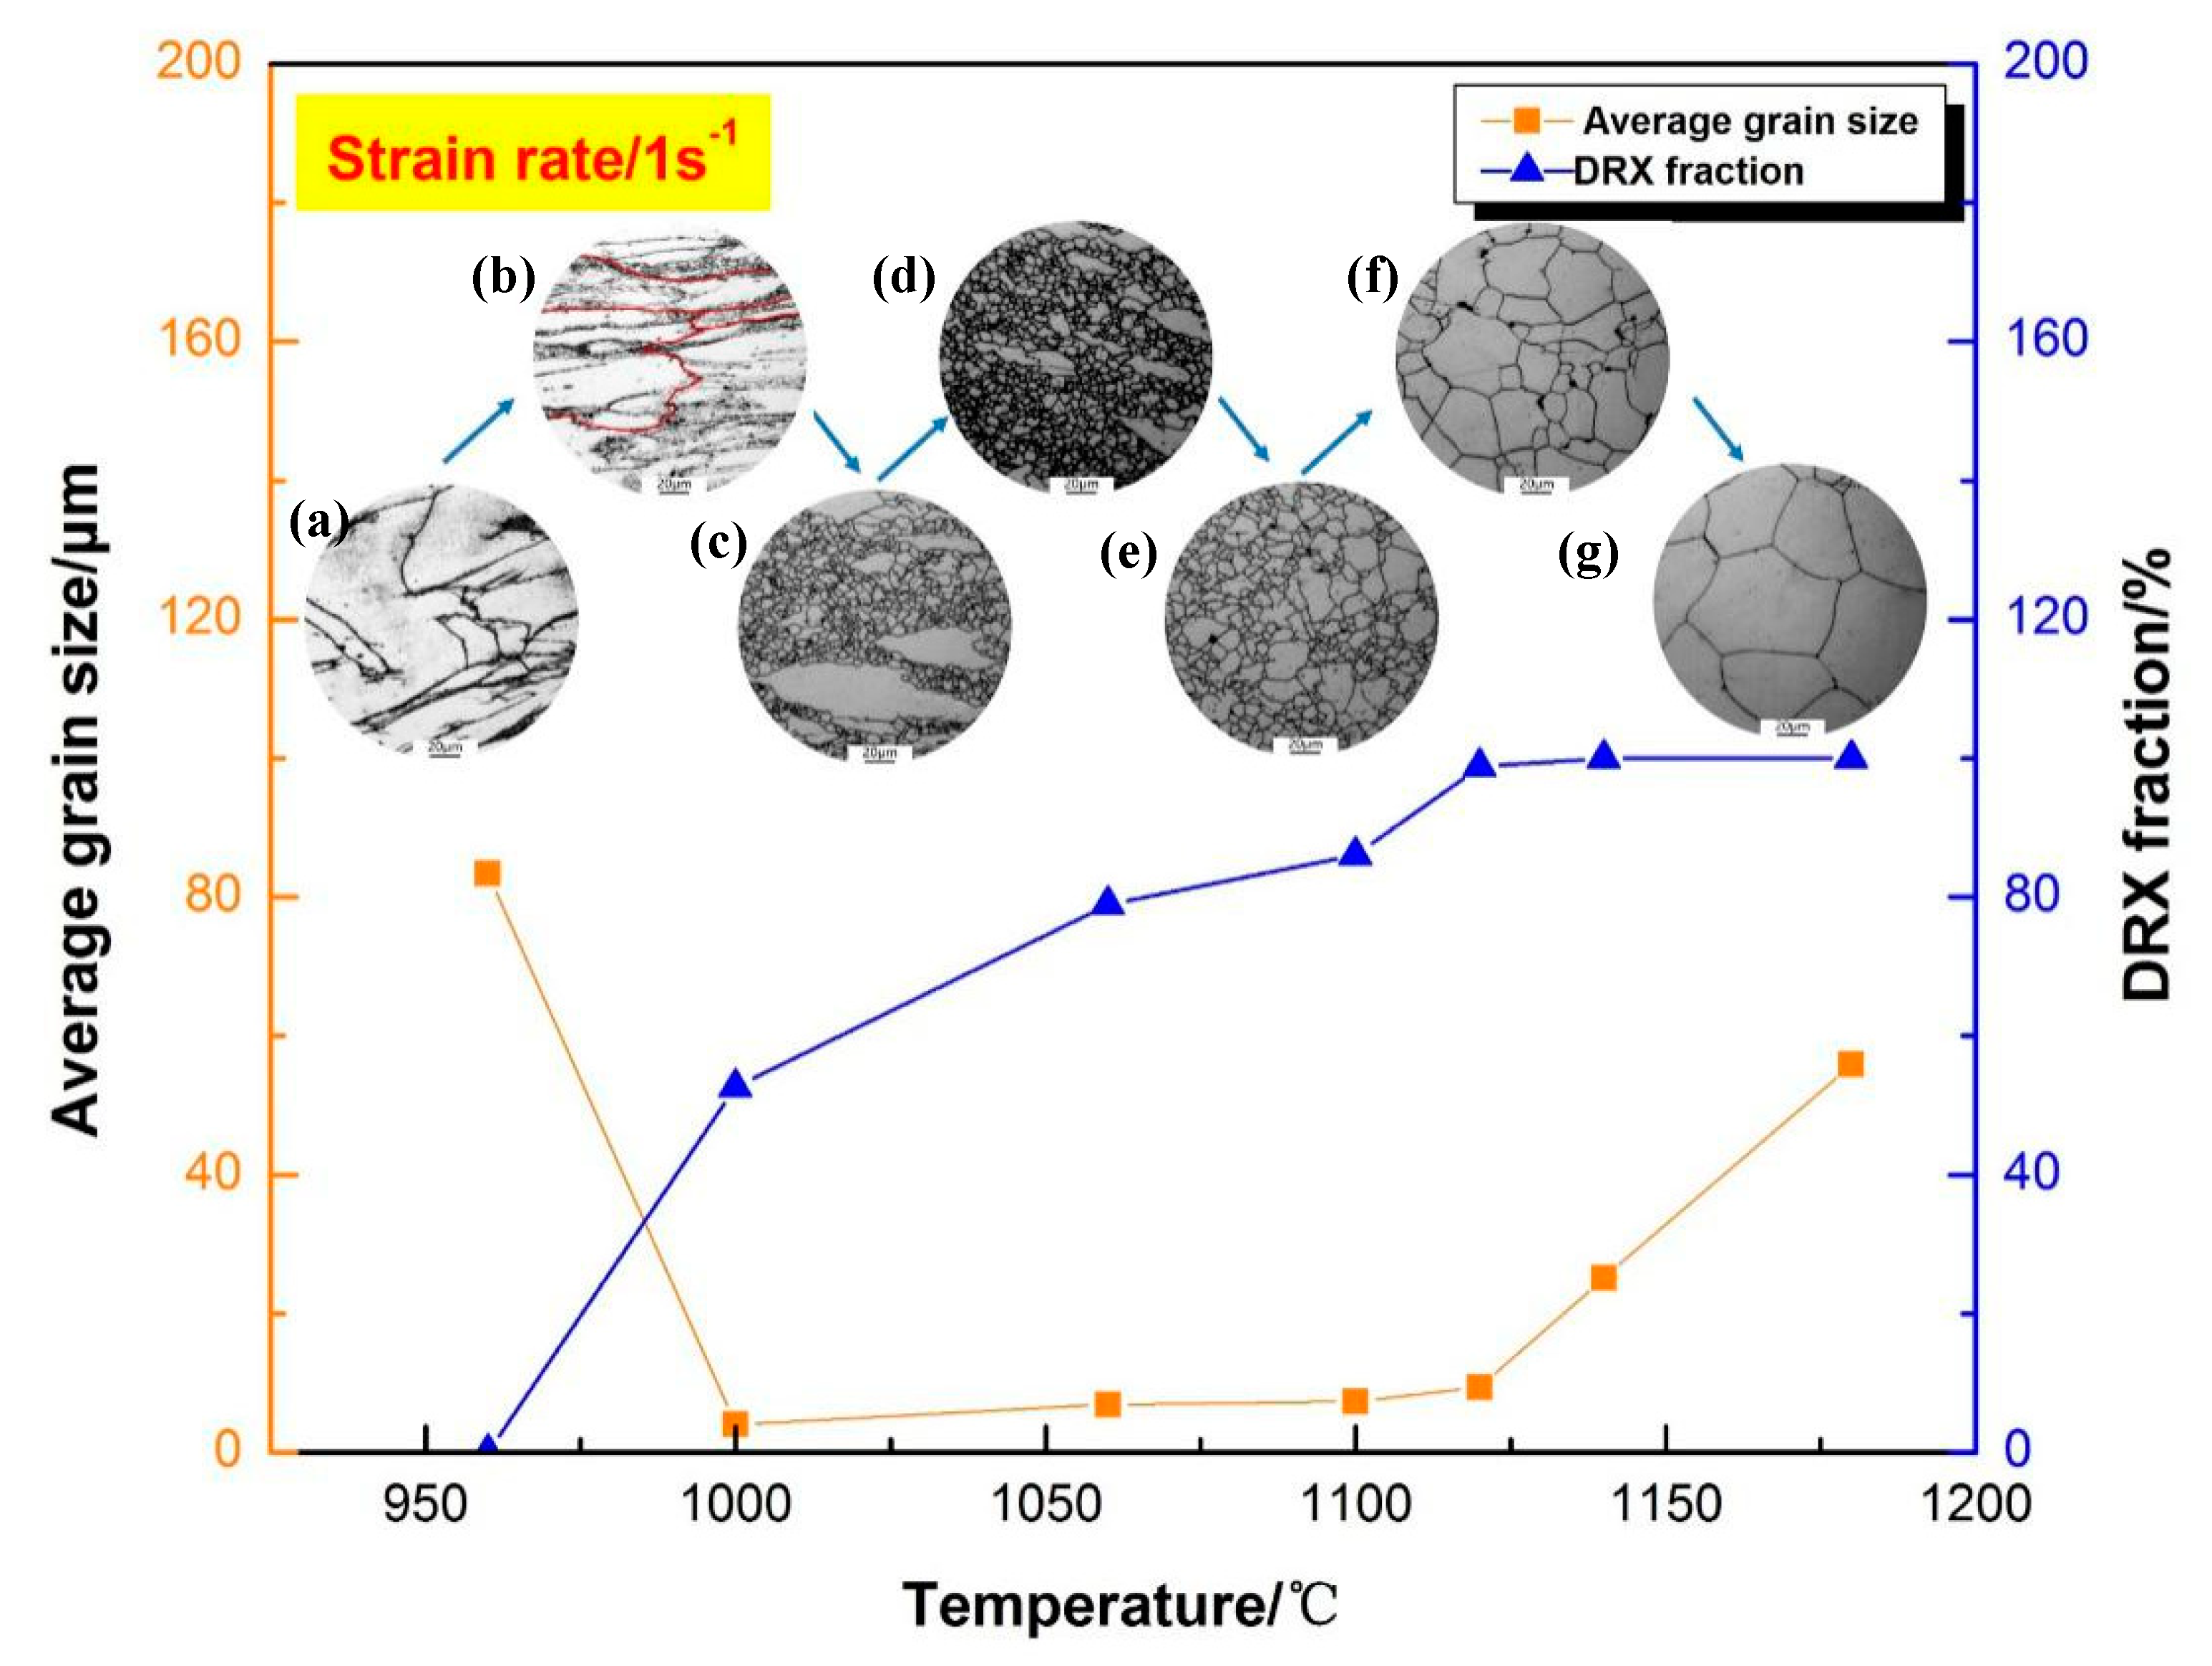
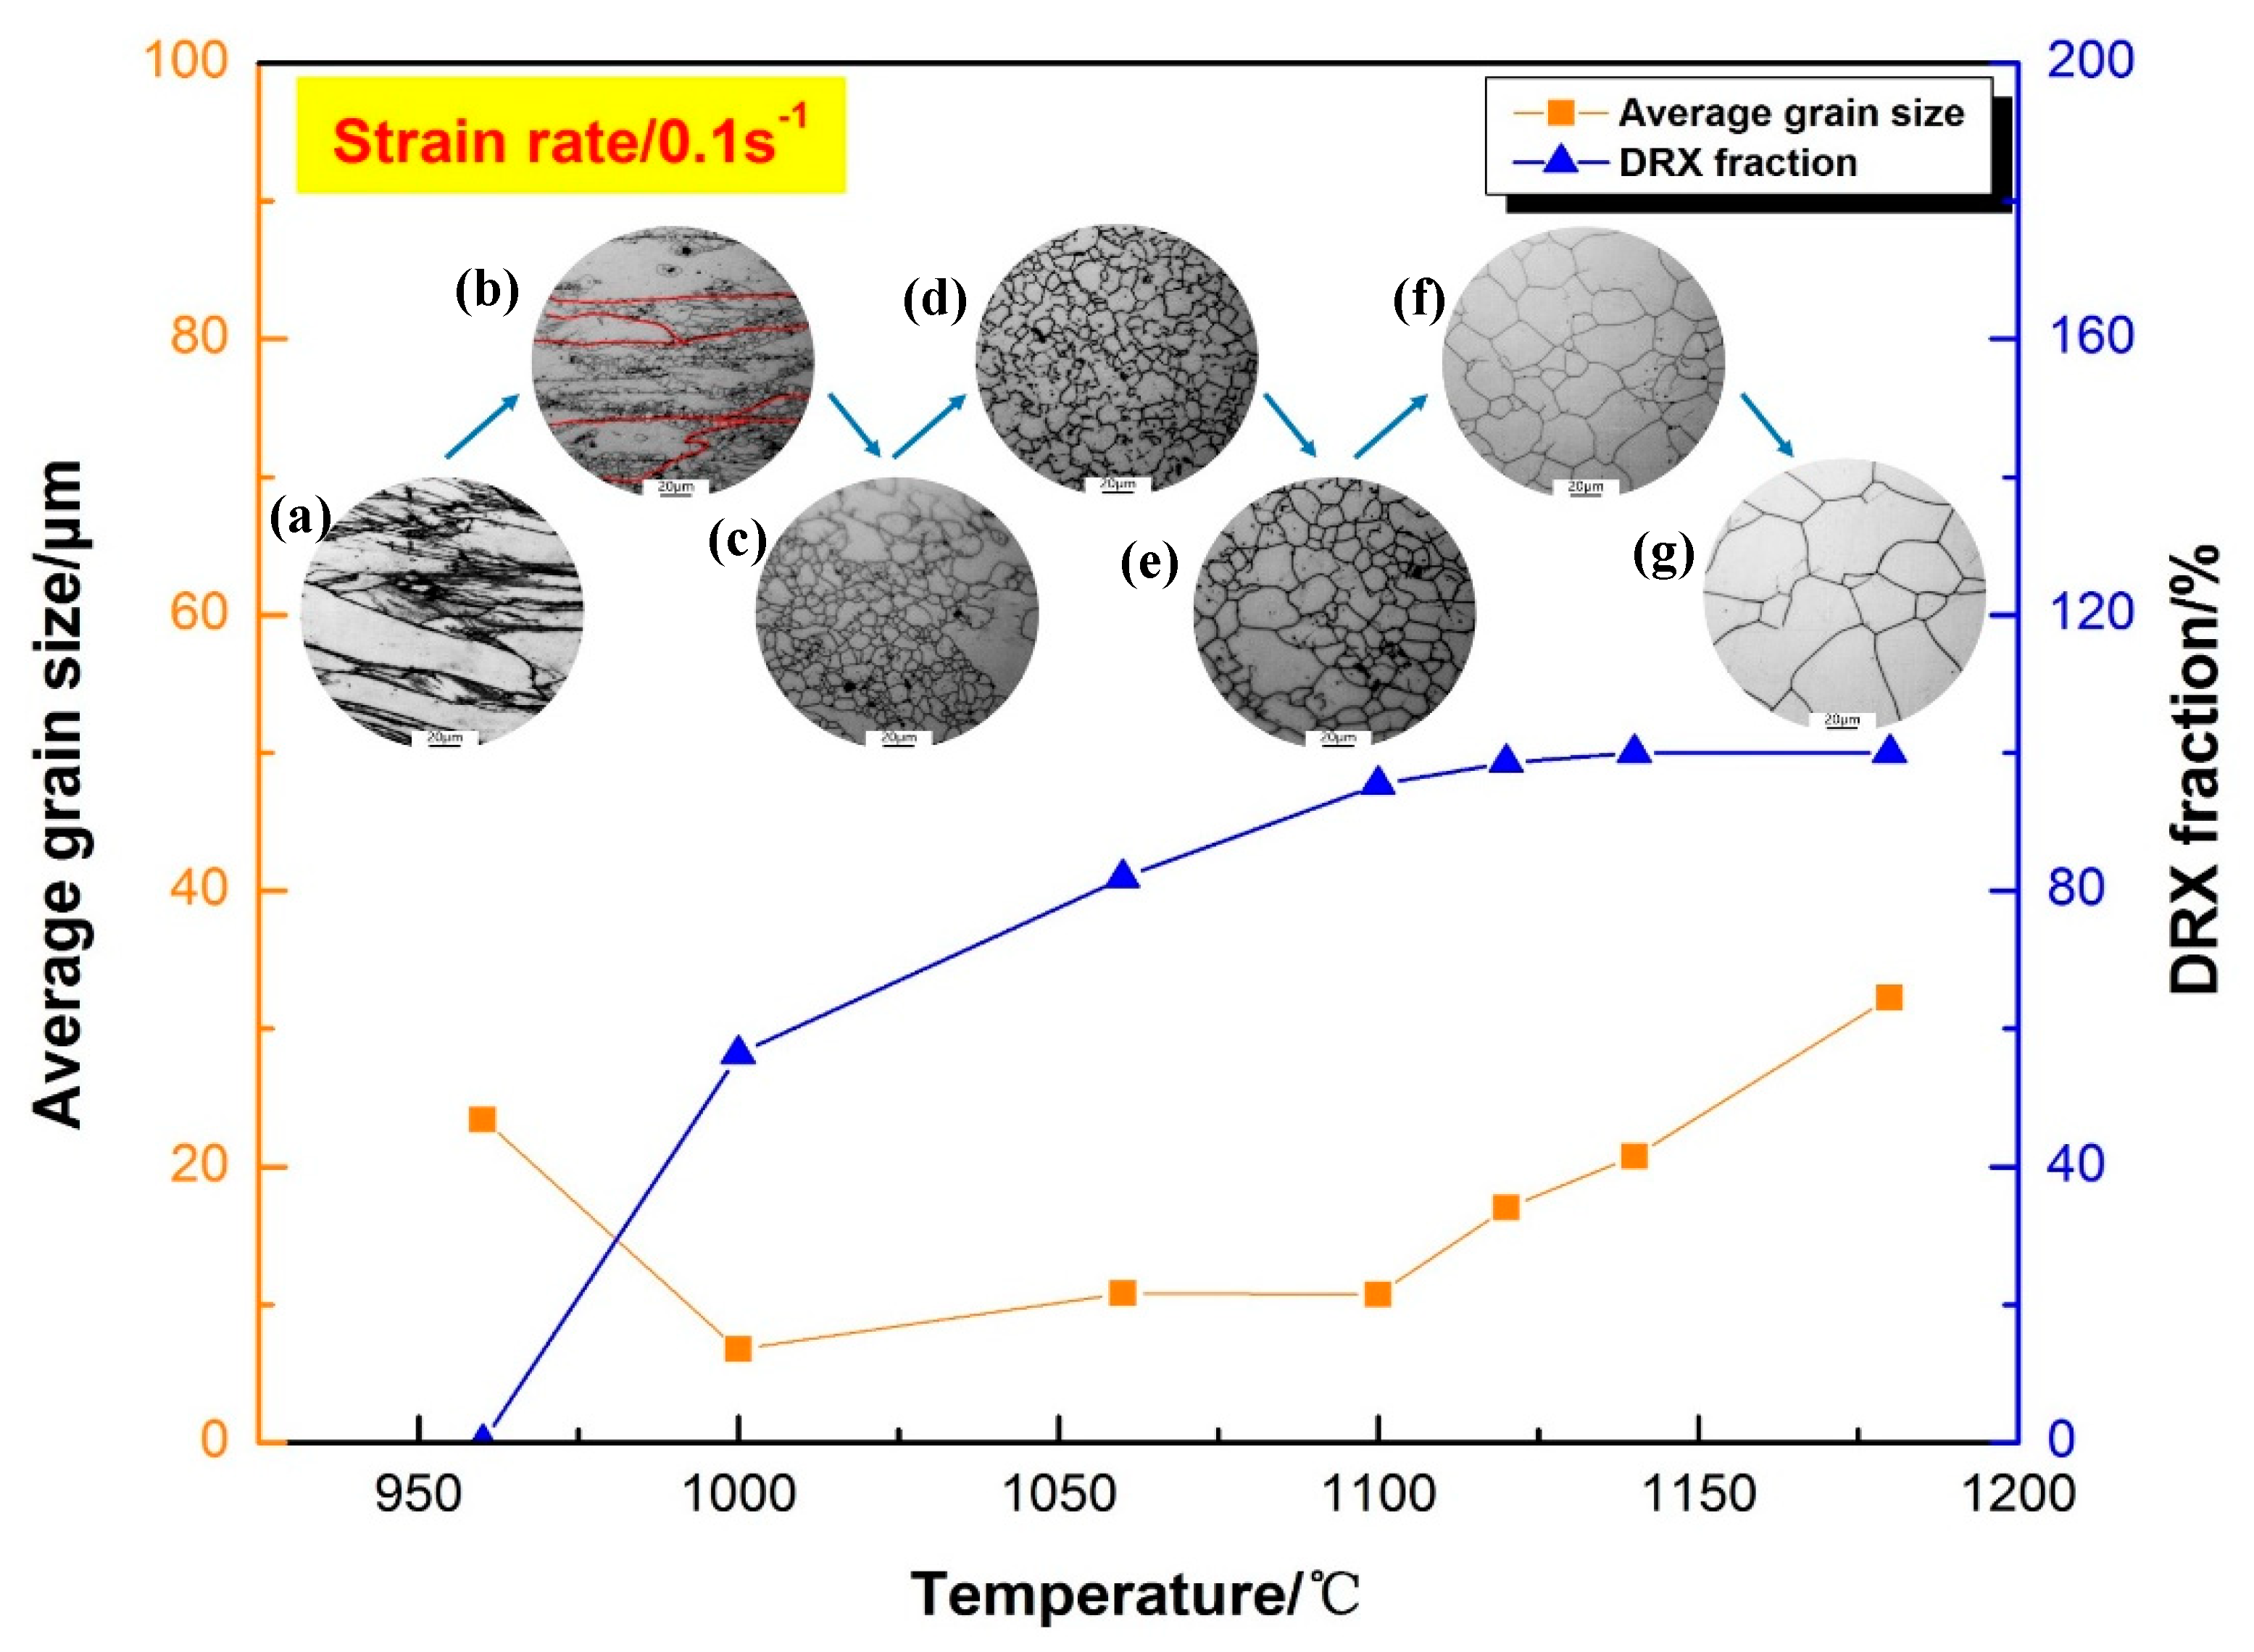
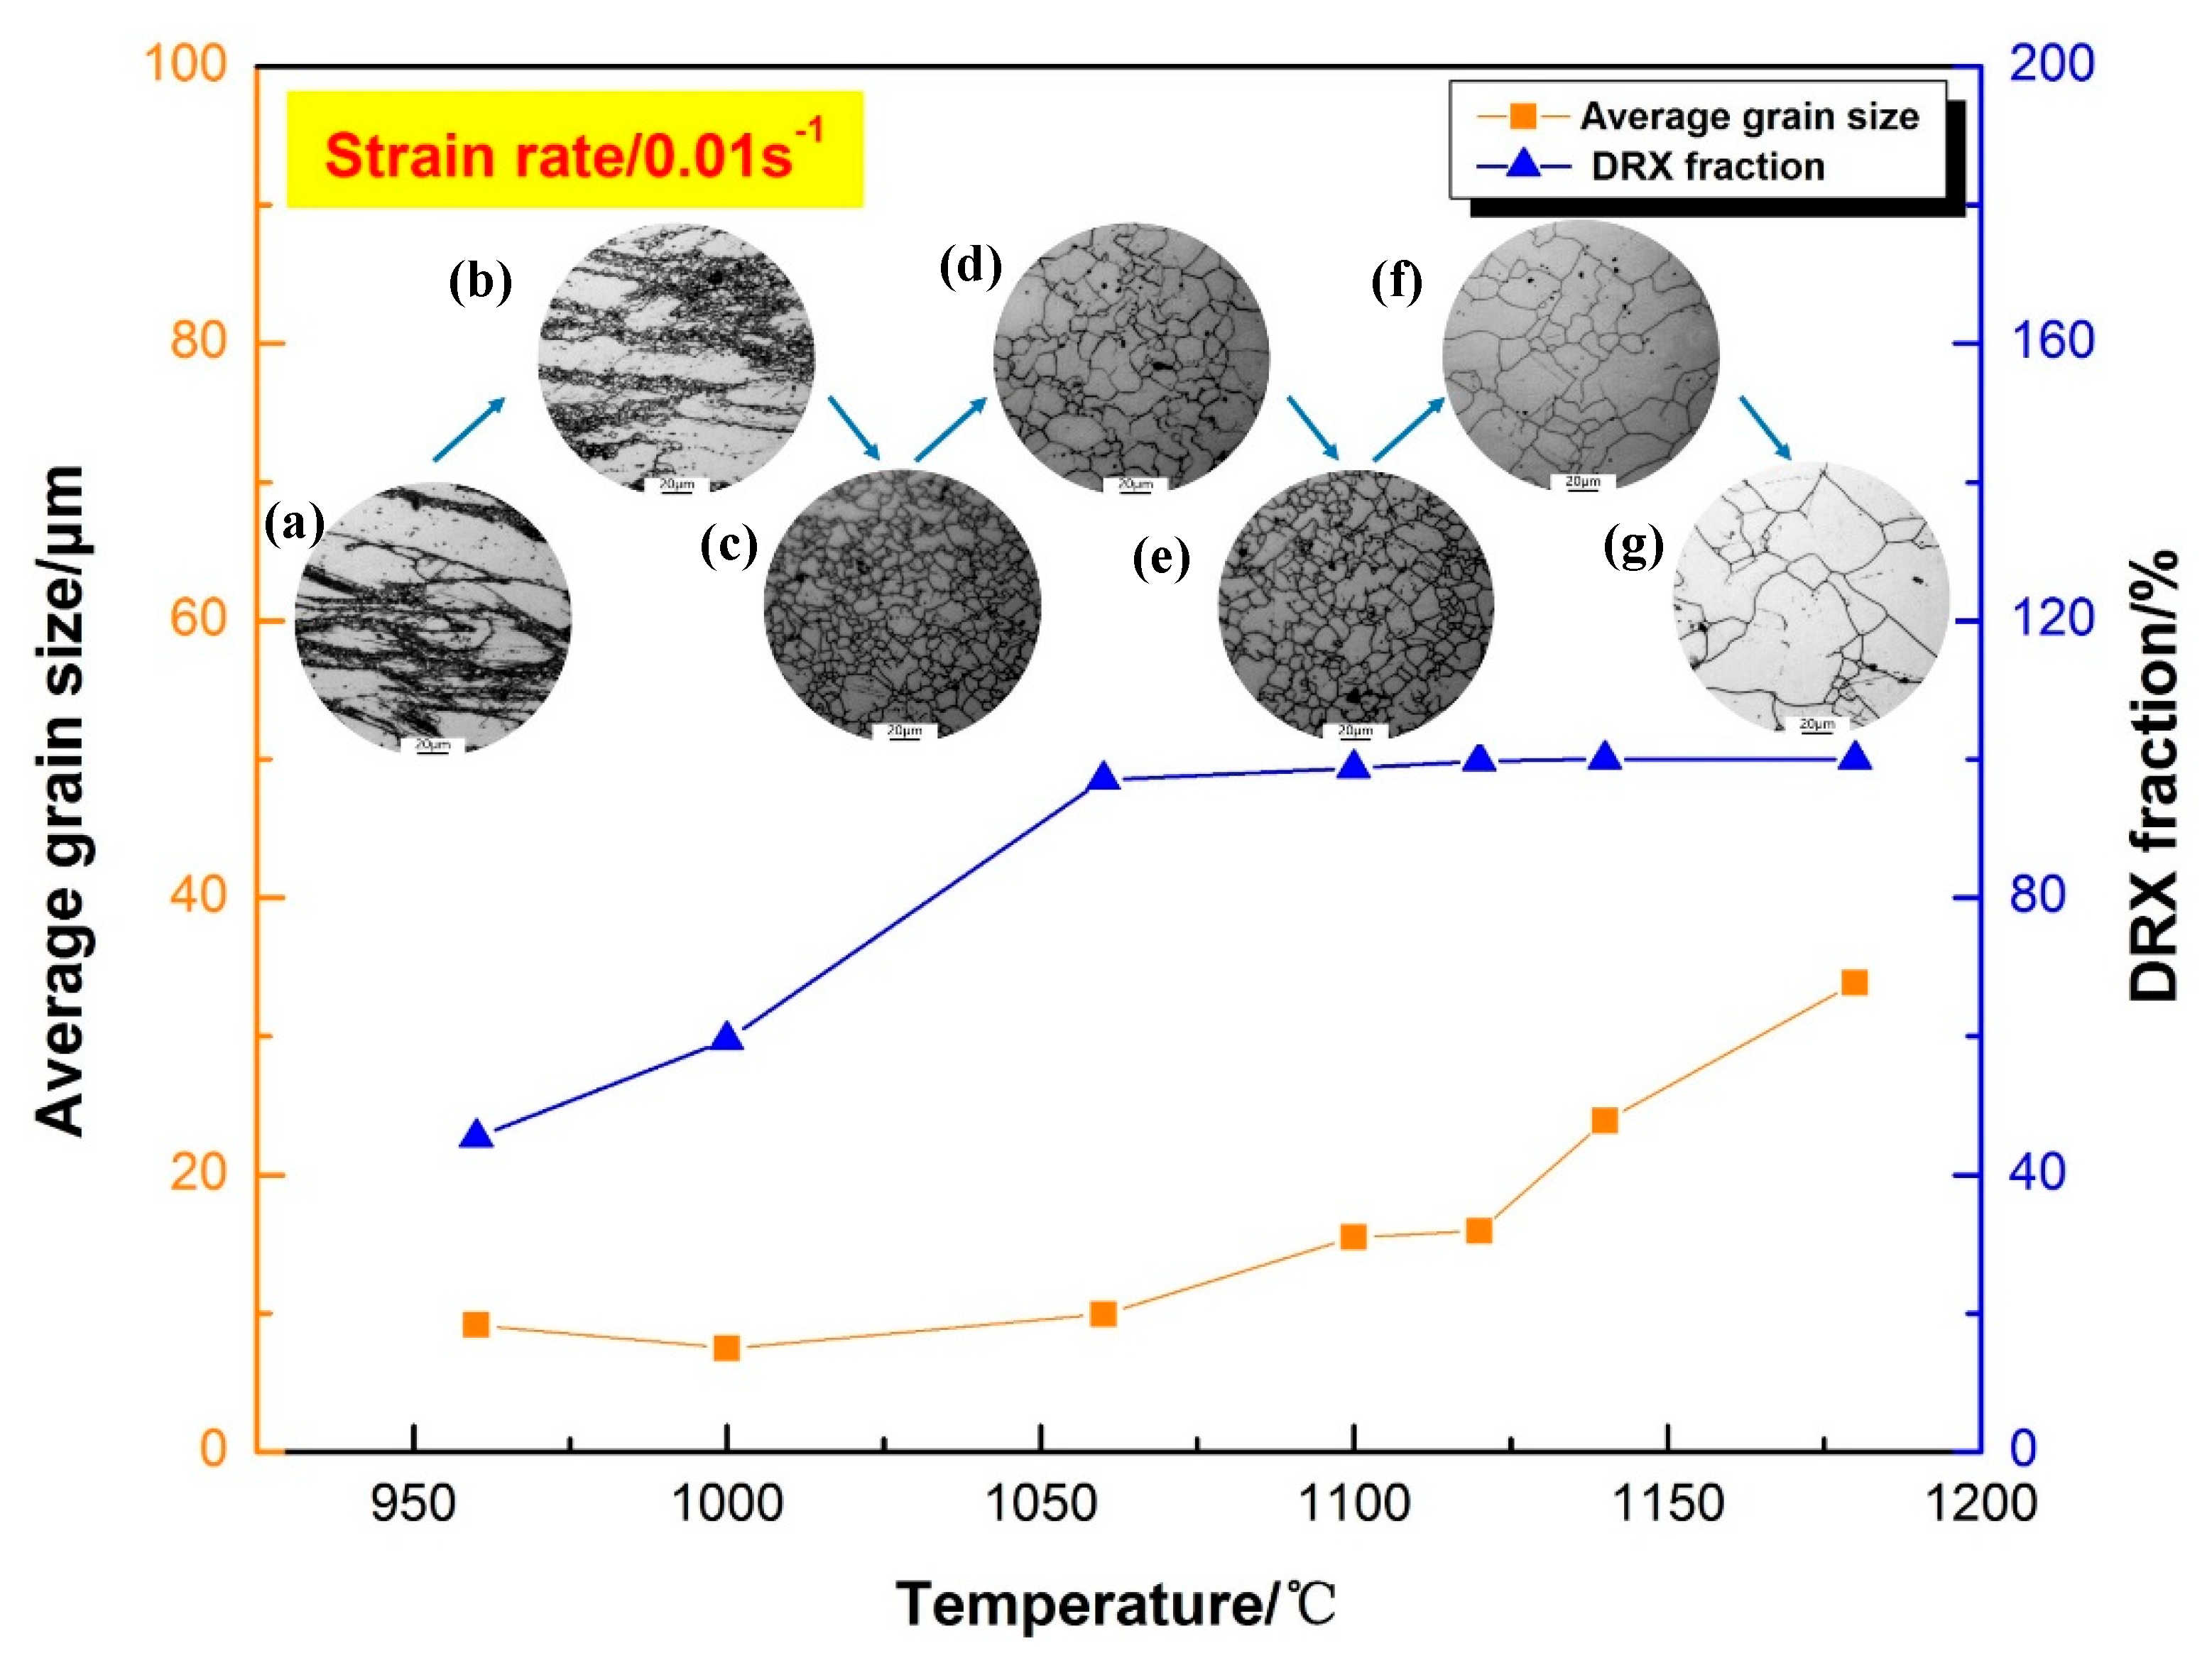
3.5. Optical Microstructure Analysis

Figure 8, Figure 9, Figure 10 and Figure 11 shows a schematic diagram of grain size, DRX fraction and optical microstructure of the specimens deformed at the strain rate of 10 s−1, 1 s−1, 0.1 s−1 and 0.01 s−1. It was clearly seen that the grain microstructures were greatly dependent on deformation temperature. The DRX fraction increased with the increase of temperature at any strain rate, and reached complete recrystallization with a DRX fraction over 95% at 1100 °C. This is because the enhanced atomic thermal vibration and diffusion increase the nucleation rate of DRX. After reaching complete recrystallization, the average grain size increased continuously as the DRX grain grew with the increase of temperature. At 960 °C or 1000 °C (as shown in Figure 8 and Figure 9a,b), the microstructures present elongated grains and deformation concentration zones. Deformation at low temperatures is prone to large stress concentrations due to less slip system so that the formation process of twins in dynamic recovery (DRV) promotes the nucleation of the sub-grain, and the “necklace” type recrystallized structure (as indicated by the red line) is formed due to the inconsistent growth of the sub-grain [21,22]. Additionally, DRX can be triggered by sub-grain crystallographic misorientation and low angle grain boundaries during hot deformation [23]. Meanwhile, since the adiabatic heat generated during the thermal deformation process does not have enough time to transfer due to the high strain rate of 10 s−1, bands of flow localization are prone to occur [24]. While the deformation temperature increased, the mobility of grain boundary was enhanced, leading to the increasing rate of grain boundaries migration [25]. So, the DRX grains can easily grow up under high deformation temperatures like 1180 °C, as shown in Figure 8, Figure 9 and Figure 10 and Figure 11f,g.
As shown in Figure 9, it can be found from specimens deformed at the strain rate of 1 s−1 that initial coarse deformation grains still can be observed below 1100 °C, which was liable to cause intergranular cracking during hot deformation. Especially at 1060 °C and 1100 °C, the fraction of DRX is high and the size of DRX grains becomes fine, while the whole grain microstructure is heterogeneous. A similar phenomenon has been founded in compression tests of GH4169 alloy. This is because DRX under relative high strain rate is governed by a high nucleation rate due to the combined effects of high stored energy and adiabatic heating [26]. However, the growth of DRX nuclei is restrained due to the limited deformation time under the given deformation degree and temperature. Thus, the volume fraction of DRX increased with the increased temperature, but there were still coarse deformation grains appearing in the microstructure.
Figure 10 shows the microstructures of the specimens deformed at the strain rate of 0.1 s−1, which correspond to the safe region in the process map. According to Figure 10b, the DRX clearly occurs at 1000 °C, and small DRX grains appear along the grain boundaries and within the grains. It is found that the original grains have been almost entirely substituted by small DRX gains in Figure 10c, which is characterized by serrated or wavy grain boundaries. Although the fractions of DRX are high and the grains are fine, it is dangerous to carry out hot working under this condition. The reason for this is seen in the flow instability domain in the processing map, as shown in Figure 7. The complete dynamic recrystallization reached at 1100 °C, and the homogeneous and fine equiaxed grains are observed as shown in Figure 10d.
Figure 11 shows the microstructures of the specimens deformed at 0.01 s−1. Similarly, the occurrence of DRX and the growth of DRX grains are accelerated by the increase in the temperature. It can clearly be seen that under the lower temperature and lower stain rate, the microstructures are mainly composed of irregular distorted grains and bands of flow localization (according to Figure 8, Figure 9 and Figure 10 and Figure 11a. Additionally, by comparing the microstructure and DRX fraction in Figure 8, Figure 9 and Figure 10 and Figure 11a–d, it is found that the degree of DRX and the homogeneity of the DRX microstructure are sensitive to the strain rate. At the same deformation temperature, when the strain rate is lower or higher than 1 s−1, the degree of DRX is improved and the microstructure is more homogeneous. The same phenomena can be found in other superalloys [27].
Figure 12 is a summary of the average grain size and DRX fraction under different deformation conditions. Combined with the previous analysis, we can summarize the following regular conclusions: when the temperature is higher than 1100 °C, an increasing trend is corresponding to the average grain size and DRX fraction of the alloy is almost constant, and the average grain size is 7–56 μm; the DRX fraction is more than 95% at 1120 °C to achieve complete recrystallization.
In addition, from Figure 12a, it can be found that when the deformation temperature exceeds 1140 °C, and the grain structure of the alloy is relatively uniform, the grain size is the coarsest when the deformation rate is 1 s−1 at any temperature. According to the combination of the established processing map and the microstructures, the hot deformation process should be performed at 1100–1180 °C/0.01–0.1 s−1 to make the microstructure uniform and fine.

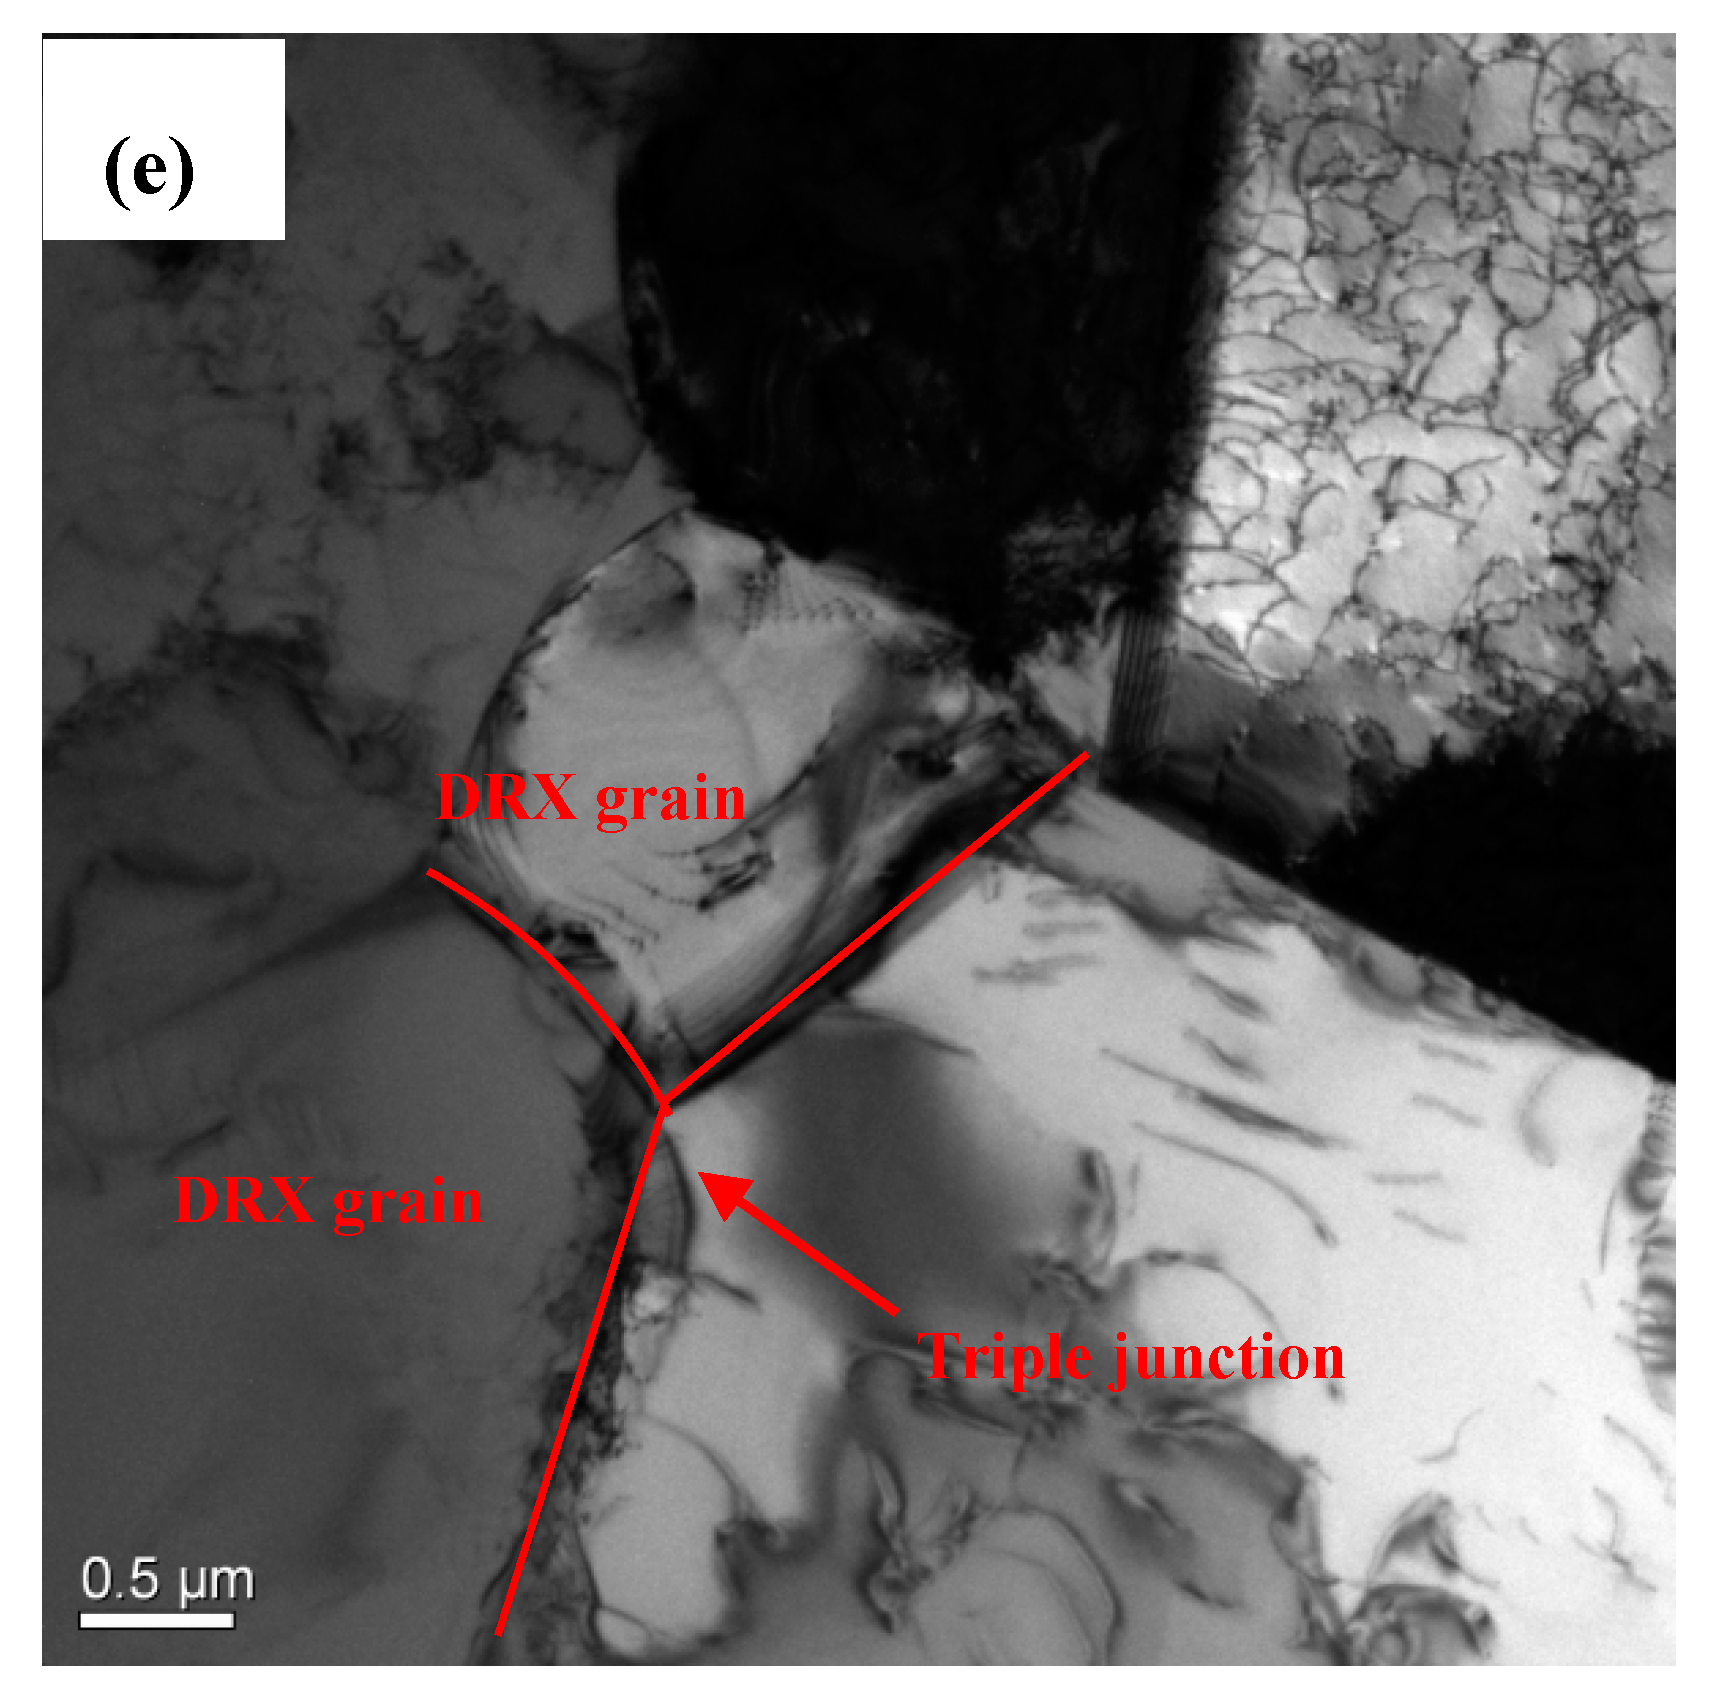
3.6. TEM Microstructure Observation

In this section, more details of hot deformation behaviors and softening mechanisms will be discussed. Figure 13 showed the dislocation substructures of HY282 alloy in the deformed specimens under the strain rate of 1 s−1. Obviously, the dislocation substructures were significantly affected by the deformation temperature. At 960 °C, the dislocation cell formed by large rough tangles of dislocations is observed. With the deformation temperature increasing, rearrangement or adjustment of dislocations, dislocation slip, and mutual cancellation occurred in the alloy, resulting in the appearance of sub-grain as shown in the circle of Figure 13b. The twins were also represented within the sub-grain, and the selected area diffraction patterns (SAED) were as shown in Figure 13c. The diffraction pattern was formed by two sets of single crystal electron diffraction spots with different zones. The twin spots do not coincide with the basic spots and appear at 1/3 of a certain spot on the matrix, which is a typical feature of face-centered cubic twin diffraction patterns. It is reported that the formation of twins promotes recrystallization [28,29].
As exhibited in Figure 13d, the sub-grain structures which can be DRX nucleus formed leaving very low dislocation density in the center of DRX grains transformed by subgrains. There was a clear triple junction on grain boundaries under 1120 °C in Figure 13e, which indicated the complete dynamic recrystallization. At higher deformation temperatures, dislocation annihilation and rearrangement can easily occur due to enhanced DRX nucleation and growth. Therefore, grain boundaries were basically flattened and the dislocation density within grains was very low. The stress relaxed by the increase of DRX at the triple-junction grain boundary. Further the TEM micrograph observations above indicated that the deformation temperature affected recrystallization by affecting the evolution of dislocation substructures within the alloy.
TEM micrographs of dislocation substructures and DRX nucleation in the alloy are shown as Figure 14. The annihilation and rearrangement of dislocations and sub-grain structures proved the occurrence of DRV. While no dynamic recrystallization grains were observed according to Figure 14a, this was because that there was not enough energy or dislocation annihilation at low deformation temperature and high strain rate [29], and thus, the DRV was the main softening mechanism. The jagged grain boundary of the deformed grain in Figure 14a facilitated the movement of the grain boundary and further evolved into nucleation of the original grain boundary. Figure 14b shows that the dislocations emitted by the dislocation source in the alloy are blocked before the grain boundary barrier, so the dislocations are arranged in front of the grain boundary, which is called the dislocation pile-up group. The stress field generated by the dislocation pile-up group was a superposition of all the dislocation stress fields in the group, leading to the large storage energy, so it was easy to become the position of the recrystallized nucleation. Meanwhile, dislocations are rearranged and canceled during the DRX process, and the cell wall is thinned to form a dislocation network, as shown in Figure 14c, which is a complex polygonization.
Recrystallization nucleus indicated the occurrence of DRX while grain boundary bulging and fluctuation suggested that the recrystallization mechanisms were discontinuous dynamic recrystallization by strain-induced grain boundary migration nucleation [30]. Due to the non-uniform deformation, the local storage energy on both sides of the original high angle boundary may be different, i.e., the dislocation density was different. Therefore, in Figure 14d, the region having a low dislocation density grew into an adjacent grain having a relatively high dislocation density to form a tongue. The tongue has almost no strain hardening, and this bulging subgrain will become the discontinuous dynamic recrystallization nucleus, which was the mechanism of grain boundary migration nucleation. The grain boundary of the DRX grain was bulging in Figure 14e, which was a typical characteristic of grain boundary migration, and eventually promoted the grain growth.
As shown in Figure 14b–d, there was an increased dislocation density within grains under a relatively high strain rate because the high strain rate could lead to a rapid dislocation generation under the given deformation temperature [30]. The dislocation substructures were partly removed by the formation of the sub-grain during DRV, and most of the dislocation substructures were rearranged and annihilated by the occurrence of DRX. Nevertheless, the DRV and DRX were restrained due to the limited deformation time. Therefore, high dislocation density was retained under the high strain rate [30].

4. Conclusions

The hot deformation behavior, processing map and dislocation evolution of HY282 alloy were investigated in the temperature range of 960–1180 °C and strain rate range of 0.01–10 s−1. The following conclusions can be drawn:
(1) The interaction between work hardening and dynamic softening cannot reach equilibrium under low deformation temperature and high strain rate.
(2) The active energy of HY282 alloy is about 537.12 kJ/mol and the hot deformation constitutive equation of it could be expressed as:
ε ˙ = 9 × 10 19 [ sinh ( 0.00366 σ ) ] 5.26 exp ( 537.13 R T )
(3) According to the processing map and microstructure observations, two unsafe flow instability domains should be avoided: domain 1 occurred around 960–1050 °C/0.1–10 s−1 and 1075–1180 °C/1–10 s−1; domain 2 occurred around 1035–1075 °C/0.01–0.1 s−1. The optimum hot processing condition for homogeneous and fine DRX grains are obtained in the deformation temperature range of 1100–1180 °C and strain rate range of 0.01–0. 1 s−1.
(4) TEM micrograph observations indicate that deformation temperature and strain rate affected recrystallization by affecting the evolution of dislocation substructures within the alloy. The nucleation and growth of DRX grains can be promoted by the relatively high deformation temperature and low strain rate. The main mechanism of DRX nucleation in the alloy is discontinuous dynamic recrystallization and the typical feature of discontinuous dynamic recrystallization is grain boundary migration nucleation.

Author Contributions

Designed and performed the experiments, derived the models and analyzed the data, Z.Y.; conceived of the presented idea, J.W., H.W., and Z.Y.; verified the analytical methods, H.J. and B.Z.; investigated the alloy and supervised the findings of this work, H.W., J.D., and Z.Y. All authors have read and agreed to the published version of the manuscript.

Funding

This research was funded by National Natural Science Foundation of China, grant No: 51771017.

Acknowledgments

The authors would like to thankfully appreciate Chen Ying and Hideo Miura from Tohoku University for smoothing the paper and good suggestions.

Conflicts of Interest

The authors declare no conflict of interest.

Data Availability

The processed data required to reproduce these findings can be shared.

References

  1. Shi, Z.; Yan, X.; Duan, C.; Tang, C.; Pu, E. Characterization of the hot deformation behavior of a newly developed nickel-based superalloy. J. Mater. Eng. Perform. 2018, 27, 1763–1776. [Google Scholar]
  2. Brooks, J.W. Forging of superalloys. Mater. Des. 2000, 21, 297–303. [Google Scholar]
  3. Sims, C.T.; Stoloff, N.S.; Hagel, W.C. Superalloys II: High-Temperature Materials for Aerospace and Industrial Power; John Wiley & Sons Tnc: Hoboken, NJ, USA, 1987. [Google Scholar]
  4. Wang, J.; Dong, J.; Zhang, M.; Xie, X. Hot working characteristics of nickel-base superalloy 740H during compression. Mater. Sci. Eng. A 2013, 566, 61–70. [Google Scholar]
  5. Momeni, A.; Abbasi, S.M.; Morakabati, M.; Badri, H.; Wang, X. Dynamic recrystallization behavior and constitutive analysis of Incoloy 901 under hot working condition. Mater. Sci. Eng. A 2014, 615, 51–60. [Google Scholar]
  6. Detrois, M.; Antonov, S.; Tin, S.; Jablonski, P.D.; Hawk, J.A. Hot deformation behavior and flow stress modeling of a Ni-based superalloy. Mater. Charact. 2019, 157, 109915. [Google Scholar]
  7. Wen, D.X.; Lin, Y.C.; Li, H.B.; Chen, X.M.; Deng, J.; Li, L.T. Hot deformation behavior and processing map of a typical Ni-based superalloy. Mate. Sci. Eng. A 2014, 591, 183–192. [Google Scholar]
  8. Liu, Y.; Hu, R.; Li, J.; Kou, H.; Li, H.; Chang, H.; Fu, H. Characterization of hot deformation behavior of Haynes230 by using processing maps. J. Mater. Process. Technol. 2009, 209, 4020–4026. [Google Scholar]
  9. Sajjadi, S.A.; Chaichi, A.; Ezatpour, H.R.; Maghsoudlou, A.; Kalaie, M.A. Hot deformation processing map and microstructural evaluation of the ni-based superalloy IN-738LC. J. Mater. Eng. Perform. 2016, 25, 1269–1275. [Google Scholar]
  10. Shi, Z.X.; Yan, X.F.; Duan, C.H.; Song, J.G.; Zhao, M.H.; Wang, J. Hot deformation behavior of GH4945 superalloy using constitutive equation and processing map. J. Iron Steel Res. Int. 2017, 24, 625–633. [Google Scholar]
  11. Zhang, H.; Zhang, K.; Lu, Z.; Zhao, C.; Yang, X. Hot deformation and processing map of a γ´-hardened nickel-based superalloy. Mater. Sci. Eng. A 2014, 604, 1–8. [Google Scholar]
  12. Guo, S.; Li, D.; Pen, H.; Guo, Q.; Hu, J. Hot deformation and processing maps of Inconel 690 superalloy. J. Nucl. Mater. 2011, 410, 52–58. [Google Scholar]
  13. Sun, C.; Liu, G.; Zhang, Q.; Li, R.; Wang, L. Determination of hot deformation behavior and processing maps of IN 028 Alloy using isothermal hot compression test. Mater. Sci. Eng. A 2014, 595, 92–98. [Google Scholar]
  14. Li, Z.; Fu, S.H.; Wang, T.; Zhao, Y.X.; Zhang, Y.; Zhang, M.C. Microstructure evolution and processing map of superalloy GH720Li during isothermal compression. Mater. Sci. For. 2013, 747–748, 588–593. [Google Scholar]
  15. Luo, J.; Li, M.Q.; Ma, D.W. The deformation behavior and processing maps in the isothermal compression of 7A09 aluminum alloy. J. Mater. Sci. Eng. A 2012, 532, 548–557. [Google Scholar]
  16. Sui, F.L.; Xu, L.X.; Chen, L.Q.; Liu, X.H. Processing map for hot working of Inconel 718 alloy. J. Mater. Proc. Technol. 2011, 211, 433–440. [Google Scholar]
  17. Galindo-Nava, E.I.; Rivera-Dı´az-del-Castillo, P.E.J. Thermostatistical modelling of hot deformation in FCC metals. Int. J. Plast. 2013, 47, 202–221. [Google Scholar]
  18. Medeiros, S.C.; Prasad, Y.V.R.K.; Frazier, W.G.; Srinivasan, R. Microstructural modeling of metadynamic recrystallization in hot working of IN 718 superalloy. Mater. Sci. Eng. A 2000, 293, 198–207. [Google Scholar]
  19. Zhou, G.; Ding, H.; Cao, F.; Zhang, B. A comparative study of various flow instability criteria in processing map of superalloy GH4742. J. Mater. Sci. Technol. 2014, 30, 217–222. [Google Scholar]
  20. Xiong, M.; Weidong, Z.; Yu, S.; Yongqing, Z.; Shaoli, W.; Yigang, Z. A comparative study of various flow instability criteria in processing map. Rare Metal Mate. Eng. 2010, 39, 756–761. [Google Scholar]
  21. Yi, L.; Kun, X.; Ximing, L.; Dengquan, C.; Wei, L.; Rui, H.; Jinshan, L. Microstructure evolution of Haynes230 superalloy during hot deformation. Rare Metal Mate. Eng. 2013, 42, 1820–1825. [Google Scholar]
  22. Zhong, X.T.; Wang, L.; Liu, F. Study on formation mechanism of necklace structure in discontinuous dynamic recrystallization of Incoloy 028. Acta Metal. Sinica 2018, 54, 569–580. [Google Scholar]
  23. Bahador, A.; Kariya, S.; Umeda, J.; Hamzah, E.; Kondoh, K. Tailoring microstructure and properties of a superelastic Ti–Ta alloy by incorporating spark plasma sintering with thermomechanical processing. J. Mater. Eng. Perform. 2019, 28, 3012–3020. [Google Scholar] [CrossRef]
  24. Monajati, H.; Taheri, A.K.; Jahazi, M.; Yue, S. Deformation characteristics of isothermally forged UDIMET 720 nickel-base superalloy. Metal. Mater. Trans. A 2005, 36, 895–905. [Google Scholar] [CrossRef]
  25. Valiev, R.Z.; Sergeev, V.I.; Khalikov, A.M.; Shvetsova, E.V. The influence of grain boundaries on the kinetics of solid-phase reactions in a nickel-based superalloy. J. Mater. Sci. Lett. 1989, 8, 433–435. [Google Scholar] [CrossRef]
  26. Tong, H.; Jinghong, T.; Zhihua, L.; Qingan, T. Effect of deformation parameters on microstructure evolution of hot deformed superalloy GH4169. Applied Mec. Mater. 2015, 744–746, 1382–1385. [Google Scholar]
  27. Jiang, H.; Dong, J.; Zhang, M.; Yao, Z. A study on the effect of strain rate on the dynamic recrystallization mechanism of alloy 617B. Metal. Mater. Trans. A 2016, 47, 5071–5087. [Google Scholar] [CrossRef]
  28. Jin, Y.; Bernacki, M.; Rohrer, G.S.; Rollett, A.D.; Lin, B.; Bozzolo, N. Formation of annealing twins during recrystallization and grain growth in 304L austenitic stainless steel. Mater. Sci. For. 2013, 753, 113–116. [Google Scholar] [CrossRef] [Green Version]
  29. Xie, B.C.; Yu, H.; Sheng, T. DDRX and CDRX of an as-cast nickel-based superalloy during hot compression at γ´ sub-/super-solvus temperatures. J. Alloys Compd. 2019, 803, 16–29. [Google Scholar] [CrossRef]
  30. Prithiv, T.S.; Bhuyan, P.; Pradhan, S.K.; Sarma, V.S.; Mandal, S. A critical evaluation on efficacy of recrystallization vs. strain induced boundary migration in achieving grain boundary engineered microstructure in a Ni-base superalloy. Acta Mater. 2018, 146, 187–207. [Google Scholar] [CrossRef]
Figure 1. Initial microstructure of HY282 alloy prior to hot compression: (a) optical microstructure, (b) scanning electron microscope (SEM) microstructure.
Metals 10 00920 g001
Figure 2. The true stress-strain curves of HY282 alloy at different temperatures with various strain rates: (a) 960 °C, (b) 1000 °C, (c) 1040 °C, (d) 1060 °C, (e) 1080 °C, (f) 1100 °C, (g) 1120 °C, (h) 1140 °C, (i) 1180 °C.
Metals 10 00920 g002aMetals 10 00920 g002b
Figure 3. Variations of peak stress of HY282 alloy with deformation temperature and strain rate: (a) ln(strain rate)-σp; (b) ln(strain rate)-ln(σp).
Metals 10 00920 g003
Figure 4. Linear relationship of (a) ln(strain rate)- ln(sinh(ασp)); (b) ln(sinh(ασp))-T.
Metals 10 00920 g004
Figure 5. Relationship of Z parameters and peak stress.
Metals 10 00920 g005
Figure 6. Processing map of HY282 alloy at different true strain: (a) ε = 0.2, (b) ε = 0.4, (c) ε = 0.6, (d) ε = 0.7.
Metals 10 00920 g006
Figure 7. The new combined processing maps of HY282 alloy at the strain from 0.2 to 0.7.
Metals 10 00920 g007
Figure 8. Schematic diagram of grain size, DRX fraction and optical microstructure of the specimens deformed at the strain rate of 10 s−1: (a) 960 °C, (b) 1000 °C, (c) 1060 °C, (d) 1100 °C, (e) 1120 °C, (f) 1140 °C, (g) 1180 °C.
Metals 10 00920 g008
Figure 9. Schematic diagram of grain size, dynamic recrystallization (DRX) fraction and optical microstructure of the specimens deformed at the strain rate of 1 s−1: (a) 960 °C, (b) 1000 °C, (c) 1060 °C, (d) 1100 °C, (e) 1120 °C, (f) 1140 °C, (g) 1180 °C.
Metals 10 00920 g009
Figure 10. Schematic diagram of grain size, DRX fraction and optical microstructure of the specimens deformed at the strain rate of 0.1 s−1: (a) 960 °C, (b) 1000 °C, (c) 1060 °C, (d) 1100 °C, (e) 1120 °C, (f) 1140 °C, (g) 1180 °C.
Metals 10 00920 g010
Figure 11. Schematic diagram of grain size, DRX fraction and optical microstructure of the specimens deformed at the strain rate of 0.01 s−1: (a) 960 °C, (b) 1000 °C, (c) 1060 °C, (d) 1100 °C, (e) 1120 °C, (f) 1140 °C, (g) 1180 °C.
Metals 10 00920 g011
Figure 12. The average grain size (a) and DRX fraction (b) of the specimens deformed at different temperature with various strain rates.
Metals 10 00920 g012
Figure 13. The dislocation substructures in the deformed specimens under the strain rate of 1 s−1: (a) 960 °C, (b) 1000 °C, (c) corresponding SAED patterns at [ 1 ¯ 0 1 ¯ ] T axis zone of twin (marked by arrows) in (b), (d) 1060 °C, (e) 1120 °C.
Metals 10 00920 g013aMetals 10 00920 g013b
Figure 14. TEM micrographs of dislocation substructures and DRX nucleation in HY282 alloy at: (a) 960 °C/10 s−1, (b,c) 1000 °C/0.1 s−1, (d) 1000 °C/1 s−1, (e) 1120 °C/1 s−1.
Metals 10 00920 g014
Table 1. Composition of HY282 alloy wt.%.
ElementsBCSiMnFeAlTiMoCoCrNi
Mass fraction0.0050.060.150.31.51.52.18.510.120.254.08
Table 2. Hot-deformation conditions of HY282 alloy specimens.
Temperature/°CStrain Rate/s−1True Strain
960, 1000, 1040, 1060, 1080, 1100, 1120, 1140, 11800.01, 0.1, 1, 100.7
Table 3. The detail interpretation of the symbols in Equations (1)–(3).
SymbolsInterpretation
ε ˙ The strain rate (s−1)
TThe absolute temperature (K)
RThe gas constant is 8.314 J/(mol K)
QThe thermal deformation activation energy (KJ/mol)
A, αThe material constants
n1, β, nThe stress exponent, and there is a relationship of α = β/n1

