Article

Microstructural Investigations of Novel High Temperature Alloys Based on NiAl-(Cr,Mo)

by
Camelia Gombola
1,
Alexander Kauffmann
1,*,
Golnar Geramifard
1,
Malte Blankenburg
2 and
Martin Heilmaier
1
1
Institute for Applied Materials (IAM), Karlsruhe Institute of Technology (KIT), Engelbert-Arnold-Str. 4, 76131 Karlsruhe, Germany
2
Institute of Materials Research, Helmholtz-Zentrum Geesthacht, Max-Planck-Str. 1, 21502 Geesthacht, Germany
*
Author to whom correspondence should be addressed.
Metals 2020, 10(7), 961; https://doi.org/10.3390/met10070961
Submission received: 29 May 2020 / Revised: 6 July 2020 / Accepted: 14 July 2020 / Published: 16 July 2020
(This article belongs to the Special Issue Advances in Superalloys and High Temperature Intermetallics)

Abstract

:
Apart from the reported transition from the fibrous morphology in NiAl-34Cr to lamellae by adding 0.6 at.% Mo, further morphology transformations along the eutectic trough in the NiAl-(Cr,Mo) alloys were observed. Compositions with at least 10.3 at.% Cr have lamellar morphology while the first tendency to fiber formation was found at 9.6 at.% Cr. There is a compositional range, where both lamellae and fibers are present in the microstructure and a further decrease in Cr to 1.8at.% Cr results in fully fibrous morphology. Alongside these morphology changes of the (Cr,Mo)ss reinforcing phase, its volume fraction was found to be from 41 to 11 vol.% confirming the trend predicted by the CALPHAD approach. For mixed morphologies in-situ X-ray diffraction experiments performed between room and liquidus temperature accompanied by EDX measurements reveal the formation of a gradient in composition for the solid solution. A new Mo-rich NiAl-9.6Cr-10.3Mo alloy clearly shows this effect in the as-cast state. Moreover, crystallographic orientation examination yields two different types of colonies in this composition. In the first colony type, the orientation relationship between NiAl matrix and (Cr,Mo)ss reinforcing phase was ( 100 ) NiAl|| ( 100 ) Cr,Mo and 100 NiAl|| 100 Cr,Mo. An orientation relationship described by a rotation of almost 60° about 111 was found in the second colony type. In both cases, no distinct crystallographic plane as phase boundary was observed.

1. Introduction

The challenges in power generation and air transportation require new high-temperature materials to increase efficiency. Therefore, seminal contributions on NiAl-based in-situ composites during the last years have sparked activities in this field [1,2,3,4]. The intermetallic NiAl phase was believed to be a promising candidate for high temperature structural applications, due to its higher melting temperature (Tm = 1638 °C), lower density (ρ ≈ 6 g/cm3) and excellent high-temperature oxidation resistance compared to Ni-based superalloys [5,6]. However, the monolithic intermetallic B2-phase suffers from low creep resistance and insufficient strength at elevated temperatures as well as from poor fracture toughness at room temperature [6,7]. It has been shown that alloying with refractory metals such as Cr, Mo, Re, V and W leads to quasi-binary eutectics [1,4]. The resulting microstructure is composed of NiAl as matrix and an embedded second phase, which causes a reinforcement [1,8,9,10,11]. With this goal in mind, several directionally solidified NiAl-X alloys have been studied in the past, namely NiAl-10Mo (in what follows all concentrations are given in at.% unless otherwise stated) [1,2,3,4,8,10,11,12,13], NiAl-34Cr [2,4,12,14,15,16] and Cr-rich NiAl-(34-x)Cr-xMo 0 ≤ x < 6 at.% [2,4,17,18,19]. For instance, the fracture toughness at room temperature is 16 MPa √m, 20MPa∙√m and 24 MPa∙√m for NiAl-9Mo, NiAl-34Cr and NiAl-28Cr-6Mo, respectively. This is clearly enhanced compared to 6 MPa∙√m for single phase polycrystalline NiAl [2]. Previous work by Peng et al. [20] on calculation and validation of the quaternary system by refinement of the thermodynamic description brought new insights into the quaternary system. A eutectic trough connecting the two eutectic edge systems has been reported and experimentally validated. This expands the alloy range of eutectic structures within the NiAl-(Cr,Mo) system. Therefore, the quaternary system needs further examination to estimate the potential of new alloy compositions in detail. In the present study, the microstructure of several alloys along the eutectic trough was investigated in the as-cast state. Beside the morphological examination, chemical compositions of the individual phases together with their orientation relationship were investigated. The lattice parameter evolution along the eutectic trough was studied from room temperature up to liquidus temperature with a specially designed device suited for in-situ observation during directional solidification.

2. Materials and Methods

Alloys with nominal compositions of NiAl-xCr-yMo (x = 34 … 0 at.%; y = 0 … 10.3 at.%) and binary NiAl were synthesized by using an arc-melting device provided by Edmund Bühler GmbH (Bodelshausen, Germany). The elements Ni, Al, Cr and Mo with nominal purities of 99.97, 99.9, 99.96 and 99%, respectively, were weighed according to the required compositions. To ensure an oxygen-lean atmosphere the chamber was evacuated multiple times and purged with Ar. The Ar working pressure was maintained at 600 mbar. Furthermore, a lump of Zr metal was melted prior to melting operations on NiAl-(Cr,Mo) in order to remove the residual oxygen in the chamber. The produced buttons were flipped and re-melted at least five times to achieve sufficient homogeneity and then cast into a water-cooled, rod-shaped Cu-mold. The typical geometry of the rods was 12 mm in diameter and 170 mm in length. No specific loss of a certain element during arc melting was noticed while the overall mass loss was always lower than 0.3 wt.%. Thus, changes in the alloy composition by evaporation are negligible. The nominal compositions of the alloys are highlighted by blue open symbols in Figure 1a. Among all investigated alloys listed in Figure 1b, particular focus during the course of this article is on the following nominal compositions: NiAl-34Cr, NiAl-9.6Cr-10.3Mo and NiAl-10Mo.
Lattice parameter investigations of the individual phases were carried out by in-situ experiments ranging from room up to liquidus temperature at the High Energy Materials Science beamline (HEMS)/ PETRA III storage ring/Deutsches Elektronen-Synchrotron (DESY, Hamburg, Germany), operated by Helmholtz-Zentrum Geesthacht. The monochromatic beam with photon energy of ~100keV and a narrow cross section of (1 × 0.5) mm2 was used for X-ray diffraction in transmission mode. A two-dimensional PerkinElmer detector was placed perpendicular to the incident beam. The obtained Debye–Scherrer patterns were evaluated by means of Fit2D software with respect to azimuthal integration [21,22,23]. Subsequently, the resulting files were analyzed by using MAUD software [24] for Rietveld refinement and lattice parameter determination by Nelson–Riley approach [25]. For microstructural analysis samples were cut by electro-discharge machining. A standard metallographic procedure was applied. Scanning electron microscopy was performed using backscatter electron imaging (SEM-BSE) on a Zeiss EVO50 microscope in order to investigate the resulting microstructures. The volume fractions were determined by manual evaluation of the areal fractions after binarization with the ImageJ software. Based on the assumption of isometry and isotropy of the investigated microstructure the areal fraction is expected to be equal to the volume fraction. A thermodynamic database for Ni-Al-Cr-Mo [20,26,27] was used in Thermo-Calc software to calculate the volume fraction for the experimental investigated compositions. Additional orientation imaging microscopy by electron backscatter diffraction (EBSD) and chemical composition by energy dispersive X-ray spectroscopy (SEM-EDX) were carried out using an Auriga dual beam scanning electron and focused ion beam microscope by Carl Zeiss AG (Oberkochen, Germany) equipped with an EDAX Octane silicon drift detector EDX system at 20 kV.

3. Results and Discussion

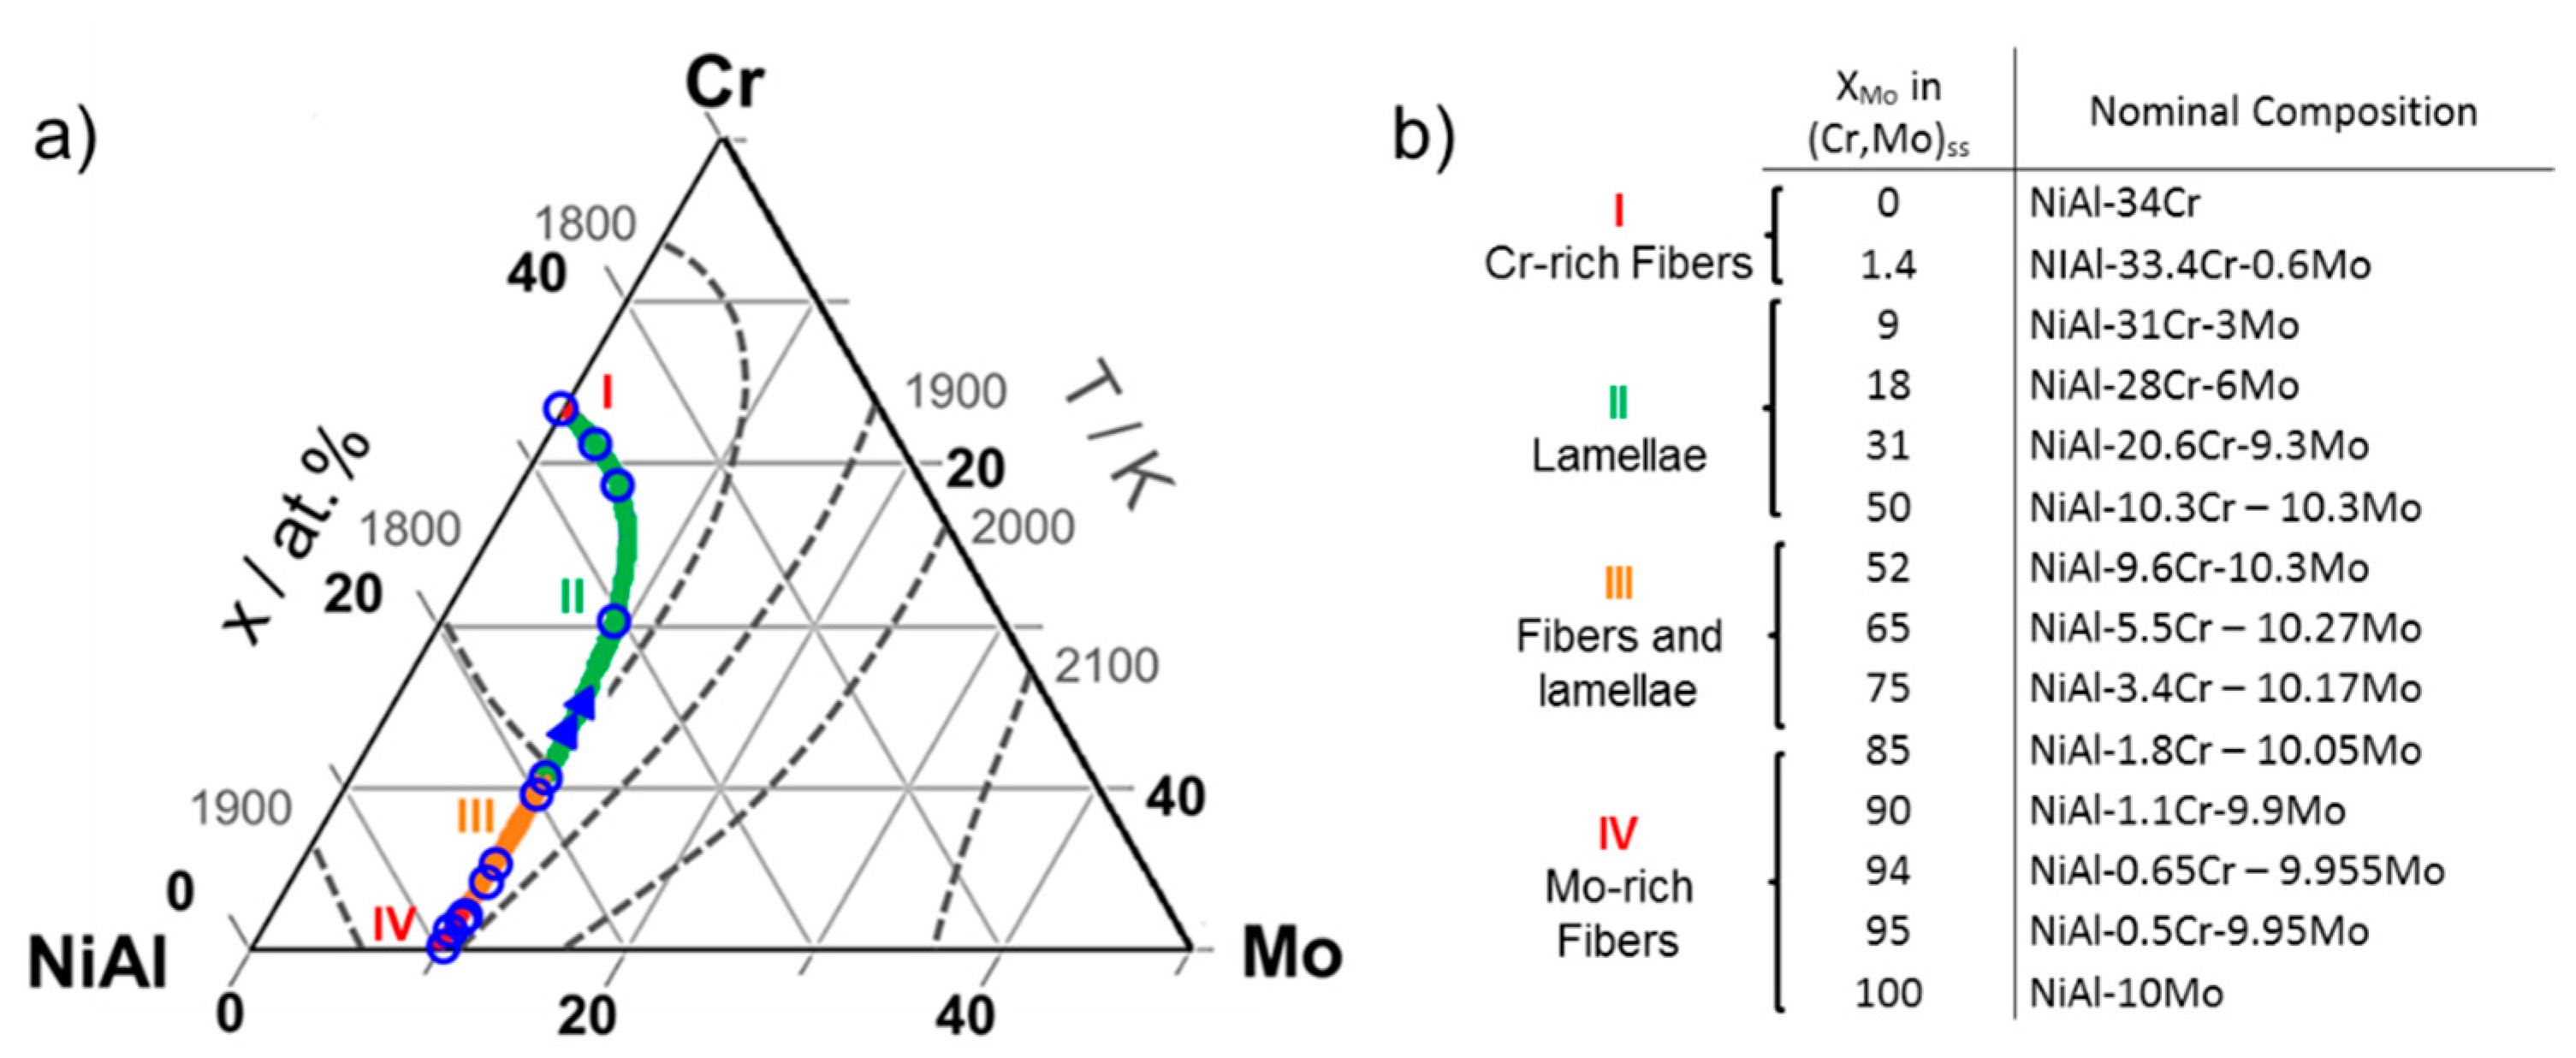
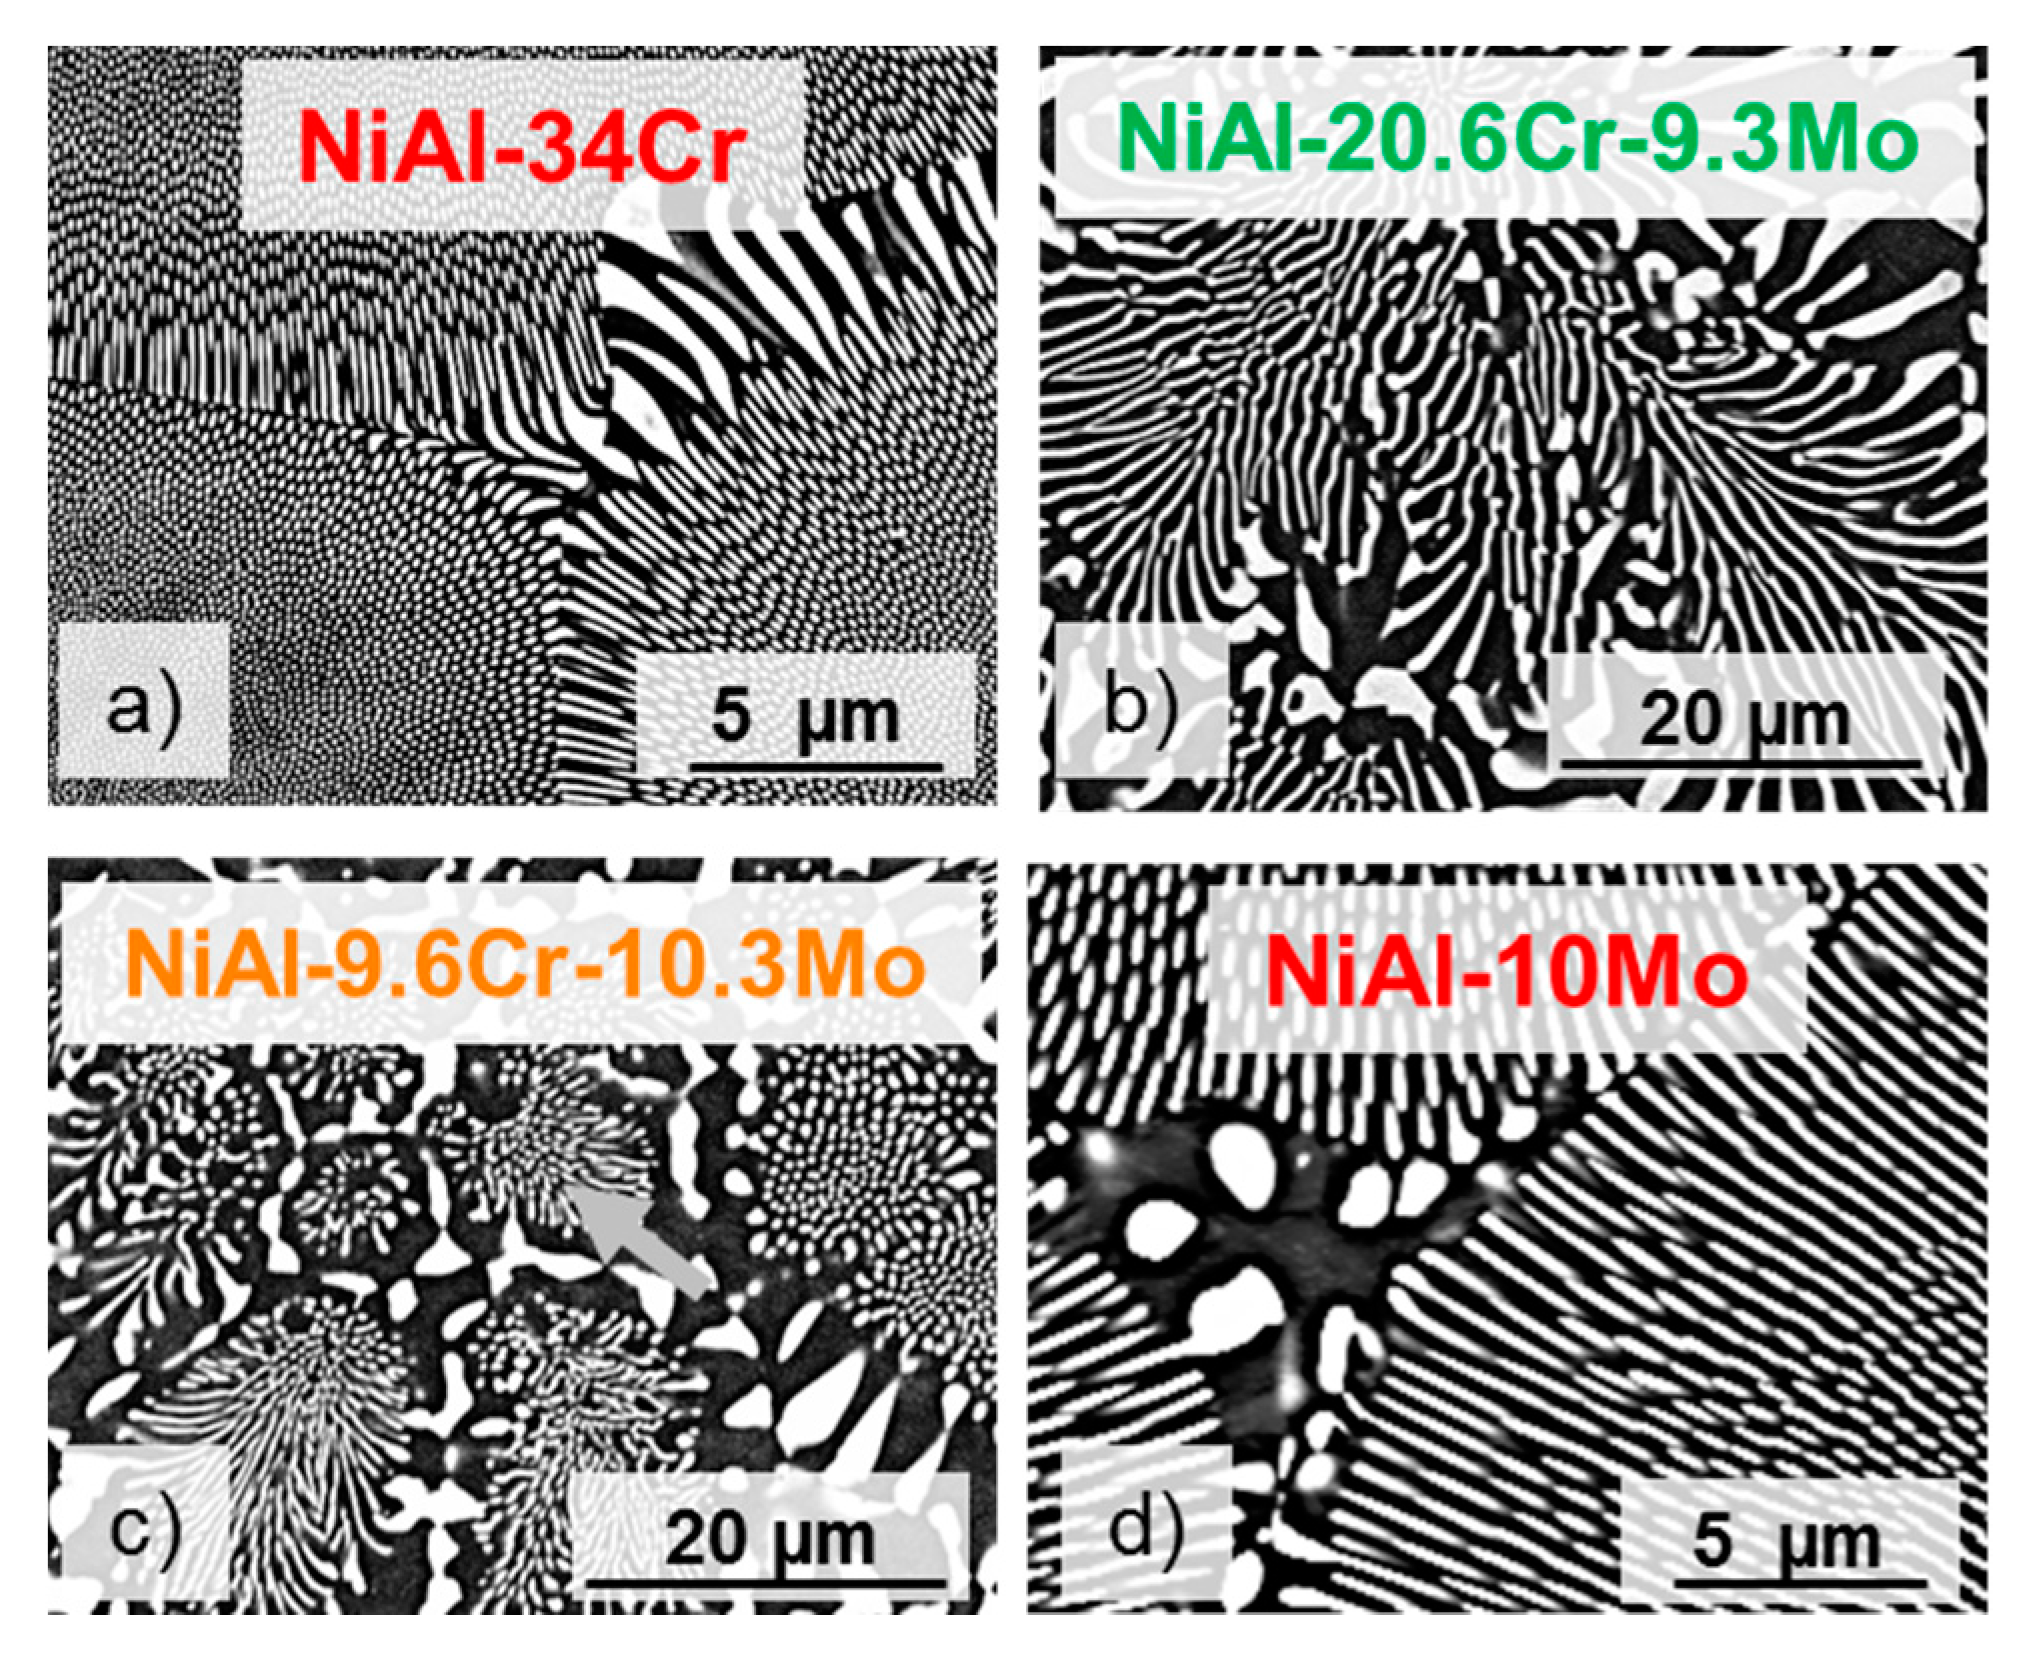
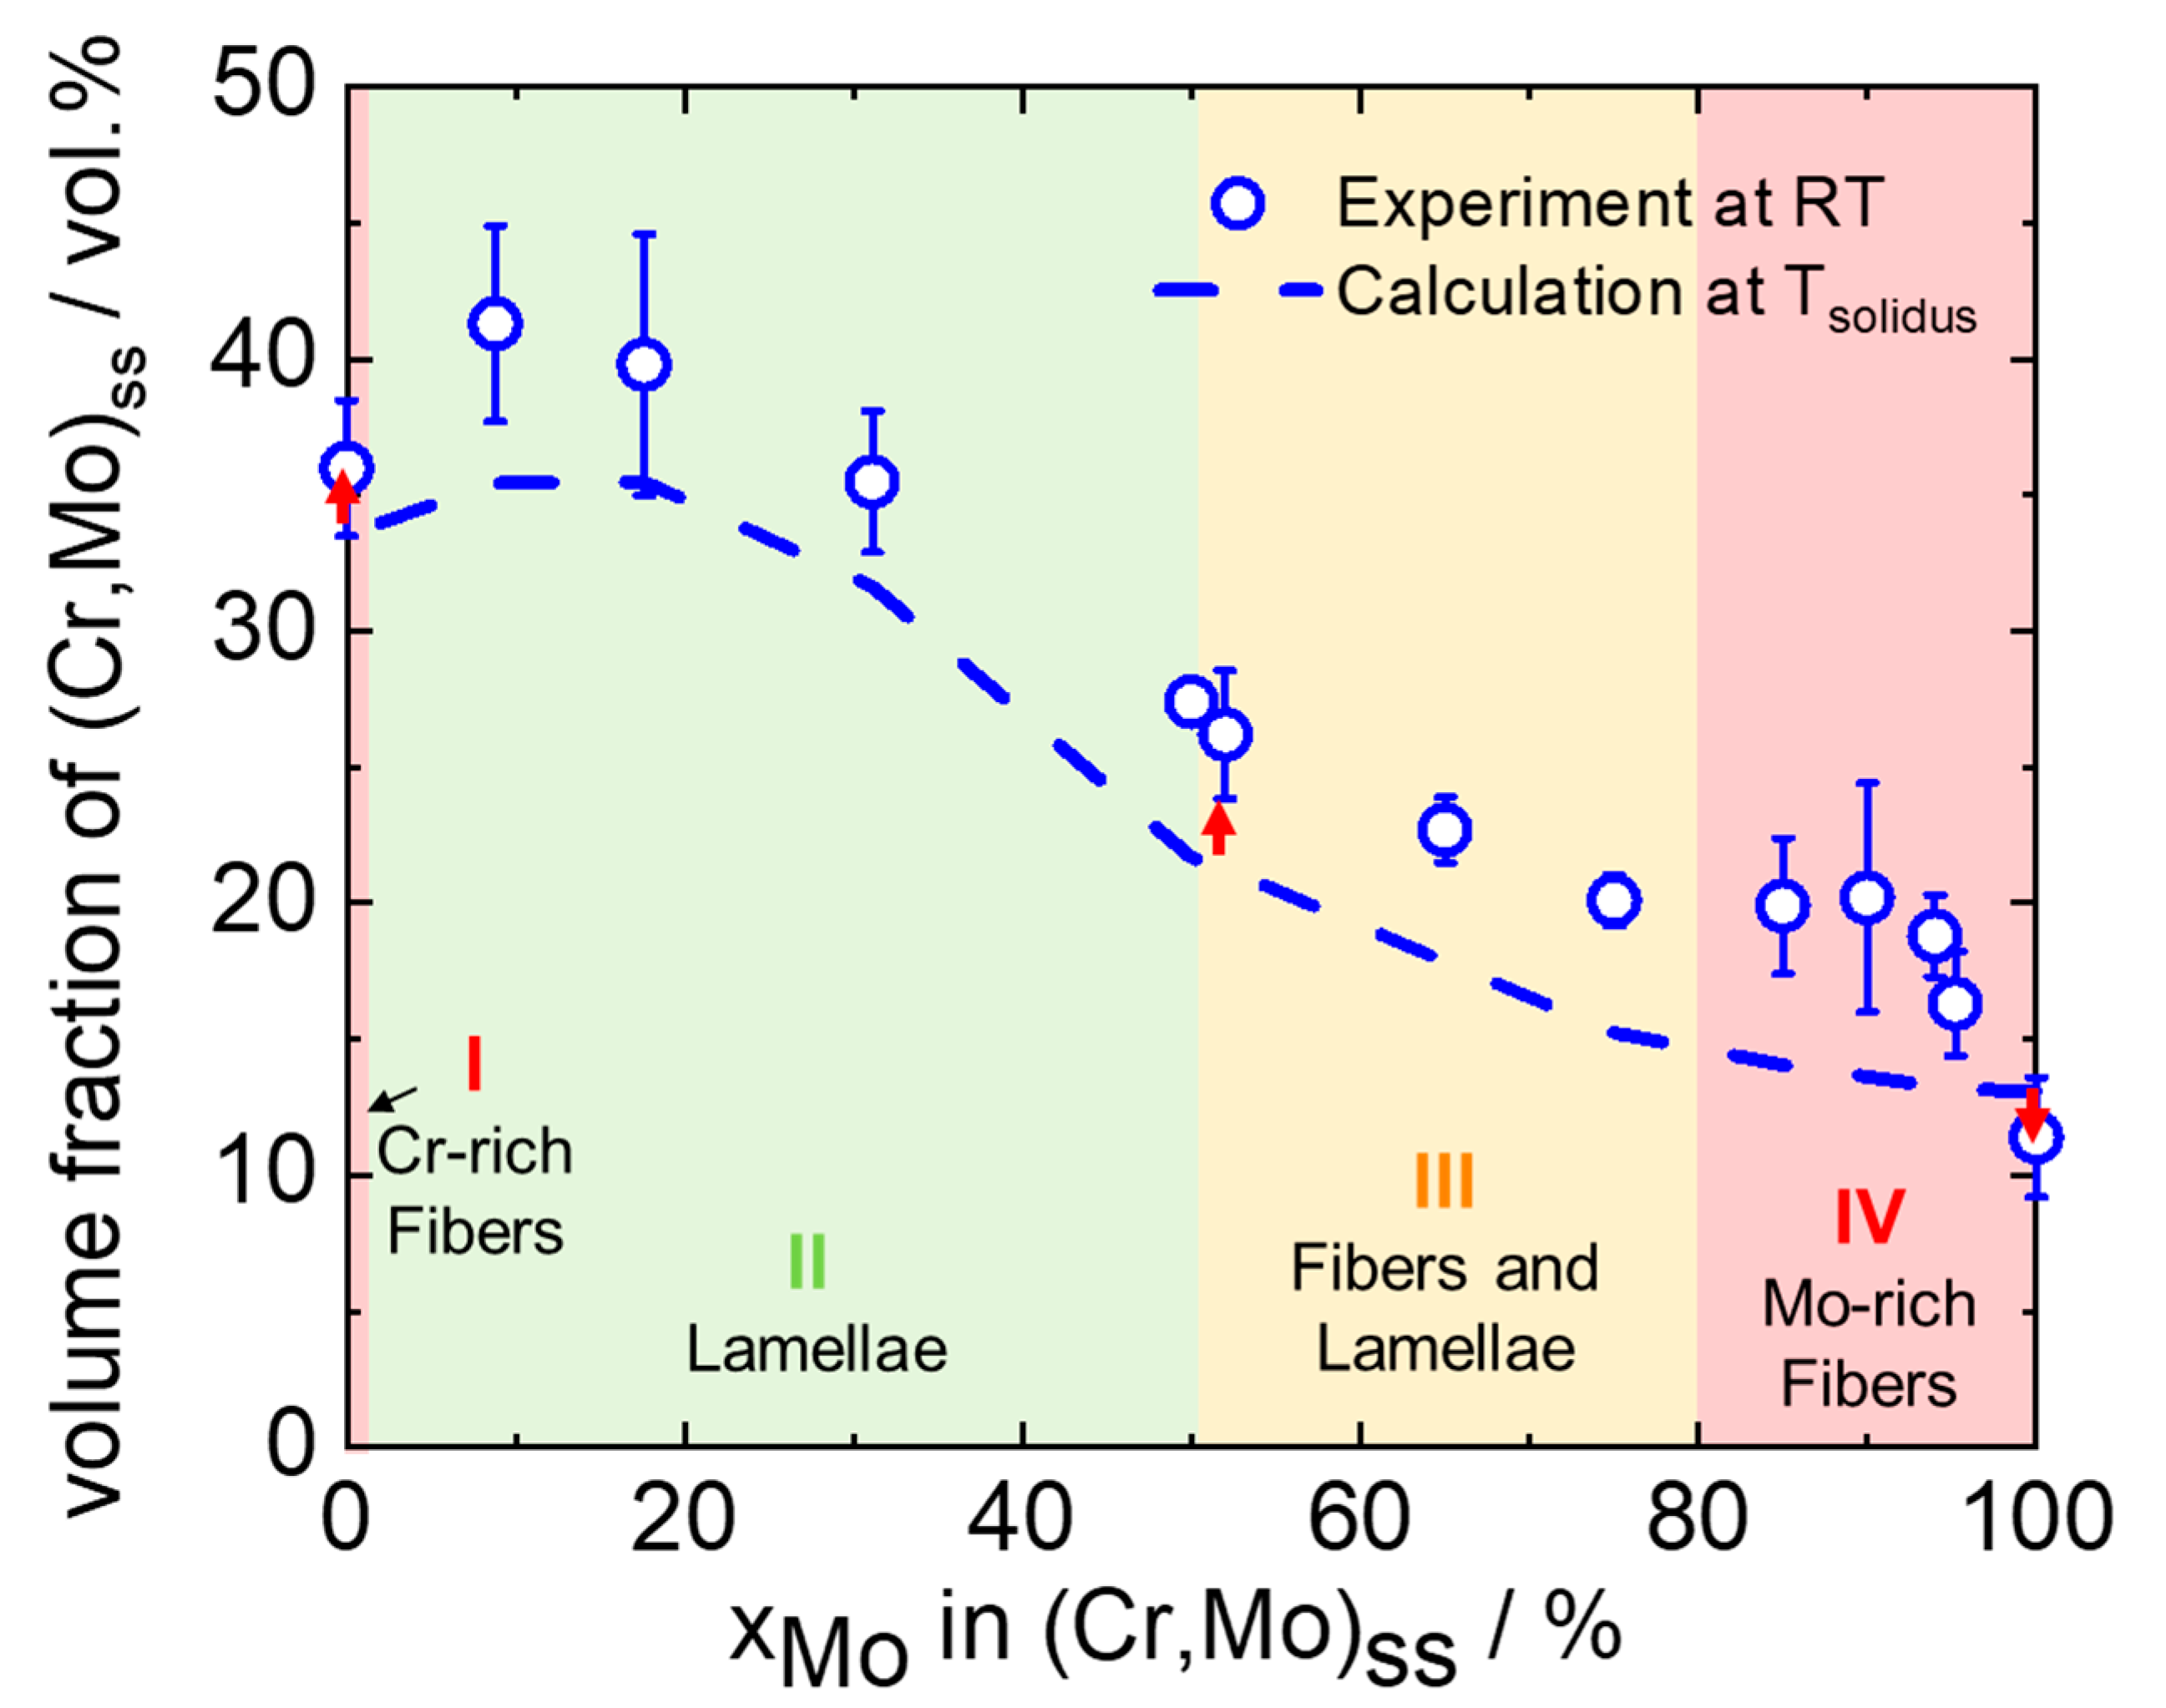
3.1. Morphology and Volume Fraction of the Solid Solution

The calculated liquidus projection of the pseudo-ternary NiAl-Cr-Mo system based on work by Peng et al. [20] is shown in Figure 1a. The eutectic trough connects the two pseudo-binary reactions and is highlighted by a solid, colored line. Adjacent to the eutectic trough, the B2 NiAl or the solid solution (Cr,Mo)ss solidify primarily before termination of solidification as the eutectic reaction occurs. In addition, isotherms of the liquidus surface are incorporated as dashed, gray lines in Figure 1a. The liquidus temperature decreases along the eutectic trough alongside the double arrow. Significant changes in morphology are detected for alloys represented by different colors in Figure 1a and b. In addition to the reported sharp transition of morphology at 0.6 at.% Mo (red part of the line, marked by I) [2,4,14], two further morphology transitions were found for which the regions are highlighted in green (segment “II”), orange (segment “III”) and red (segment “IV”). At high Cr contents, between 33 and 10.3 at.% Cr, the reinforcing (Cr,Mo)ss is present as lamellae (green, II) within the NiAl matrix. A decrease of Cr concentration to below 10.2 at.% Cr and a corresponding increase in Mo up to 10.3 at.% leads to both fibrous and lamellar morphologies next to each other (orange, III). The transition to fibers occurs gradually and was observed for a continuing Cr reduction down to 3.4 at.%. Finally, lower Cr concentrations below 1.8 at.% lead to fully fibrous morphology (red, IV). SEM-BSE images of the as-cast state are presented in Figure 2a–d for the four regions described above. Figure 2a,d correspond to the NiAl-34Cr and NiAl-10Mo compositions. The micrograph in Figure 2b was taken from the NiAl-20.6Cr-9.3Mo alloy and Figure 2c from the NiAl-9.6Cr-10.3Mo alloy. The NiAl matrix and the (Cr,Mo)ss reinforcing phase are represented by the dark and bright contrast, respectively.
In order to potentially assess composite strengthening vs. melting temperature in this alloy series, the volume fraction of the reinforcing phase as a function of Mo concentration within the (Cr,Mo)ss is plotted in Figure 3. The abscissa refers to the first column in Figure 1b. The blue, open symbols (as already highlighted in Figure 1a) represent experimentally determined volume fractions after solidification and cooling to room temperature. A solid solution volume fraction of 35 vol.% was determined for the NiAl-34Cr alloy, which is identical the value reported in References [1,15]. Starting from NiAl-34Cr at the left the volume fraction of (Cr,Mo)ss increases initially with increasing Mo concentration and reaches a maximum at a Mo concentration of 9% within (Cr,Mo)ss. This Mo concentration within the (Cr,Mo)ss corresponds to the overall alloy composition NiAl-31Cr-3Mo. With further increasing of the Mo concentration, between 10 and 52% Mo within (Cr,Mo)ss, the volume fraction of the reinforcing, lamellar phase decreases from 41 to 27 vol.%. With further increasing of the Mo concentration the experimental volume fractions further decrease before levelling off at 20 vol.% in the high Mo concentration range, up to 95% Mo within (Cr,Mo)ss. A drop in volume fraction from 16 to 11 vol.% was determined between the quaternary alloy with 94% Mo in (Cr,Mo)ss and the ternary NiAl-10Mo, with the latter number being close to 11.9 vol.% reported in Reference [1] but significantly smaller compared to 14 vol.% reported in Reference [3].
The blue dashed line indicates thermodynamic equilibrium data at the solidus temperature based on Reference [20]. In general, the calculated volume fractions follow the trend of the experimentally determined volume fractions. For all Cr containing alloys, an average deviation of 4 vol.% was observed compared to the experimental results. Only in the edge systems was a satisfactory agreement within the scatter of measurement obtained. Differences in the determined and calculated volume fractions may be rationalized with the aid of Reference [28] where three potential reasons were proposed: (a) inaccuracies of the thermodynamic dataset, (b) differences in actual densities of the phases at the solidus temperature, and (c) the compositions at the solidus temperature may be different from the compositions during post solidification. This will be discussed in more detail next.
(a) Only occasionally, primarily solidified (Cr,Mo)ss was observed in the investigated quaternary compositions, which indicates that the compositions are on or very close to the eutectic compositions. This also verifies that the compositions on the eutectic trough were correctly assessed by Peng et al. [20,26,27]. (b) To ensure an accurate calculation of the volume fractions, densities were calculated using experimentally determined crystallographic data close to solidus temperature. The cross-check with lattice parameters at room temperature led to a difference of only 0.3 vol.% in the calculated volume fractions. (c) In order to examine the change in composition during post solidification, volume fractions at solidus temperature were compared with the ones at 1000 °C (note that the current dataset cannot be used at room temperature). For compositions up to 52% Mo in (Cr,Mo)ss, a correction of ≈1 vol.% on average towards higher volumes was obtained, when cooling from solidus temperature to 1000 °C (red arrows in Figure 3). Consequently, the dashed line then lies within the scatter of measurements or very close to it. By contrast, the same cooling results in ≈1 vol.% lower volume fraction for compositions in region IV. With the exception of NiAl-10Mo, this increases the deviation between calculated and experimentally determined volume fractions (indicated by the red arrow in Figure 3). The correction of the dashed curve in quaternary alloys in region IV would lead to a less satisfactory match between determined and calculated volume fractions.
It should be noted that the samples were produced in a non-equilibrium manner with a high cooling rate. Therefore, one could assume that the compositions do not change notably between 1000 °C and cooling to room temperature. To assess this issue in more detail, the calculated compositions are compared to experimental compositions in both phases for the alloys in region IV with 95 and 90% Mo within (Cr,Mo)ss, in Table 1. Both compositions were expected to show lower volume fractions at room temperature. In both samples, the amount of Ni and Al in (Cr,Mo)ss was significantly higher than predicted by the thermodynamic calculations. The same holds for the amount of Cr and Mo in the NiAl matrix, although being closer to the thermodynamic calculations. This might also affect the volume fraction being higher than expected. Further analysis on chemical distribution will be discussed in the following section. Therefore, the details of solute partitioning seem to not be accordingly reflected by the thermodynamic dataset so far.

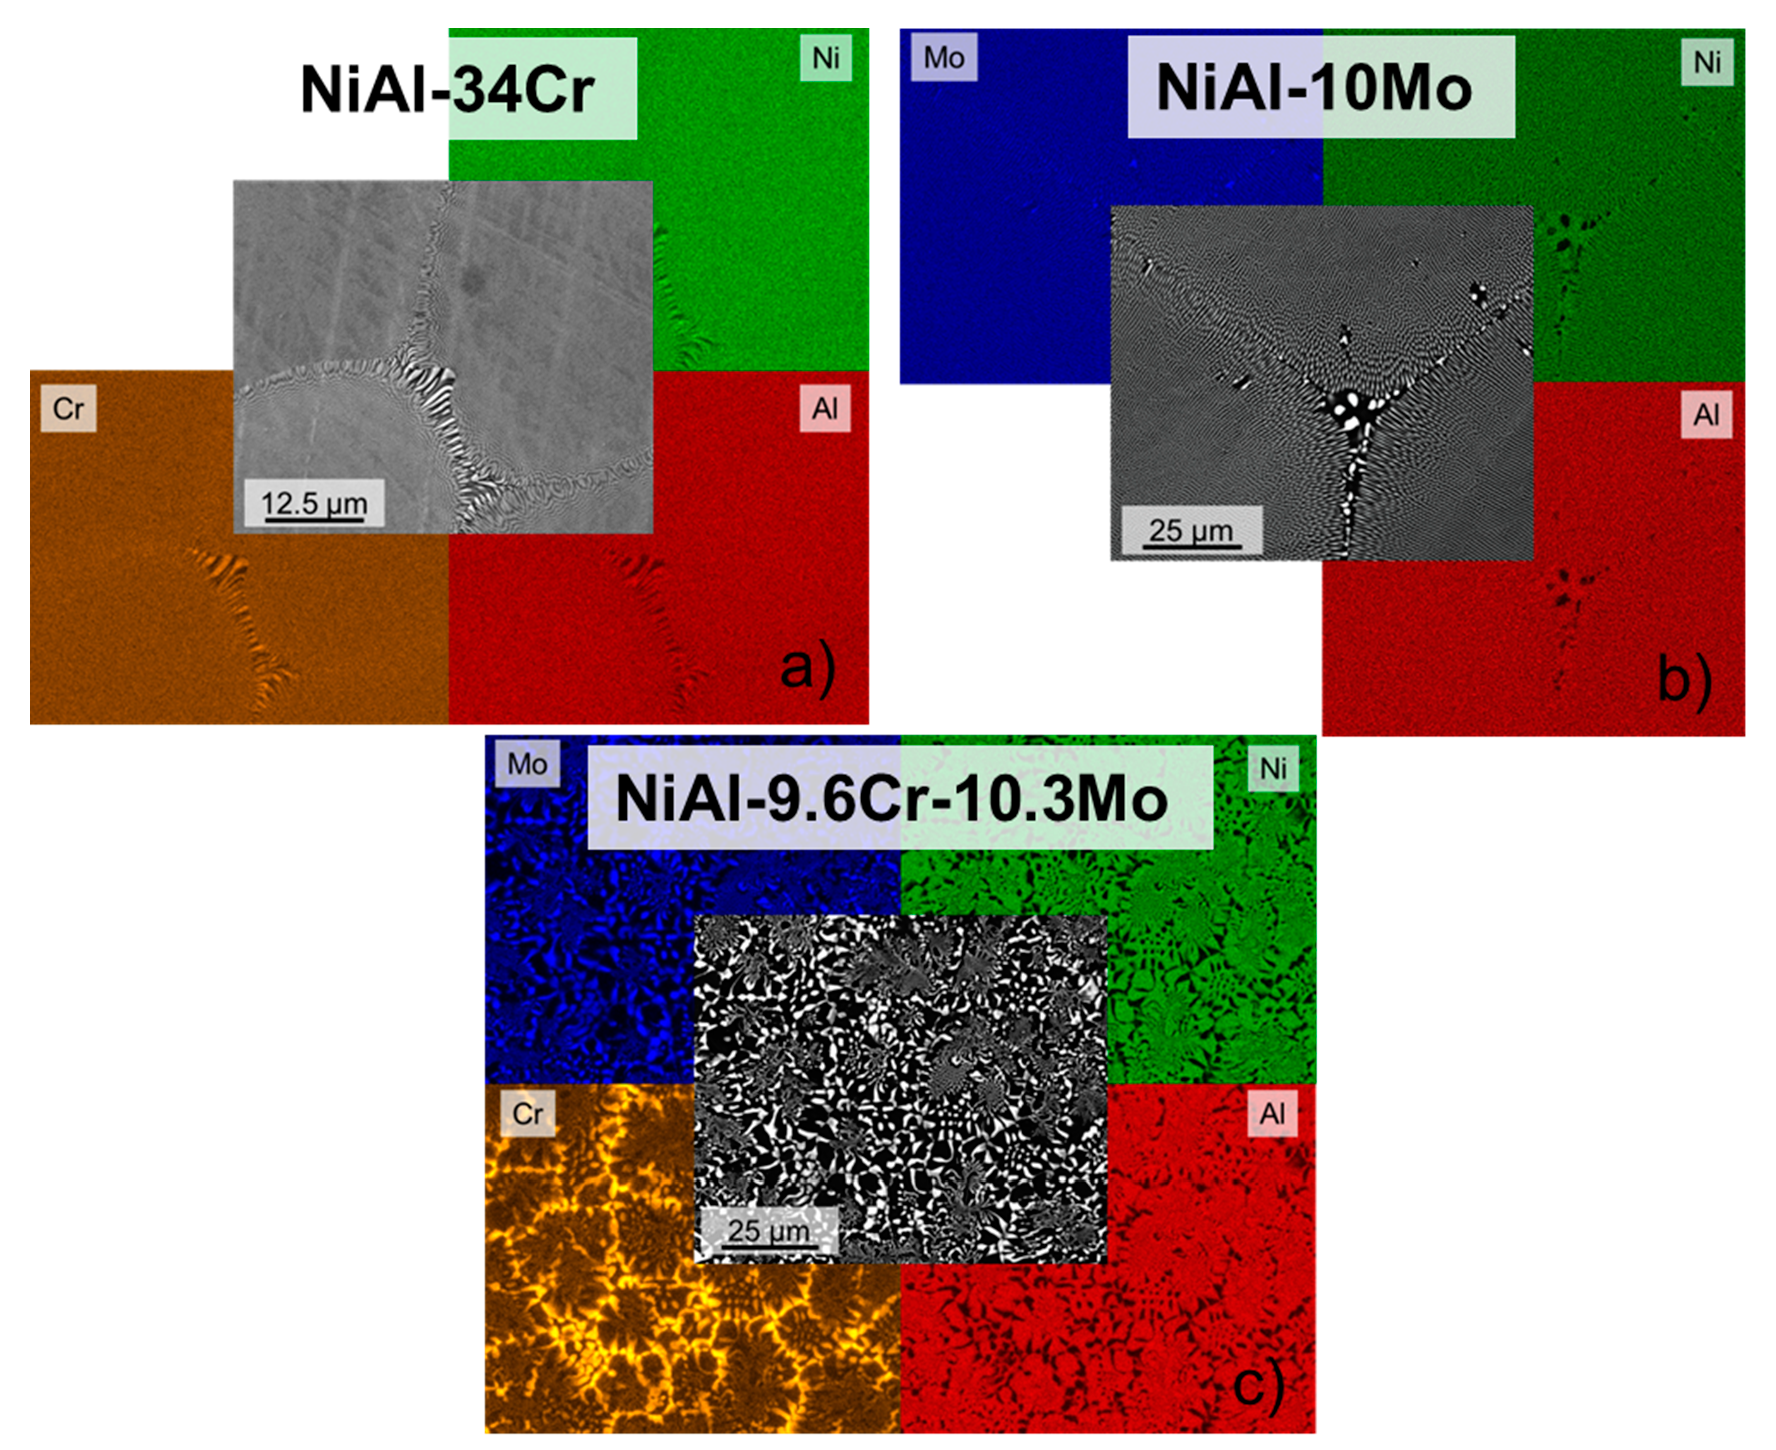
3.2. Element Distribution within the Microstructure

For the chemical analysis of the resulting microstructures high resolution SEM-EDX maps are presented in Figure 4. In order to compare the elemental distribution in the different alloys, the EDX maps of the constituents Mo, Cr, Ni and Al are provided in the upper left, lower left, upper right and lower right corners, respectively. Figure 4 shows the three alloy compositions as already presented in Figure 2a,c,d. The microstructural features in NiAl-34Cr and NiAl-10Mo are so fine that a differentiation between matrix and reinforcing phase is hardly possible (Figure 4a,b). The distribution for all constituent elements appears homogeneous. Focusing on the colony boundary only, the microstructure becomes coarser and one can distinguish between the NiAl matrix and solid solution phase. Ni (green) and Al (red) correspond to the darker phase which is the NiAl matrix. Cr (orange) and Mo (blue) are present in the bright, reinforcing phase. The element distribution in the NiAl-9.6Cr-10.3Mo alloy is different (Figure 4c). Ni and Al appear to be homogeneously distributed in the matrix. A distinct boundary between the two phases is obvious in the coarser regions. Mo is evenly distributed in the solid solution. In contrast, Cr appears to partition to both phases which is in agreement with Reference [29]: a Cr amount higher than its solubility limit in NiAl was detected by electron probe micro analysis [29]. Moreover, Cr enrichment was found in the vicinity of colony boundaries. Apparently, the solidification starts in the center of the colony with Mo-rich (Cr,Mo)ss. Subsequently, Cr enriches in the liquid at the solidification front and locally changes the composition towards higher Cr concentration. This leads to a decrease in the liquidus temperature and an increase in volume fraction of solid solution. As a consequence, Cr-rich (Cr,Mo)ss solidifies in a coarse manner and the colony boundaries become degenerated. In conclusion, the solid solution in the colony interior differs from the cell boundary. The effect of the different compositions on the lattice parameter evolution is presented in the following sections.

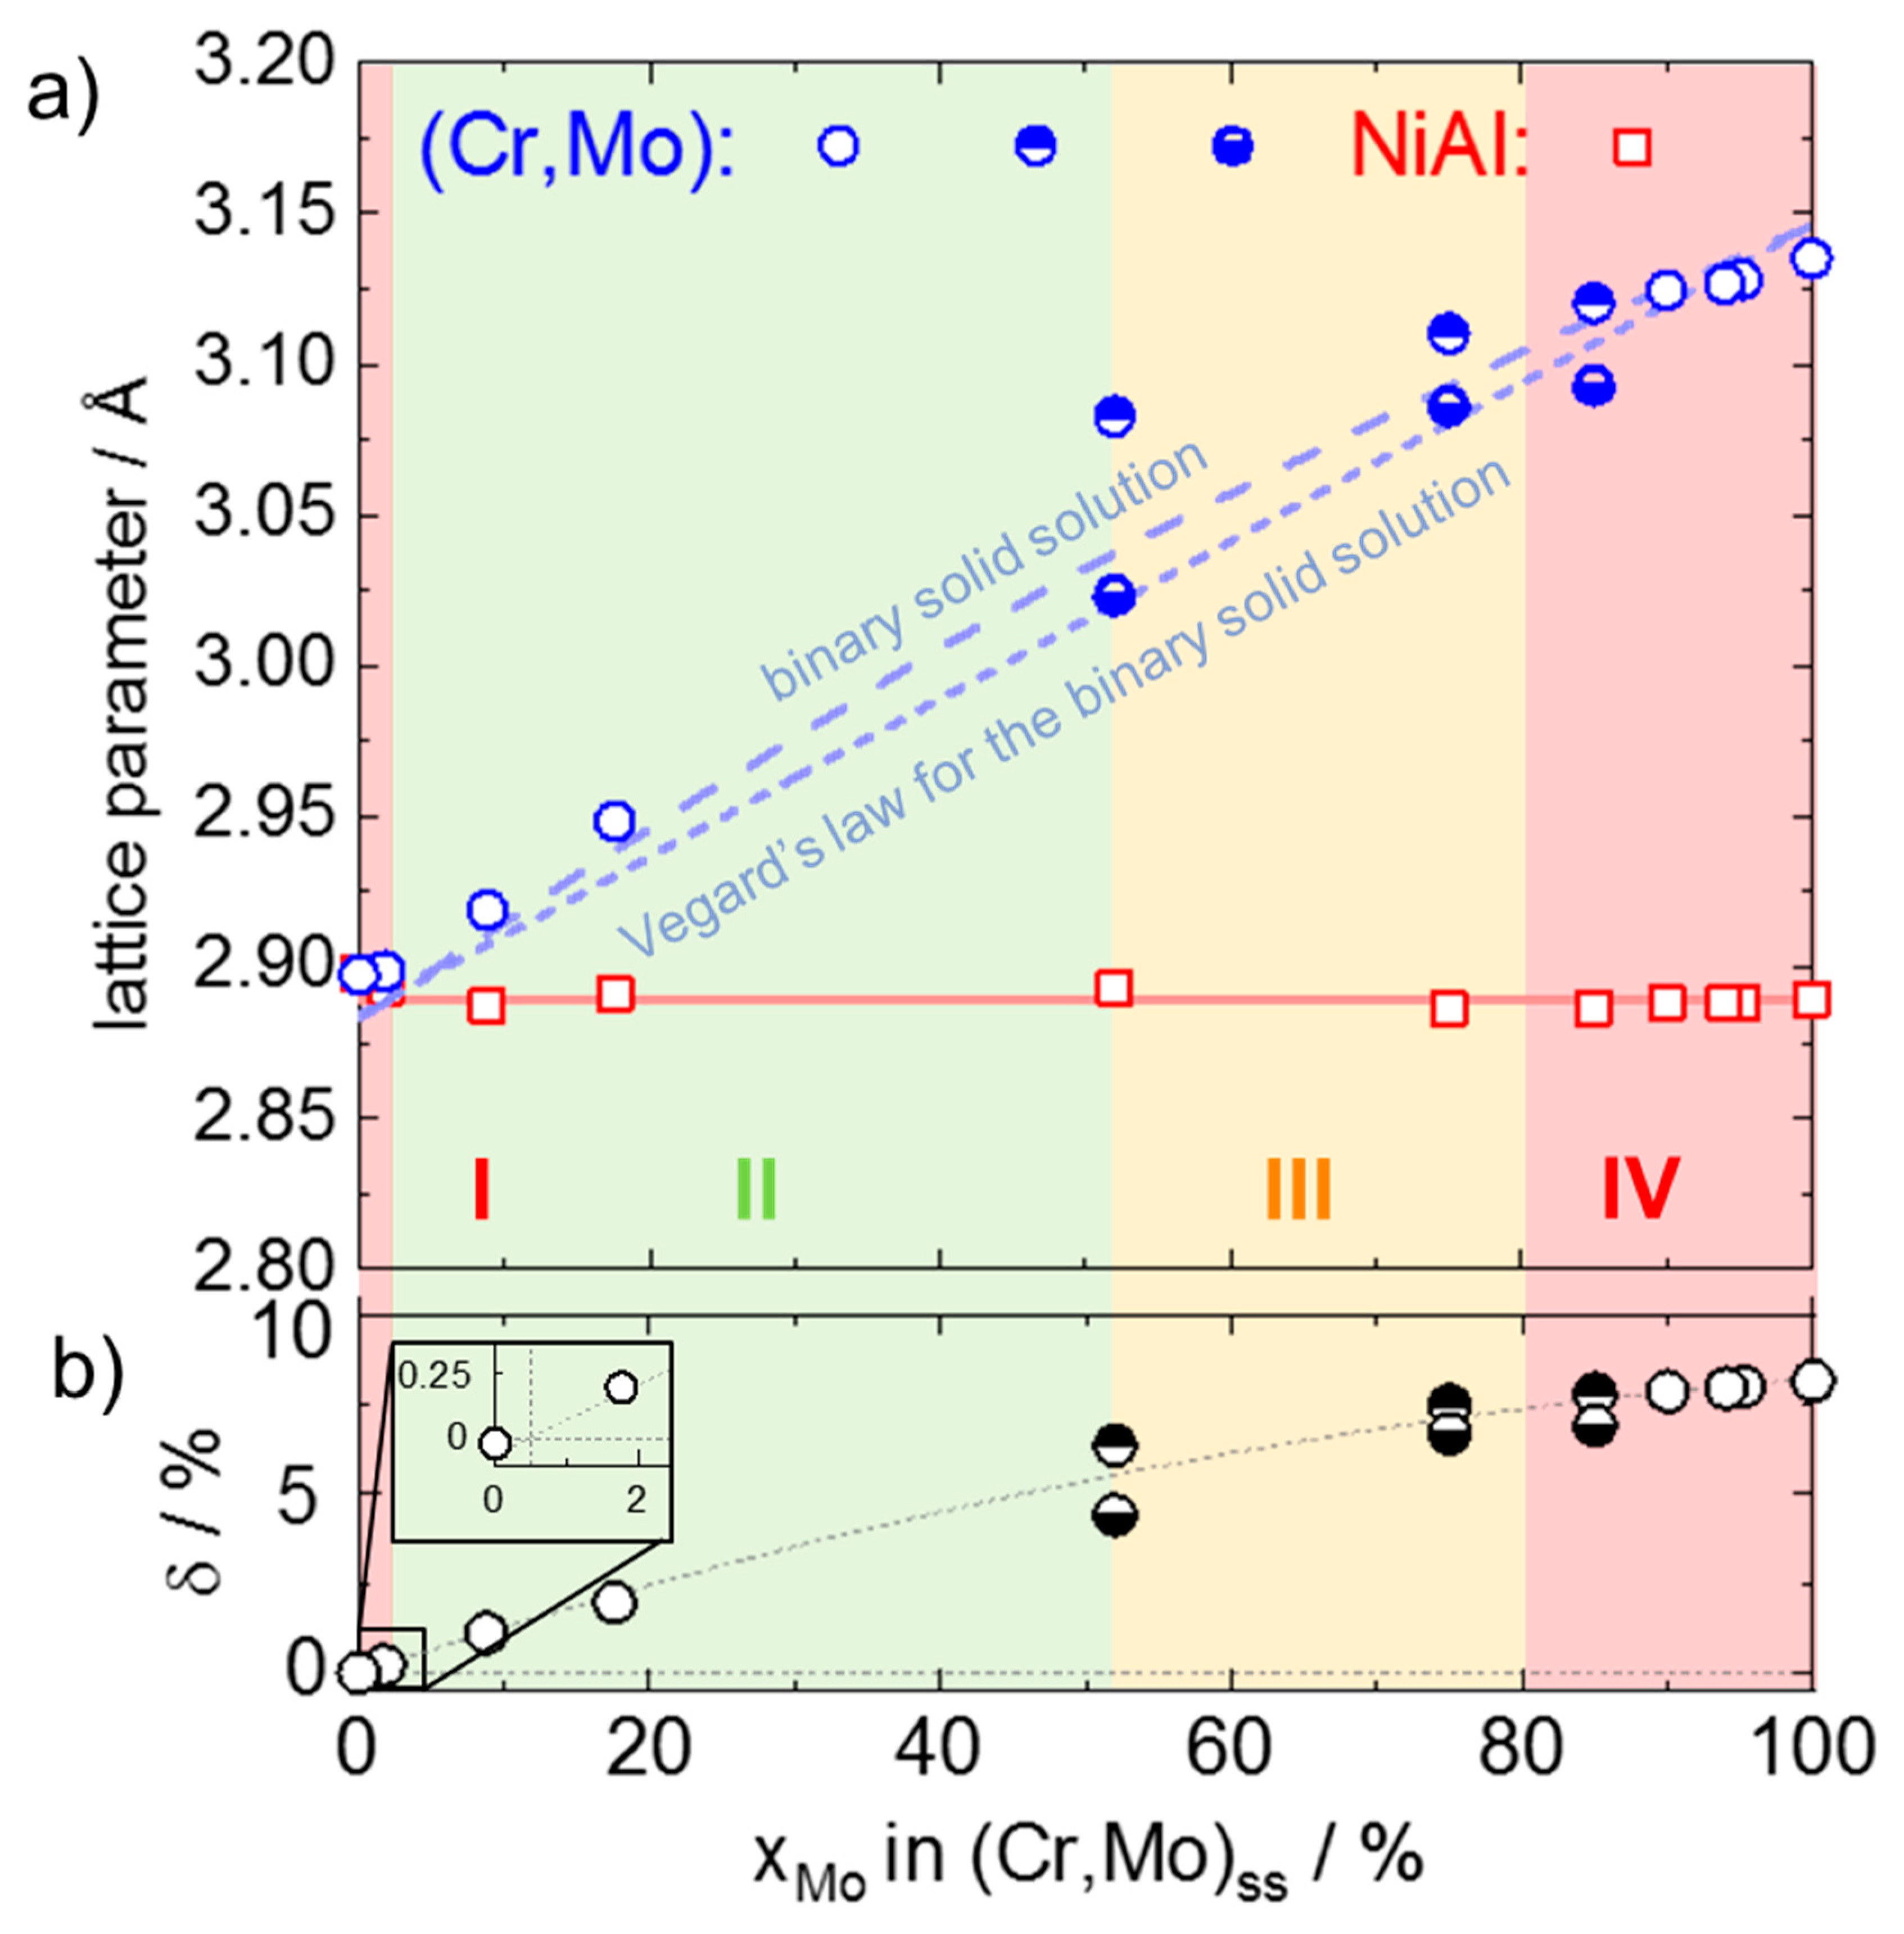
3.3. Room Temperature Lattice Parameter of NiAl and (Cr,Mo)ss

The lattice parameters of both phases, NiAl and (Cr,Mo)ss, at room temperature are plotted as a function of Mo concentration in the (Cr,Mo)ss in Figure 5a. The same systematics is chosen as in Figure 3, namely NiAl-34Cr is displayed on the left and NiAl-10Mo on the right side of the diagram, respectively. The lattice parameter of B2 NiAl and the solid solutions are represented with red and blue symbols, respectively. In the case of NiAl, the red solid line refers to the experimentally determined lattice parameter of binary NiAl (aNiAl = 2.890 Å). In all investigated alloys this lattice parameter remains constant, varying by a mere ±0.003 Å. These findings are in the range of the lattice parameters reported in literature, for binary NiAl varying from 2.885 to 2.887 Å [30,31,32] and for NiAl in the NiAl-(Cr,Mo) compound being 2.890 Å [4,14]. Thermodynamic calculations from Reference [20] predict a small excess of Ni in NiAl along the entire eutectic trough in the quaternary system and Reference [33] found that off-stoichiometric Ni-rich NiAl dissolves more Cr than stoichiometric or even Al-rich NiAl. Since the measurements in Table 1 show a small excess of Al in NiAl these findings may rationalize the above reported minimal deviation in the lattice parameters towards higher values. Nevertheless, the dissolved amount of Mo in NiAl likely also contributes to the variation in lattice parameter.
The lattice parameter of the (Cr,Mo)ss (a(Cr,Mo)) increases continuously with increasing Mo content (Figure 5a blue symbols). Open symbols denote alloys with a single solid solution phase and its lattice parameter as determined by the Nelson–Riley method. In case of half-filled symbols, two solid solutions with substantially different lattice parameters were necessary to appropriately describe the diffraction patterns by Rietveld refinement. The lattice parameters for the Mo-rich (Cr,Mo)ss and the Cr-rich (Cr,Mo)ss are represented by the upper and lower filled symbols, respectively (Figure 5a). Comparing this result with EDX analysis presented in Section 3.2, on NiAl-9.6Cr-10.3Mo, it is reasonable that the Mo-rich solid solution in the interior of a colony possesses a different lattice parameter than the Cr-rich solid solution at the colony boundary.
In Figure 5a, the dashed and dotted lines represent the binary (Cr,Mo)ss lattice parameter predicted by Vegard’s law and experimentally determined, respectively, reported in Reference [34]. The experimentally determined lattice parameters show a positive deviation with respect to the linear prediction of Vegard’s law. This effect was reported in different publications for the Cr-Mo system and was explained by a positive enthalpy of mixing [34,35,36,37]. The alloys with a single solid solution phase (open symbols) are consistent with this reported positive deviation, whereas the alloys with two solid solutions do not follow this trend. Lattice parameter mismatch between matrix and reinforcing phase was calculated as a function of composition by Equation (1) and presented additionally in Figure 5b.
δ = 2 · a ( C r , M o ) a N i A l a ( C r , M o ) + a N i A l

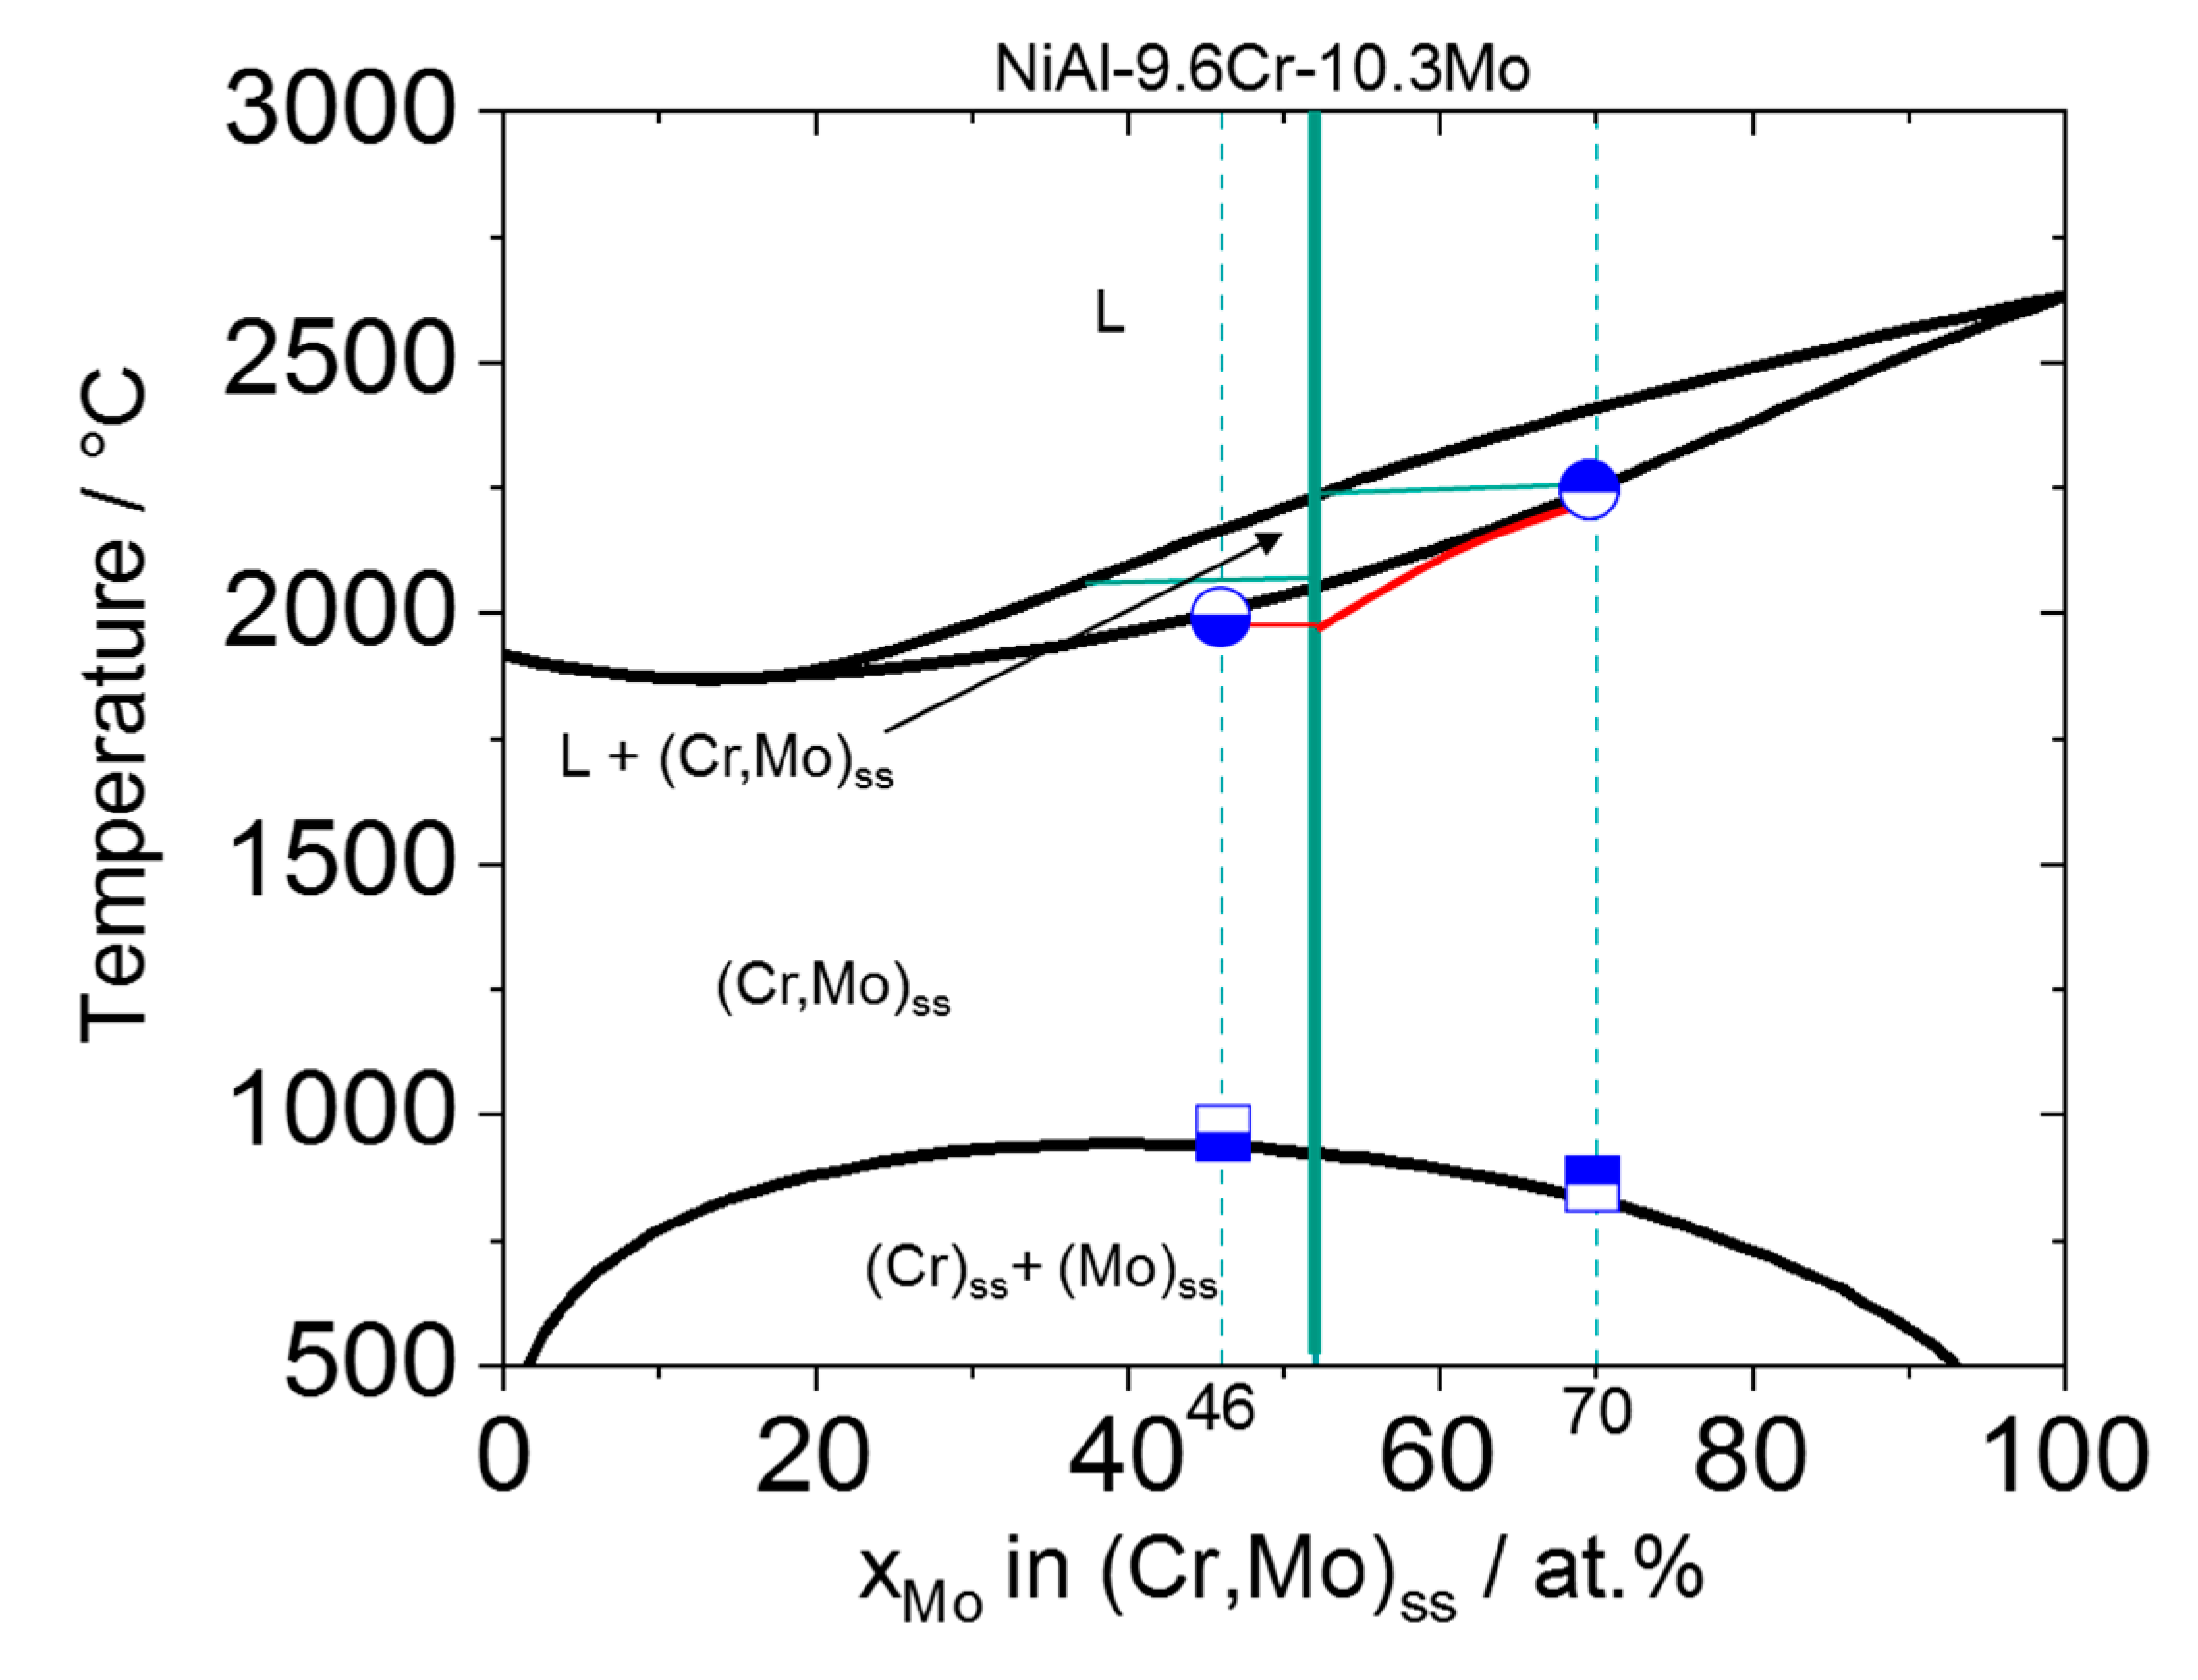
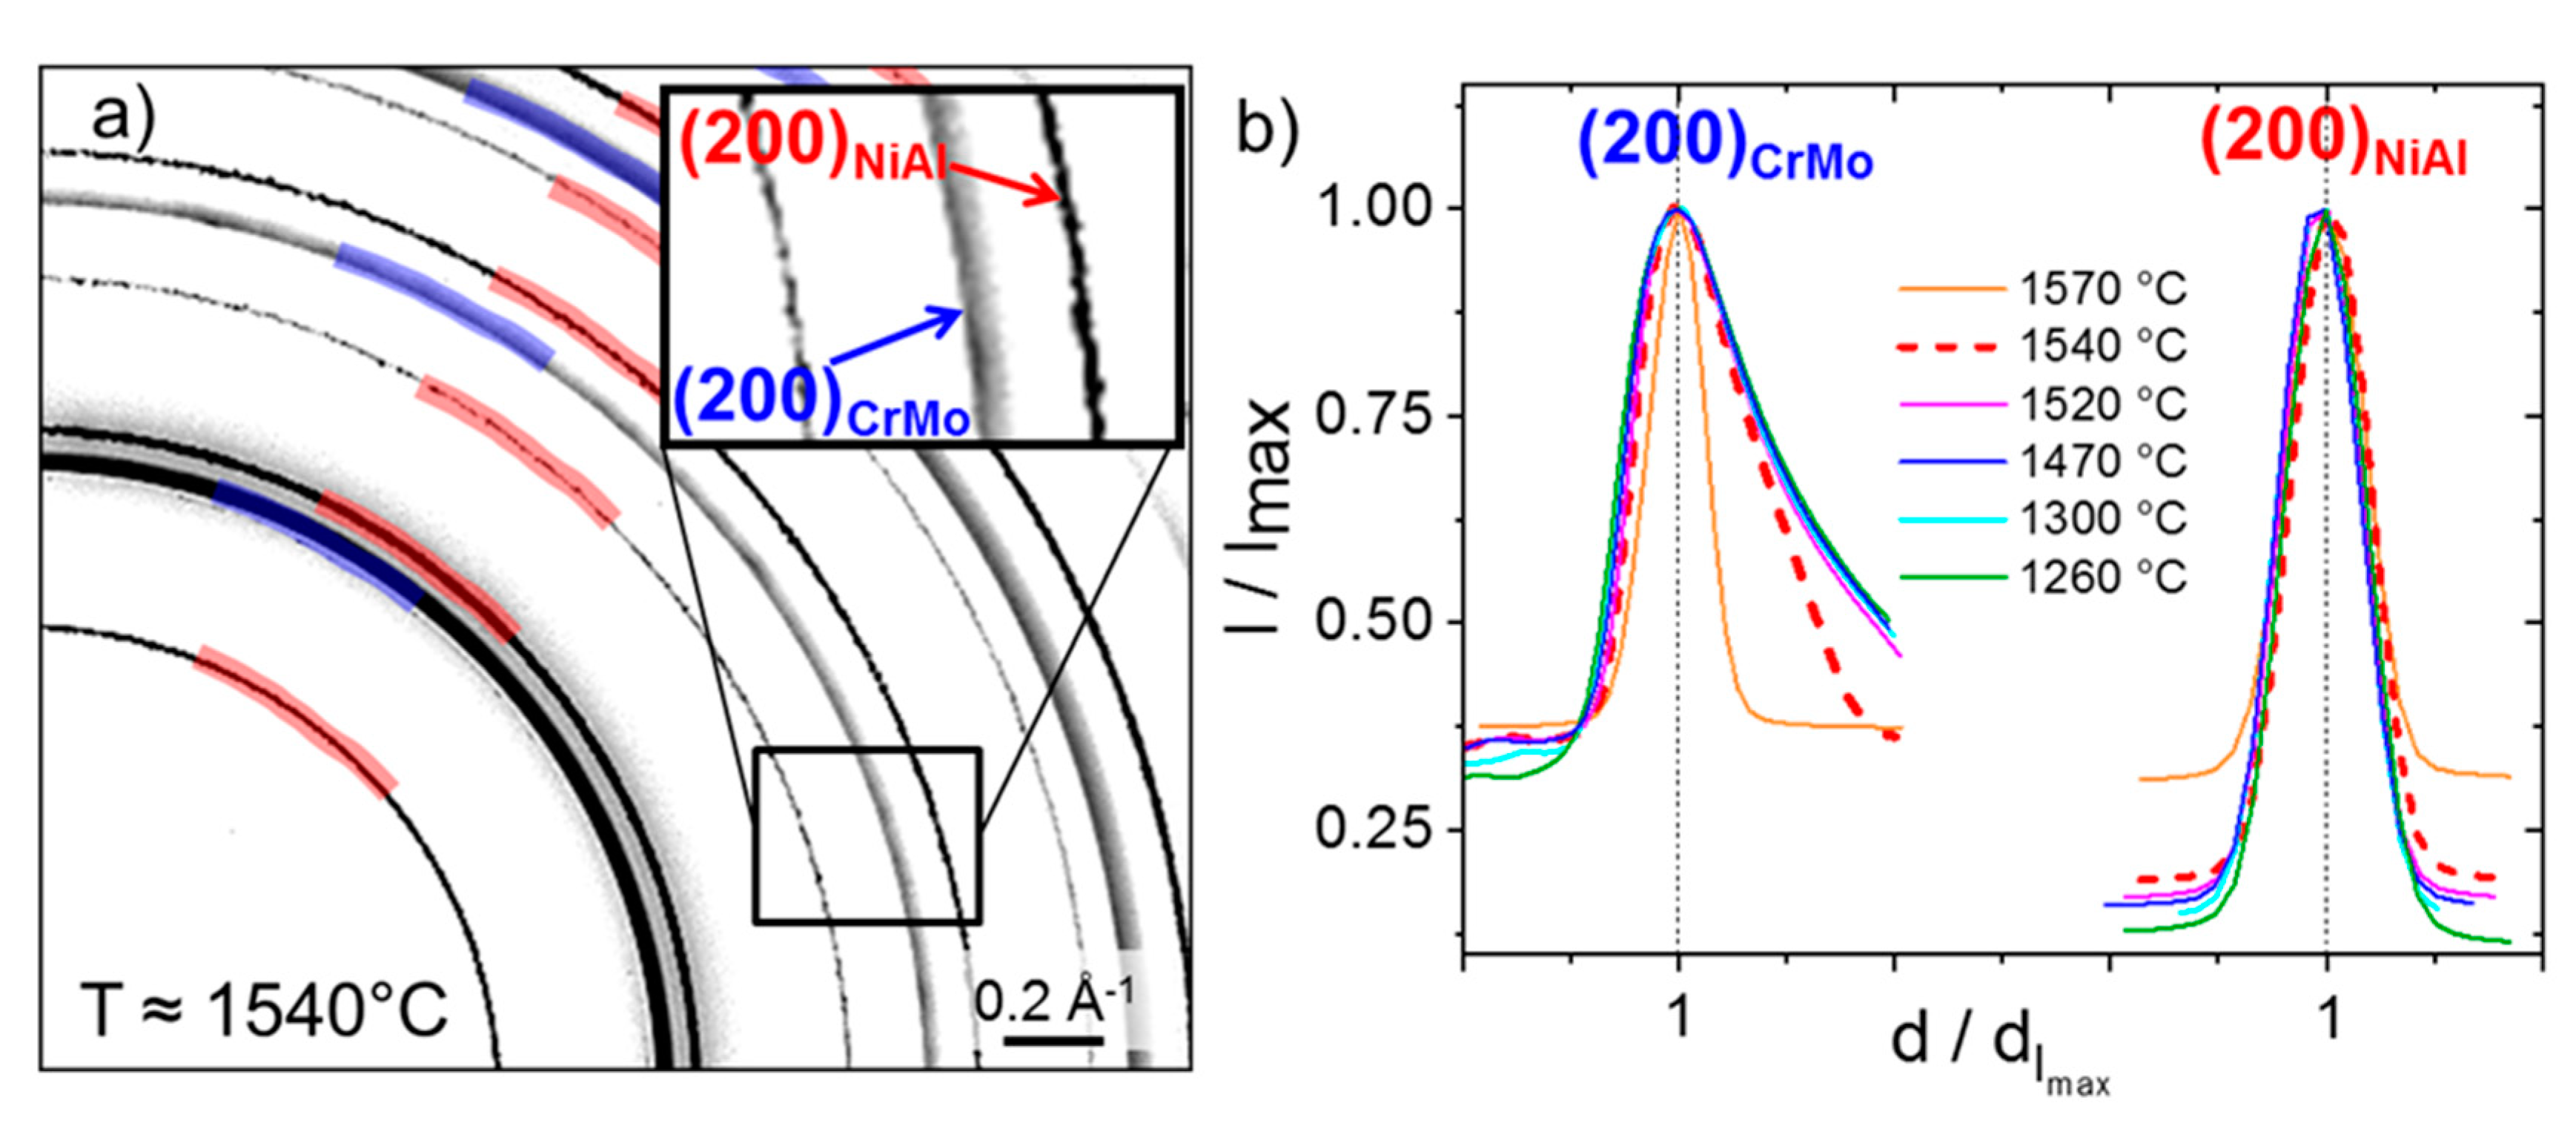
3.4. Evolution of Mo-Rich and Cr-Rich (Cr,Mo)ss during the Solidification Sequence

In the following section, the evolution of the (Cr,Mo)ss phase during solidification and cooling to room temperature is presented and discussed in detail. As shown in Figure 5a, for the alloys with a Mo concentration between 52 and 85% Mo within (Cr,Mo)ss, two solid solutions with substantially different lattice parameters were determined. Figure 6 displays the binary Cr-Mo phase diagram based on the calculations of Reference [27]. The binary Cr-Mo system shows complete solubility of Cr and Mo in both solid and liquid state in the entire composition range. Between the liquid and the solid state, a two-phase region with L + (Cr,Mo)ss exists. A miscibility gap was predicted for lower temperatures [27]. As an approach in this work, the two experimentally determined (Cr,Mo)ss lattice parameters for the NiAl-9.6Cr-10.3Mo alloy (Figure 5a) were back calculated into two binary Cr-Mo compositions. These compositions (marked with dashed lines) are included in Figure 6 together with the nominal composition of the alloy (marked with a solid line). The intersections of the dashed lines with the solidus line are highlighted by blue circles and with the miscibility gap with blue squares. Obviously, our compositions calculated from the measured lattice parameters are not consistent with equilibrium compositions expected from the miscibility gap in Figure 6 since both intersections are not connected by a tie line.
The binary Cr-W system is similar to Cr-Mo in terms of the type of phase diagram and with respect to the deviation of lattice parameter above Vegard’s law [38]. In Reference [35], both systems were compared by means of X-ray diffraction analysis in order to validate or refute the existence of complete solubility. Clearly, Cr-W separates into two distinct solid solutions at lower temperatures and their formation is attributed to the huge difference in atomic radii between Cr and W [35]. Apparently, the atomic size difference between Cr and Mo is much less and, hence, not sufficient to promote this decomposition even when annealing at 600 °C for up to 1500 h [39]. Since our samples were not subjected to any further annealing treatments, it is very likely that the two compositions of (Cr,Mo)ss in the NiAl-(Cr,Mo) alloys are not related to the existence of a miscibility gap at low temperatures.
For the Mo-rich (Cr,Mo)ss, the composition is consistent with the two phase region L + (Cr,Mo)ss, which might be an indicator that the different compositions form almost in the beginning of solidification (blue, upper-filled circle symbol and thin horizontal green line in Figure 6). The primary formed solid solution has an increased concentration of Mo compared to the nominal composition and is in accordance with the expectations by thermodynamic equilibrium. Further rapid cooling suppresses diffusion and thus the attainment of thermodynamic equilibrium in the solidifying solid solution. Different compositions form due to segregation during the rapid cooling. Consequently, a pronounced delay of the termination of solidification to lower temperatures occurs (indicated as the red line in Figure 6). This leads to solidification of solid solutions with Mo contents lower than expected by thermodynamic equilibrium being in agreement with the blue, lower-filled circle. However, considering the quaternary system the predicted compositions of the solid solution are 87 and 63 at.% Mo in (Cr,Mo)ss at liquidus and solidus temperature, respectively, being shifted to higher Mo contents in comparison to the considerations on the binary system.
An additional proof for the segregation initiated with the solidification provides the Debye–Scherrer pattern of the NiAl-9.6Cr-10.3Mo alloy in Figure 7a. This diffraction pattern was recorded at ≈1540 °C, which is slightly below the calculated liquidus temperature of 1545 °C [20]. The rings belonging to the individual phases are marked in red and blue for NiAl and (Cr,Mo)ss, respectively. In Figure 7a, an insert displays a detailed view on the ( 200 ) rings. There, the ( 200 ) NiAl and the ( 200 ) Cr,Mo rings are highlighted with a red and a blue arrow, respectively. In comparison with the sharp diffraction ring of the NiAl, the solid solution ring is blurred. The red, dashed line in Figure 7b denotes the associated azimuthal integration of the diffraction pattern. In addition, normalized line profiles of the ( 200 ) peaks at the solidification front (orange) and during further cooling (purple, blue, cyan and green) are illustrated in Figure 7b. It is obvious that the shape of the ( 200 ) NiAl peak is symmetric and does not change with decreasing temperature. Contrary, the ( 200 ) Cr,Mo exhibits peak broadening and increasing asymmetry with decreasing temperature when compared to the same line at the solidification front (Figure 7b, orange). Such peak broadening and asymmetry are caused by changes in average interplanar distances due to changes in composition. Below 1470 °C, the peak shape does not change further. It can be concluded that the segregation process starts slightly below the liquidus temperature and is completed at 1470 °C, at the latest.

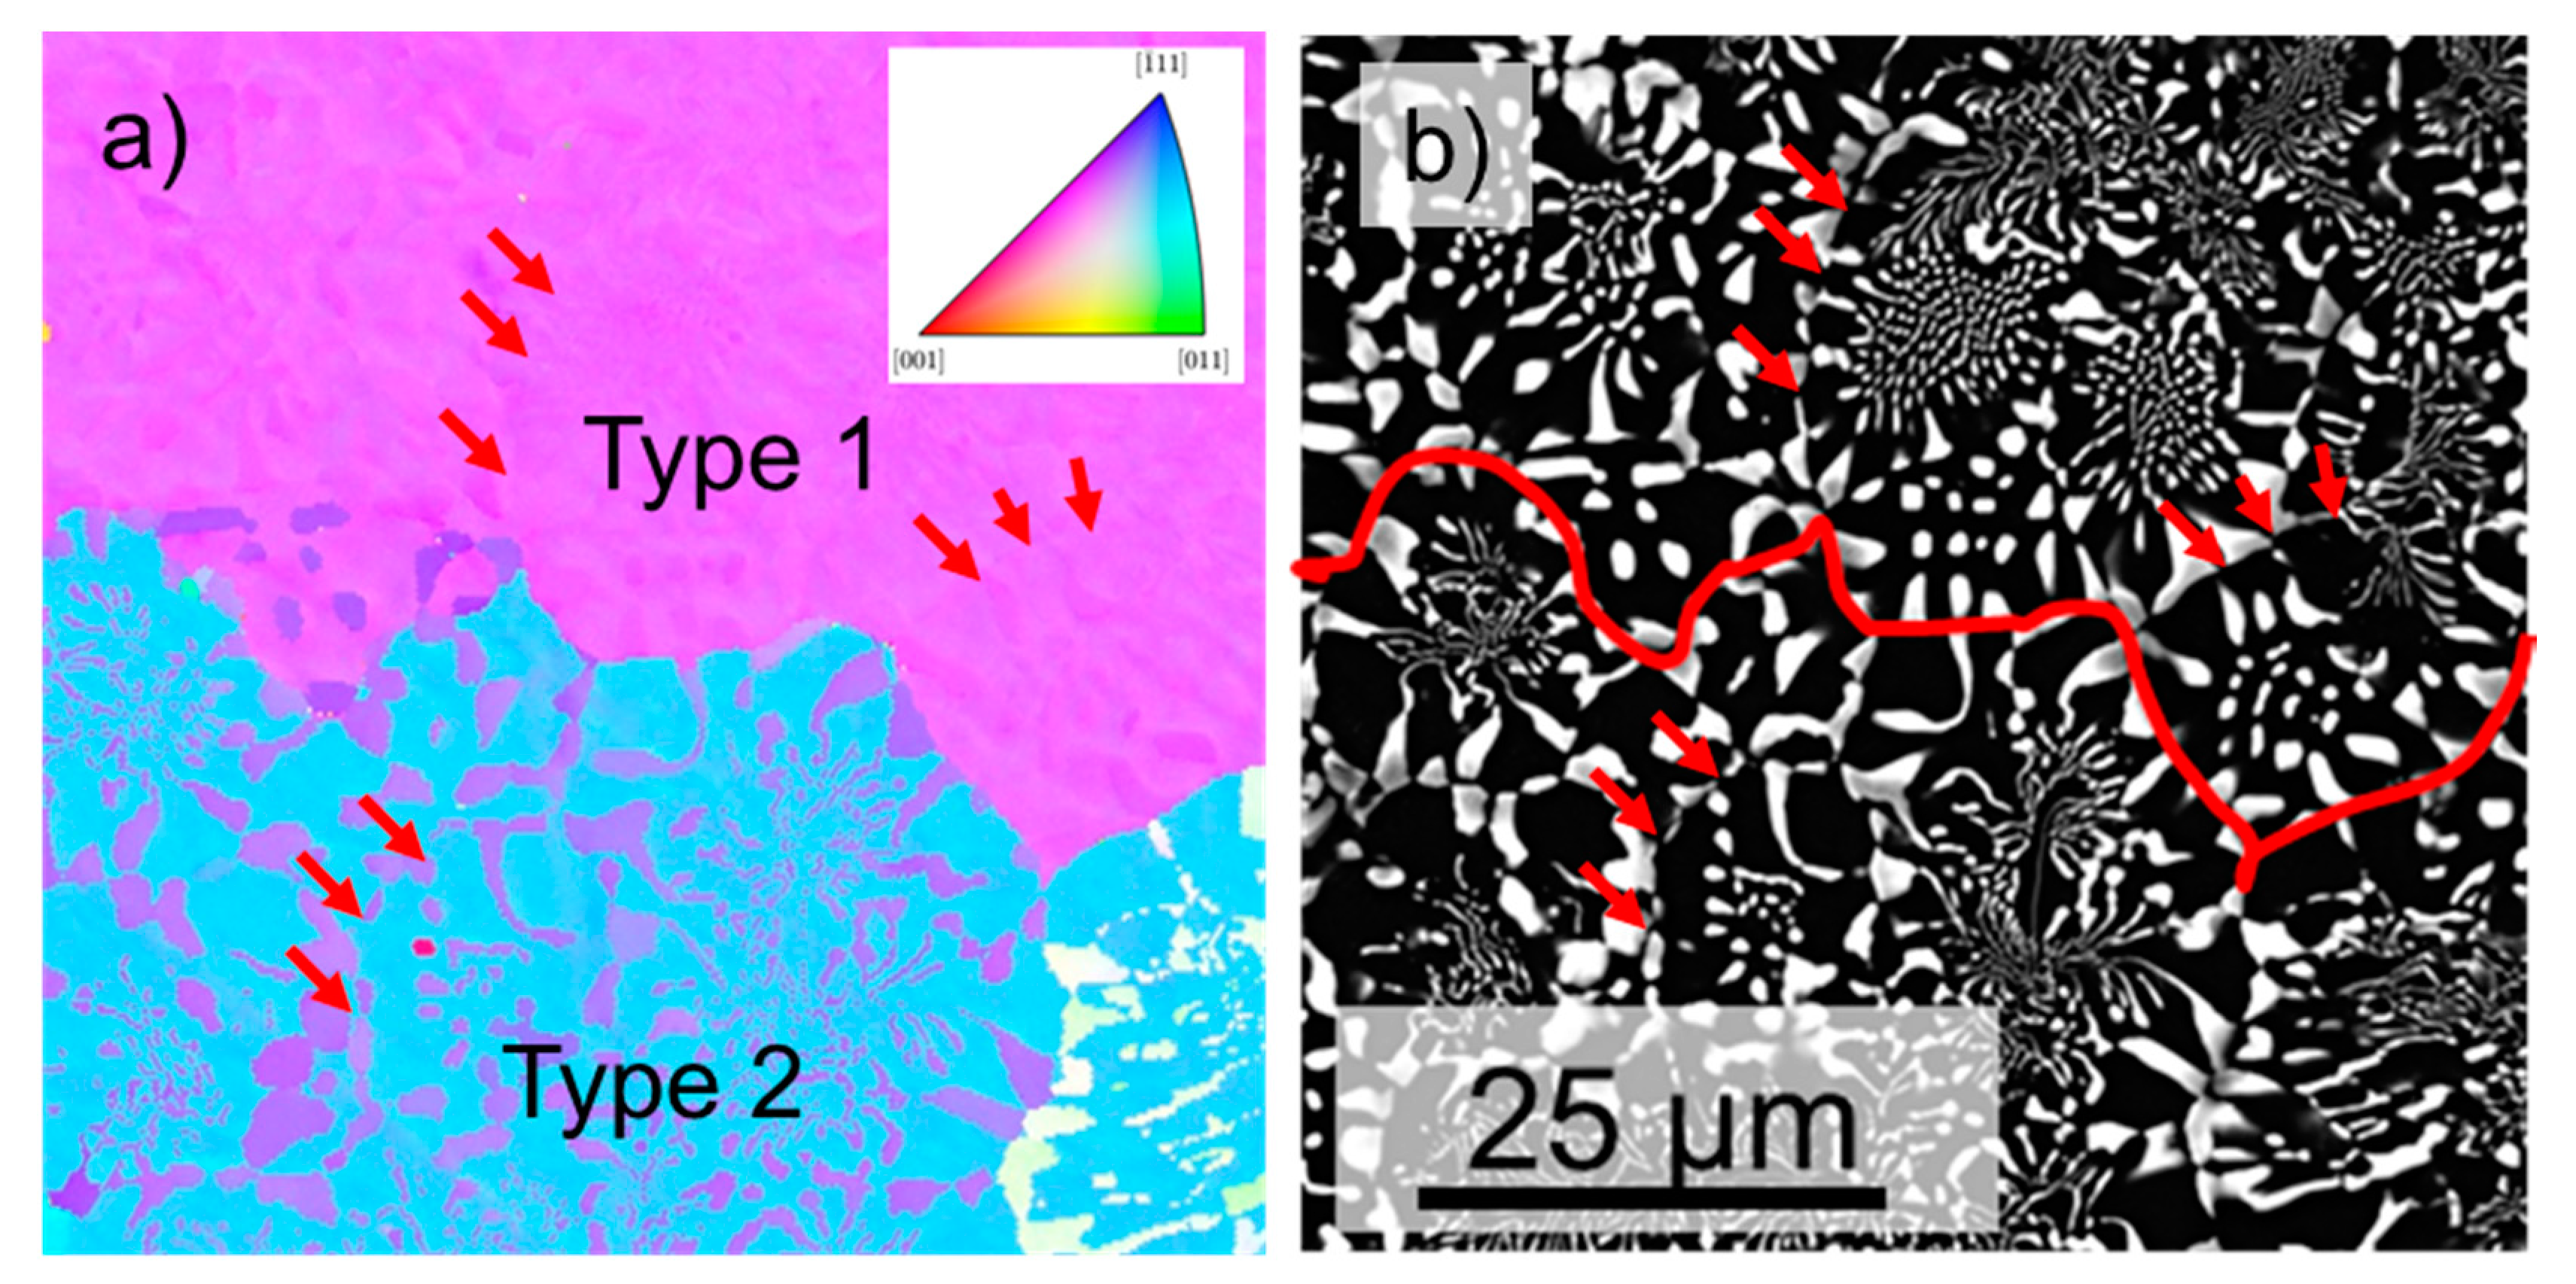
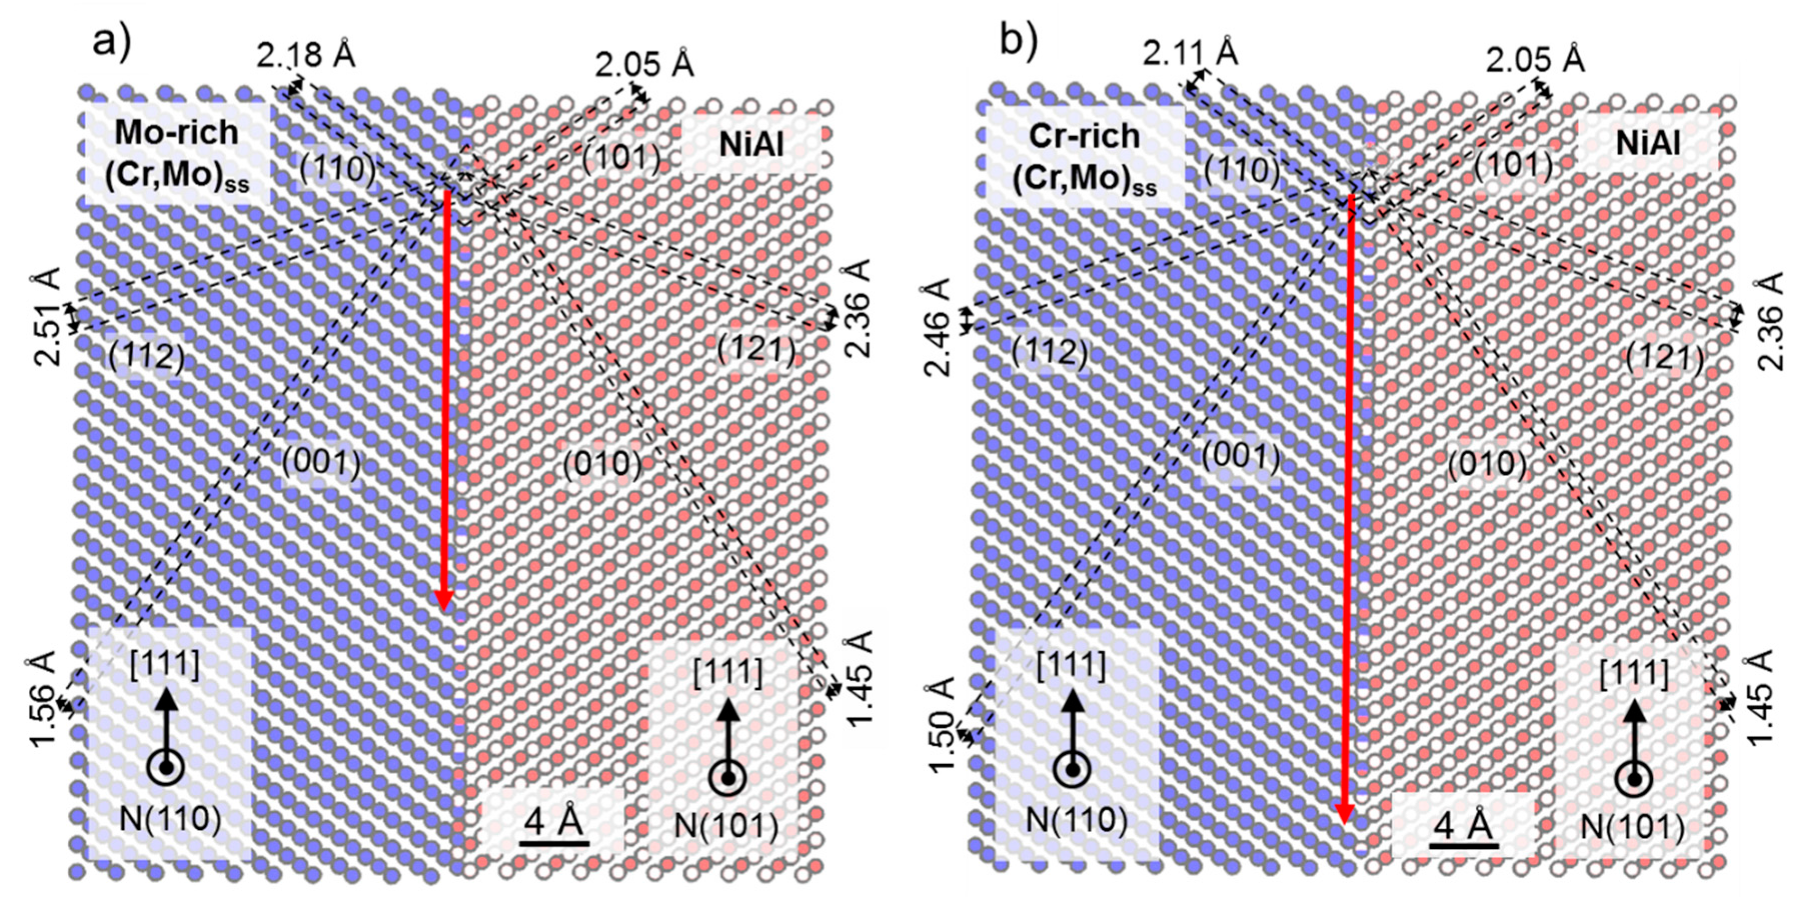
3.5. Crystallographic Relationship in As-Cast NiAl-9.6Cr-10.3Mo Compared to As-Cast NiAl-34Cr and NiAl-10Mo

The orientation relationship of the NiAl and the solid solution in the respective ternary alloys was previously investigated by several authors [3,4,7,8,10,11]. A cube-on-cube orientation relationship was reported which is in agreement with the results in this work, ( 100 ) NiAl || ( 100 ) (Cr,Mo) and 100 NiAl || 100 Cr,Mo (not shown here). In the NiAl-10Mo alloy, a misorientation of (1.9 ± 0.8)° was found whereas in the NiAl-34Cr alloy it was less with (0.9 ± 0.6)° on average (Table 2). For the NiAl-9.6Cr-10.3Mo alloy, two different types of colonies were detected as indicated in the orientation map (Figure 8a). The very small color contrast indicates the presence of the cube-on-cube relationship in colony type 1, which is the same as in the NiAl-34Cr and NiAl-10Mo alloys. The misorientation was (1 ± 0.5)°. In addition, colonies were observed with a misorientation of almost 60° about 111 (Table 2).
The SEM-BSE image in Figure 8b corresponds to the same field of view as Figure 8a. A red line denotes the regions with the two different orientation relationships. Three conclusions can be drawn: (i) The same orientation relationship is observed for several, neighboring colonies (indicated by red arrows in Figure 8a,b). (ii) There is no noticeable difference in chemical composition of the solid solution (gray scale) between the regions of the two orientation relationships. (iii) The aforementioned gradient of chemical composition of the solid solution within the colonies does not lead to significant changes in the orientation relationship of the phases.
On the one hand, Reference [29] reported different orientation relationships within the same colony for directionally solidified, lamellar NiAl-31Cr-3Mo doped with Hf and Si. There, a cube-on-cube orientation relationship was found in the cell boundary. In the cell interior, where the lamellae were well aligned, the phases were related as follows: ( 111 ) NiAl || ( 111 ) CrMo and [ 1 1 ¯ 0 ] NiAl || [ 01 1 ¯ ] Cr,Mo, corresponding to a 60° rotation about the [ 111 ] direction. On the other hand, Reference [40] suggested that different orientation relationships provoke different morphologies. We can conditionally confirm the statement of Reference [40], since predominantly fibers were seen in colony type 1, whereas lamellae were seen in colony type 2. A change within the colony as mentioned by Reference [29] was not observed. The (Cr,Mo)ss solidifies in a coarse manner in the vicinity of colony boundaries, but still the same orientation relationship holds, indicating that the orientation of the selected nuclei is decisive rather than its growth.
In Reference [4,14], ( 11 2 ¯ ) was found to be the interface plane for directionally solidified alloys with faceted fibers and plates. By applying the experimentally determined lattice parameter for NiAl-9.6Cr-10.3Mo, the 60° rotation about [ 111 ] and the involved crystal structures, an atomistic model was made for the colony type 2 in Figure 9. For both cases Mo-rich (Cr,Mo)ss and NiAl and Cr-rich (Cr,Mo)ss and NiAl, the ( 11 2 ¯ ) plane was chosen as a possible interface plane as reported in Reference [4]. The red arrows in the schematic models (Figure 9a,b) indicate the distance of the periodic coincidence in atomic rows. The distance between reasonably matching regions is smaller for the Mo-rich solid solution, than for the Cr-rich solid solution, influencing the strains at the interface. If the length of coincidence periods is small, the reasonably matching regions are closer to each other but the matching regions consist of only few interplanar layers. In contrast, the good matching regions consist of more interplanar layers if the periodicity is larger [41]. In Figure 9a, the distance between the coincidence period is 15 for (Cr,Mo)ss and 16 for NiAl interplanar spacings and in Figure 9b, 23 and 24 interplanar spacings. Perpendicular to that, the same number of interplanar spacings were observed, respectively. The constraints between (Cr,Mo)ss and NiAl which have to be accommodated at the interface can be analyzed by the interplanar spacings in (Cr,Mo)ss and NiAl marked by dashed lines in Figure 9. In particular the difference in ( 100 ) , ( 110 ) and ( 112 ) interplanar spacings for (Cr,Mo)ss and NiAl was calculated. Between the Mo-rich (Cr,Mo)ss and NiAl a minimum of 6.4% was found for ( 112 ) . For the Cr-rich (Cr,Mo)ss and NiAl, a minimum of 3.2% was obtained for ( 110 ) , indicating that the ( 11 2 ¯ ) plane is not the preferred interface in order to minimize the strain. The change in interplanar spacing due to the composition gradient does not lead to a change in morphology, suggesting that the strains are not decisive, emphasizing the importance of the nuclei orientation, as mentioned earlier.

4. Conclusions

We presented the systematic investigation of eutectic alloys based on NiAl-(Cr,Mo) which were arc-melted and subsequently investigated in-situ between room and liquidus temperatures. The evolving morphologies were categorized into four regions I–IV with respect to the Mo concentration: Cr-rich fibers (I), lamellae (II), a transit region with fibers and lamellae (III) and Mo-rich fibers (IV). Starting from NiAl-34Cr, the experimentally determined volume fraction of (Cr,Mo)ss increases initially with increasing Mo concentration, reaches a maximum and decreases continuously to 11 vol.% for NiAl-10Mo. For the calculated volume fractions, only the edge systems yield satisfactory matches within the scatter of measurements. For up to 52% Mo in (Cr,Mo)ss the calculation leads to a better description than in region IV. With the exception of the NiAl-10Mo alloy in region IV, less satisfactory agreement was achieved, which may be due to the fact that the thermodynamic data set does not adequately reflect the distribution of the solutes.
For the NiAl-9.6Cr-10.3Mo alloy Cr enrichment was found in the vicinity of colony boundaries. Based on in-situ X-ray investigations during solidification it has been proven that the different compositions form due to segregation during rapid cooling. No further distinct changes were found below 1470 °C. The formation of different solid solutions caused by the existence of a miscibility gap at low temperature was ruled out. Since the lattice parameter of the NiAl phase does not remarkably vary with respect to Mo concentration, the lattice mismatch is mainly controlled by the Mo concentration in the composite. The solubility of Ni and Al in the (Cr,Mo)ss plays a secondary role. Alloys affected by the segregation, like the NiAl-9.6Cr-10.3Mo, reveal two different (Cr,Mo)ss lattice parameters. Moreover, in this alloy two different types of colonies were found: type 1 with a cube-on-cube orientation relationship and type 2 with a rotation of approximately 60° about the 111 axis. Within the colony, no change in orientation relationship occurs, indicating that the orientation of the selected nuclei is decisive and not its growth. Analyzing the colony type 2 in more detail, ( 11 2 ¯ ) appears to be a possible interface plane between Mo-rich (Cr,Mo)ss and NiAl, having the minimum difference in interplanar spacing. With changes in composition the interplanar spacing of the solid solution shifts to smaller values. The minimum difference in interplanar spacing possesses the ( 110 ) planes, suggesting that ( 11 2 ¯ ) is no longer the preferred interface plane. Nevertheless, this does not lead to a change in morphology, indicating that the strains are most likely not as decisive as the orientation of the selected nuclei.

Author Contributions

Conceptualization, investigation writing—original draft preparation, C.G. and A.K.; investigation, review and editing G.G. and M.B.; supervision, writing—review and editing, M.H. All authors have read and agreed to the published version of the manuscript.

Funding

This research was financially supported by the Helmholtz Association of German Research Centers under the framework of the Helmholtz Research School on “Integrated Materials Development for Novel High Temperature Alloys” (VH-KO-610) and by the German Federal Ministry of Education and Research (BMBF) program “FlexiDS” (05K16VK5).

Acknowledgments

The authors acknowledge the chemical analysis by ICP-OES at the Institute for Applied Materials (IAM-AWP). We would like to thank F. Hinrichs and S. Oschmann for experimental support at KIT and acknowledge H. Chen for draft editing. For the support with the in-situ X-ray experiments at DESY, Hamburg, thanks due to S. Laube, I. Sprenger, G. Hasemann, V. Bolbut, D. Matthiessen and N. Schell.

Conflicts of Interest

The authors declare no conflict of interest. The funders had no role in the design of the study; in the collection, analyses, or interpretation of data; in the writing of the manuscript, or in the decision to publish the results.

References

  1. Frommeyer, G.; Rablbauer, R.; Schaefer, H.J. Elastic properties of B2-ordered NiAl and NiAl-X (Cr, Mo, W) alloys. Intermetallics 2010, 18, 299–305. [Google Scholar] [CrossRef]
  2. Johnson, D.R.; Chen, X.F.; Oliver, B.F.; Noebe, R.D.; Whittenberger, J.D. Processing and mechanical properties of in-situ composites from the NiAI-Cr and the NiAI-(Cr,Mo) eutectic systems. Intermetallics 1995, 3, 99–113. [Google Scholar] [CrossRef]
  3. Bei, H.; George, E.P. Microstructures and mechanical properties of a directionally solidified NiAl–Mo eutectic alloy. Acta Mater. 2005, 53, 69–77. [Google Scholar] [CrossRef]
  4. Cline, H.E.; Walter, J.L.; Lifshin, E.; Russell, R.R. Structures, faults, and the rod-plate transition in eutectics. Metall. Trans. 1971, 2, 189–194. [Google Scholar] [CrossRef]
  5. Miracle, D.B. The physical and mechanical properties of NiAl. Acta Metall. Mater. 1993, 41, 649–684. [Google Scholar] [CrossRef]
  6. Noebe, R.D.; Bowman, R.R.; Nathal, M.V. Review of the physical and mechanical properties of the B2 compound NiAl. Int. Mater. Rev. 1993, 38, 193–232. [Google Scholar] [CrossRef]
  7. Ebrahimi, F.; Shrivastava, S. Brittle-to-ductile transaction in NiAl single crystal. Acta Mater. 1998, 46, 1493–1502. [Google Scholar] [CrossRef]
  8. Zhang, J.F.; Shen, J.; Shang, Z.; Feng, Z.R.; Wang, L.S.; Fu, H.Z. Microstructure and room temperature fracture toughness of directionally solidified NiAl-Mo eutectic in situ composites. Intermetallics 2012, 21, 18–25. [Google Scholar] [CrossRef]
  9. Misra, A.; Gibala, R. Plasticity in multiphase intermetallics. Intermetallics 2000, 8, 1025–1034. [Google Scholar] [CrossRef]
  10. Dudová, M.; Kuchařová, K.; Barták, T.; Bei, H.; George, E.P.; Somsen, C.; Dlouhý, A. Creep in directionally solidified NiAl–Mo eutectics. Scr. Mater. 2011, 65, 699–702. [Google Scholar] [CrossRef]
  11. Seemüller, C.; Heilmaier, M.; Haenschke, T.; Bei, H.; Dlouhy, A.; George, E.P. Influence of fiber alignment on creep in directionally solidified NiAl–10Mo in-situ composites. Intermetallics 2010, 35, 110–115. [Google Scholar] [CrossRef]
  12. Haenschke, T.; Gali, A.; Heilmaier, M.; Krüger, M.; Bei, H.; George, E.P. Synthesis and characterization of lamellar and fibre-reinforced NiAl-Mo and NiAl-Cr. J. Phys. Conf. Ser. 2010, 240. [Google Scholar] [CrossRef]
  13. Albiez, J.; Sprenger, I.; Seemüller, C.; Weygand, D.; Heilmaier, M.; Böhlke, T. Physically motivated model for creep of directionally solidified eutectics evaluated for the intermetallic NiAl–9Mo. Acta Mater. 2016, 110, 377–385. [Google Scholar] [CrossRef]
  14. Cline, H.E.; Walter, J.L. The effect of alloy additions on the rod-plate transition in the eutectic NiAl-Cr. Metall. Trans. 1971, 1, 2907–2917. [Google Scholar] [CrossRef]
  15. Kellner, M.; Sprenger, I.; Steinmetz, P.; Hötzer, J.; Nestler, B.; Heilmaier, M. Phase-field simulation of the microstructure evolution in the eutectic NiAl-34Cr system. Comput. Mater. Sci. 2017, 128, 379–387. [Google Scholar] [CrossRef]
  16. Kumar, A.; Ensslen, C.; Krüger, A.; Klimenkov, M.; Kraft, O.; Schwaiger, R. Micromechanical study on the deformation behavior of directionally solidified NiAl–Cr eutectic composites. J. Mater. Res. 2017, 32, 2127–2134. [Google Scholar] [CrossRef]
  17. Whittenberger, J.D.; Raj, S.V.; Locci, I.E.; Salem, J.A. Effect of growth rate on elevated temperature plastic flow and room temperature fracture toughness of directionally solidified NiAl-31Cr-3Mo. Intermetallics 1999, 7, 1159–1168. [Google Scholar] [CrossRef]
  18. Whittenberger, J.D.; Raj, S.V.; Locci, I.E.; Salem, J.A. Elevated temperature strength and room-temperature toughness of directionally solidified Ni-33Al-33Cr-1Mo. Metall. Mater. Trans. A 2002, 33, 1385–1397. [Google Scholar] [CrossRef]
  19. Chen, X.F.; Johnson, D.R.; Noebe, R.D.; Oliver, B.F. Deformation and fracture of a directionally solidified NiAl-28Cr-6Mo eutectic alloy. J. Mater. Res. 1995, 10, 1159–1170. [Google Scholar] [CrossRef] [Green Version]
  20. Peng, J.; Franke, P.; Seifert, H.J. Experimental Investigation and CALPHAD Assessment of the Eutectic Trough in the System NiAl-Cr-Mo. J. Phase Equilibria Diffus. 2016, 37, 592–600. [Google Scholar] [CrossRef]
  21. Schwaighofer, E.; Rashkova, B.; Clemens, H.; Stark, A.; Mayer, S. Effect of carbon addition on solidification behavior, phase evolution and creep properties of an intermetallic β-stabilized γ-TiAl based alloy. Intermetallics 2014, 46, 173–194. [Google Scholar] [CrossRef] [Green Version]
  22. Hammersley, A.P. ESRF Internal Report, ESRF97HA02T, FIT2D: An Introduction and Overview; ESRF: Grenoble, France, 1997. [Google Scholar]
  23. Hammersley, A.P. ESRF Internal Report, ESRF98HA01T, FIT2D V9.129 Reference Manual V3.1998, 1; ESRF: Grenoble, France, 1998. [Google Scholar]
  24. Lutterotti, L.; Bortolotti, M.; Ischia, G.; Lonardelli, I.; Wenk, H.-R. Rietveld texture analysis from diffraction images. Z. Krist. Suppl. 2007, 26, 125–130. [Google Scholar] [CrossRef]
  25. Nelson, J.B.; Riley, D.P. An experimental investigation of extrapolation methods in the derivation of accurate unit-cell dimensions of crystals. Proc. Phys. Soc. 1945, 57, 160–177. [Google Scholar] [CrossRef]
  26. Peng, J.; Franke, P.; Manara, D.; Watkins, T.; Konings, R.; Seifert, H.J. Experimental investigation and thermodynamic re-assessment of the Al–Mo–Ni system. J. Alloys Compd. 2016, 674, 305–314. [Google Scholar] [CrossRef]
  27. Peng, J. Experimental Investigation and Thermodynamic modeling of the Al-Cr-Mo-Ni System and Its Sub-Systems; Dissertation, Karlsruhe Institute of Technology: Karlsruhe, Germany, 2016. [Google Scholar] [CrossRef]
  28. Bewlay, B.P.; Sutliff, J.A.; Jackson, M.R.; Chang, K.M. Processing, Microstructures, and Properties of Cr-Cr3Si, Nb-Nb3Si, and V-V3Si Eutectics. Mater. Manuf. Process. 1994, 9, 89–109. [Google Scholar] [CrossRef]
  29. Misra, A.; Gibala, R.; Noebe, R.D. Optimization of toughness and strength in multiphase intermetallics. Intermetallics 2001, 9, 971–978. [Google Scholar] [CrossRef]
  30. Hughes, T.; Lautenschlager, E.P.; Cohen, J.B.; Brittain, J.O. X-Ray Diffraction Investigation of β′-NiAl Alloys. J. Appl. Phys. 1971, 42, 3705–3716. [Google Scholar] [CrossRef]
  31. Taylor, A.; Doyle, N.J. Further studies on the Nickel-Aluminum system. I. The β-NiAI and δ-Ni2AI3 phase fields. J. Appl. Cryst. 1972, 5, 201–209. [Google Scholar] [CrossRef]
  32. Noebe, R.D.; Bowman, R.R.; Nathal, M.V. NASA Technical Memorandum 105598; NASA: Washington, DC, USA, 1992. [Google Scholar]
  33. Rablbauer, R.; Fischer, R.; Frommeyer, G. Mechanical properties of NiAl–Cr alloys in relation to microstructure and atomic defects. Z. Met. 2004, 95, 525–535. [Google Scholar] [CrossRef]
  34. Baen, S.R.; Duwez, P. Constitution of Iron-Chromium-Molydenum alloys. J. Met. 1951, 331–335. [Google Scholar] [CrossRef]
  35. Trzebiatowski, W.; Ploszek, H.; Lobzowski, J. X-Ray analysis of Chromium-Molybdenum and Chromium-Tungsten alloys. Anal. Chemustry 1947, 19, 93–95. [Google Scholar] [CrossRef]
  36. Venkatraman, M.; Neumann, J.P. The Cr-Mo (Chromium-Molybdenum) system. Bull. Alloy Phase Diagr. 1987, 8, 216–220. [Google Scholar] [CrossRef]
  37. Hahn, J.D.; Wu, F.; Bellon, P. Cr-Mo solid solutions forced by high-energy ball milling. Metall. Mater. Trans. A 2004, 35, 1105–1111. [Google Scholar] [CrossRef]
  38. Naidu, S.V.N.; Sriramamurthy, A.M.; Rao, P.R. The Cr-W (Chromium-Tungsten) system. Bull. Alloy Phase Diagr. 1984, 5, 289–292. [Google Scholar] [CrossRef]
  39. Laffitte, M.; Kubaschewski, O. Activities of Chromium in Chromium-Molybdenum solid solutions. Trans. Faraday Soc. 1960, 57, 932–934. [Google Scholar] [CrossRef]
  40. Milenkovic, S.; Caram, R. Growth morphology of the NiAl-V in situ composites. J. Mater. Process. Technol. 2003, 144, 629–635. [Google Scholar] [CrossRef]
  41. Zhang, M.X.; Kelly, P.M. Edge-to-edge matching model for predicting orientation and habit planes- the improvements. Scr. Mater. 2005, 52, 963–968. [Google Scholar] [CrossRef]
Figure 1. (a) Section of the liquidus projection of the NiAl-Cr-Mo system based on Reference [20]. The processed alloys are highlighted by open blue symbols and (b) listed with respect to nominal composition and Mo concentration in (Cr,Mo)ss.
Metals 10 00961 g001
Figure 2. SEM-BSE images of (a) NiAl-34Cr, (b) NiAl-20.6Cr-9.3Mo, (c) NiAl-9.6Cr-10.3Mo and (d) NiAl-10Mo.
Metals 10 00961 g002
Figure 3. Experimentally determined volume fractions of the reinforcing phase as a function of its Mo concentration (blue, open symbols) compared to the calculated volume fractions based on the data in Reference [20]. Red arrows indicate the direction of the shift in volume fraction during cooling from solidus temperature to room temperature. Numbers I to IV and color code is consistent with Figure 1a.
Metals 10 00961 g003
Figure 4. SEM-BSE images (center) and corresponding EDX maps of the same field of view of the investigated alloys: (a) NiAl-34Cr, (b) NiAl-9.6Cr-10.3Mo and (c) NiAl-10Mo. Note that the BSE micrographs and EDX maps of NiAl-34Cr are taken with different magnification.
Metals 10 00961 g004
Figure 5. (a) Lattice parameter at room temperature as a function of Mo concentration in the solid solution. The red, square symbols refer to the NiAl lattice parameter. The blue, open symbols refer to the lattice parameter of the solid solution. For alloys mainly in region III and the nearest one in region IV two solid solutions were found. The upper half-filled symbols and the lower half-filled symbols refer to the lattice parameter of Mo-rich (Cr,Mo)ss and of Cr-rich (Cr,Mo)ss, respectively. (b) Calculated mismatch at room temperature as a function of Mo concentration in the solid solution. The insert displays in detail that a lattice mismatch of zero is expected at 0.5% Mo in (Cr,Mo)ss.
Metals 10 00961 g005
Figure 6. Binary Cr-Mo phase diagram based on the calculations of Reference [27]. The nominal composition is highlighted with the solid green line and the two dashed lines refer to the converted compositions based on the experimentally determined lattice parameter. Blue circles mark the intersection between the Cr-rich (Cr,Mo)ss and Mo-rich (Cr,Mo)ss composition, respectively, and the two phase region at high temperature. Blue square symbols refer to the intersection with the miscibility gap.
Metals 10 00961 g006
Figure 7. (a) Section of a NiAl-9.6Cr-10.3Mo Debye–Scherrer diffraction pattern close to 1540 °C. The diffraction rings for NiAl and (Cr,Mo)ss are highlighted in red and blue, respectively. A detailed view of the ( 200 ) rings is shown in the insert. Red and blue arrows mark the ( 200 ) NiAl and the ( 200 ) Cr,Mo ring, respectively. (b) Normalized intensity with respect to the maximum intensity plotted over normalized d-spacing with respect to d-spacing at the maximum intensity for ( 200 ) NiAl and the ( 200 ) Cr,Mo peak close to liquidus temperature and during further cooling.
Metals 10 00961 g007
Figure 8. (a) Orientation mapping according to the inverse pole figure of the normal surface to a cross-section of NiAl-9.6Cr-10.3Mo. Standard triangle encloses [ 001 ] , [ 011 ] and [ 1 ¯ 11 ] . (b) SEM-BSE image of the same field of view as in Figure 8a. Red line marks the two regions which correspond to the two different colony types.
Metals 10 00961 g008
Figure 9. Schematic image of the crystallographic model based on the determined orientation relationship and ( 11 2 ¯ ) as a possible interface between (Cr,Mo)ss and NiAl. The red arrows refer to the distance between reasonably matching regions. ( 111 ) is parallel to the interface and the lattice parameter for (a) Mo-rich (Cr,Mo)ss and (b) Cr-rich (Cr,Mo)ss were used.
Metals 10 00961 g009
Table 1. Chemical compositions of the alloys with 90 and 95% Mo within (Cr,Mo)ss in at.%.
AlloyElementOverall Composition *NiAl Matrix(Cr,Mo)ss
Calc.Exp. **Calc.Exp. **
90% Mo in (Cr,Mo)ssAl/at.%44.3149.5148.74.1810.4
Cr/at.%1.060.462.46.241.4
Ni/at.%44.8650.0346.10.024.4
Mo/at.%9.7402.889.5683.8
95% Mo in (Cr,Mo)ssAl/at.%44.649.6450.94.0410.0
Cr/at.%0.50.230.12.770.7
Ni/at.%45.150.1348.60.014.5
Mo/at.%9.800.493.1784.8
* denotes ICP-OES and ** standard-related EDX. Calculations at temperature 1000 °C.
Table 2. Summary of the colony types and the misorientation in the alloys obtained by EBSD.
AlloyColony Type 1Colony Type 2
NiAl-34Cr(1.9 ± 0.8)° about arb. axis-
NiAl-9.6Cr-10.3Mo(0.95 ± 0.5)° about arb. axis(0.95 ± 0.5)° about 111
NiAl-10Mo(0.9 ± 0.6)° about arb. axis-

