Article

Role of Vanadium Additions on the Corrosion Mitigation of Ti-6Al-xV Alloy in Simulated Body Fluid

1
Center of Excellence for Research in Engineering Materials (CEREM), King Saud University, P.O. Box 800, Al-Riyadh 11421, Saudi Arabia
2
Electrochemistry and Corrosion Laboratory, Department of Physical Chemistry, National Research Centre, El-Behoth St. 33, Dokki, Cairo1 2622, Egypt
3
Mechanical Design and Materials Department, Faculty of Energy Engineering, Aswan University, Aswan 81521, Egypt
*
Author to whom correspondence should be addressed.
Metals 2020, 10(7), 903; https://doi.org/10.3390/met10070903
Submission received: 21 June 2020 / Revised: 2 July 2020 / Accepted: 3 July 2020 / Published: 6 July 2020
(This article belongs to the Special Issue Corrosion and Inhibition Processes)

Abstract

:
The manufacturing of different Ti-6Al-xV (x = 2, 4, 6, and 8 wt.%) alloys using a mechanical alloying technique was reported. The corrosion behaviors of these newly fabricated alloys after 1, 24, and 48 h exposure to a simulated body fluid (SBF) were assessed using cyclic potentiodynamic polarization, electrochemical impedance spectroscopy, and chronoamperometric measurements. Surface morphology and elemental analyses after corrosion for 48 h in SBF were reported using scanning electron microscopy (SEM) and energy dispersive X-ray (EDX) examinations. An X-ray diffraction investigation characterized the phase analyses. All results indicated that the increase of V content significantly decreases both uniform and pitting corrosion. This effect also increases with prolonging the immersion time to 48 h before measurement.

Graphical Abstract

1. Introduction

Ti-base alloys have superior properties that have led to their use in several applications, such as standard engineering materials [1,2,3]. These include medical, military, marine, and offshore applications as a result of the excellent biocompatibility, reliable mechanical properties, and high resistance against many corrosive media, particularly oxidizing and chloride-containing process streams, among others [4,5,6,7,8,9,10,11]. It has been reported that materials with high strength, low density, and excellent corrosion resistance have promoted demand for high energy-efficiency in offshore structures and the marine industry [12,13,14,15]. Ti-base alloys are considered as the most attractive metallic materials for biomedical applications [4,5,6,7,8,9,10,11,16].
In the early 1970s, Ti-base alloys were implanted in various medical applications, including prosthetic dentistry [17]. One of the most important factors for the use of Ti-base alloys in the dental implantation system is their high strength and compatibility besides their superior corrosion resistance. It has been reported [18,19,20] that the Ti-6Al-4V alloy combines good mechanical, physical, and resistance properties versus corrosion, which makes it the most applicable Ti alloy. Geetha et al. [21] have confirmed that Ti-base alloys are the ultimate choice for orthopedic implants. This includes the use of several alloys like Ti-6Al-4V, Ti-13Cu-4.5Ni, Ti-6Al-7Nb, and others.
Several researchers have reported the corrosion of Ti alloys in various media [22,23,24,25,26,27,28,29]. Long and Rack [27] found that Ti plays an essential role via its accumulation in the adjacent tissues to the implant and that Ti ions are released. Here, there is corrosion in vivo contact for extended periods with the extracellular body fluids like blood, among others. The formation of a coating layer of TiO2 on the surface of the Ti-6Al-4V alloy via anodic oxidation in 1.0 M H2SO4 solution to prevent the release of Ti ions has also been reported [30,31,32,33]. Chapala et al. [34] studied the effect of alloying elements on the in-vitro corrosion of Ti-Nb alloys. Afzali et al. [35] also reported a review of the corrosion behavior of titanium alloys for medical applications.
The objective of the current study was to manufacture a series of different Ti-based alloys using the technique of mechanical alloying (MA). These alloys were Ti-6Al-2V, Ti-6Al-4V, Ti-6Al-6V, and Ti-6Al-8V (all in wt.%). The effects of increasing V content on the corrosion of the fabricated alloys after being immersed for different exposure periods in simulated body fluid (SBF) solutions were also reported. Various electrochemical and spectroscopic techniques were employed to evaluate the corrosion behavior and surface morphology for the tested alloys.

2. Materials and Methods

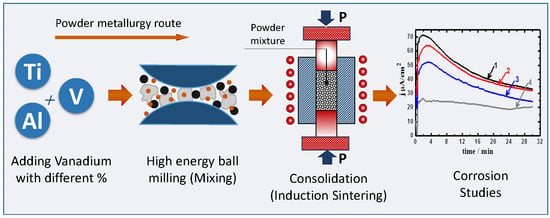
2.1. Chemicals, Materials, and Fabrication of Ti-6Al-xV Alloys

Simulated body fluid (SBF, Dulbecco’s Modified Eagle Medium, Advanced DMEM (1X)) was supplied from Gibco® by Life technologies, Birchwood, Warrington, UK. Ti, Al, and V powders (99.99%) were purchased from Sigma-Aldrich, Glasgow, UK. The alloys of Ti-6Al-2V, Ti-6Al-4V, Ti-6Al-6V, and Ti-6Al-8V (all in wt.%) were fabricated as reported in our previous study [36].

2.2. Electrochemical Experiments

An electrochemical cell with a conventional three electrodes configuration that accommodates a 300 mL SBF solution was used. The Ti-base alloys were served as the working electrode. We used Ag/AgCl as the reference electrode and a platinum wire as the counter electrode, respectively. The working electrode was prepared before the electrochemical measurement, as reported in our previous studies [12,37,38,39,40]. Surface finishing of the alloys before being immersed in the SBF solution for corrosion tests was reported elsewhere [37,38]. For all electrochemical measurements, an Autolab potentiostat-galvanostat (Model PGSTAT-302N, Metrohm, Amsterdam, The Netherlands) was used. Cyclic potentiodynamic polarization (CPP) tests were claimed by scanning the potential from −900 to 800 mV in the positive direction applying a value of 1.66 mV/s as a scan rate. The potential was rescanned again in a negative direction at the same scan rate. Electrochemical impedance spectroscopy (EIS) experiments were performed as reported before in References [37,38]. Chronoamperometric current-time experiments were collected over 30 min via stepping the potential of the tested alloys at a fixed value of 0.5 V (Ag/AgCl).

2.3. Characterization Techniques

The fabricated alloys were characterized using X-ray diffraction (XRD) patterns. The XRD experiments were carried out to identify the phase analysis using D-8 Discover (Bruker, Berlin, Germany). These patterns were collected at a scanning rate of 2°/min, and a different angle range was observed from 10 to 90° with a locked scan type at an increment of 0.02°. SEM micrographs and EDX spectra were collected using a SEM/EDX machine (JEOl, Tokyo, Japan) operated at 15 kV.

3. Results and Discussion
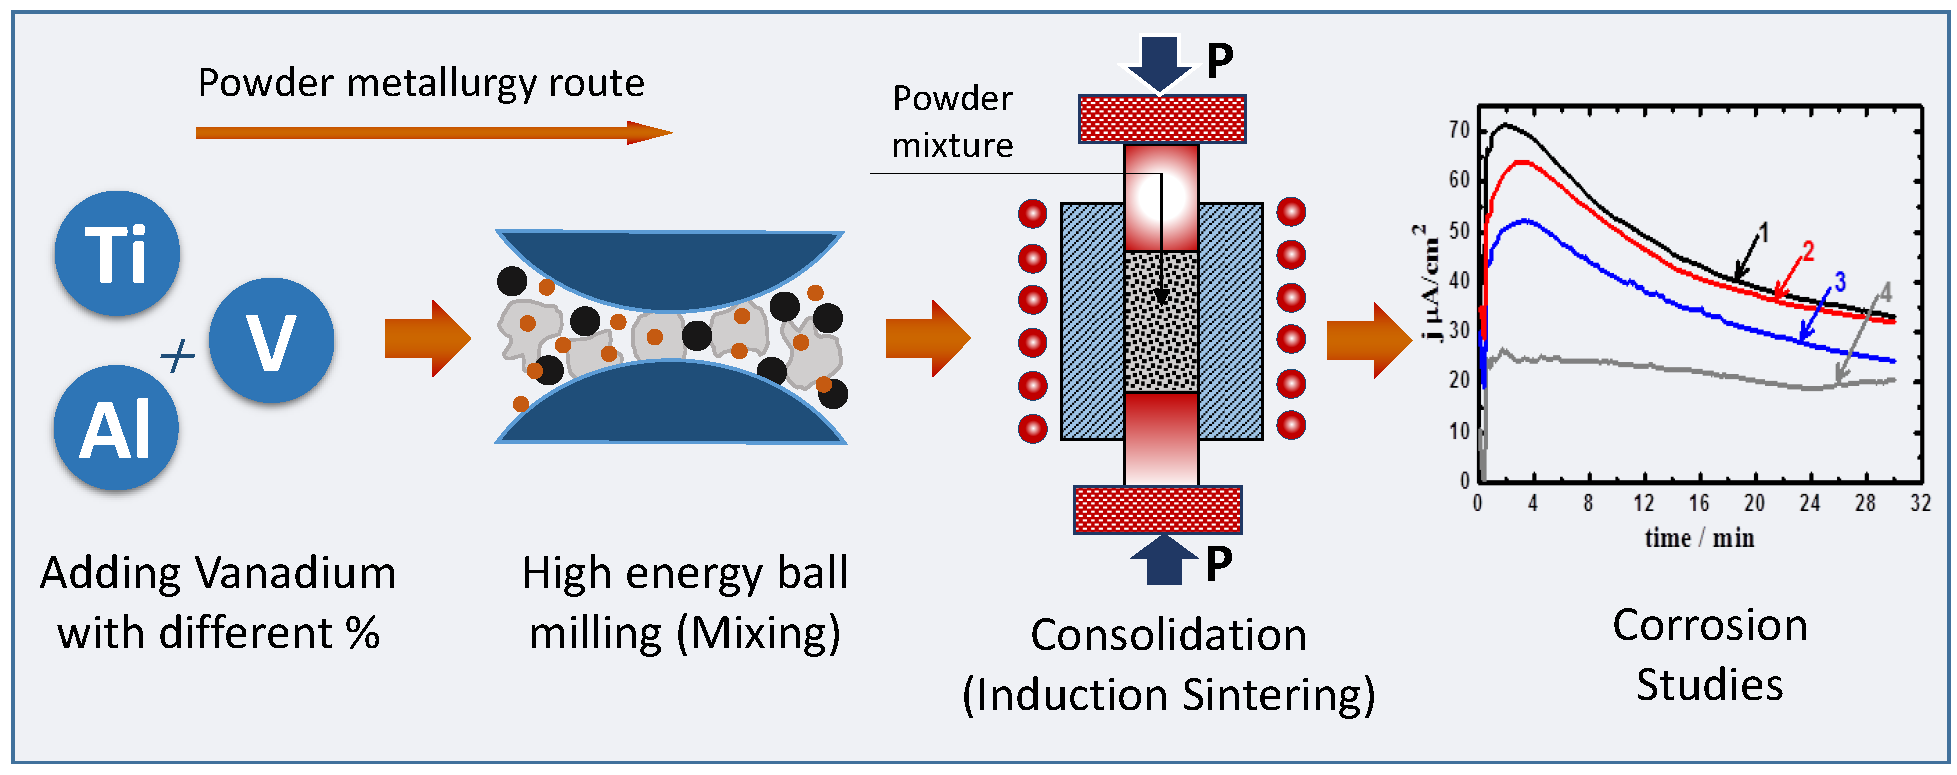
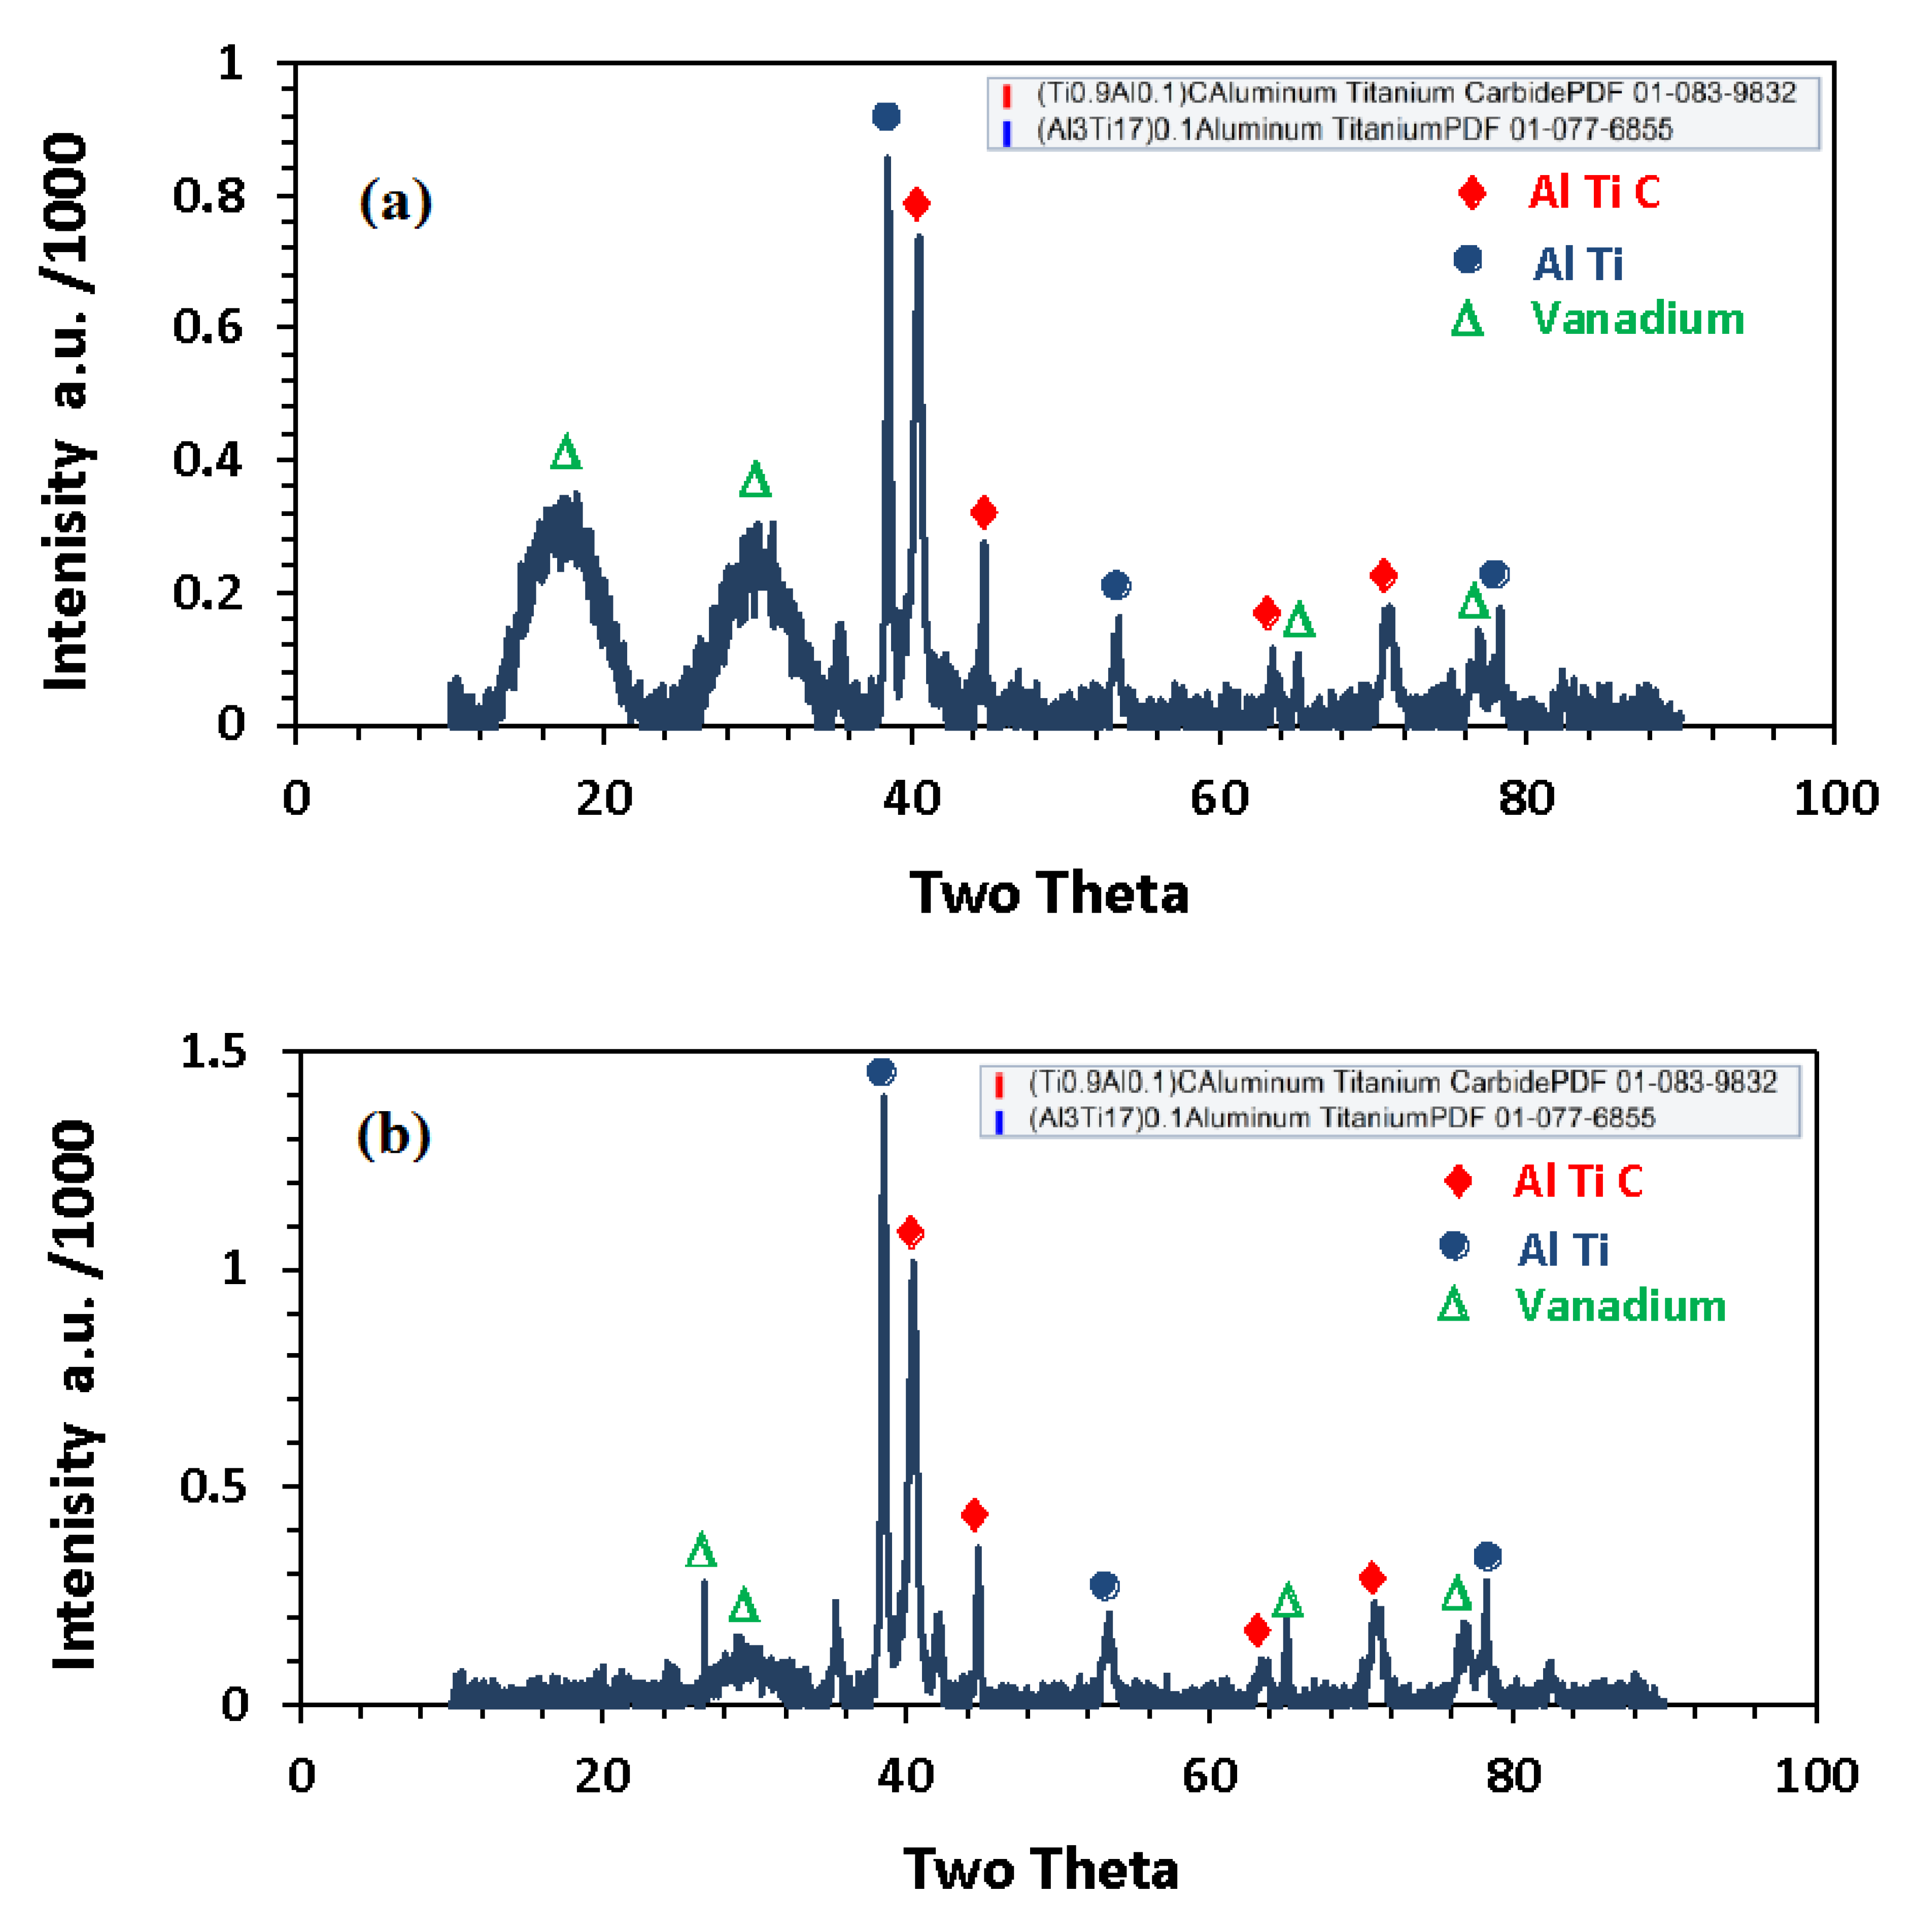
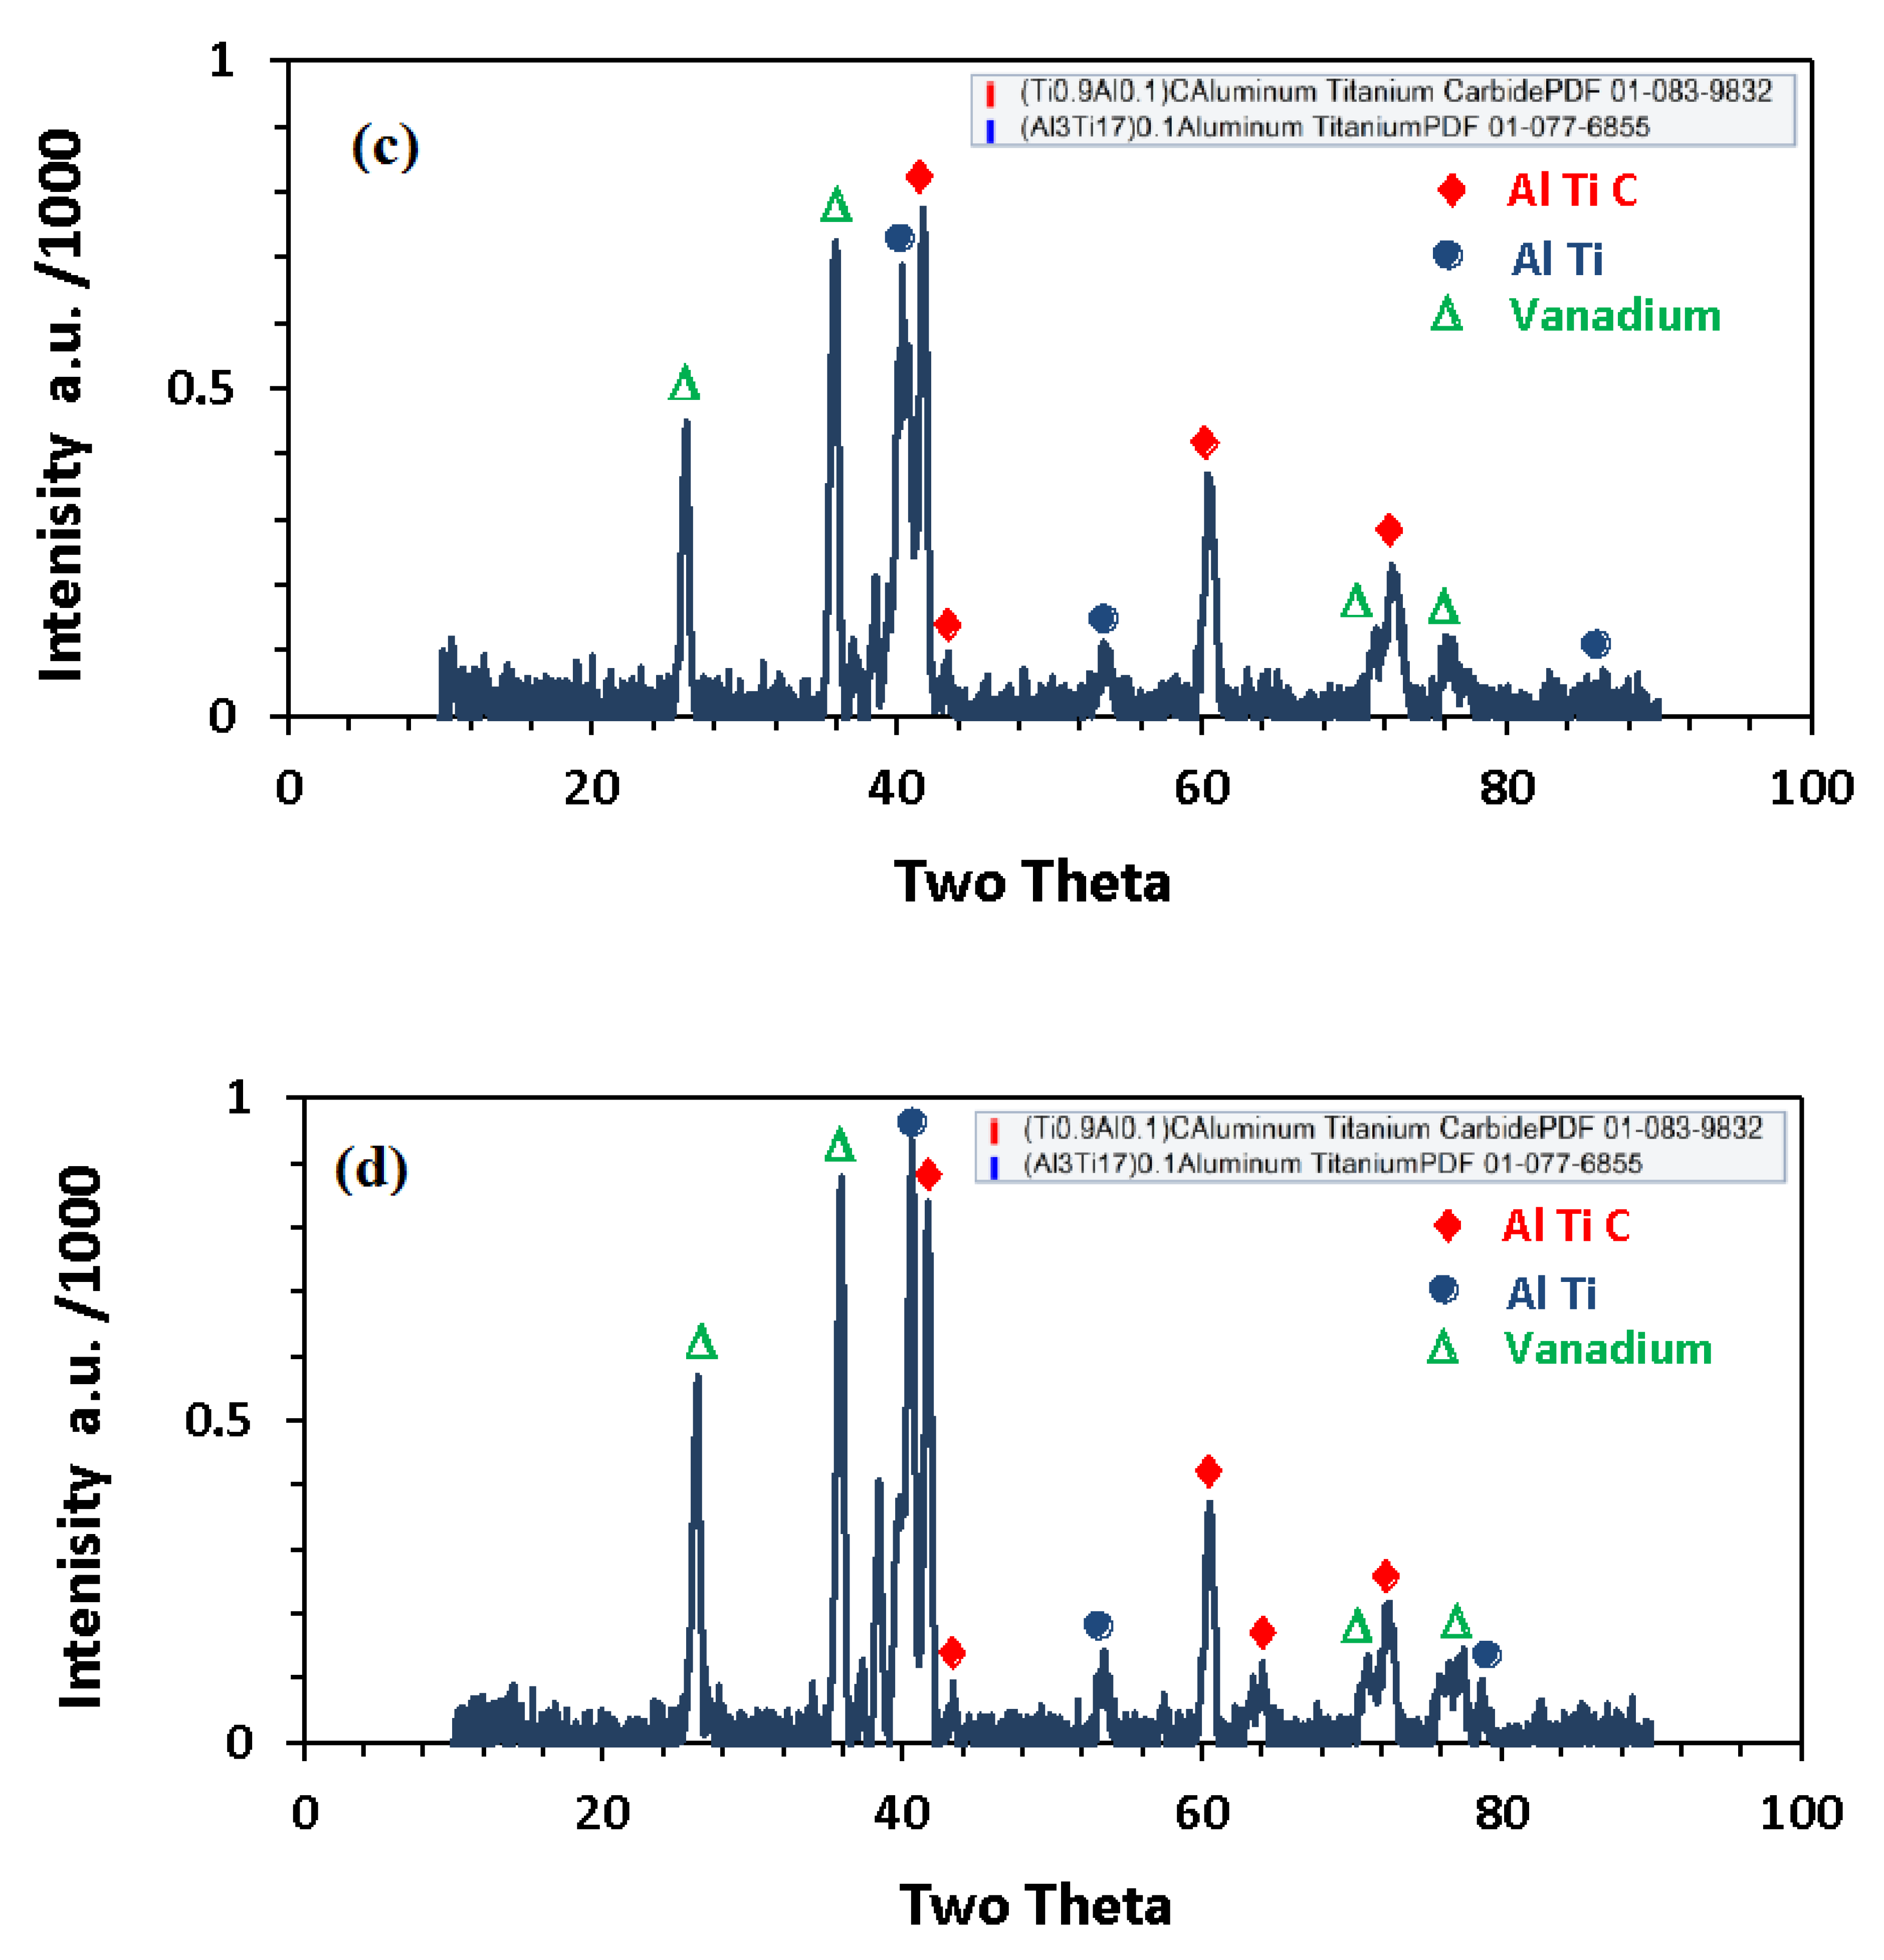
3.1. XRD Patterns

X-ray diffraction (XRD-D8 discover—Germany) was used to identify the elemental composition and the available phases created during the fabrication process of the alloys (a) Ti-6Al-2V, (b) Ti-6Al-4V, (c) Ti-6Al-6V, and (d) Ti-6Al-8V, and the spectra are shown in Figure 1. Based on the XRD pattern shown in Figure 1, the presence of vanadium peaks was clearly observed. The patterns here identified the presence of both aluminum-titanium (Al-Ti) and aluminum-titanium carbide (Al-TiC) phases. In addition, there was no significant difference and no new compounds detected by XRD through the different samples except the change in the vanadium peaks intensity, which was directly proportional to its concentrations in the sintered alloys. The XRD patterns confirmed the composition and phase analysis for the fabricated alloys.

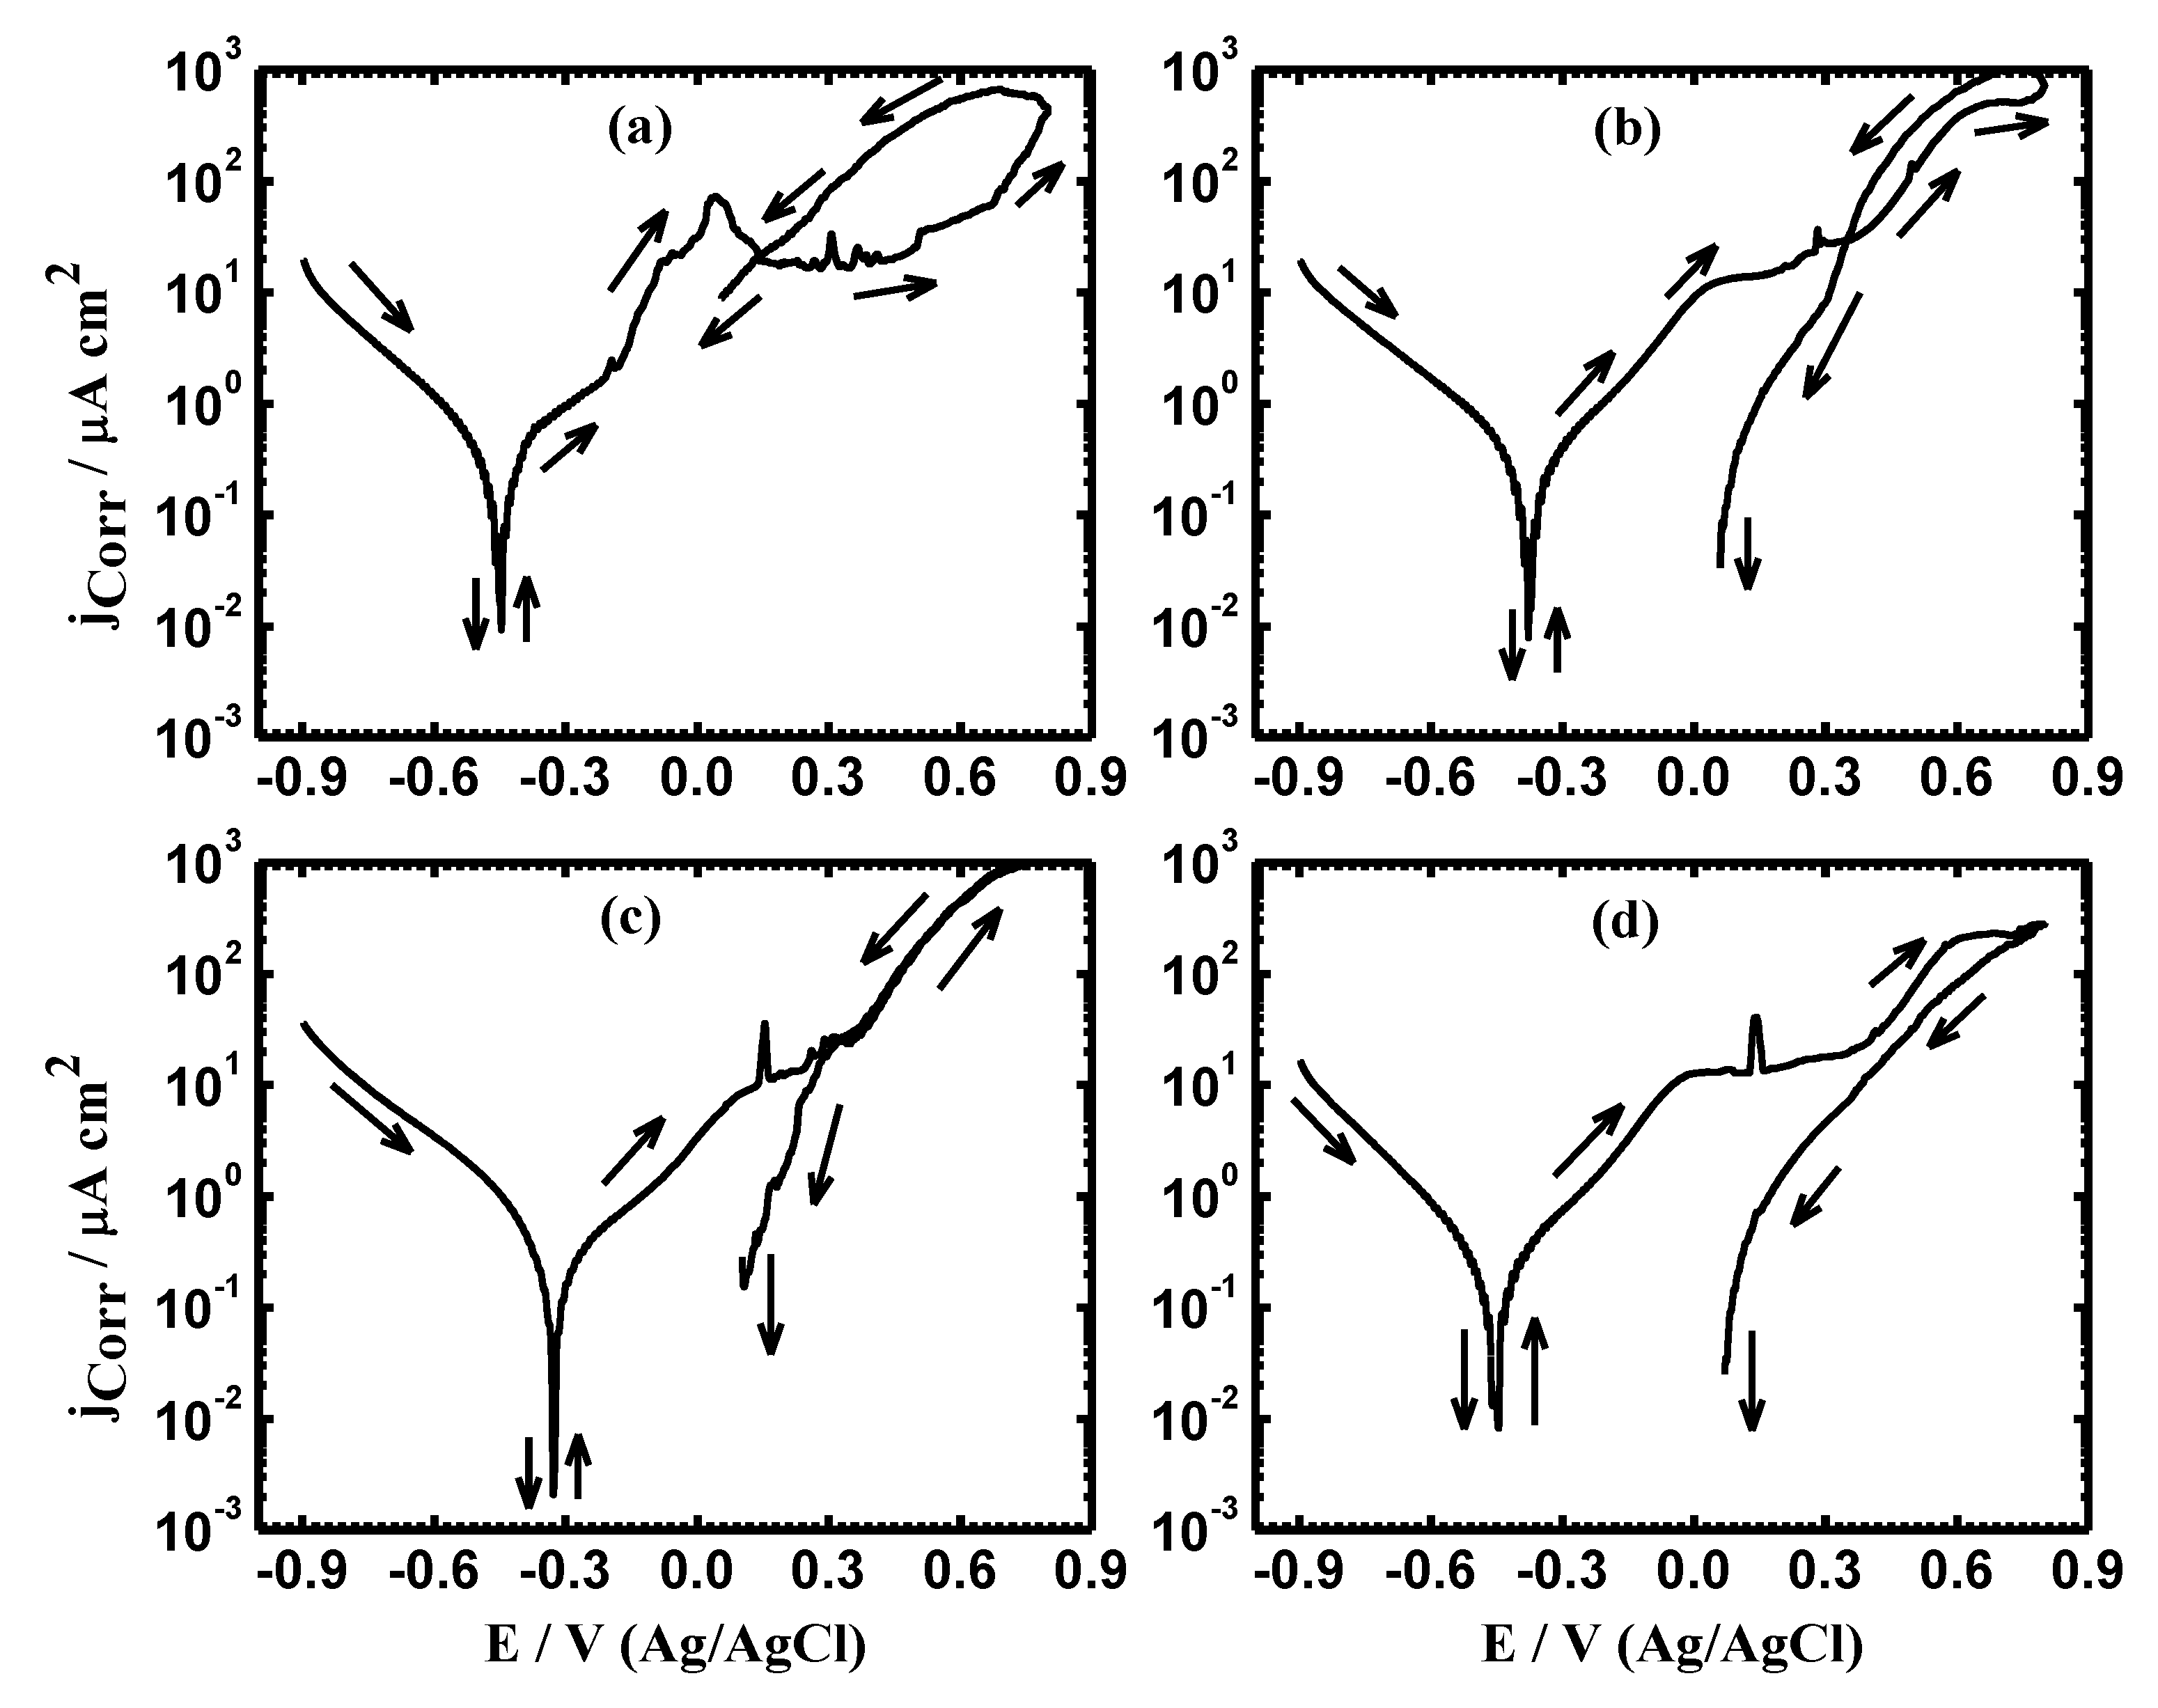
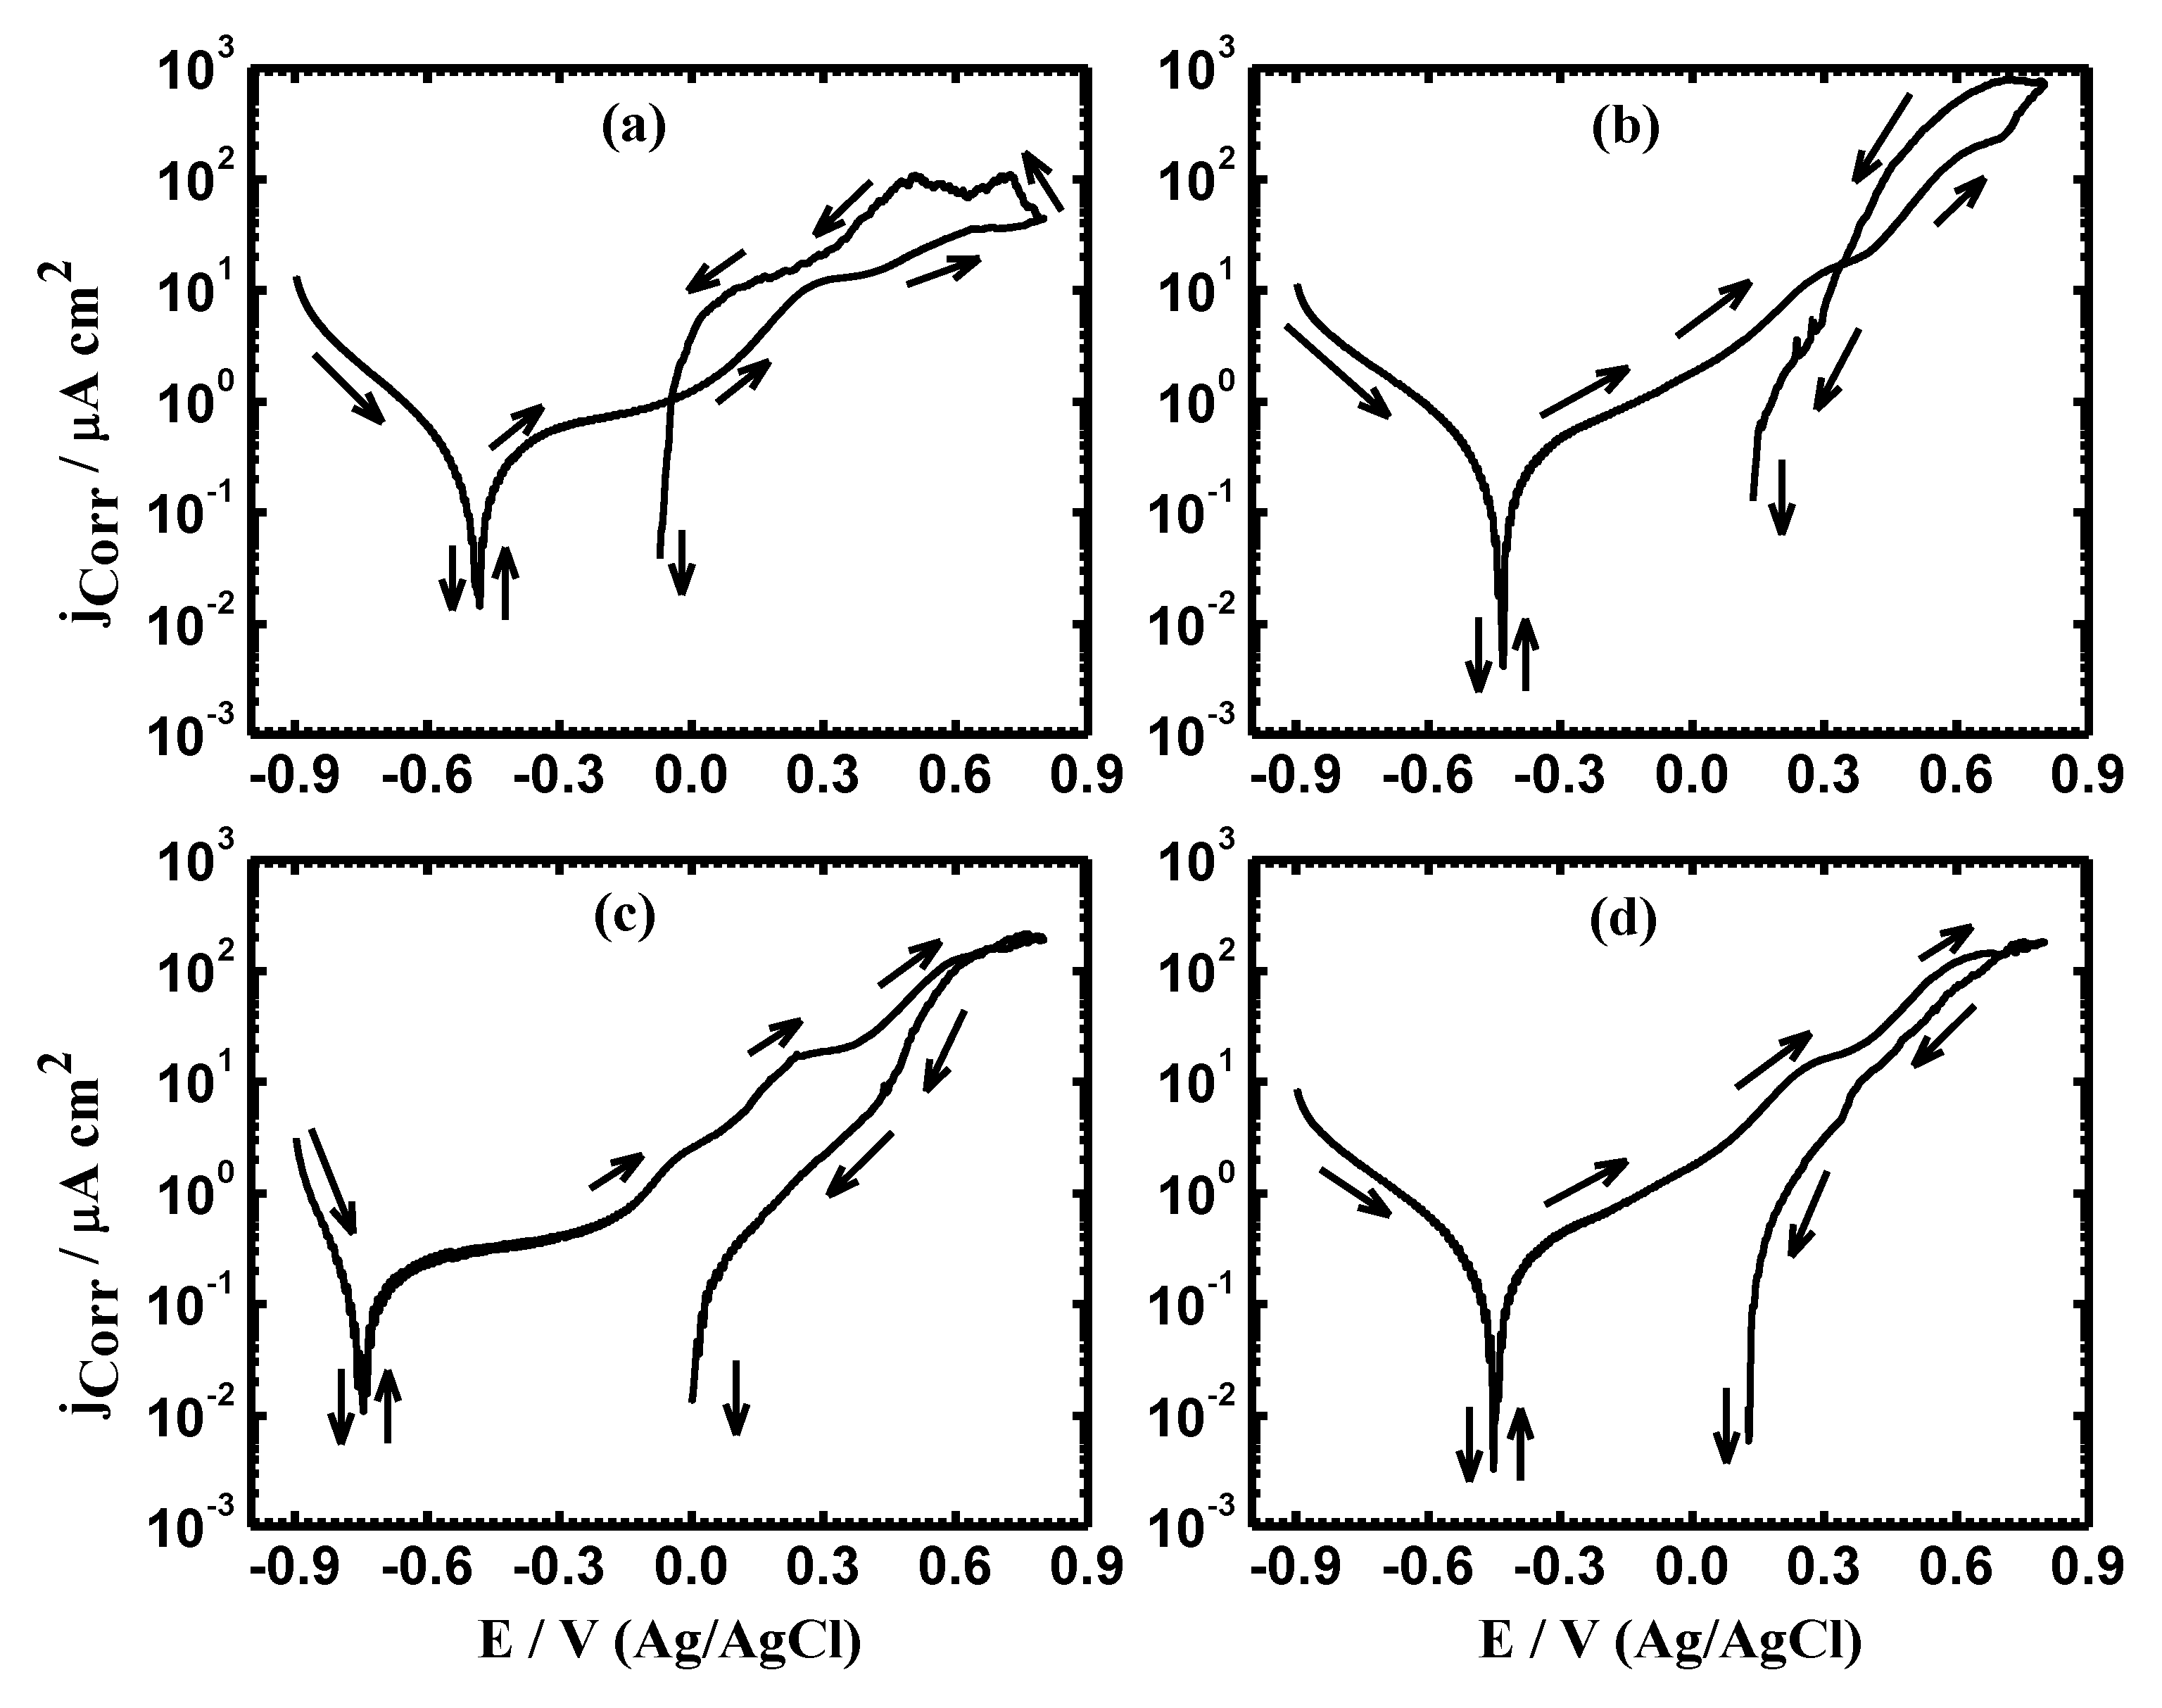
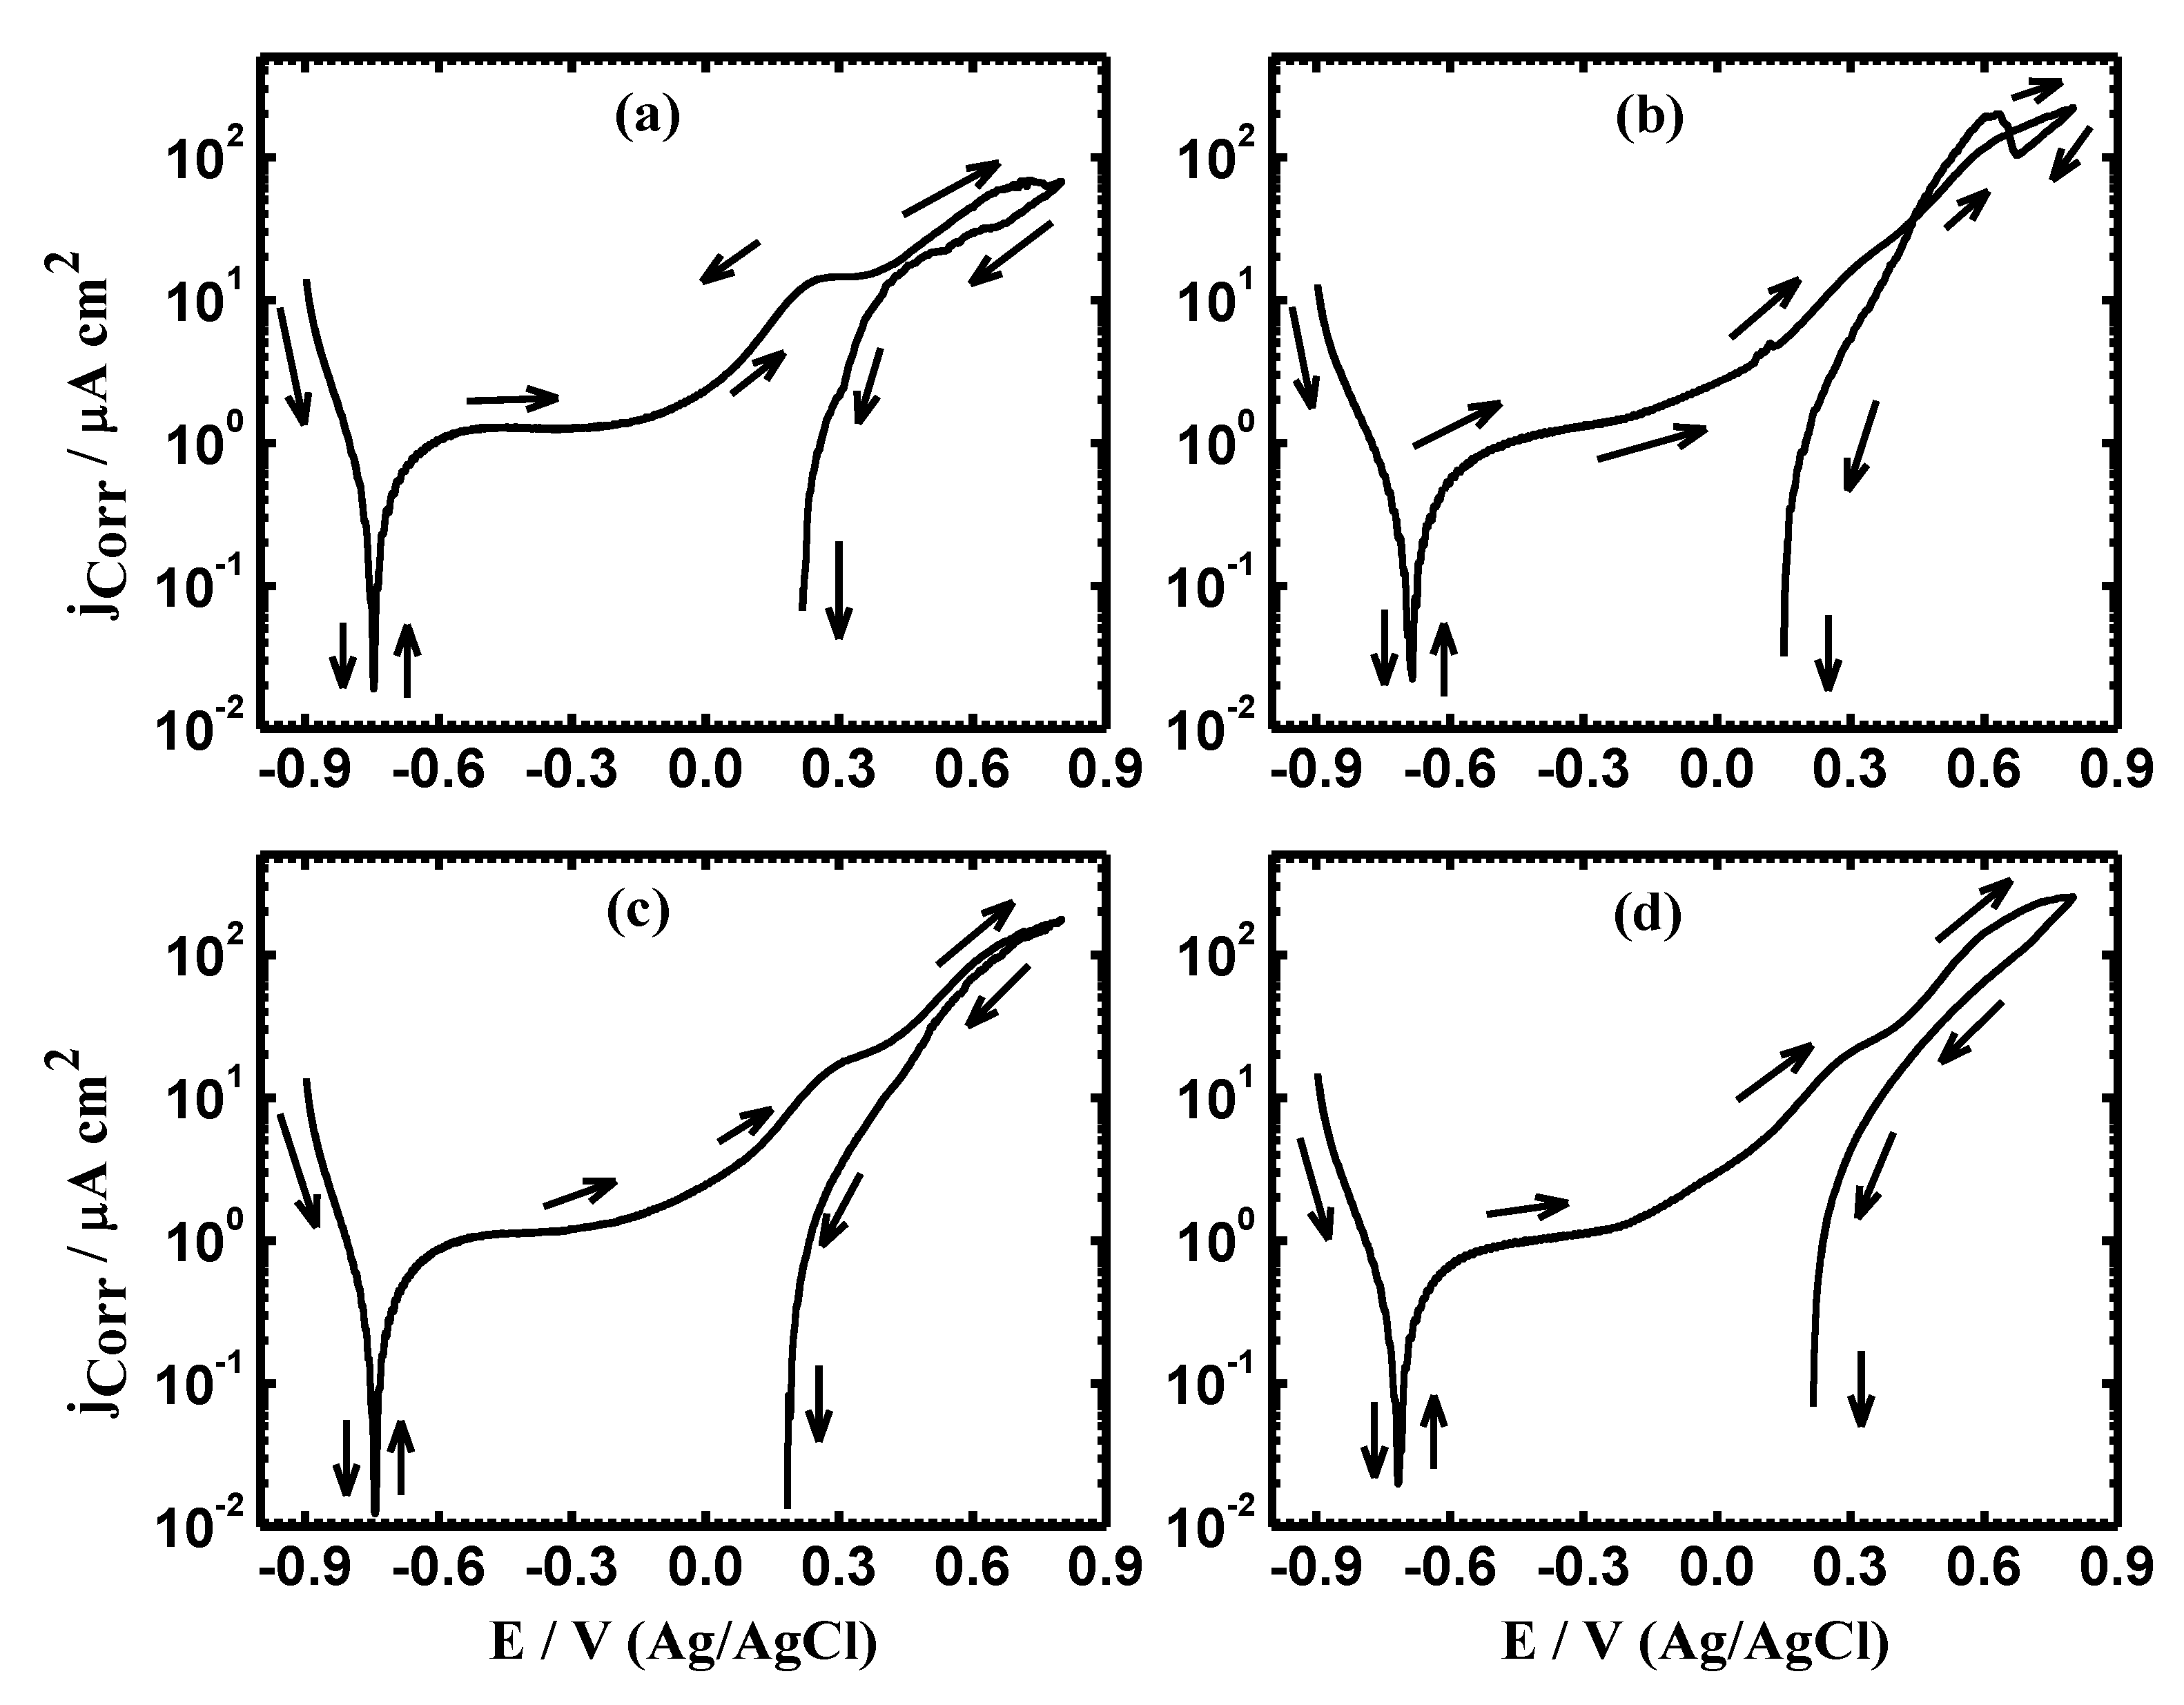
3.2. Cyclic Potentiodynamic Polarization (CPP) Data
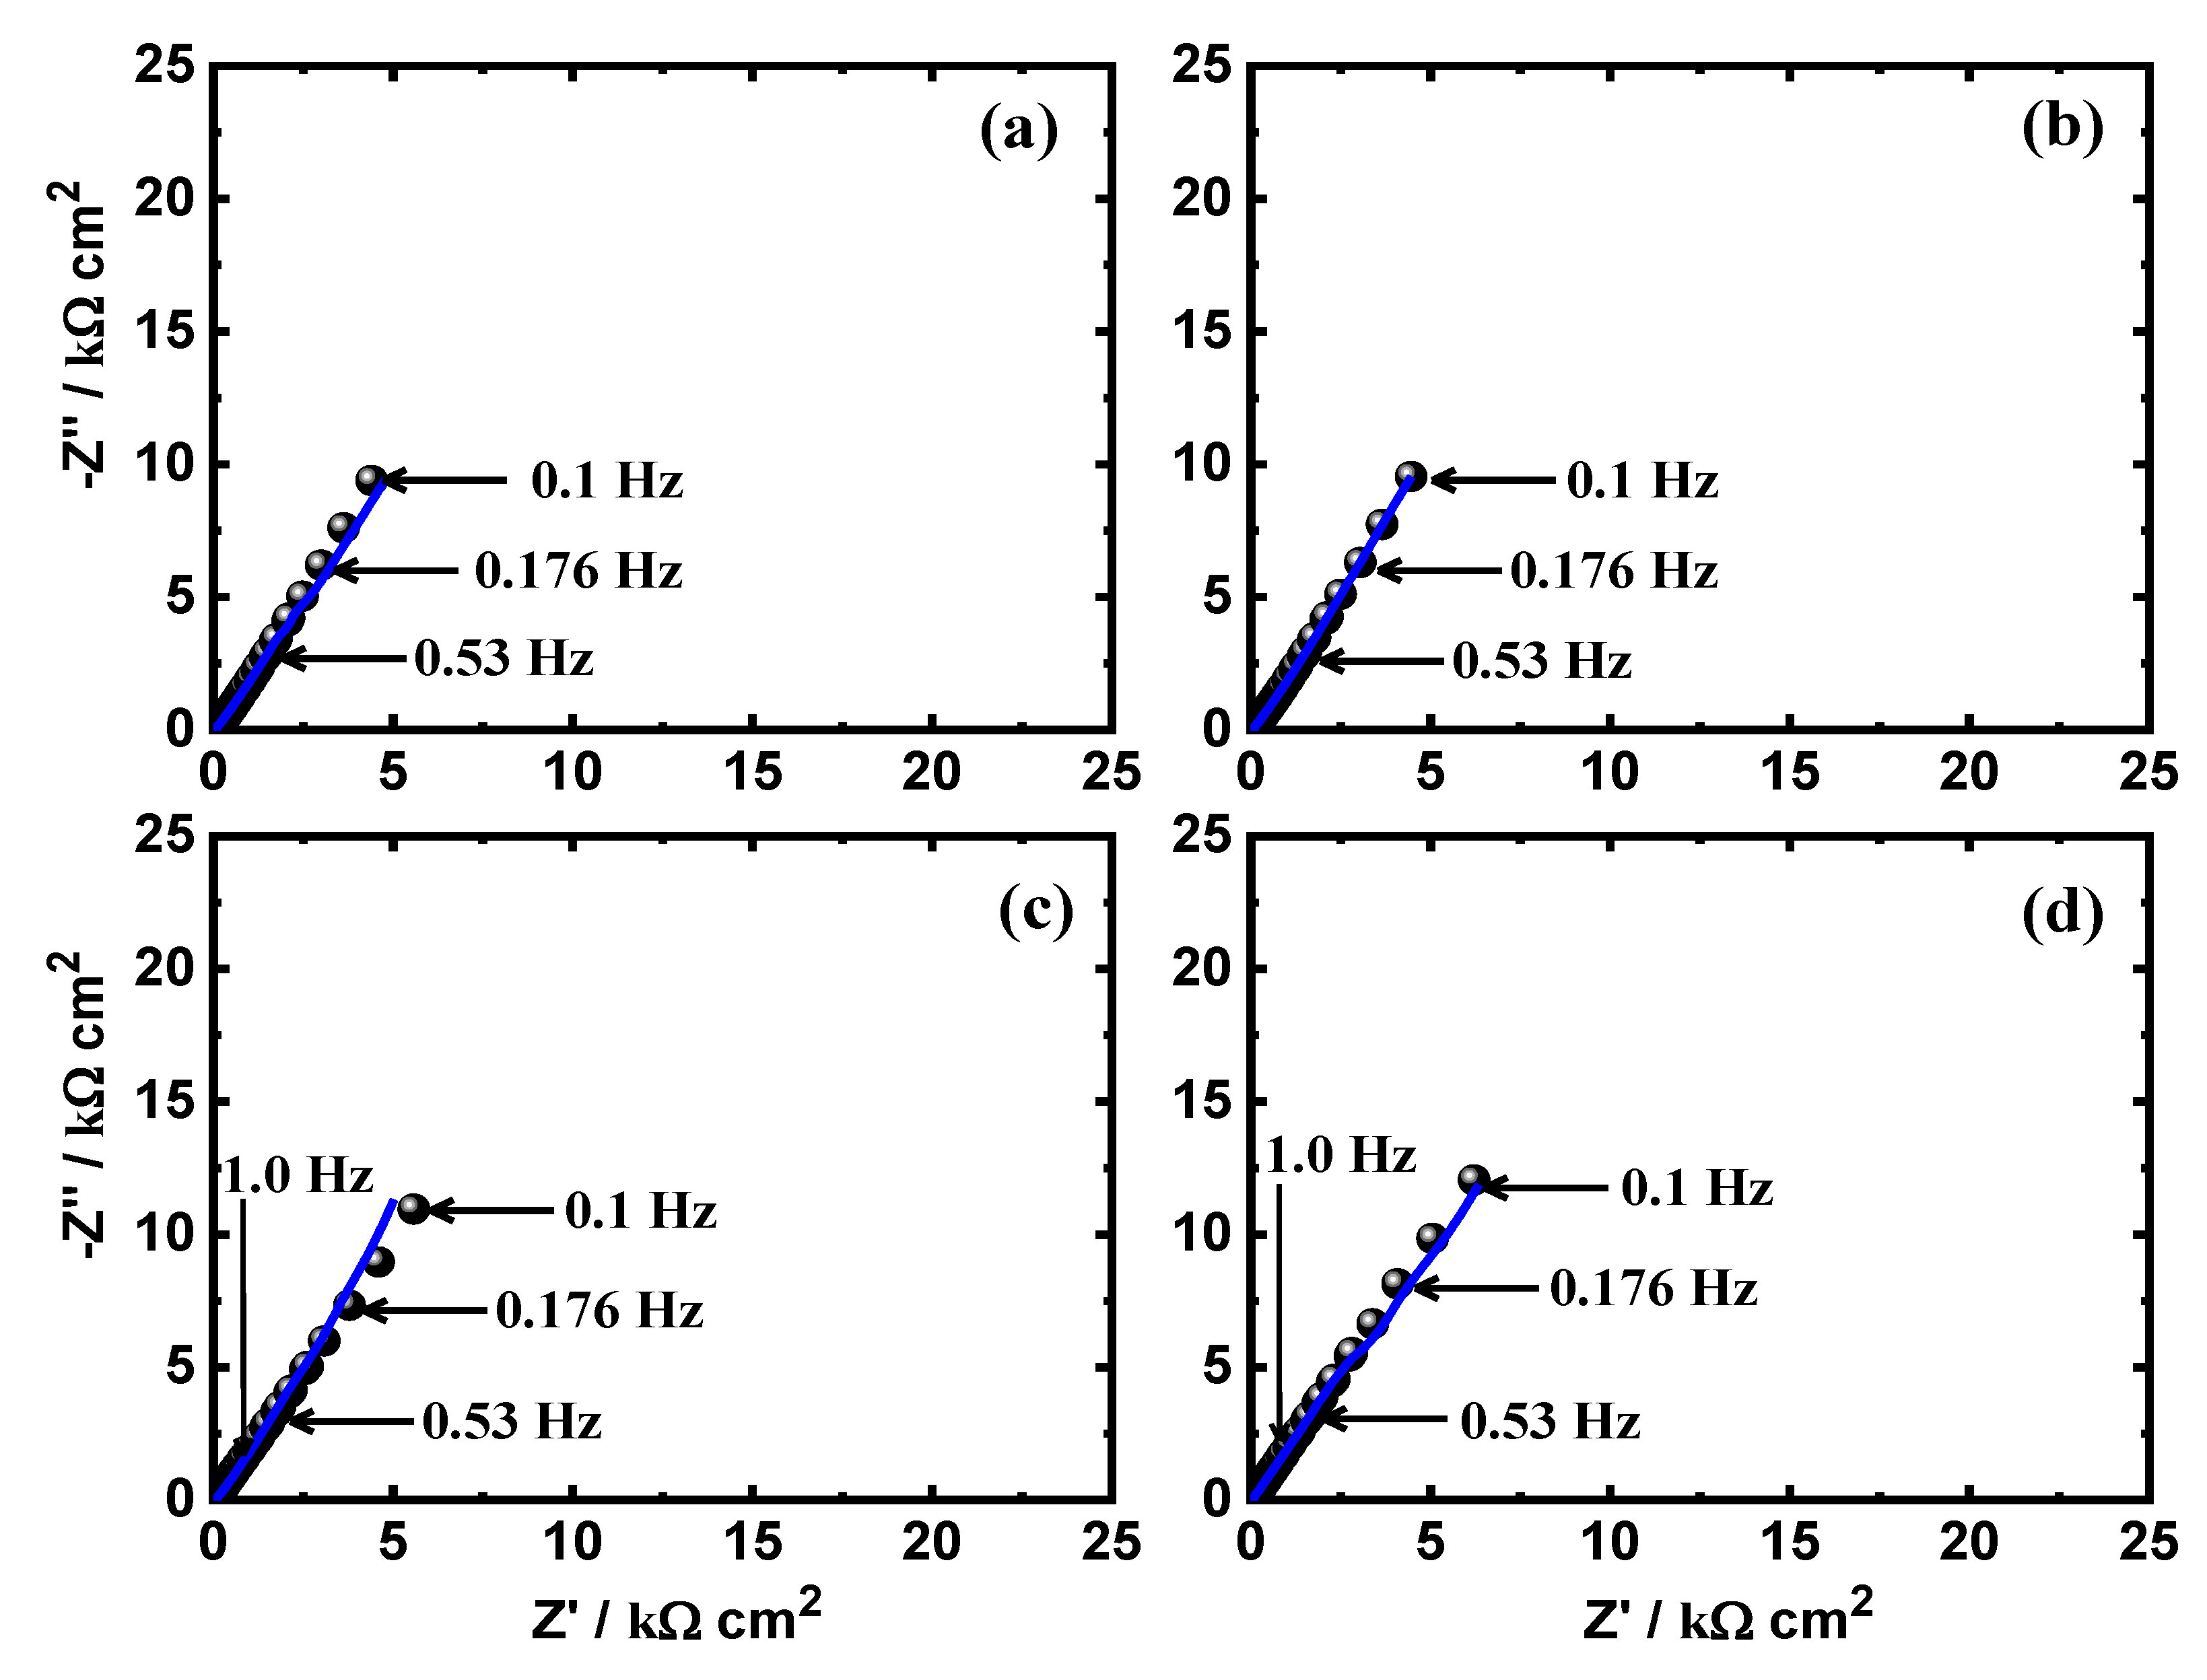
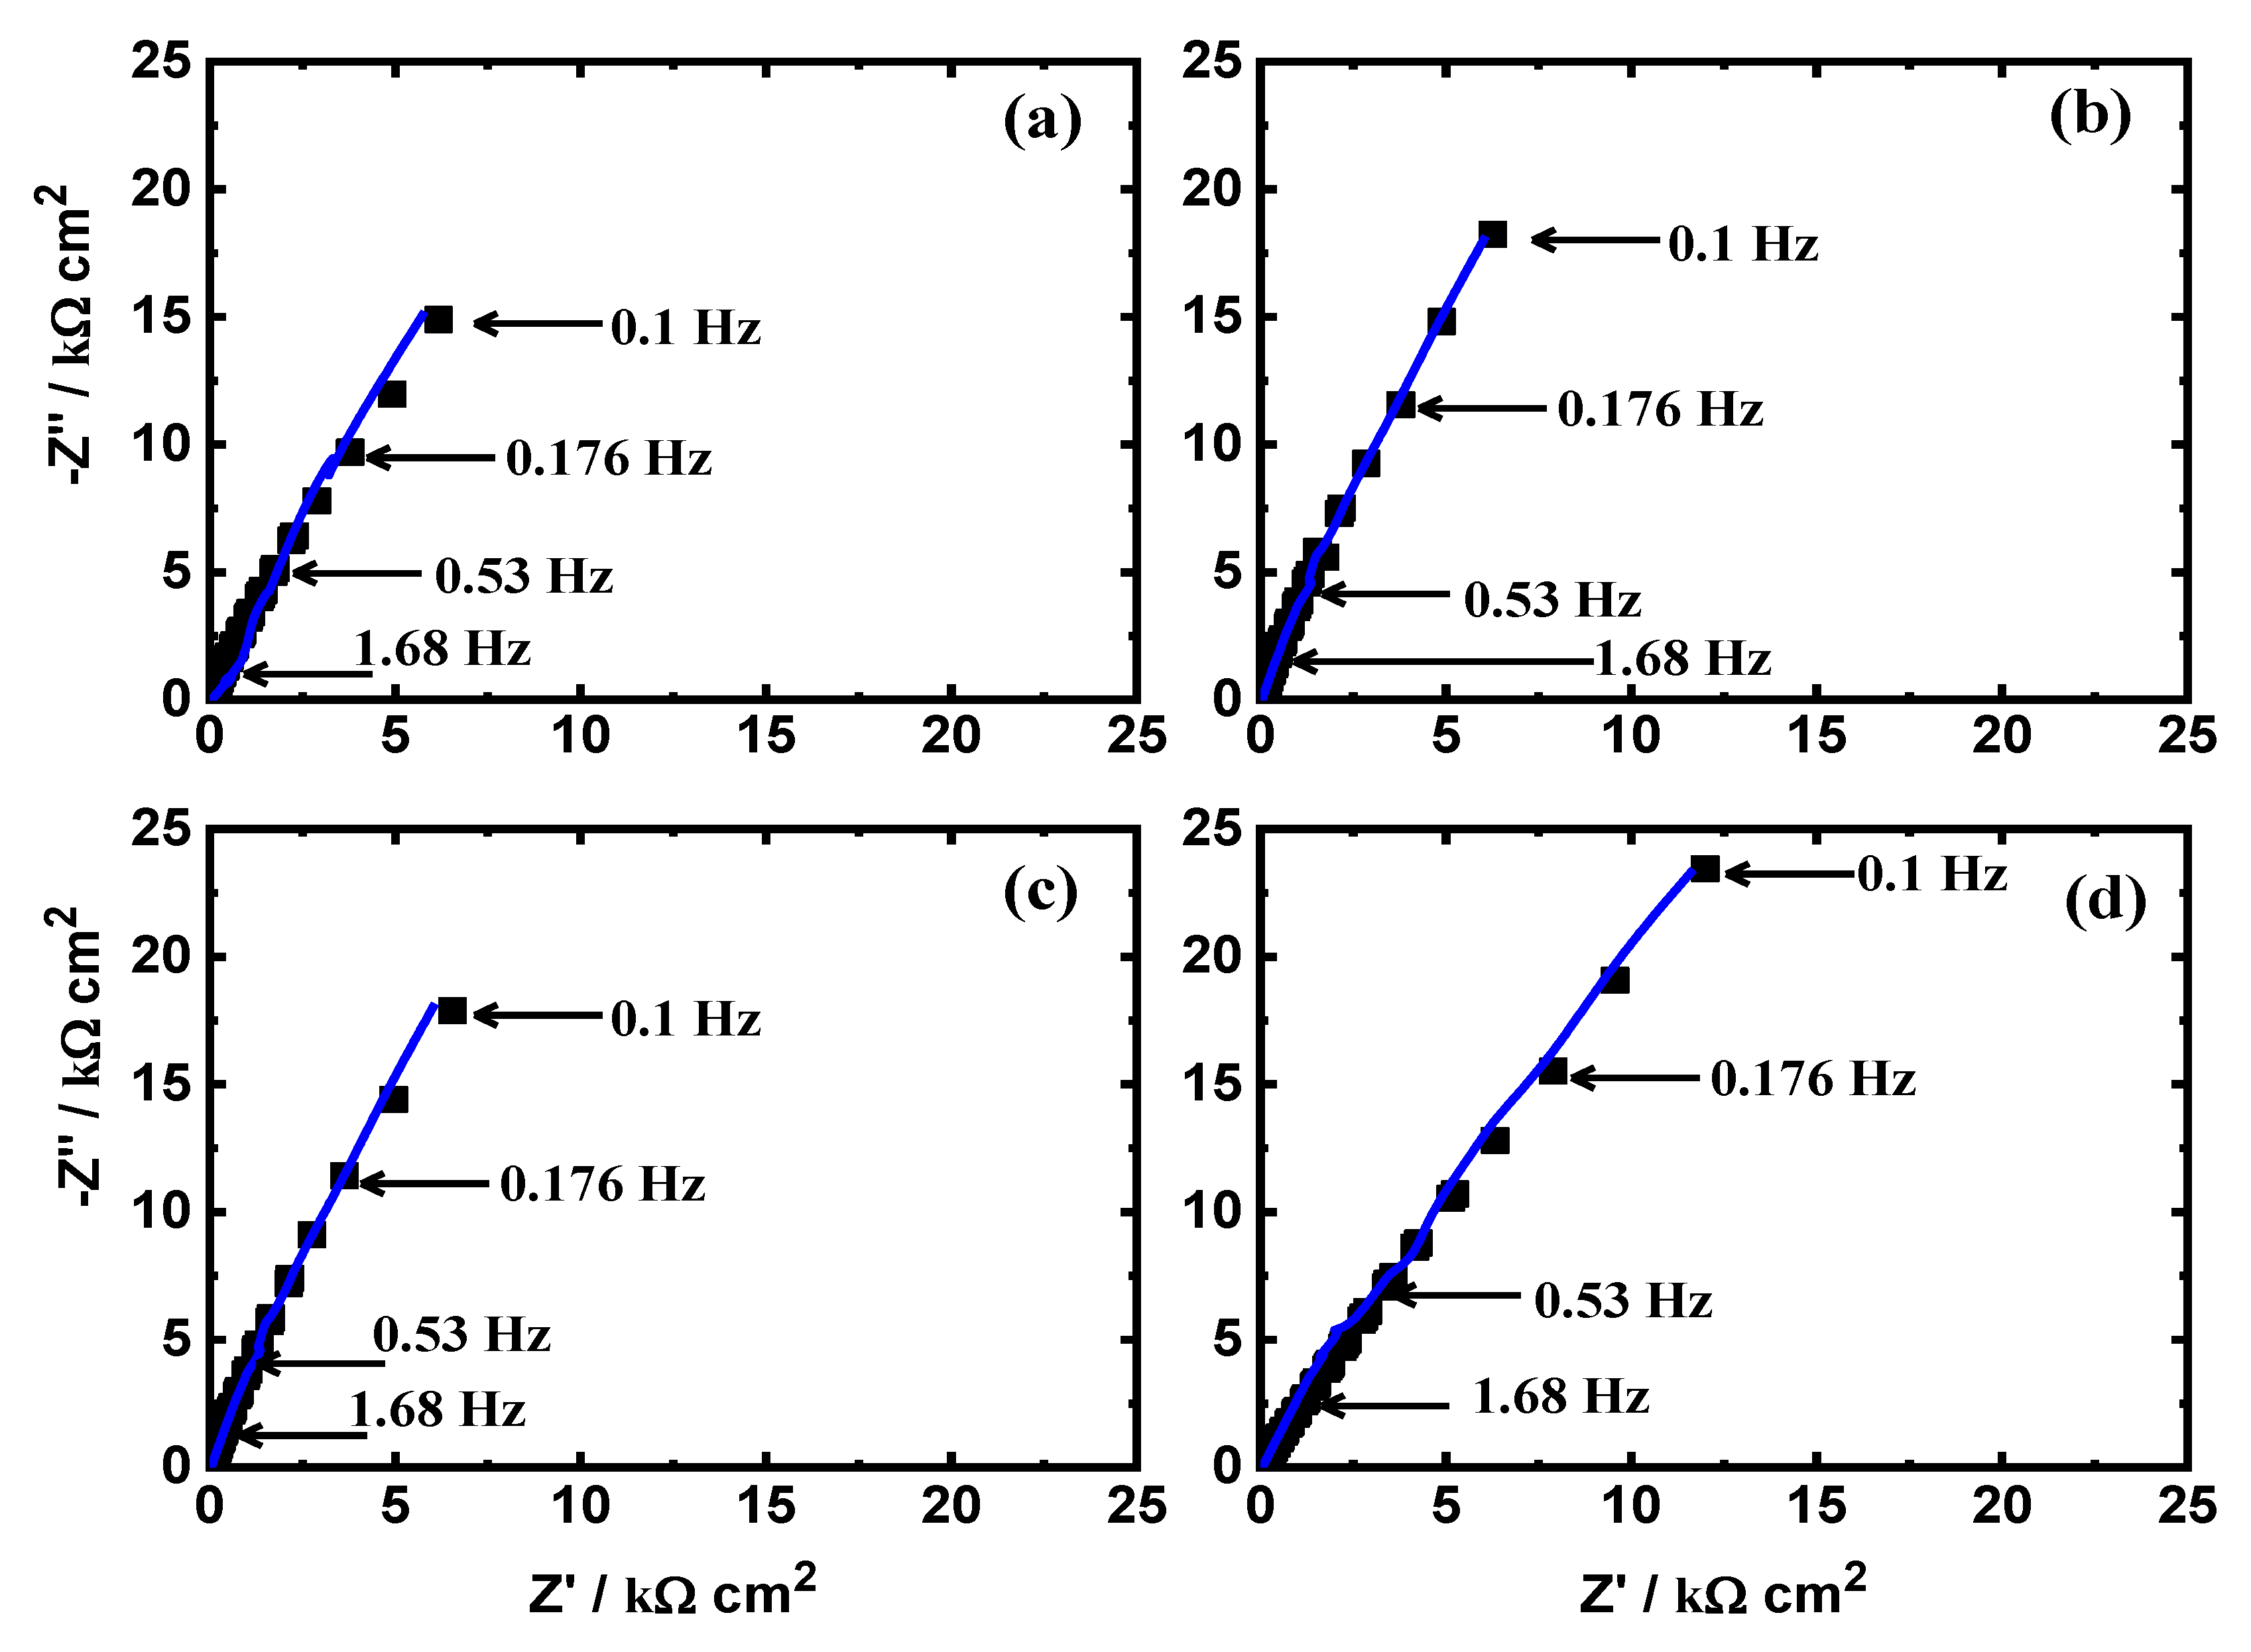
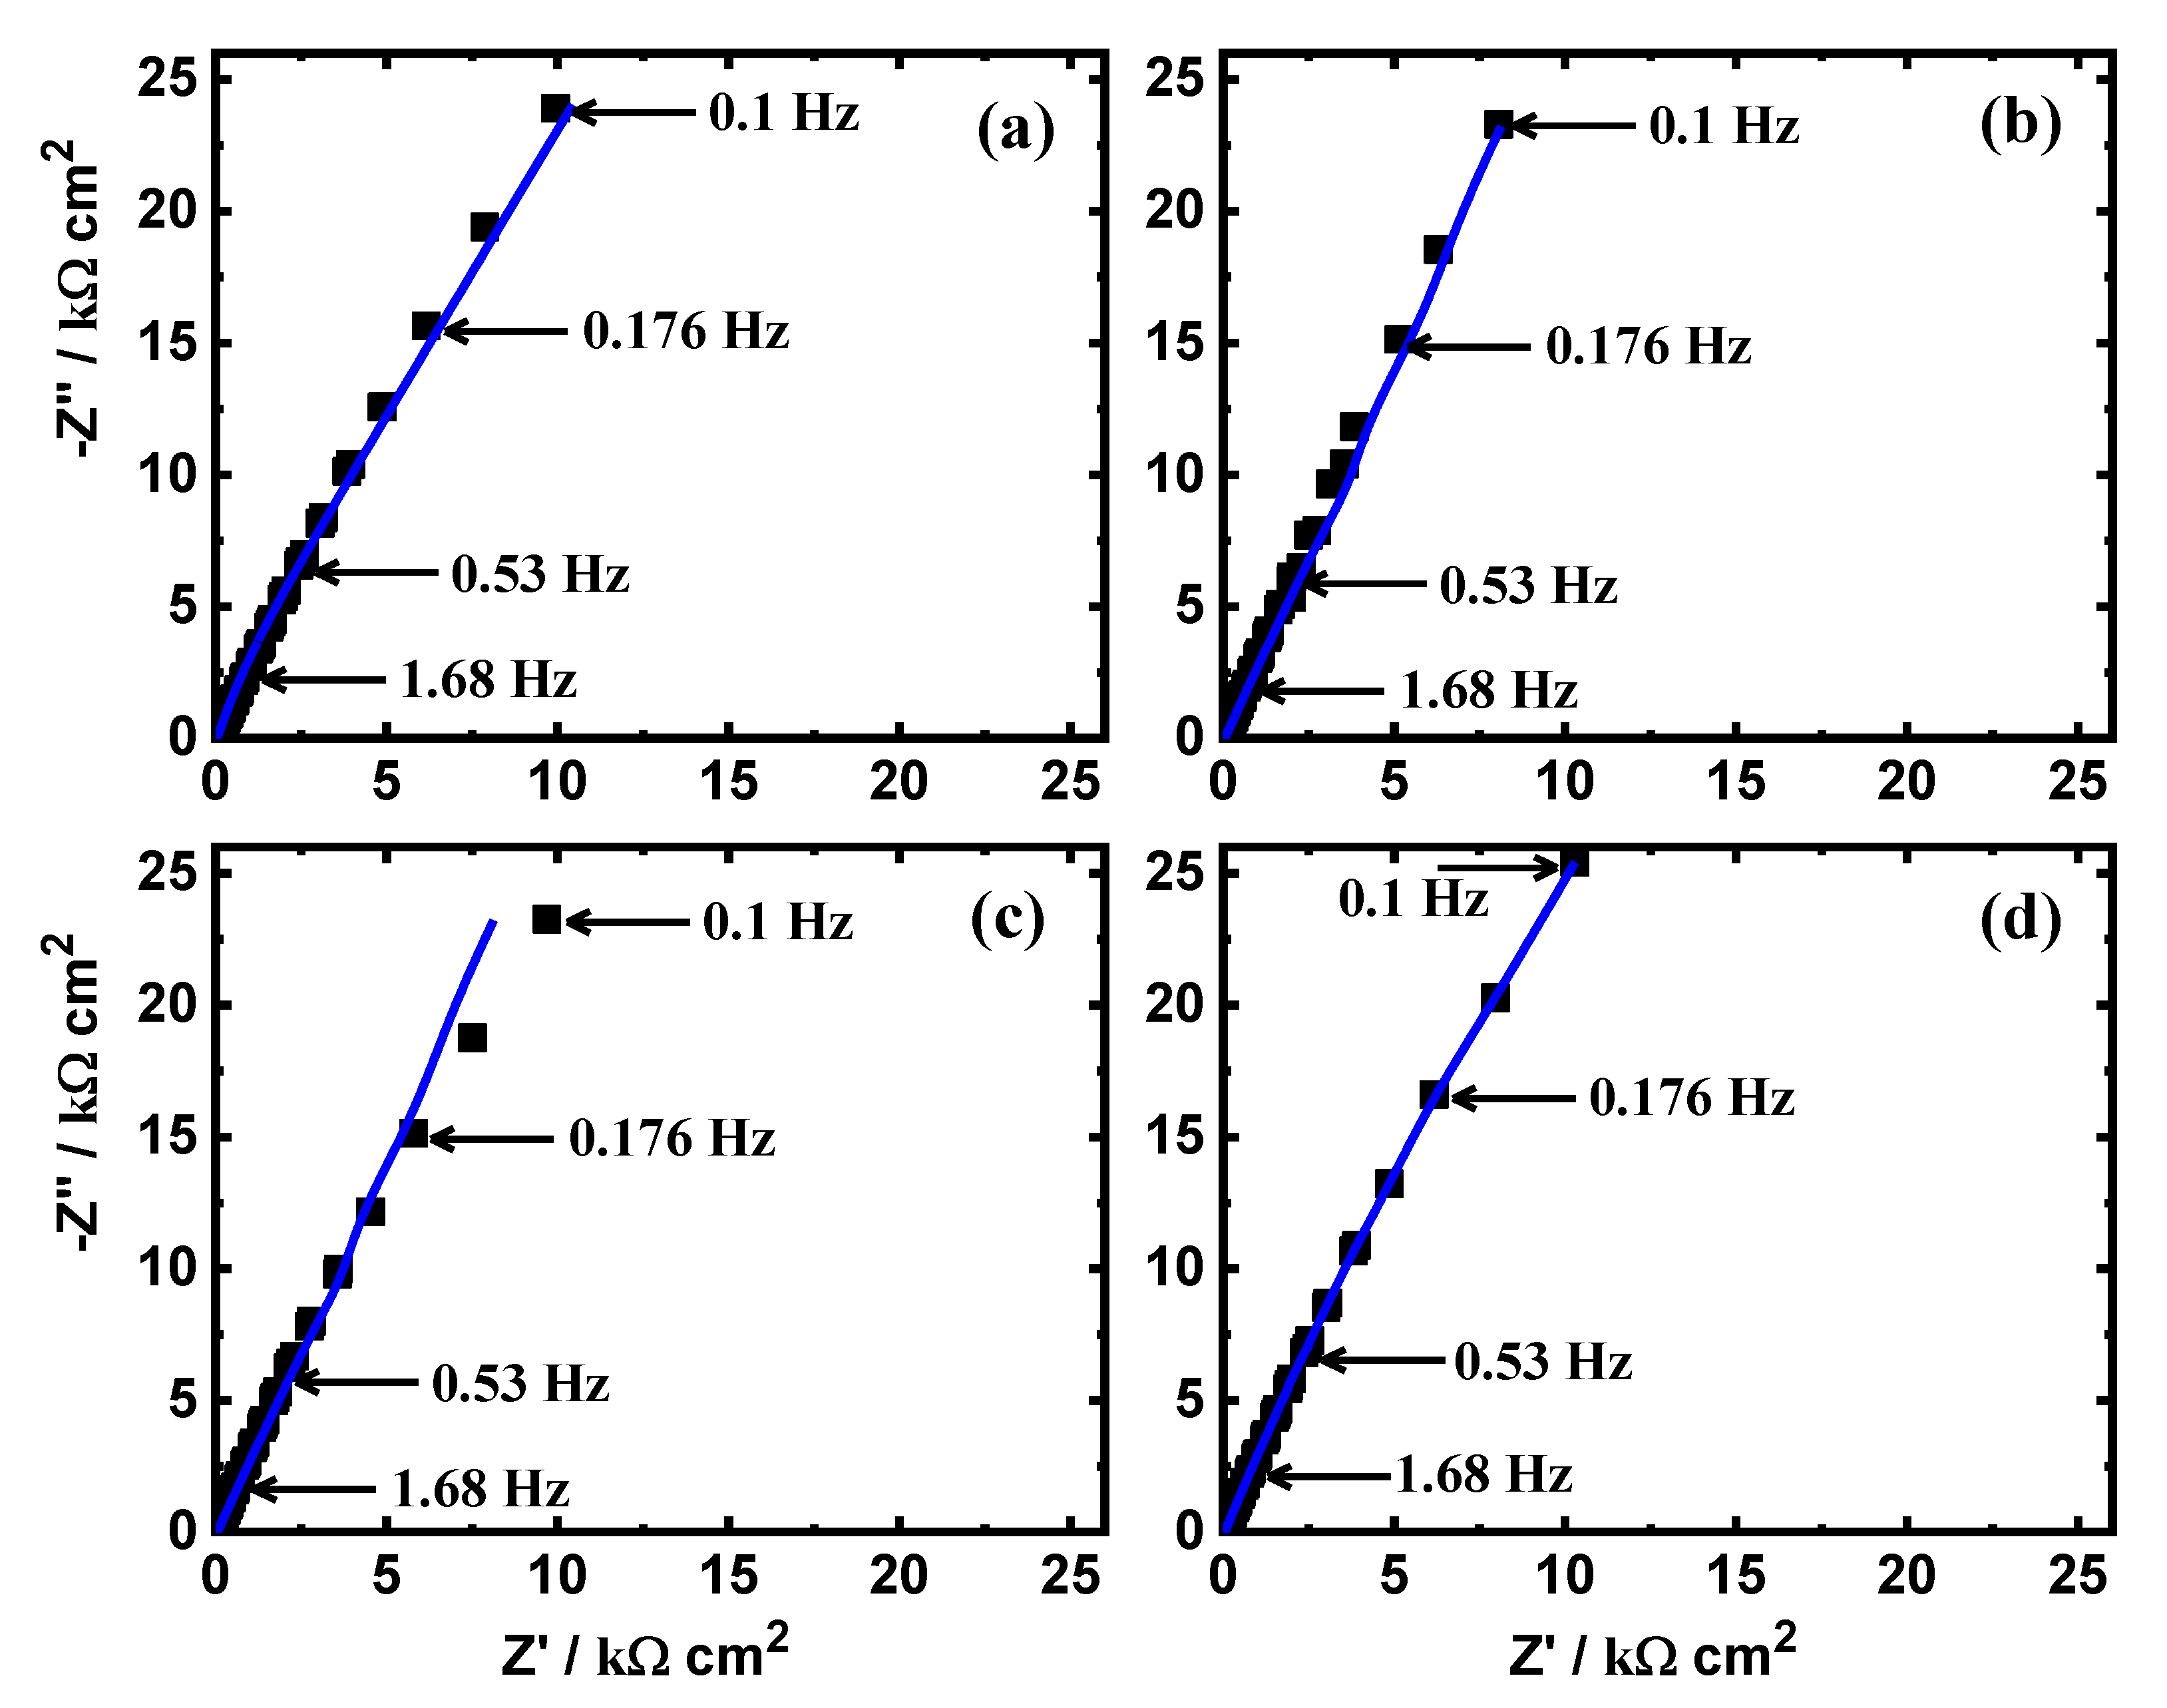
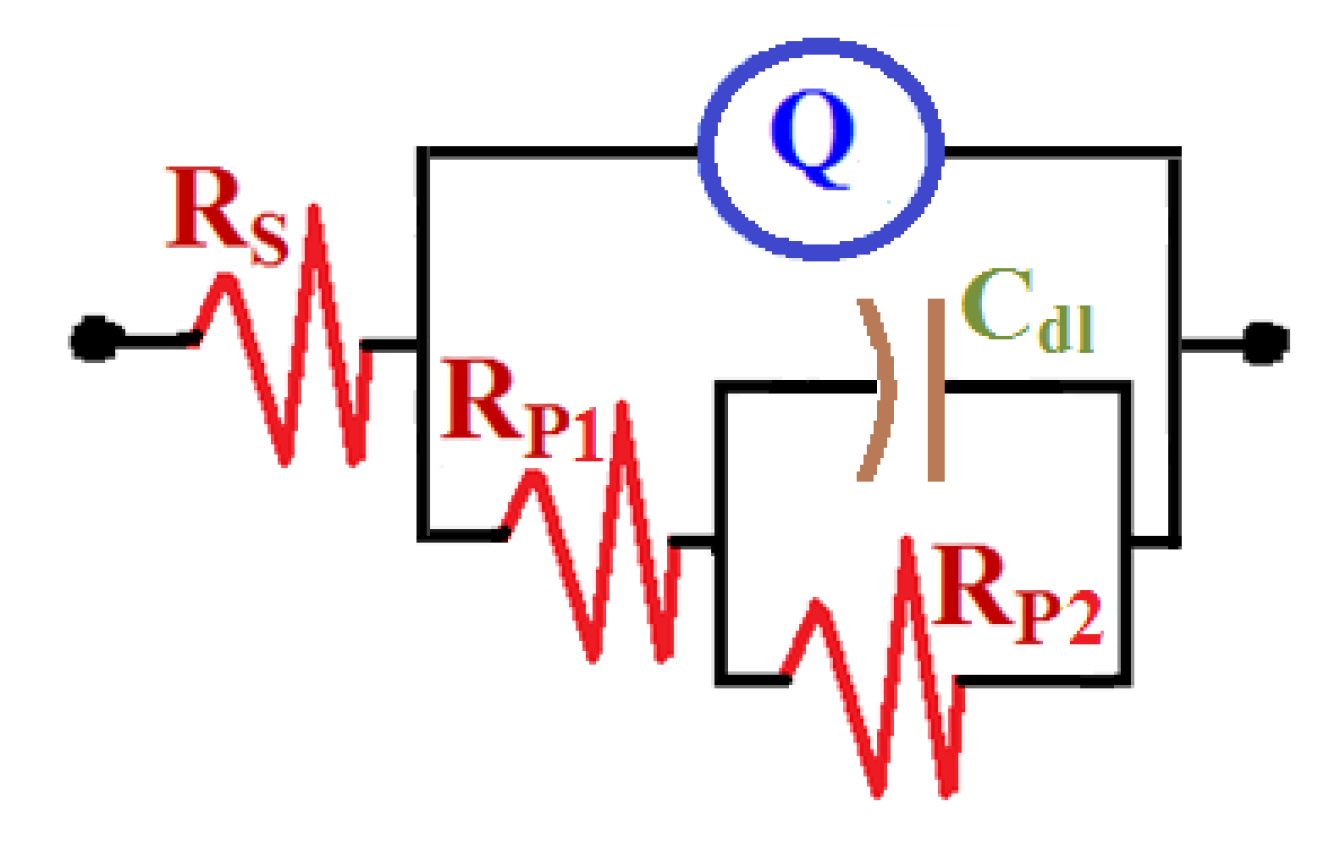
Figure 2 shows the CPP curves obtained for the (a) Ti-6Al-2V, (b) Ti-6Al-4V, (c) Ti-6Al-6V, and (d) Ti-6Al-8V alloys after immersion in SBF for 1 h. The same alloys were tested after immersion for 24 and 48 h, and the curves are depicted in Figure 3 and Figure 4. The values of the corrosion parameters, which were collected from the plotted CPP curves, are listed in Table 1. These are the cathodic (βc) and anodic (βa) Tafel slopes, corrosion current density (jCorr), and corrosion potential (ECorr), corrosion rate (RCorr), and polarization resistance (RP). The parameters values were obtained as per reported studies [37,38,39,40] (i.e., the values for RCorr and RP were calculated as represented in the footnote in Table 1). Figure 2 depicts that the cathodic current decreases with potential because of the oxygen reduction [40,41], which can be represented as follows:
2 H 2 O + O 2 + 4 e = 4 OH
1 2 O + H 2 O + 2 = 2 OH
OH ads + e = OH
Meanwhile, the anodic reaction could be the dissolution of Al and the formation of titanium oxide, TiO2, aluminum oxide, Al2O3, and vanadium oxide, V2O5. This is because the current alloys, in addition to Ti, contain both Al and V as alloying elements that may take part in the surface reactions. The current increases in the anodic side due to the lower negative applied potential than ECorr, as a result of Al dissolution (i.e., Al is the most active metal in these alloys), which may react as follows [41,42,43,44]:
Al = Al3+ + 3e
The current then slow down slightly due to the adsorption of hydroxide ions on the fresh surface of Al to form aluminum hydroxide;
Al ( S ) + 3 OH = Al ( OH ) 3 , ads + 3 e
This Al(OH)3, in turn, is transformed into hydrated aluminum oxide as follows [6]:
2 Al ( OH ) 3 , ads = Al 2 O 3 · 3 H 2 O
A rapid increase in the current occurred after the short passivation region due to the dissolution of the formed oxide layer represented by Equation (6). It has also been reported [45] that Ti-base alloys tend to form a spontaneous passive film of TiO2 layer when its surface is exposed to air or is immersed in a solution that contains water [46];
Ti = Ti2+ + 2e
2Ti(S) + 4OH = 2Ti(OH)2 + 4e
2Ti(S) + 2O2 = 2TiO2(S) + 4e
The hydroxide ions that reacted with Ti were produced in the SBF solution, either via Reaction (1) or Reaction (3) or together. The Ti(OH)2 produced by Reaction (8) could passivate the surface of the alloy, causing the deceleration of the increase of current. The formation of Al2O3 and TiO2, in addition to the formation of the V2O5 layer, adds more protection to the alloy surface.
Figure 2 and Table 1 indicate that the Ti-6Al-2V alloy shows the highest value of the corrosion parameters. Moreover, the higher current values in the reverse direction compared to the currents in the forward direction resulted in the appearance of a large area of a hysteresis loop. This loop confirmed the occurrence of pitting corrosion. Increasing the content of V to 4% (Figure 2b) decreased the values of jCorr and RCorr and the size of the hysteresis loop, while it increased the value of RP. The higher concentration of V, i.e., 6% and 8%, offered the highest resistance to uniform corrosion, as well as minimized the size of the hysteresis loop indicating the lowest uniform and pitting corrosion.
Prolonging the exposure time to 24 h in the SBF solution decreased the uniform and localized corrosion for the tested alloys via decreasing the values of jCorr, RCorr, and the size of the hysteresis loop, as well as increasing the values of corrosion resistance, RP. The effect further increased with the vanadium content from 2 to 8%, as can be seen from Figure 3 and Table 1. After immersion for 48 h (Figure 4), the corrosion resistance in SBF increased for all alloys towards both the uniform and pitting attack. The decrease of uniform corrosion was confirmed via decreasing jCorr and increasing RP. The decrease of pitting corrosion was achieved through the disappearance of the hysteresis loops. CPP data indicated that the increase of V content, as well as the increased immersion time, significantly increased the corrosion resistance of the titanium alloy in SBF solutions.

3.3. EIS Data

The Nyquist plots recorded for the (a) Ti-6Al-2V, (b) Ti-6Al-4V, (c) Ti-6Al-6V, and (d) Ti-6Al-8V alloys after 1 h immersion in SBF are shown in Figure 5. Nyquist plots were also collected after 24 and 48 h immersion, and the spectra are depicted in Figure 6 and Figure 7, respectively. All EIS measured data were fitted to the equivalent circuit model presented in Figure 8. This circuit consists of solution resistance (RS), constant phase elements Q (YQ, CPEs), polarization resistance (RP1), double layer capacitor (Cdl), and second polarization resistance (RP2). The values of all these elements are summarized in Table 2. It is worth mentioning that the same circuit was also used to fit EIS data for other metals and alloys [35,37,38]. The use of Q and Cdl has been reported [47] to consider possible deviations from ideality in the capacitive response systems. The admittance, impedance of a CPE can also be defined via these equations [48];
YCPE = −Y0(jω)n
ZCPE = −(1/Y0)(jω)n
And the constant phase element, Q, is defined as follows [36,49];
ZCPE = [Q(2πfi)n]−1
The Nyquist plots in Figure 5, obtained after 1 h exposure in SBF solution for the manufactured alloys show almost similar spectra. In addition, Table 2 shows that the values of RS, RP1, and RP2 increase with the increase of the vanadium content in the alloy. The corrosion resistance of each fabricated alloy is the sum of its polarization resistances, i.e., RP1 + RP2. Moreover, the presence of different time constants proved that the EIS anodic films were associated with a complex structure. This is because of the formation of two layers. An inner layer results from dominant impedance at a high-frequency region and another outer layer that is porous and dominates the impedance at the low-frequency region [36,47]. Here, the constant phase element, Q, with an n value close to unity, is considered as a double-layer capacitor, which also confirms that the outer layer has some pores.
The presence of a Cdl represents another indication of the ability of V to increase the passivity of the alloy in the test SBF solution. Immersing the Ti-base alloys in the SBF solutions for 48 h decreases the obtained real and imaginary resistance, as shown in Figure 7. The data listed in Table 2 also indicate that prolonging the time of exposure increases the resistance for all alloys. The collected results for EIS agree with the CPP data, and both indicated that the increase of V concentration in the Ti-base alloy and prolonging the immersion time from 1 to 48 h increases the corrosion resistance for all tested alloys in the SBF solution.

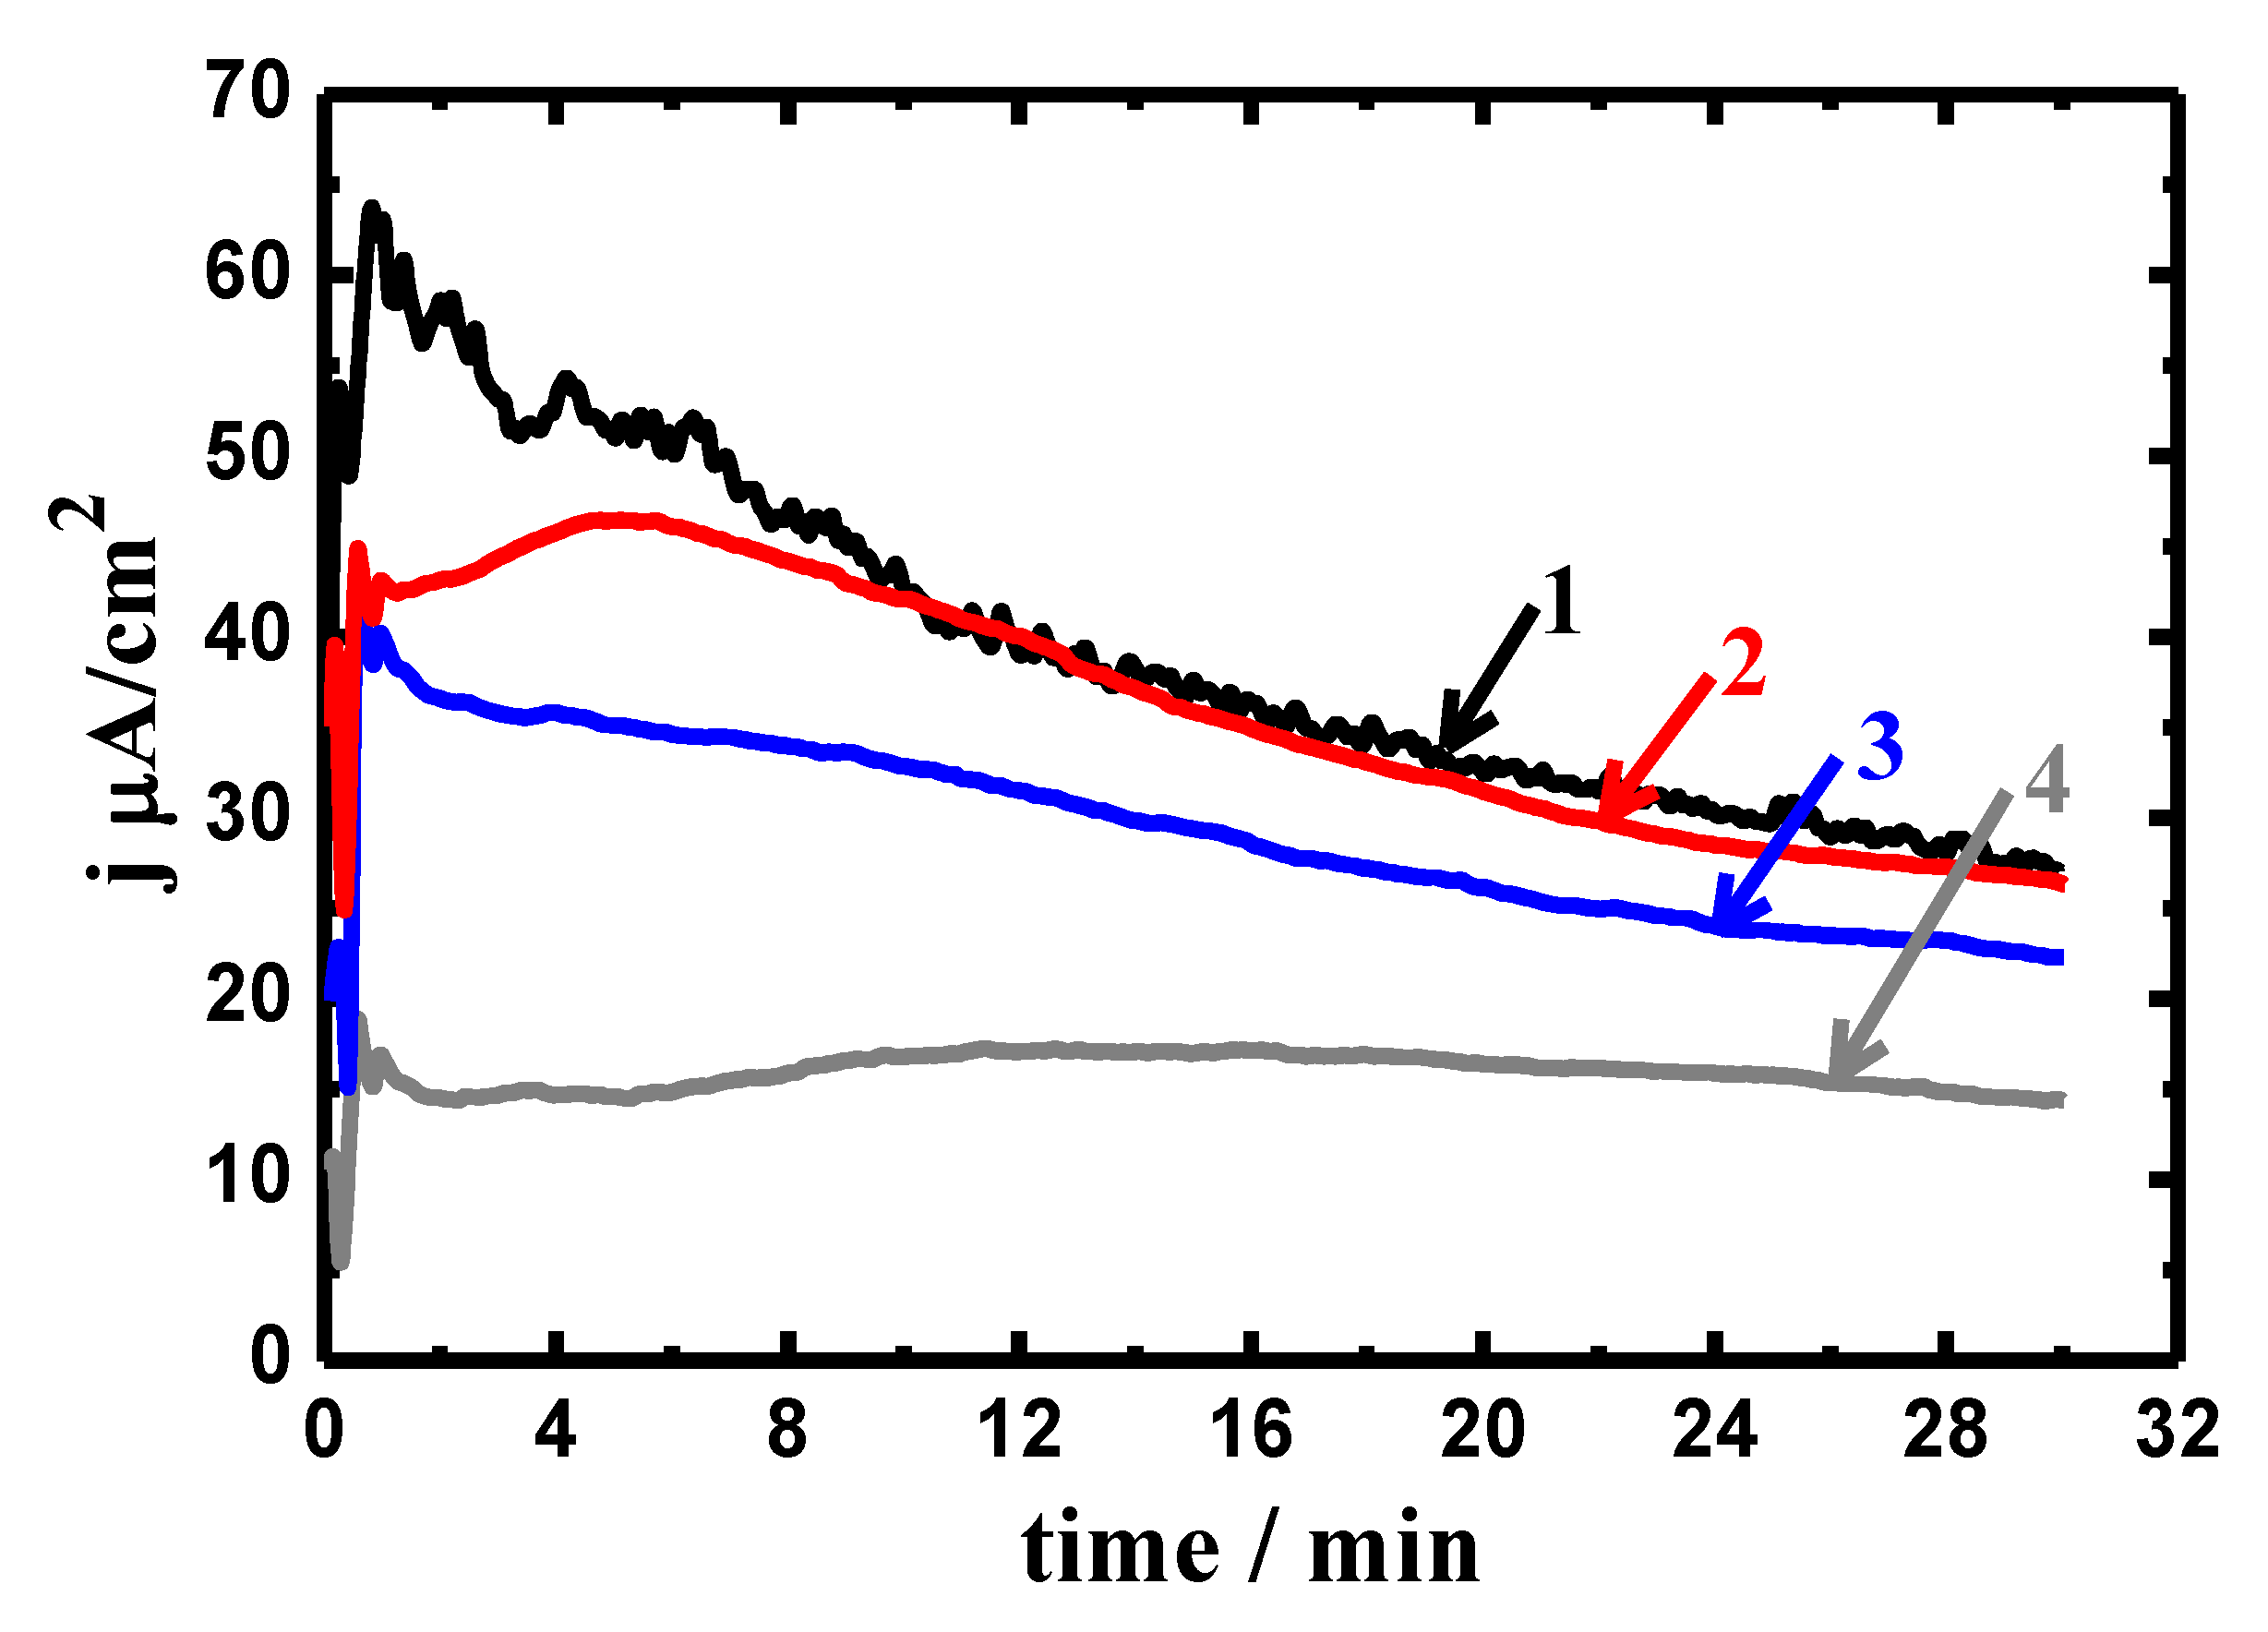
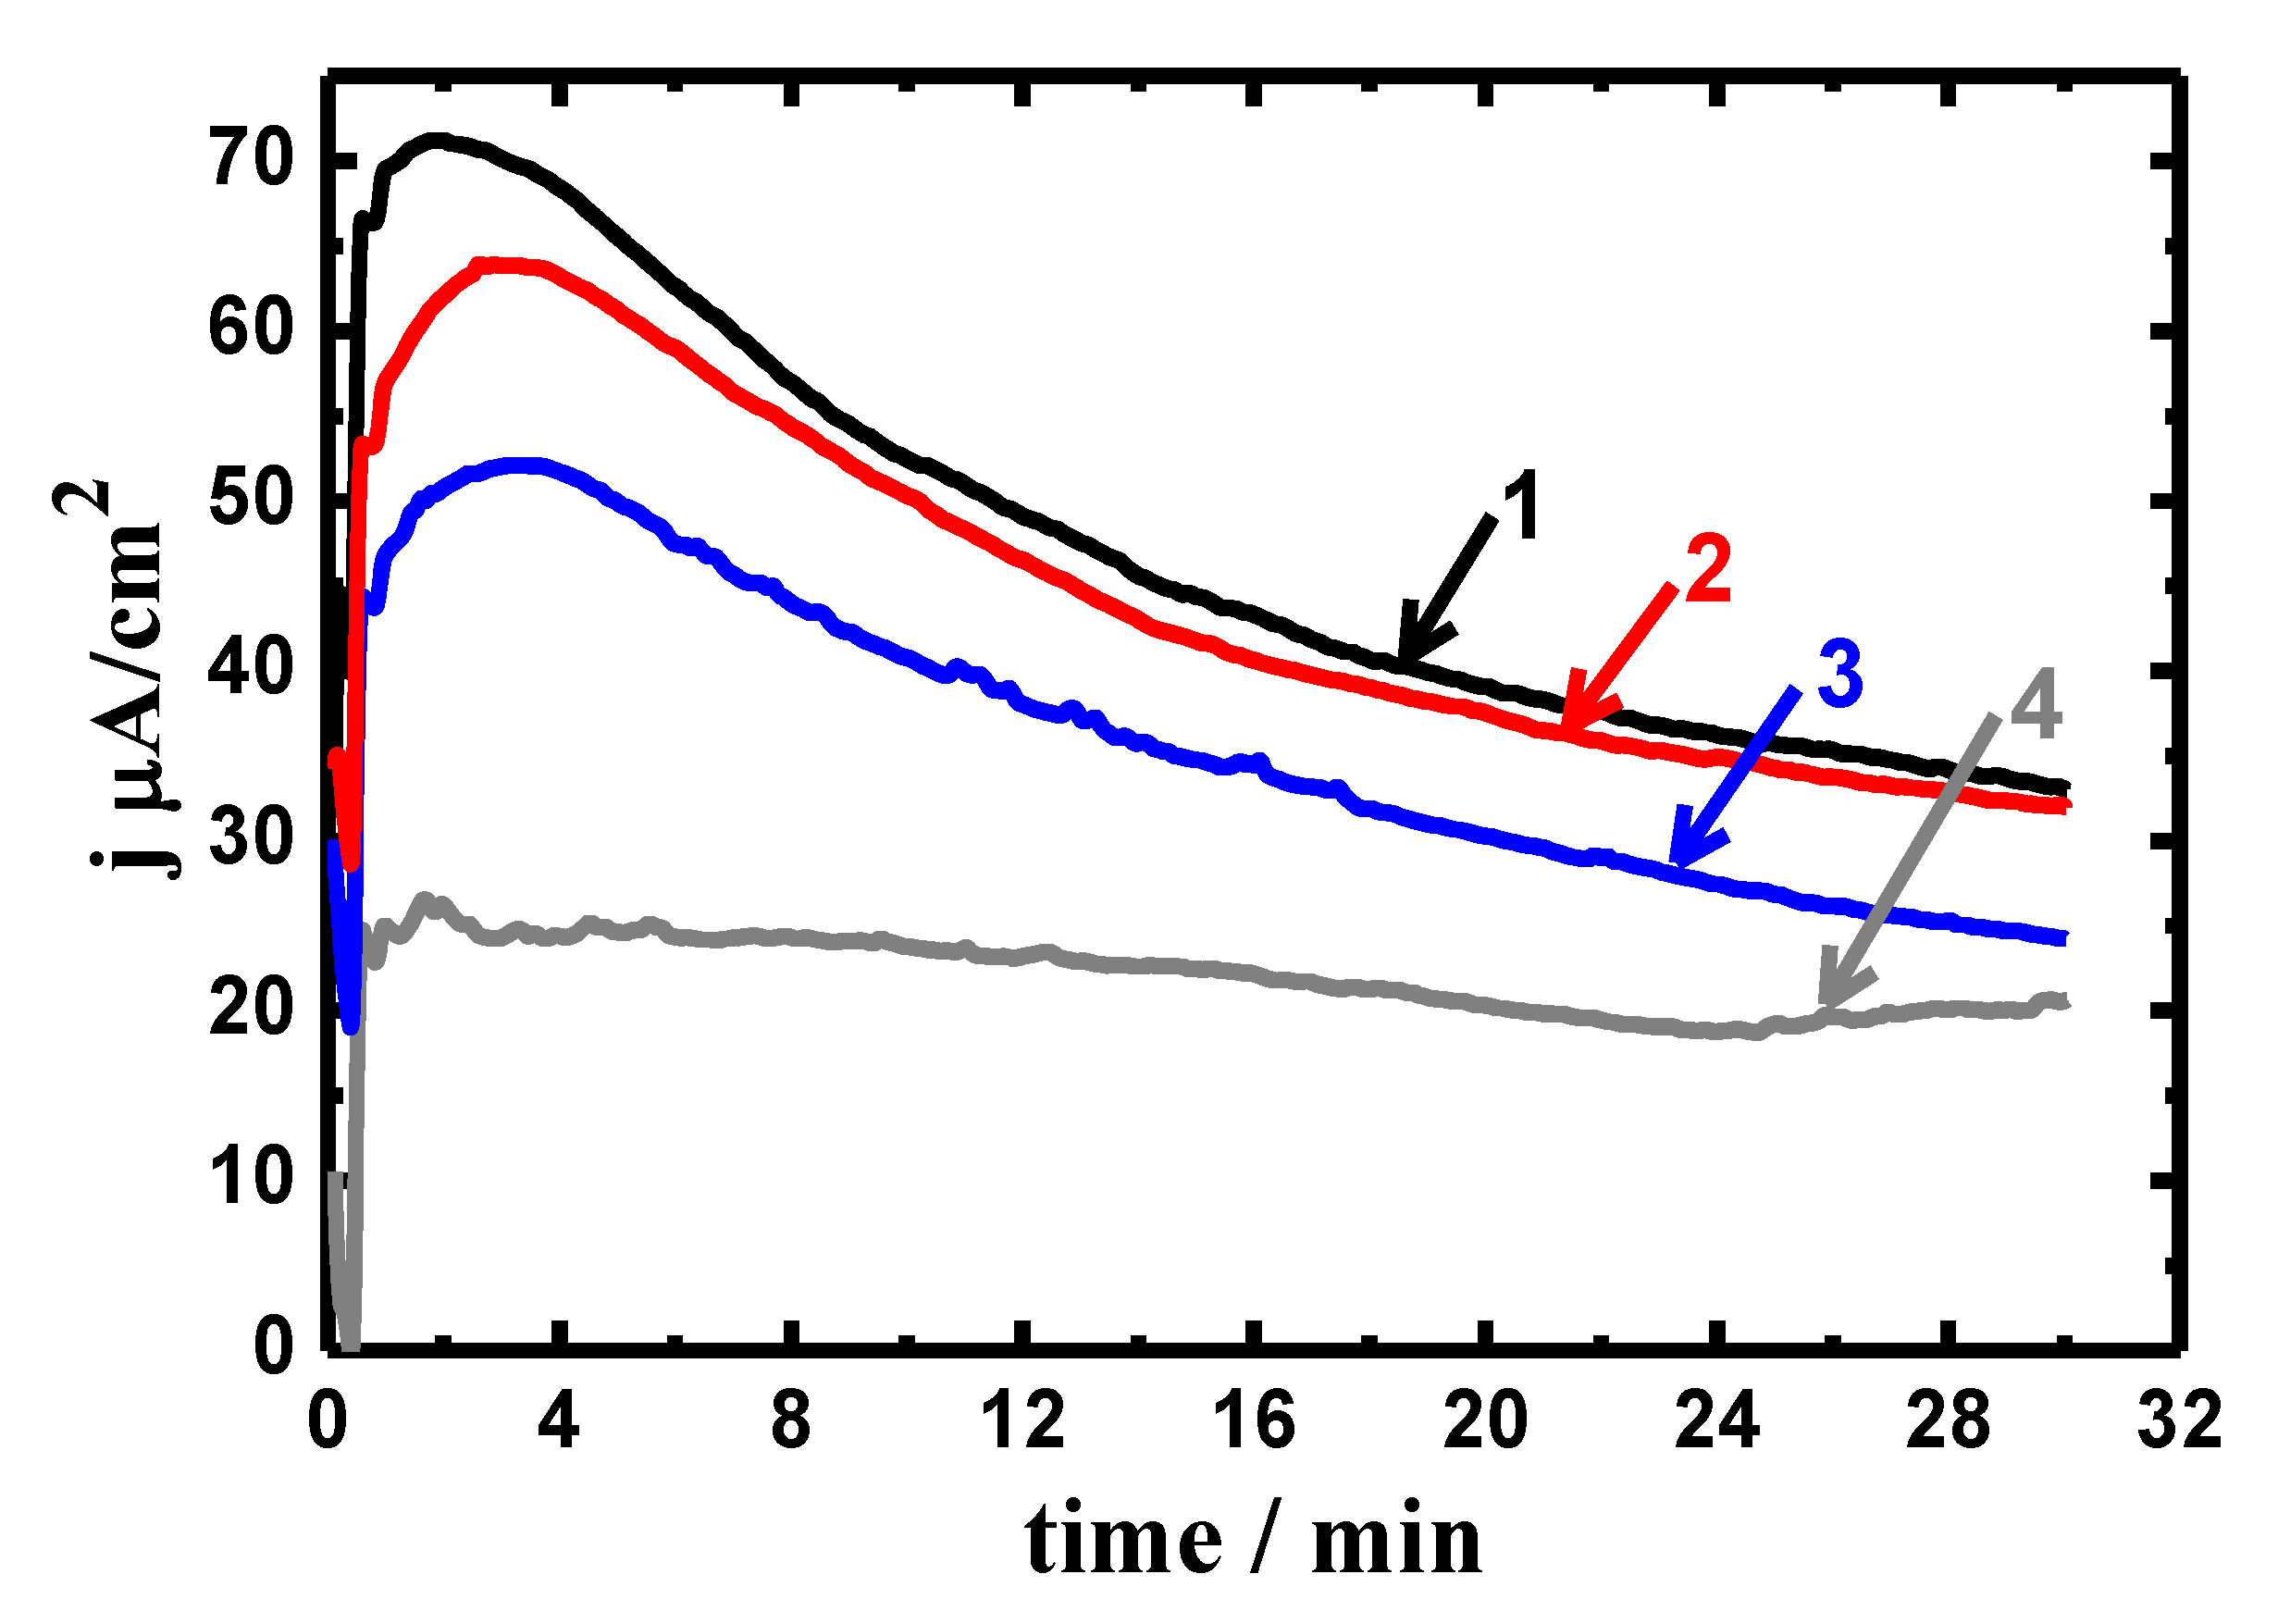
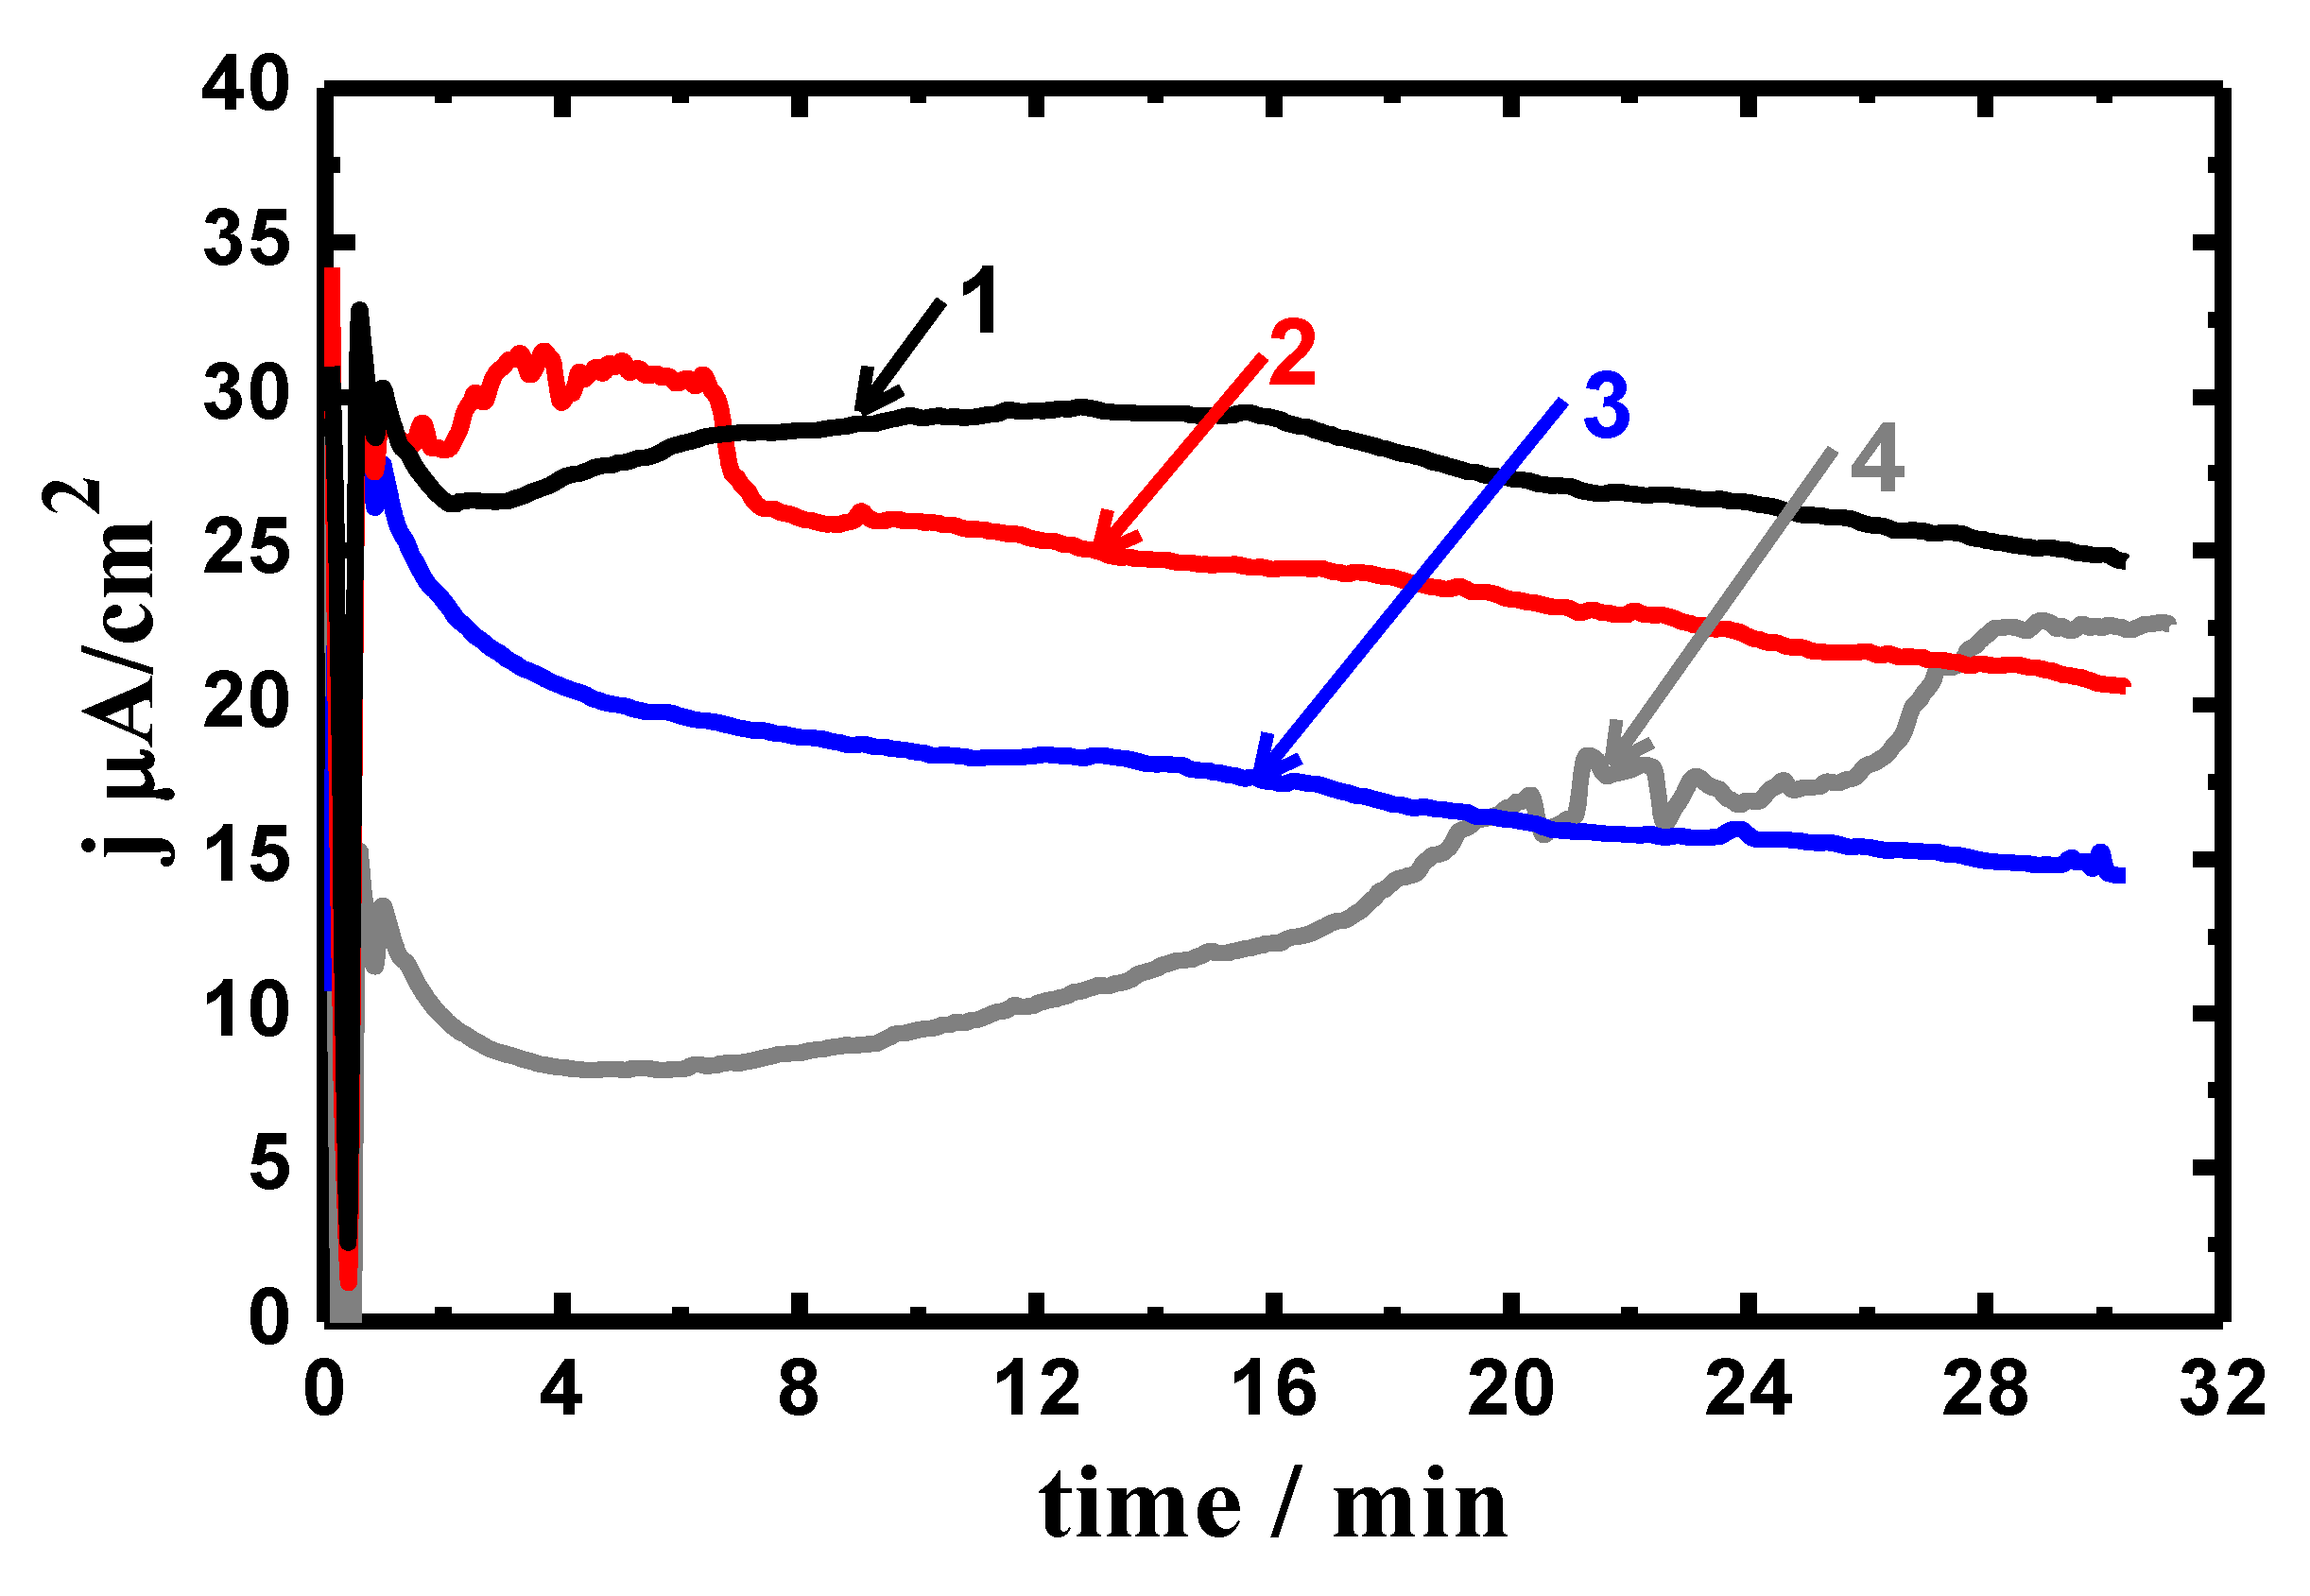
3.4. Chronoamperometry

Change of the chronoamperometric (potentiostatic) current with time (CCT) at constant potential experiments were performed to understand the role of V content on the uniform and pitting corrosion of the Ti alloy in the SBF solution after 1, 24, and 48 h exposure periods. Figure 9 shows the CCT curves obtained at 0.50 V (Ag/AgCl) for all alloys after 1 h immersion in SBF, respectively. The CCT measurements were also performed after 24 and 48 h, and the curves are depicted in Figure 10 and Figure 11, respectively. Figure 9 depicts that the current increases upon the application of the positive potential value, 500 mV, as a result of the dissolution of a surface oxide film. The current then decreases gradually after the first few minutes up to the end of the run as a result of oxide film thickening. The highest absolute current values were recorded for Ti-6Al-2V. The current obtained from this alloy also showed some fluctuations indicating that it had the highest rate of uniform corrosion with the possible occurrence of a pitting attack. Increasing the content of V from 2 to 4%, i.e., 6% and 8%, decreased the value of the obtained current with time with no indications of the occurrence of pitting corrosion. This revealed that the increase of V% decreased the corrosion of the titanium alloy and eliminated the occurrence of a pitting attack.
After 24 h immersion (Figure 10), almost similar behavior to the curves obtained after 1 h immersion (Figure 9) is shown. The disappearance of the fluctuations in the current values obtained for the Ti-6Al-2V alloy was the only difference. The increase of the exposure period to 24 h also proved that the increase of V content decreased the collected current values, and no pitting corrosion occurred. Further increasing the exposure time to 48 h before measurement (Figure 11) showed the same trend but with lower current values for all alloys. The decrease in the obtained values of current with increasing time may have resulted from the high corrosion resistance of the alloys’ surface due to the oxide film thickening, which took place due to the long immersion periods in the SBF solution. The CCT results confirmed the data obtained by the CPP and EIS that the corrosion resistance of the fabricated alloys increased with the increase of V content, i.e., Ti-6Al-8V > Ti-6Al-6V > Ti-6Al-4V > Ti-6Al-2V alloy.

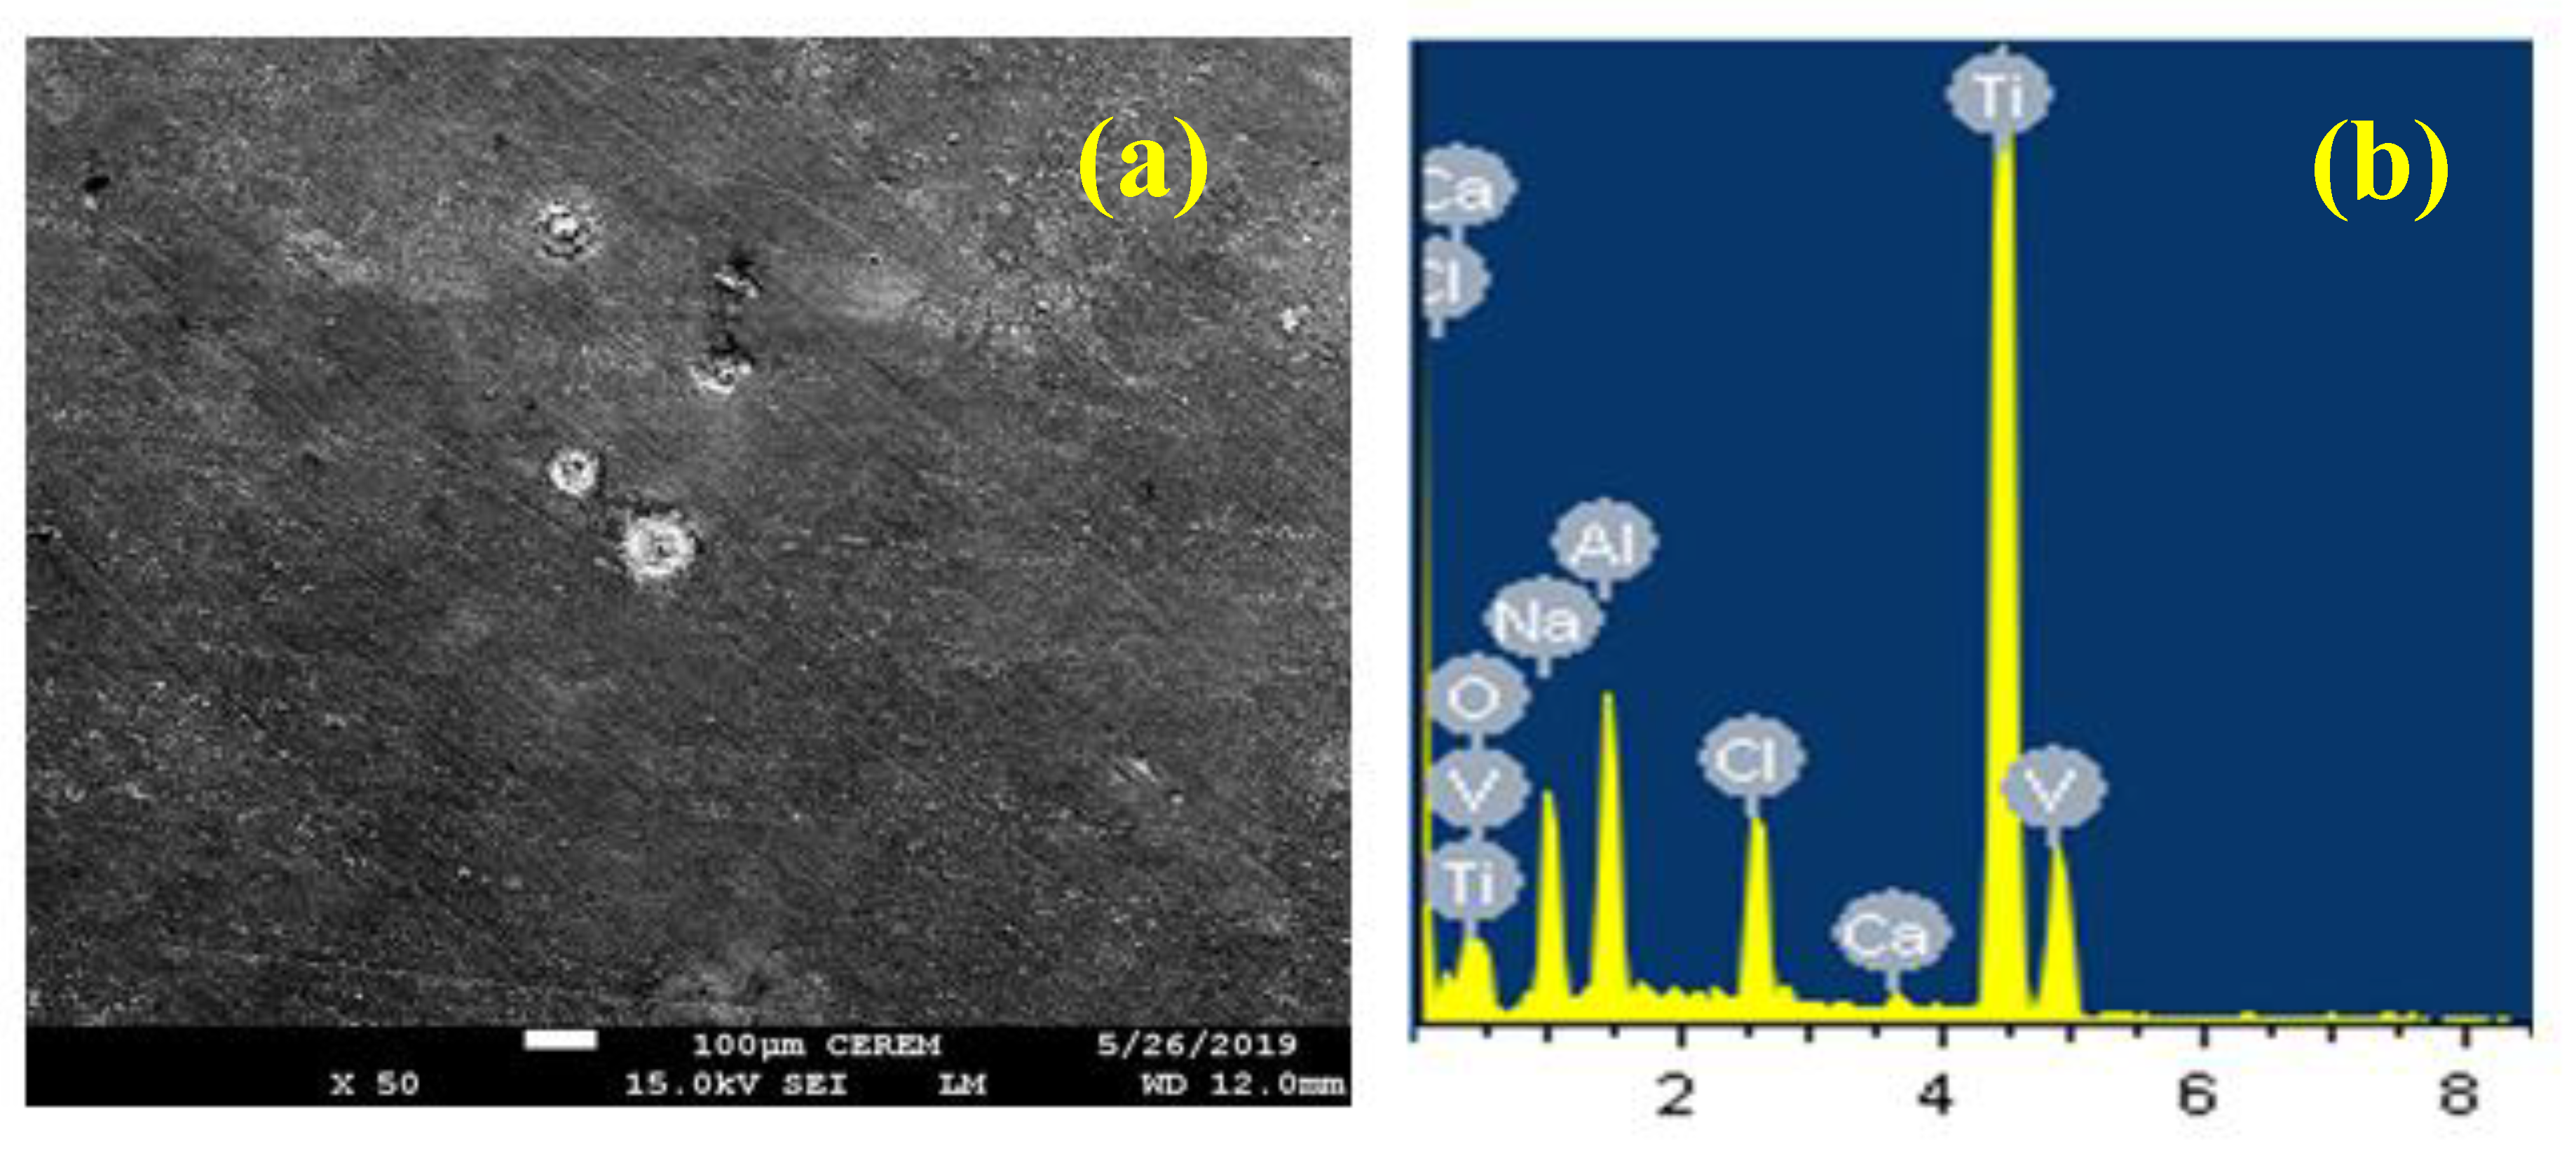
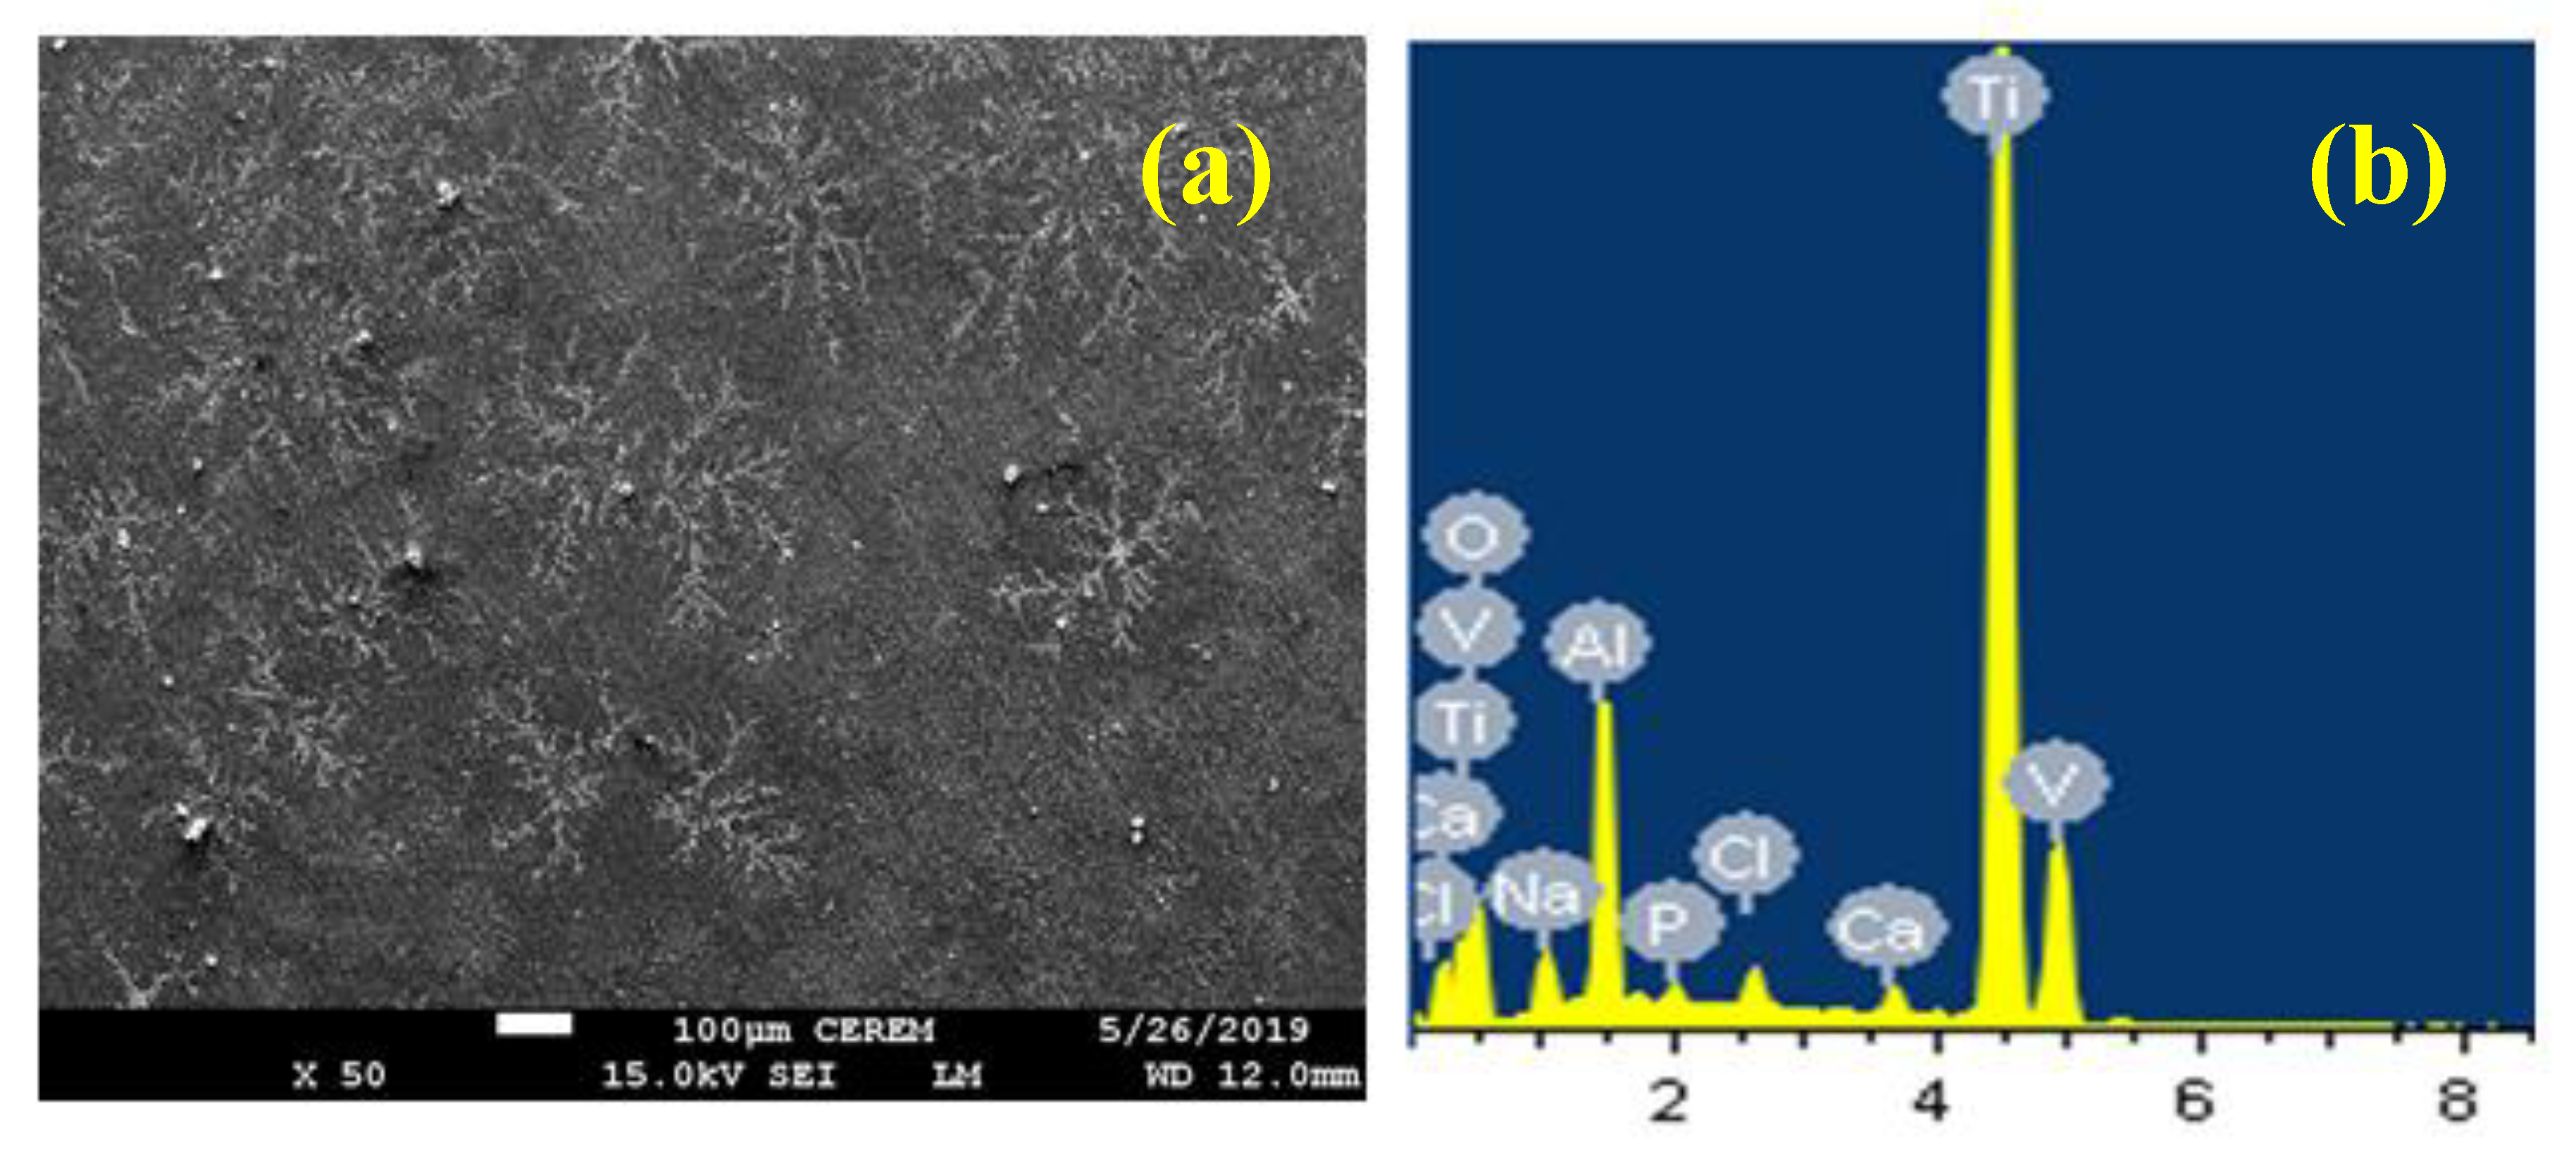
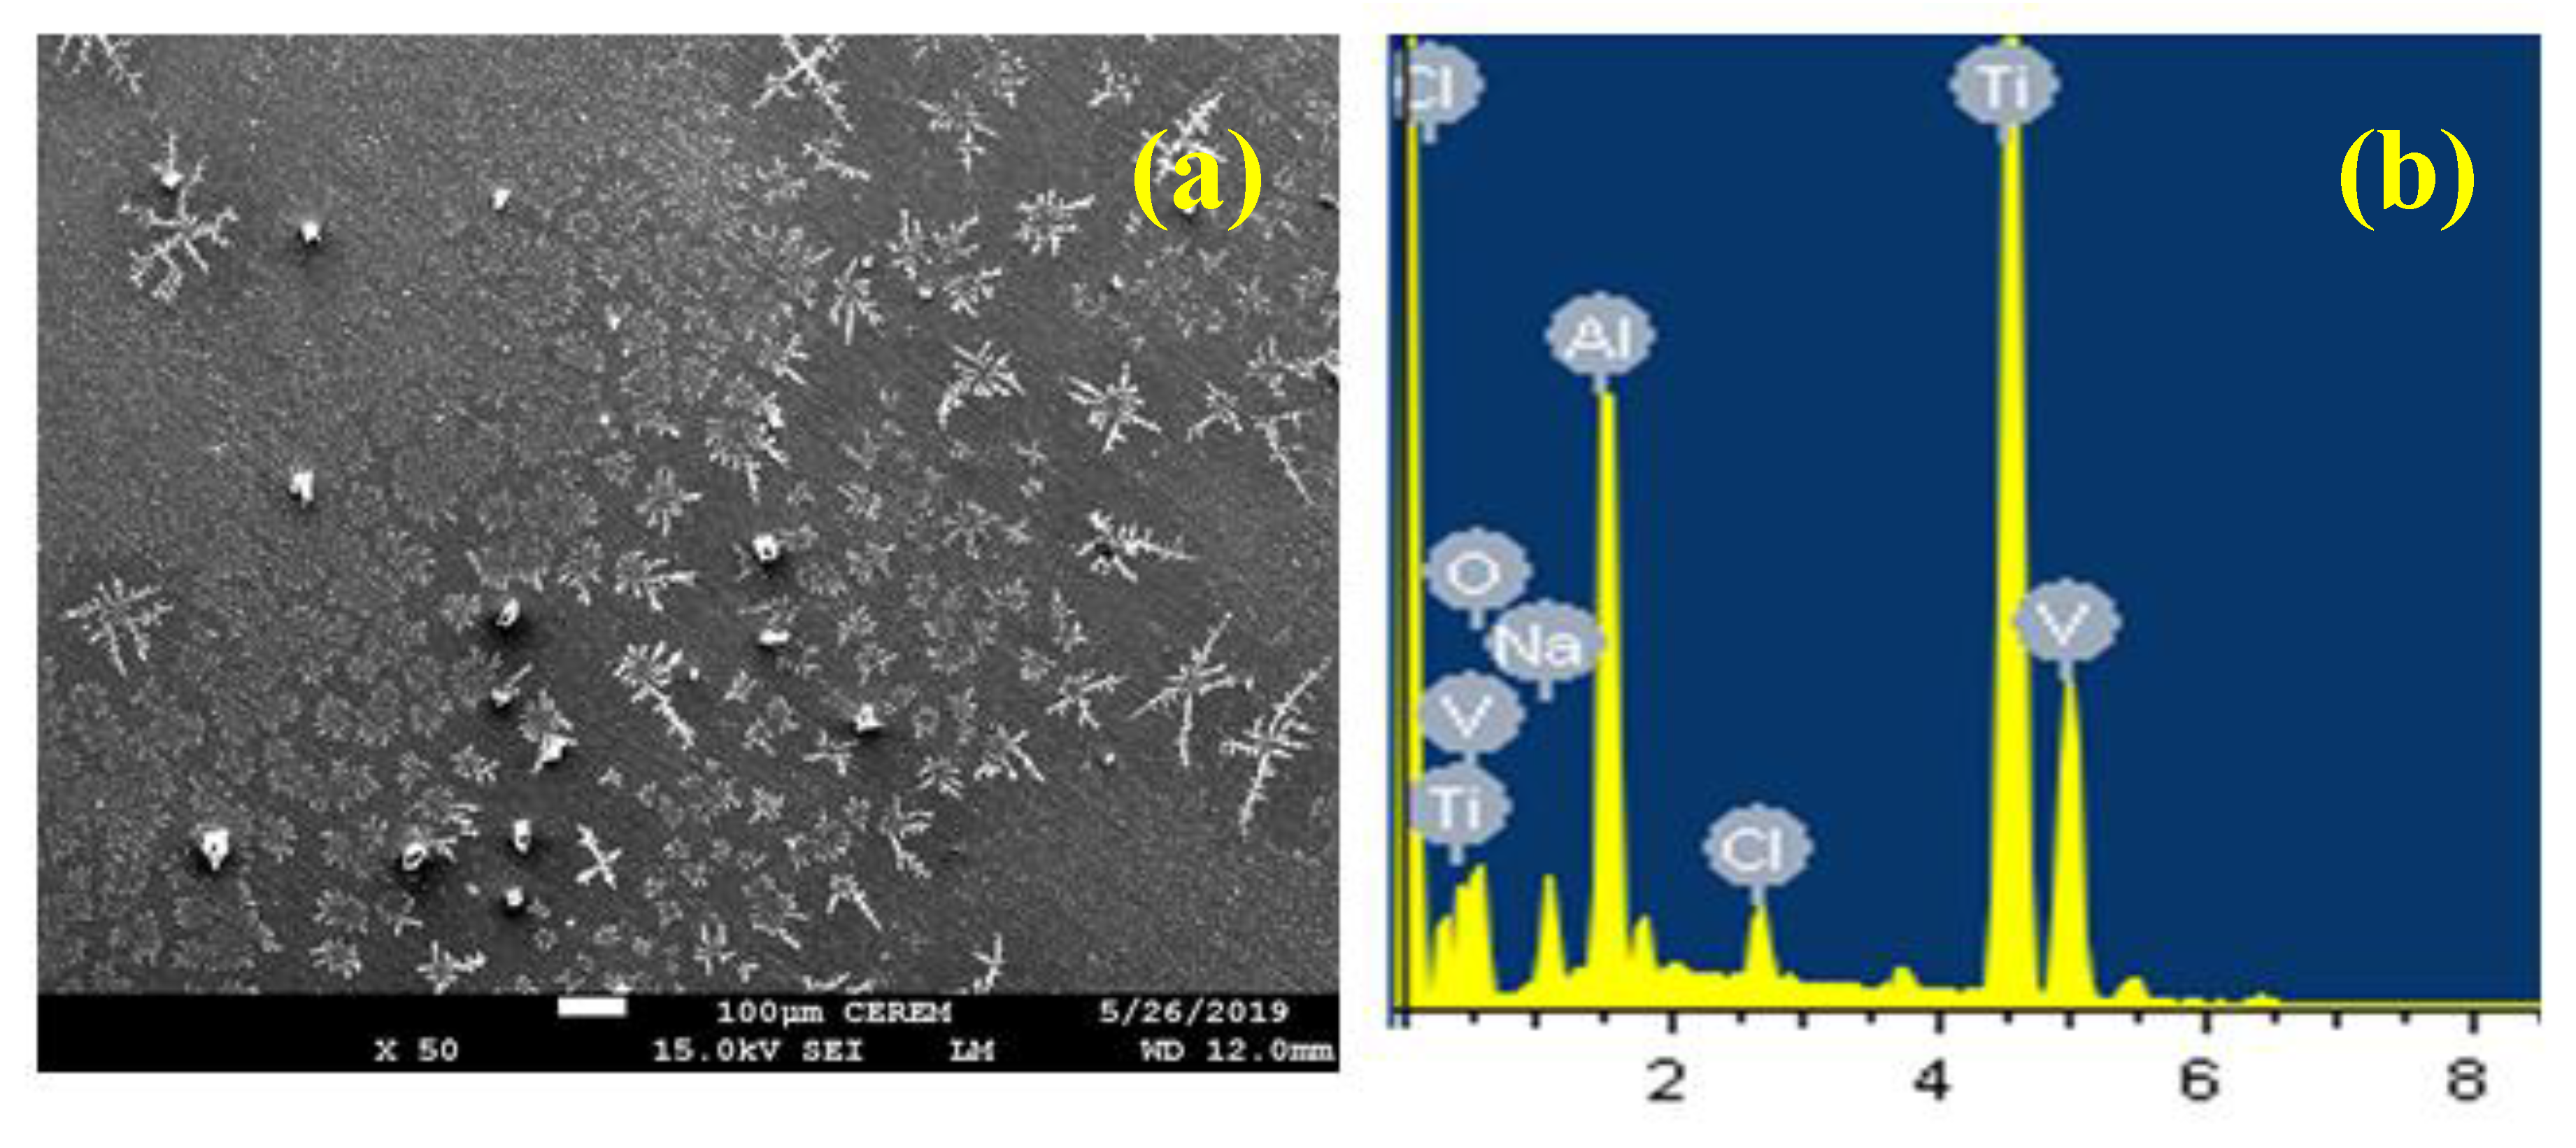
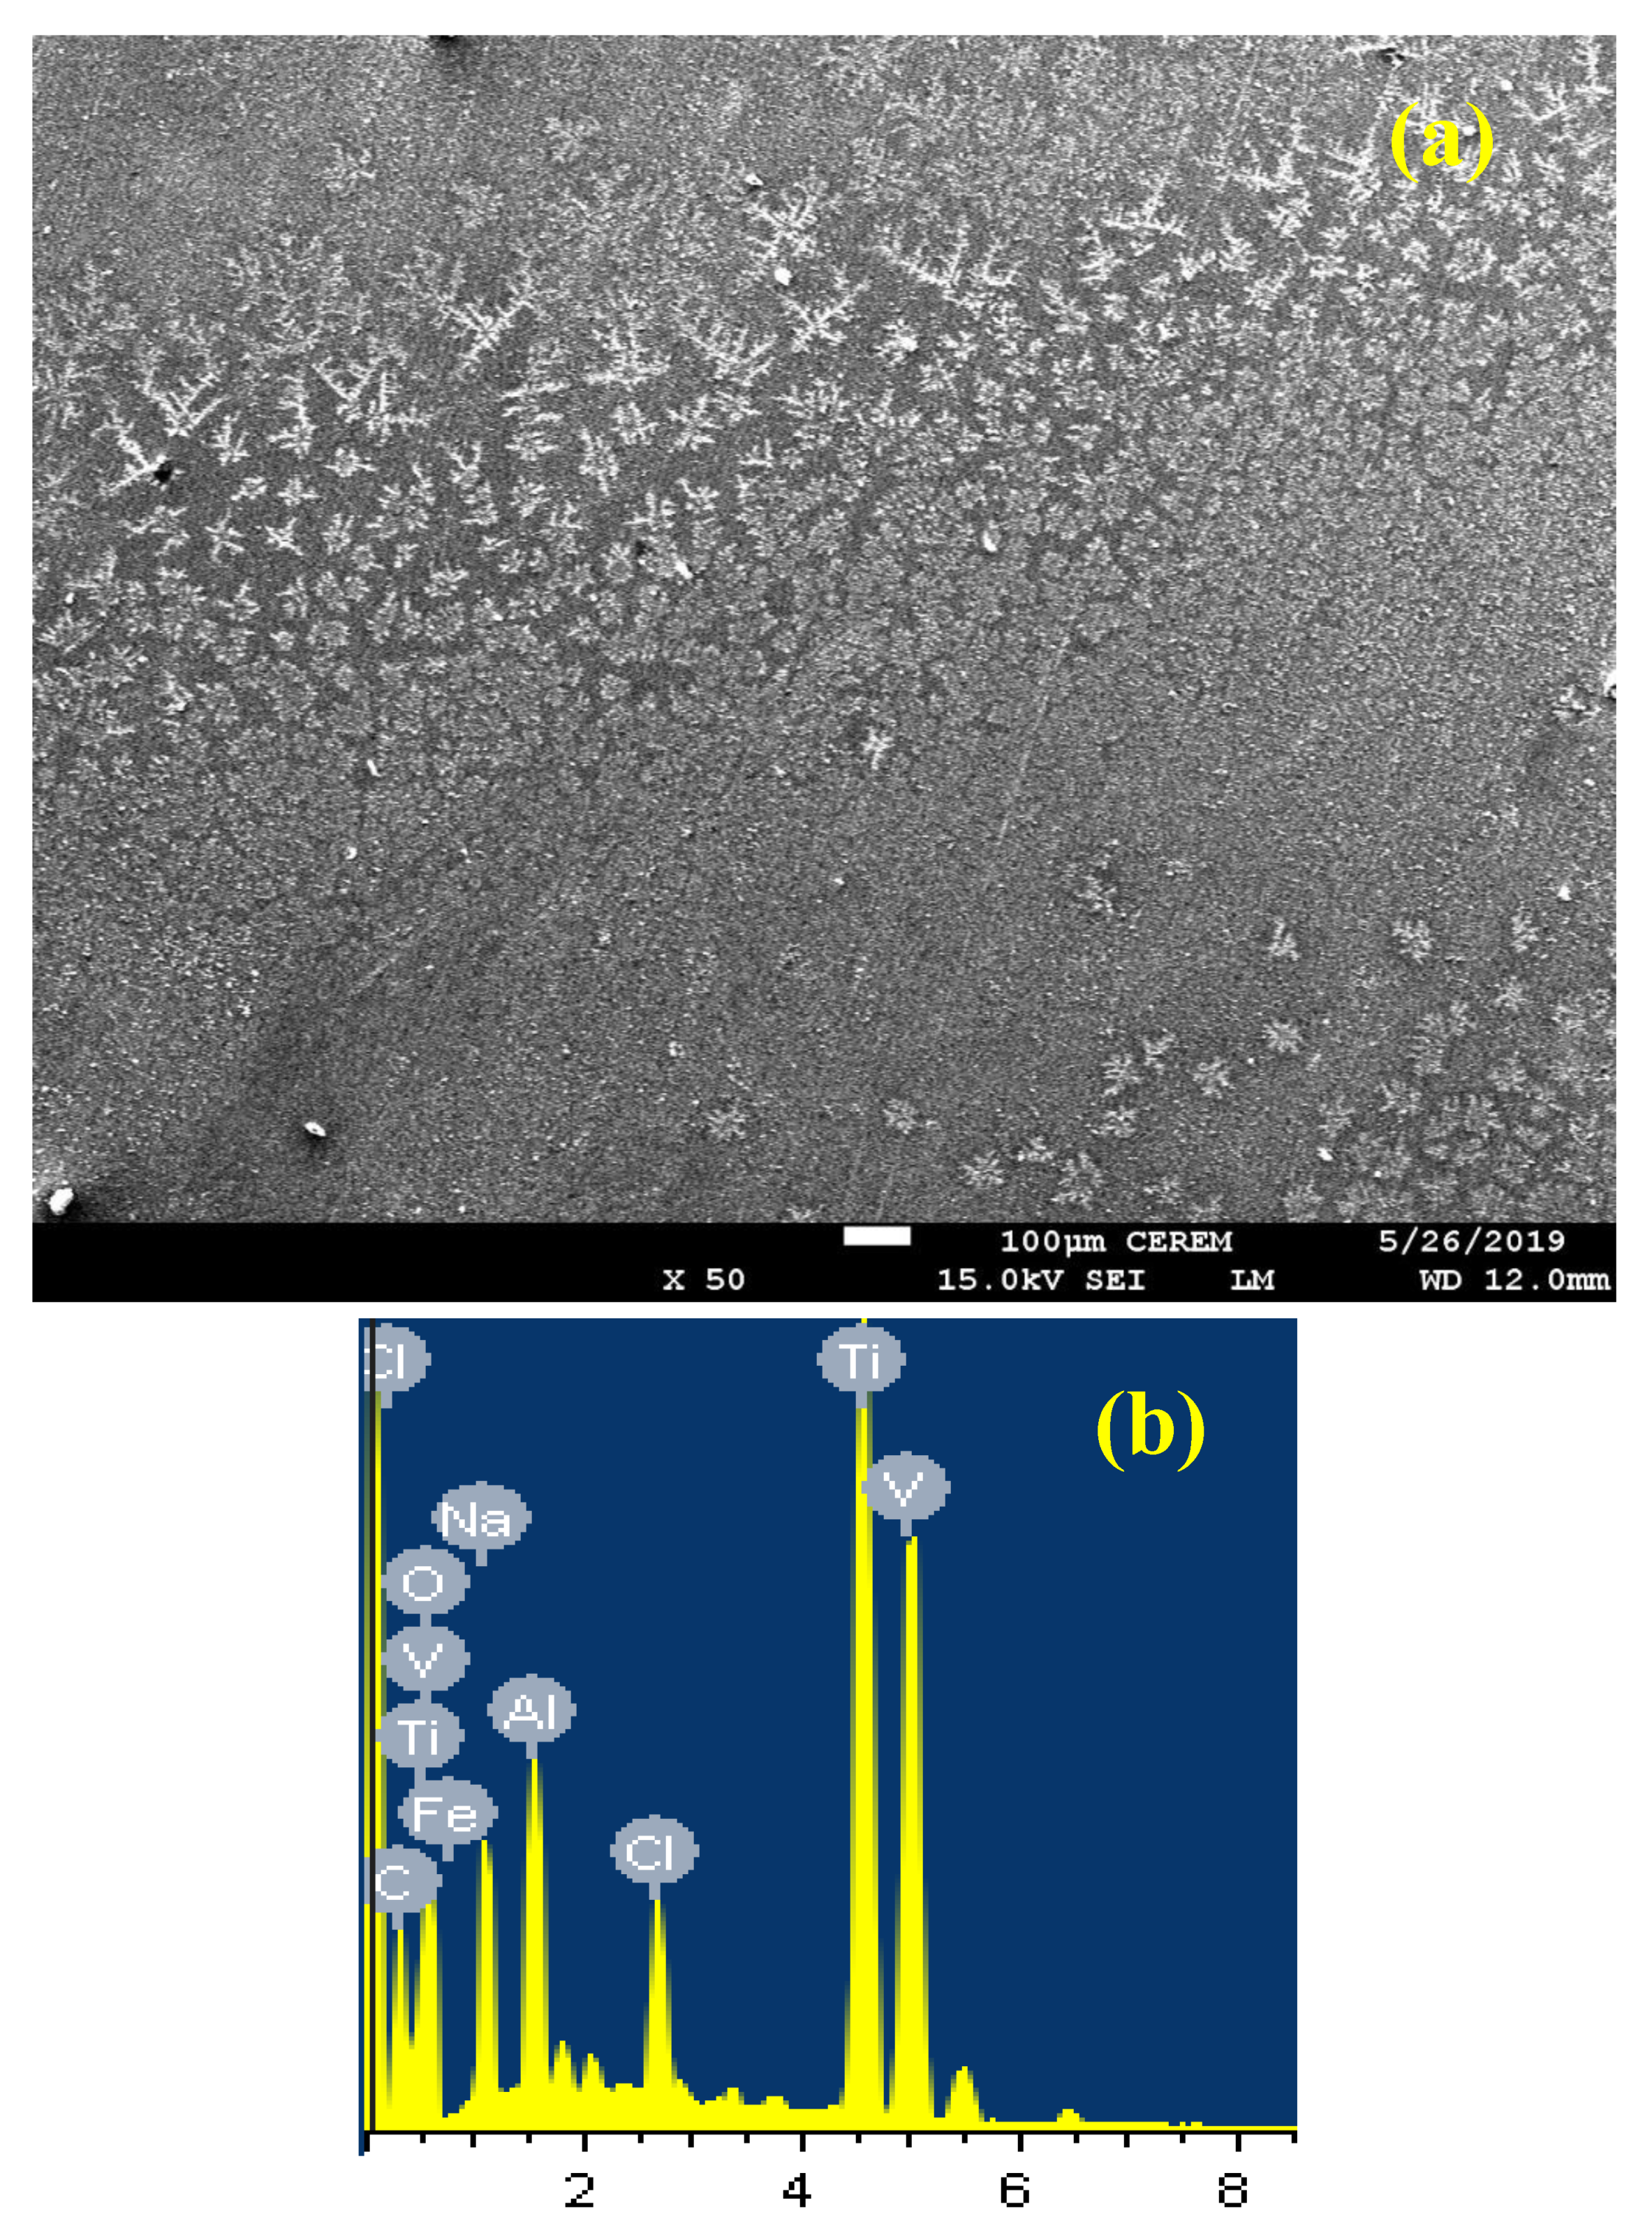
3.5. Surface Examinations

The surface examinations were performed using a scanning electron microscope (SEM). The elemental analysis was obtained using an energy dispersive X-ray (EDX) analyzer unit after all alloys were exposed to corrosion conditions in the SBF solutions. Figure 12 shows the (a) SEM micrograph and (b) EDX profile analysis obtained for the Ti-6Al-2V alloy after 48 h immersion in SBF solution before stepping the potential to 500 mV (Ag/AgCl) for 30 min. SEM micrographs and EDX profile analyses were also collected for Ti-6Al-4V, Ti-6Al-6V, and Ti-6Al-8V alloys, as shown in Figure 13, Figure 14, and Figure 15, respectively.
The SEM micrograph depicted in Figure 12 for Ti-6Al-2V alloy exhibits a smooth surface that has a homogeneously distributed thin corrosion product layer with few shallow pits that are clearly formed. The pitting corrosion may occur due to the presence of some corrosive species. That is, anions such as Cl, HCO3, SO42−, among others, and cations such as Na+, Mg2+, Ca2+, among others, within the SBF solution [50]. The weight percentages (wt.%) obtained for the elements detected by EDX analysis (Figure 12b) were Ti = 62.10%, O = 14.30%%, Al = 6.91%, V = 3.45%, Na = 7.03%, and Cl = 5.70%. The presence of Ti was lower than expected due to the formation of a corrosion product layer on the alloy surface. Moreover, the presence of a high percentage of O that indicated the presence of some oxides, possibly Al2O3, TiO2, and V2O5. These oxides are protective and decrease the corrosion of the alloy in SBF solution. Moreover, the presence of Na and Cl reveals that the white color seen on the surface of the alloy might have resulted from the deposition of NaCl salt that was already present in the SBF test solution. The formation of few pits can now be confirmed via the attack of the chloride ions (Cl) that is present in the SBF solution on the alloy surface under the application of 500 mV (Ag/AgCl) for 30 min. Since Al is the most active metal in the alloy, the dissolved aluminum cations (Al3+, see reaction 4) react with the present Cl to form aluminum chloride, AlCl4, as follows;
Al3+ + 4Cl = AlCl4
It has been reported [41,42,43,44,51,52] that the Cl ions are chemically adsorbed onto the oxide film formed on the alloy without entering it. Hence, the Cl ions cause a breakdown and dissolution of the oxide film leading to the production of an oxychloride complex, Al(OH)2Cl2, as per the following reaction;
2Al3+ + 2Cl + 2OH = Al(OH)2Cl2
Figure 13 shows the SEM/EDX taken for the Ti-6Al-4V alloy at the aforementioned conditions. The surface is covered with a layer of corrosion products that has some flower shapes on top of it. The image also shows that the surface of the alloy has no pits, which means that applying 500 mV (Ag/AgCl) for 30 min after 48 h immersion in the SBF solution could not cause any flawed regions in the formed layer on the surface. Compared to the Ti-6Al-2V alloy, the surface of the Ti-6Al-4V alloy was more passivated due to the increase of V content. The wt.% of the elements found on the surface (Figure 13b) were as follows: Ti = 62.70%, O = 19.98%%, Al = 6.31%, V = 4.50%, Na = 2.82%, Cl = 2.23%, and less than 1% for both P and Ca. The percentages of both V and O increased compared to their detected percentages on the surface of the Ti-6Al-2V alloy, which indicated a higher possibility of oxide film formation. Moreover, the percentage of the deposited NaCl was lower than the percentages of Na and Cl that were detected in lower amounts.
Figure 14 represents the SEM/EDX investigations obtained for the Ti-6Al-6V alloy, where a surface layer of corrosion products had some flower shapes distributed on it. The surface also shows no pitting corrosion was found. The increase of V content to 6% improved the corrosion of the alloy against both uniform and pitting attacks. EDX profile analysis gave the following wt.% for the elements found on the surface: Ti = 59.26%, O = 17.67%, Al = 9.99%, V = 8.24%, Na = 2.95%, and Cl = 1.95%. The wt.% for Ti was much lower than its original % in the alloy due to the surface coverage with corrosion products. Additionally, Al and V were in higher wt.% than its initial contents, which indicated that the surface was rich with Al and V. The presence of a high amount of O also revealed that the oxides of both Al and V were formed on the surface causing its high passivation compared to the alloys with lower V content.
The SEM image and EDX profile obtained for the Ti-6Al-8V alloy (Figure 15) also exhibited a thin corrosion product layer that was homogeneously distributed but with no indications of the formation of any pits. The formed layer on the surface had some flower-shaped areas, and these flowers were formed from the reaction between the alloy surface and the SBF solution. The elements detected by EDX analysis were collected as follows: Ti = 52.19%, O = 19.03%, Al = 8.32%, V = 9.68%, C = 1.17%, Na = 5.16%, and Cl = 4.45%. The presence of Ti with this percentage was very low compared to its original presence of 86%, which meant that the chemical composition of the surface of the alloy was completely different from the composition of the alloy itself. This was due to the formation of a corrosion product layer mainly composed of oxides like Al2O3, TiO2, and V2O5, which are protective. The current surface (SEM/EDX) analyses are in good agreement with the results obtained by the electrochemical measurements. All measurements confirmed that the increase of V content in the alloys played an important role in the passivation of the Ti-6Al-V alloys. Moreover, the increase of exposure periods from 1 to 48 h increased the corrosion resistance. This resulted from the formation and thickening of Al2O3, TiO2, and V2O5 on the surface of the tested alloys with increasing time.

4. Conclusions

The manufacturing of Ti-6Al-2V, Ti-6Al-4V, Ti-6Al-6V, and Ti-6Al-8V alloys was carried out using the MA method. Characterization of these alloys was performed using XRD analysis, SEM, and EDX surface investigations. The effects of increased V additions on the corrosion in SBF solutions after 1, 24, and 48 h exposure using CPP, EIS, and CCT measurements were investigated at room temperature. CPP results indicated that the increase of V content decreased the corrosion of these alloys through decreasing the values of jCorr and RCorr and increasing the values of RP. EIS experiments proved that the increase of V additions increases the corrosion resistance by increasing the values of RS and RP. The measurements obtained by CCT indicated that the uniform corrosion decreases with the increase of V percentage, and pitting corrosion takes place only for Ti-6Al-2V, when applying a more positive potential value, 500 mV vs. Ag/AgCl for 30 min. All results also confirmed that prolonging the exposure time in SBF solutions before measurement decreases the corrosion for all manufactured alloys. SEM and EDX analyses were in accordance with the electrochemical results, and they proved that the corrosion products formed on the surfaces were a mixture of oxides, most probably Al2O3, TiO2, and V2O5.

Author Contributions

Conceptualization, E.-S.M.S., S.A.R. and H.S.A.; methodology, E.-S.M.S., S.A.R. and H.S.A.; validation, E.-S.M.S., S.A.R. and H.S.A.; formal analysis, E.-S.M.S., S.A.R. and H.S.A.; investigation, E.-S.M.S., S.A.R. and H.S.A.; resources, E.-S.M.S.; data curation, E.-S.M.S., S.A.R. and H.S.A.; writing—original draft rreparation, E.-S.M.S.; writing—review and editing, E.-S.M.S.; visualization, E.-S.M.S., S.A.R. and H.S.A.; supervision, E.-S.M.S.; project administration, E.-S.M.S.; funding acquisition, E.-S.M.S. All authors have read and agreed to the published version of the manuscript.

Funding

The authors would like to extend their sincere appreciation to the Deanship of Scientific Research at King Saud University for funding this research through the Research Group Project No. RGP-160.

Conflicts of Interest

The authors declare no conflict of interest.

References

  1. Zhang, H.; Kou, H.; Yang, J.; Huang, D.; Nan, H.; Li, J. Microstructure evolution and tensile properties of Ti-6.5Al-2Zr-Mo-V alloy processed with thermo hydrogen treatment. Mater. Sci. Eng. A 2014, 619, 274–280. [Google Scholar] [CrossRef]
  2. Simka, W.; Sadkowski, A.; Warczak, M.; Iwaniak, A.; Dercz, G.; Michalska, J.; MacIej, A. Characterization of passive films formed on titanium during anodic oxidation. Electrochim. Acta 2011, 56, 8962–8968. [Google Scholar] [CrossRef]
  3. Pang, J.; Blackwood, D.J. Corrosion of titanium alloys in high temperature near anaerobic seawater. Corros. Sci. 2016, 105, 17–24. [Google Scholar] [CrossRef]
  4. Zhang, L.C.; Attar, H. Selective Laser Melting of Titanium Alloys and Titanium Matrix Composites for Biomedical Applications: A Review. Adv. Eng. Mater. 2016, 18, 463–475. [Google Scholar] [CrossRef]
  5. AlOtaibi, A.; Sherif, E.S.M.; Zinelis, S.; Al Jabbari, Y.S. Corrosion behavior of two cp titanium dental implants connected by cobalt chromium metal superstructure in artificial saliva and the influence of immersion time. Int. J. Electrochem. Sci. 2016, 11, 5877–5890. [Google Scholar] [CrossRef]
  6. Koizumi, H.; Takeuchi, Y.; Imai, H.; Kawai, T.; Yoneyama, T. Application of titanium and titanium alloys to fixed dental prostheses. J. Prosthodont. Res. 2019, 63, 266–270. [Google Scholar] [CrossRef]
  7. Sakaguchi, N.; Mitsuo, N.; Akahori, T.; Saito, T.; Furuta, T. Effects of alloying elements on elastic modulus of Ti-Nb-Ta-Zr system alloy for biomedical applications. Mater. Sci. Forum 2004, 449–452, 1269–1272. [Google Scholar] [CrossRef]
  8. He, G.; Hagiwara, M. Ti alloy design strategy for biomedical applications. Mater. Sci. Eng. C 2006, 26, 14–19. [Google Scholar] [CrossRef]
  9. Yu, S.Y.; Scully, J.R. Corrosion and Passivity of Ti-13% Nb-13% Zr in Comparison to Other Biomedical Implant Alloys. Corrosion 1997, 15, 965–976. [Google Scholar] [CrossRef]
  10. Ho, W.F. Effect of omega phase on mechanical properties of Ti-Mo alloys for biomedical applications. J. Med. Biol. Eng. 2008, 28, 47–51. [Google Scholar]
  11. Hussein, A.H.; Gepreel, M.A.H.; Gouda, M.K.; Hefnawy, A.M.; Kandil, S.H. Biocompatibility of new Ti-Nb-Ta base alloys. Mater. Sci. Eng. C 2016, 61, 574–578. [Google Scholar] [CrossRef] [PubMed]
  12. Khalil, K.A.; Sherif, E.S.M.; Nabawy, A.M.; Abdo, H.S.; Marzouk, W.W.; Alharbi, H.F. Titanium carbide nanofibers-reinforced aluminum compacts, a new strategy to enhance mechanical properties. Materials 2016, 9, 399. [Google Scholar] [CrossRef] [PubMed]
  13. da Silva, L.L.G.; Ueda, M.; Silva, M.M.; Codaro, E.N. Corrosion behavior of Ti-6Al-4V alloy treated by plasma immersion ion implantation process. Surf. Coat. Technol. 2007, 201, 8136–8139. [Google Scholar] [CrossRef]
  14. Ahn, H.; Lee, D.; Lee, K.M.; Lee, K.; Baek, D.; Park, S.W. Oxidation behavior and corrosion resistance of Ti-10Ta-10Nb alloy. Surf. Coat. Technol. 2008, 202, 5784–5789. [Google Scholar] [CrossRef]
  15. Erinosho, M.F.; Akinlabi, E.T.; Pityana, S. Microstructure and Corrosion Behaviour of Laser Metal Deposited Ti6Al4V/Cu Composites in 3.5% Sea Water. Mater. Today Proc. 2015, 2, 1166–1174. [Google Scholar] [CrossRef]
  16. Niinomi, M. Recent metallic materials for biomedical applications. Metall. Mater. Trans. A 2002, 33, 477. [Google Scholar] [CrossRef]
  17. Bangera, M.; D’Costa, V. Titanium and its alloys: Properties and applications for use as an oral biomaterial: A review. J. Res. Dent. 2015, 3, 592–599. [Google Scholar] [CrossRef] [Green Version]
  18. Hrabe, N.; Quinn, T. Effects of processing on microstructure and mechanical properties of a titanium alloy (Ti-6Al-4V) fabricated using electron beam melting (EBM), part 1: Distance from build plate and part size. Mater. Sci. Eng. A 2013, 573, 264–270. [Google Scholar] [CrossRef]
  19. Hrabe, N.; Quinn, T. Effects of processing on microstructure and mechanical properties of a titanium alloy (Ti-6Al-4V) fabricated using electron beam melting (EBM), part 2: Energy input, orientation, and location. Mater. Sci. Eng. A 2013, 573, 271–277. [Google Scholar] [CrossRef]
  20. Mogoda, A.S.; Ahmad, Y.H.; Badawy, W.A. Corrosion behaviour of Ti-6Al-4V alloy in concentrated hydrochloric and sulphuric acids. J. Appl. Electrochem. 2004, 34, 873–878. [Google Scholar] [CrossRef]
  21. Geetha, M.; Singh, A.K.; Asokamani, R.; Gogia, A.K. Ti based biomaterials, the ultimate choice for orthopaedic implants - A review. Prog. Mater. Sci. 2009, 54, 397–425. [Google Scholar] [CrossRef]
  22. Beck, T.R. Pitting of Titanium: I. Titanium-Foil Experiments. J. Electrochem. Soc. 1973, 120, 1310–1316. [Google Scholar] [CrossRef]
  23. Kelly, J. Anodic Dissolution and Passivation of Titanium in Acidic Media: III. Chloride Solutions Eugene. J. Electrochem. Soc. 1979, 126, 2064–2075. [Google Scholar] [CrossRef]
  24. Riskin, I.V.; Torshin, V.B.; Skuratnik, Y.B.; Dembrovsky, M.A. Corrosion of Titanium by Cathodic Currents in Chloride Solutions. Corrosion 1984, 40, 266–271. [Google Scholar] [CrossRef]
  25. McKay, P.; Mitton, D.B. An Electrochemical Investigation of Localized Corrosion on Titanium in Chloride Environments. Corrosion 1985, 41, 52–62. [Google Scholar] [CrossRef]
  26. Patriona, M.M.; Müller, I.L. An electrochemical study of the crevice corrosion of titanium. J. Braz. Chem. Soc. 1997, 8, 137–142. [Google Scholar] [CrossRef] [Green Version]
  27. Long, M.; Rack, H.J. Titanium alloys in total joint replacement—A materials science perspective. Biomaterials 1998, 19, 1621–1639. [Google Scholar] [CrossRef]
  28. Leyens, C.; Peters, M. (Eds.) Titanium and Titanium Alloys; Wiley-VCH: Weinheim, Germany, 2004. [Google Scholar]
  29. Liu, X.; Chu, P.K.; Ding, C. Surface modification of titanium, titanium alloys, and related materials for biomedical applications. Mater. Sci. Eng. R 2004, 47, 49–121. [Google Scholar] [CrossRef] [Green Version]
  30. Vera, M.L.; Linardi, E.; Lanzani, L.; Mendez, C.; Schvezov, C.E.; Ares, A.E. Corrosion resistance of titanium dioxide anodic coatings on Ti-6Al-4V. Mater. Corros. 2015, 66, 1140–1149. [Google Scholar] [CrossRef]
  31. Vera, M.L.; Ares, A.E.; Rosenberger, M.R.; Lamas, D.G.; Schvezov, C.E. Determination using X-ray reflectometry of the TiO2 coating’s thickness obtained by anodic oxidation. An. AFA 2009, 21, 174–178. [Google Scholar] [CrossRef]
  32. Velten, D.; Biehl, V.; Aubertin, F.; Valeske, B.; Possart, W.; Breme, J. Preparation of TiO2 layers on cp-Ti and Ti6Al4V by thermal and anodic oxidation and by sol-gel coating techniques and their characterization. J. Biomed. Mater. Res. 2002, 59, 18–28. [Google Scholar] [CrossRef] [PubMed]
  33. Diamanti, M.V.; Pedeferri, M.P. Effect of anodic oxidation parameters on the titanium oxides formation. Corros. Sci. 2007, 49, 939–948. [Google Scholar] [CrossRef]
  34. Chapala, P.; Sunil Kumar, P.; Joardar, J.; Bhandari, V.; Acharyya, S.G. Effect of alloying elements on the microstructure, coefficient of friction, in-vitro corrosion and antibacterial nature of selected Ti-Nb alloys. Appl. Surf. Sci. 2019, 469, 617–623. [Google Scholar] [CrossRef]
  35. Afzali, P.; Ghomashchi, R.; Oskouei, R.H. On the corrosion Behaviour of low modulus titanium alloys for medical implant applications: A review. Metals 2019, 9, 878. [Google Scholar] [CrossRef] [Green Version]
  36. Sherif, E.S.M.; Abdo, H.S.; Alharthi, N.H. Beneficial Effects of Vanadium Additions on the Corrosion of Ti6AlxV Alloys in Chloride Solutions. Metals 2020, 10, 264. [Google Scholar] [CrossRef] [Green Version]
  37. Sherif, E.S.M. Effects of exposure time on the anodic dissolution of Monel-400 in aerated stagnant sodium chloride solutions. J. Solid State Electrochem. 2012, 16, 891–899. [Google Scholar] [CrossRef]
  38. Latief, F.H.; Sherif, E.S.M.; Almajid, A.A.; Junaedi, H. Fabrication of exfoliated graphite nanoplatelets-reinforced aluminum composites and evaluating their mechanical properties and corrosion behavior. J. Anal. Appl. Pyrolysis 2011, 92, 485–492. [Google Scholar] [CrossRef]
  39. Alharthi, N.; Sherif, E.S.M.; Abdo, H.S.; El Abedin, S.Z. Effect of Nickel Content on the Corrosion Resistance of Iron-Nickel Alloys in Concentrated Hydrochloric Acid Pickling Solutions. Adv. Mater. Sci. Eng. 2017, 1893672, 1–8. [Google Scholar] [CrossRef] [Green Version]
  40. Sherif, E.S.M.; Potgieter, J.H.; Comins, J.D.; Cornish, L.; Olubambi, P.A.; Machio, C.N. The beneficial effect of ruthenium additions on the passivation of duplex stainless steel corrosion in sodium chloride solutions. Corros. Sci. 2009, 51, 1364–1371. [Google Scholar] [CrossRef]
  41. Badawy, W.A.; Al-Kharafi, F.M.; El-Azab, A.S. Electrochemical behaviour and corrosion inhibition of Al, Al-6061 and Al-Cu in neutral aqueous solutions. Corros. Sci. 1999, 41, 709–727. [Google Scholar] [CrossRef]
  42. Sherif, E.M.; Park, S.M. Effects of 1,4-naphthoquinone on aluminum corrosion in 0.50 M sodium chloride solutions. Electrochim. Acta 2006, 51, 1313–1321. [Google Scholar] [CrossRef]
  43. Mazhar, A.A.; Badawy, W.A.; Abou-Romia, M.M. Impedance studies of corrosion resistance of aluminium in chloride media. Surf. Coat. Technol. 1986, 29, 335–345. [Google Scholar] [CrossRef]
  44. Tomcsányi, L.; Varga, K.; Bartik, I.; Horányi, H.; Maleczki, E. Electrochemical study of the pitting corrosion of aluminium and its alloys-II. Study of the interaction of chloride ions with a passive film on aluminium and initiation of pitting corrosion. Electrochim. Acta 1989, 34, 855–859. [Google Scholar] [CrossRef]
  45. Rinner, M.; Gerlach, J.; Ensinger, W. Formation of titanium oxide films on titanium and Ti6A14V by O2-plasma immersion ion implantation. Surf. Coat. Technol. 2000, 132, 111–116. [Google Scholar] [CrossRef]
  46. Butt, A.; Hamlekhan, A.; Patel, S.; Royhman, D.; Sukotjo, C.; Mathew, M.T.; Shokuhfar, T.; Takoudis, C. A novel investigation of the formation of titanium oxide nanotubes on thermally formed oxide of Ti-6Al-4V. J. Oral Implantol. 2015, 41, 523–531. [Google Scholar] [CrossRef]
  47. Diamanti, M.V.; Bolzoni, F.; Ormellese, M.; Pérez-Rosales, E.A.; Pedeferri, M.P. Characterisation of titanium oxide films by potentiodynamic polarisation and electrochemical impedance spectroscopy. Corros. Eng. Sci. Technol. 2010, 45, 428–434. [Google Scholar] [CrossRef]
  48. Zhang, Z.; Chen, S.; Li, Y.; Li, S.; Wang, L. A study of the inhibition of iron corrosion by imidazole and its derivatives self-assembled films. Corros. Sci. 2009, 51, 291–300. [Google Scholar] [CrossRef]
  49. Orazem, M.E.; Tribollet, B. Electrochemical Impedance Spectroscopy, 1st ed.; John Wiley & Sons: Hoboken, NJ, USA, 2008. [Google Scholar]
  50. Oyane, A.; Kim, H.M.; Furuya, T.; Kokubo, T.; Miyazaki, T.; Nakamura, T. Preparation and assessment of revised simulated body fluids. J. Biomed. Mater. Res. A 2003, 65, 188–195. [Google Scholar] [CrossRef]
  51. Wall, F.D.; Martinez, M.A.; Vandenavyle, J.J. Relationship between induction time for pitting and pitting potential for high-purity aluminum. J. Electrochem. Soc. 2004, 151, 354–358. [Google Scholar] [CrossRef]
  52. Diggle, J.W.; Downie, T.C.; Goulding, C.W. The dissolution of porous oxide films on aluminium. Electrochim. Acta 1970, 15, 1079–1093. [Google Scholar] [CrossRef]
Figure 1. XRD (X-ray diffraction) patterns collected for the fabricated, (a) Ti-6Al-2V, (b) Ti-6Al-4V, (c) Ti-6Al-6V, and (d) Ti-6Al-8V alloys, respectively.
Metals 10 00903 g001aMetals 10 00903 g001b
Figure 2. CPP (cyclic potentiodynamic polarization) curves obtained for (a) Ti-6Al-2V, (b) Ti-6Al-4V, (c) Ti-6Al-6V, and (d) Ti-6Al-8V alloys after 1 h immersion in SBF, respectively.
Metals 10 00903 g002
Figure 3. CPP curves for (a) Ti-6Al-2V, (b) Ti-6Al-4V, (c) Ti-6Al-6V, and (d) Ti-6Al-8V alloys after 24 h immersion in SBF, respectively.
Metals 10 00903 g003
Figure 4. CPP curves for (a) Ti-6Al-2V, (b) Ti-6Al-4V, (c) Ti-6Al-6V, and (d) Ti-6Al-8V alloys after 48 h immersion in SBF, respectively.
Metals 10 00903 g004
Figure 5. Nyquist plots measured (symbols) and calculated (lines) for (a) Ti-6Al-2V, (b) Ti-6Al-4V, (c) Ti-6Al-6V, and (d) Ti-6Al-8V alloys after 1 h immersion in SBF, respectively.
Metals 10 00903 g005
Figure 6. Nyquist plots measured (symbols) and calculated (lines) for (a) Ti-6Al-2V, (b) Ti-6Al-4V, (c) Ti-6Al-6V, and (d) Ti-6Al-8V alloys after 24 h immersion in SBF, respectively.
Metals 10 00903 g006
Figure 7. Nyquist plots measured (symbols) and calculated (lines) for (a) Ti-6Al-2V, (b) Ti-6Al-4V, (c) Ti-6Al-6V, and (d) Ti-6Al-8V alloys after 48 h immersion in SBF, respectively.
Metals 10 00903 g007
Figure 8. The equivalent circuit model used to fit the impedance data presented in Figure 6, Figure 7, and Figure 8. The symbols of the circuit are defined in text, and its values are listed in Table 2.
Metals 10 00903 g008
Figure 9. CCT (chronoamperometric current with time) curves collected at 0.50 V (Ag/AgCl) for the (1) Ti-6Al-2V, (2) Ti-6Al-4V, (3) Ti-6Al-6V, and (4) Ti-6Al-8V alloys after 1 h immersion in SBF, respectively.
Metals 10 00903 g009
Figure 10. CCT curves collected at 0.50 V (Ag/AgCl) for the (1) Ti-6Al-2V, (2) Ti-6Al-4V, (3) Ti-6Al-6V, and (4) Ti-6Al-8V alloys after 24 h immersion in SBF, respectively.
Metals 10 00903 g010
Figure 11. CCT curves collected at 0.50 V (Ag/AgCl) for the (1) Ti-6Al-2V, (2) Ti-6Al-4V, (3) Ti-6Al-6V, and (4) Ti-6Al-8V alloys after 24 h immersion in SBF, respectively.
Metals 10 00903 g011
Figure 12. (a) SEM micrograph and (b) EDX profile analysis obtained for Ti-6Al-2V alloy after 48 h immersion in SBF solution before stepping the potential to 500 mV (Ag/AgCl) for 30 min.
Metals 10 00903 g012
Figure 13. (a) SEM micrograph and (b) EDX profile analysis obtained for the Ti-6Al-4V alloy after 48 h immersion in SBF solution before stepping the potential to 500 mV (Ag/AgCl) for 30 min.
Metals 10 00903 g013
Figure 14. (a) SEM micrograph and (b) EDX profile analysis obtained for Ti-6Al-6V alloy after 48 h immersion in SBF solution before stepping the potential to 500 mV (Ag/AgCl) for 30 min.
Metals 10 00903 g014
Figure 15. (a) SEM micrograph and (b) EDX profile analysis obtained for Ti-6Al-8V alloy after 48 h immersion in SBF solution before stepping the potential to 500 mV (Ag/AgCl) for 30 min.
Metals 10 00903 g015
Table 1. The data obtained from the polarization curves for the titanium alloys in SBF solution.
AlloyParameter
βc/ V/dec−1ECorr/Vβa/ V.dec−1jCorr/µA.cm2*Rp/kΩ.cm2**RCorr/ mpy
Ti-6%Al-2%V (1 h)0.105−0.7400.1200.4060.90.00348
Ti-6%Al-4%V (1 h)0.098−0.7150.1050.3563.00.00305
Ti-6%Al-6%V (1 h)0.092−0.7050.1080.2780.00.00235
Ti-6%Al-8%V (1 h)0.088−0.6900.1120.2393.20.00200
Ti-6%Al-2%V (24 h)0.112−0.4950.1050.2594.30.00217
Ti-6%Al-4%V (24 h)0.110−0.7750.1000.15153.40.00131
Ti-6%Al-6%V (24 h)0.100−0.4550.0950.13162.90.00113
Ti-6%Al-8%V (24 h)0.095−0.4450.1000.11192.60.00096
Ti-6%Al-2%V (48 h)0.115−0.4550.0900.13168.90.00113
Ti-6%Al-4%V (48 h)0.095−0.3750.1000.11192.60.00096
Ti-6%Al-6%V (48 h)0.088−0.3450.0950.10198.60.00087
Ti-6%Al-8%V (48 h)0.080−0.4380.0850.08224.00.00070
* R P = 1 j C o r r   ( β c . β a 2.3 ( β c + β a ) ) , ** R C o r r = j C o r r ( k . E W d . A ) . Where, k is a constant to define the unit for RCorr, k = 3272 mm (amp−1 cm−1 year−1), EW is the equivalent weight of the Ti alloy, EW = 12-gram equivalent, d is the density of the Ti alloy, d = 4.51 gm cm-3, and A is the area of the surface of the Ti alloy A = 1 cm2.
Table 2. Impedance data obtained for the tested titanium alloys in SBF test solutions.
AlloyImpedance data
RS/
Ω cm2
QRP1/
Ω cm2
Cdl/
μ Fcm2
RP2/
Ω cm2
chi/ Sq.
YQ/
μ Fcm2
n
Ti-6%Al-2%V (1 h)43.6 ± 20.113 ± 0.010.69 ± 0.023377 ± 170.481 ± 0.015830 ± 150.1095
Ti-6%Al-4%V (1 h)44.8 ± 20.132 ± 0.010.71 ± 0.025382 ± 200.438 ± 0.016300 ± 180.0509
Ti-6%Al-6%V (1 h)45.9 ± 20.099 ± 0.010.75 ± 0.025856 ± 220.332 ± 0.017150 ± 200.0846
Ti-6%Al-8%V (1 h)46.3 ± 20.093 ± 0.010.77 ± 0.026260 ± 180.194 ± 0.018610 ± 220.0758
Ti-6%Al-2%V (24 h)44.8 ± 30.054 ± 0.010.78 ± 0.026130 ± 200.079 ± 0.017320 ± 260.0787
Ti-6%Al-4%V (24 h)47.2 ± 30.053 ± 0.010.80 ± 0.027231 ± 220.063 ± 0.017607 ± 240.0715
Ti-6%Al-6%V (24 h)47.1 ± 30.052 ± 0.010.82 ± 0.027378 ± 250.076 ± 0.018140 ± 230.0828
Ti-6%Al-8%V (24 h)48.2 ± 30.051 ± 0.010.82 ± 0.028102 ± 280.057 ± 0.019320 ± 270.0965
Ti-6%Al-2%V (48 h)47.5 ± 40.049 ± 0.010.83 ± 0.025539 ± 220.051 ± 0.0111060 ± 250.1030
Ti-6%Al-4%V (48 h)50.4 ± 40.047 ± 0.010.84 ± 0.027603 ± 260.046 ± 0.0112080 ± 280.0694
Ti-6%Al-6%V (48 h)48.1 ± 40.046 ± 0.010.85 ± 0.0210147 ± 240.041 ± 0.0112590 ± 340.0829
Ti-6%Al-6%V (48 h)52.2 ± 40.042 ± 0.010.86 ± 0.0210602 ± 300.039 ± 0.0113070 ± 380.0709

