Article

Experimental Characterization and Deterministic Prediction of In-Plane Formability of 3rd Generation Advanced High Strength Steels

by
Jon Edward Gutierrez
*,
Jacqueline Noder
and
Clifford Butcher
Department of Mechanical and Mechatronics Engineering, University of Waterloo, Waterloo, ON N2L 3G1, Canada
*
Author to whom correspondence should be addressed.
Metals 2020, 10(7), 902; https://doi.org/10.3390/met10070902
Submission received: 31 May 2020 / Revised: 23 June 2020 / Accepted: 24 June 2020 / Published: 6 July 2020
(This article belongs to the Special Issue 10th Anniversary of Metals: Metallurgy and Metal Technology)

Abstract

:
The objective of the current study is to develop a practical, deterministic approach to the prediction of the in-plane formability of two third generation advanced high-strength steels (AHSS) of 980 and 1180 MPa ultimate tensile strength using only quasi-static mechanical property data. The hardening response to large strains was experimentally measured with the use of simple shear and tensile tests and validated in tensile simulations. The process-corrected limit strains in the Nakazima and Marciniak tests were compared to various analytical Forming Limit Curve (FLC) models for in-plane stretching. It was observed that the widely-used Marciniak–Kuczynski model can adequately predict the experimental FLC in biaxial stretching but significantly underestimated the limit strains in uniaxial stretching for both third generation AHSS. The observed through-thickness shear fracture mode in biaxial stretching was reasonably well-captured by the Bressan–Williams (BW) instability model for the 1180 MPa steel. A proposed extension of the BW model to uniaxial tension by adoption of the maximum in-plane shear stress criterion (BWx model) provided superior experimental correlation relative to the zero-extension model of Hill that was too conservative. Finally, a linearized version of the modified maximum force criterion (MMFC) was proposed that markedly improved the correlation with the process-corrected FLC for in-plane stretching of AHSS. The developed framework for FLC prediction was then applied to a DP980 AHSS and an AA5182 aluminum alloy from the literature. The DP980 corroborated the observed trend for the two third generation AHSS whereas the MK and the BWx models performed best for the AA5182 with its saturation-type hardening behavior and non-quadratic yield surface.

1. Introduction

The automotive industry has been aggressively pursuing the development and incorporation of new grades of advanced high strength steel (AHSS) for vehicle lightweighting and enhanced crash performance. A light weight of the vehicle structure is constrained by strength requirements for anti-intrusion into the cabin as well as the local ductility of the material for energy absorption. The replacement of conventional steels with advanced high strength steels (AHSS) can reduce component weight by reducing the thickness while increasing strength [1]. The recent development of the so-called third generation of AHSS provides significant improvements in formability compared to the first generation of AHSS [2] due to their complex microstructures and retained austenite that transforms to martensite during deformation [3]. The formability of a third generation 980 MPa steel can be comparable to a conventional 590 MPa or 780 MPa AHSS grade [4]. There are many variants of third generation steels in development such as Quench and Partitioned (Q&P), Medium-Manganese, Transformation-assisted bainite-ferrite (TBF) and there is a need to rapidly evaluate the formability of prototype AHSS grades from the mechanical property data using analytical models [5].
The past decade has seen great strides in the experimental characterization of sheet metal formability to generate a forming limit curve (FLC) of the limiting strains associated with strain localization. Strain measurement using circle grid analysis (CGA) has become obsolete for characterization of the FLC with digital image correlation (DIC) enabling the development of advanced, physically motivated detection methods [6,7]. However, the methodology used for analytical prediction of the FLC has somewhat lagged behind such that the theoretical framework is often inconsistent with the experiment data. Analytical formability models such as the MK model of Marciniak and Kuczynski [8] and the modified maximum force criterion (MMFC) proposed by Hora et al. [9] are based upon the assumption of frictionless, proportional in-plane stretching but are still commonly evaluated or calibrated with an FLC obtained using Nakazima tests [10]. Nakazima tests were first proposed by Nakazima and Kikuma [11] and use a hemispherical punch with a nominal diameter of 100 mm to deform a fully-clamped test blank out-of-plane. Ghosh and Hecker [12,13] demonstrated that the mechanics of out-of-plane deformation with a rigid punch unavoidably increase the limit strains compared to in-plane stretching. By limiting the sheet thickness to be no larger than 4 mm, the ISO12004-2 standard [14] assumes that deformation is approximately in-plane proportional loading and that the so-called process effects of curvature (bending), tool contact pressure, and a non-linear strain path introduced by the hemispherical punch can all be neglected.
In contrast to Nakazima tests, Marciniak [15] tests can provide in-plane stretching without friction under approximately proportional strain paths until necking. Marciniak tests employ a cylindrical punch along with a sacrificial “carrier blank” with a central hole that is placed between the punch and test blank. Deformation of the carrier blank and expansion of the hole then provides in-plane stretching of the blank in the central region of the punch. In general, Marciniak tests are significantly more complex to perform than Nakazima since the choice of punch profile radius, specimen width, carrier blank thickness, and hole size can all significantly affect the results. Failure of the carrier blank material or localization that occurs outside the region of the central hole in the carrier blank renders the test inadmissible. For practical considerations, Nakazima tests are commonly used to construct the FLC and the data used to calibrate or validate analytical formability models for in-plane proportional loading. This is a reasonable assumption given that prior to DIC when CGA was required to measure the limit strains, it was challenging to experimentally separate the differences between Marciniak and Nakazima data. The strain path cannot be measured with CGA such that the strain path must be assumed to be linear. Consequently, the simplicity of Nakazima tests led to their widespread adoption over Marciniak tests.
However, with high resolution stereo DIC strain measurement now readily available, Min et al. [16] demonstrated that the so-called process effects of bending (curvature), tool contact pressure and non-linear strain paths in Nakazima tests are non-trivial and substantially alter the FLC relative to the appropriate in-plane FLC obtained using Marciniak tests. Min et al. [16] demonstrated how DIC strain measurement can be used to quantify and remove these process effects in Marciniak and Nakazima tests of an MP980 steel. Butcher et al. [17] applied the experimental framework of Min et al. [16] to a DP1180 steel to highlight how the MK model can be calibrated to provide good agreement with the Nakazima FLC but systematically overestimated formability for in-plane stretching when compared with the FLC from Marciniak tests. The MK model should be evaluated deterministically using Marciniak or process-corrected Nakazima data that are consistent with the theoretical framework. When the MK model was calibrated deterministically using only the Marciniak FLC0 and the constraint of Soare [10] on the imperfection factor for diffuse necking in plane strain tension, the predictions were not as accurate as the MMFC model that contained no calibration parameters. Noder and Butcher [18] have also reported that the MMFC model predictions can be in very good agreement with a DP980 steel and the MP980 of Min et al. [19] when Marciniak test data, or process-corrected Nakazima data was used.
The focus of the present study is on the experimental characterization and deterministic prediction of the forming limit strains for two third generation AHSS with a nominal ultimate tensile strength of 980 MPa and 1180 MPa by only using quasi-static mechanical property data. Calibration of an analytical formability model with prior knowledge of limit strains, even just the FLC0, is prohibitive from an experimental standpoint and also raises questions of calibration bias in the resulting FLC predictions. To remove uncertainty with respect to the influence of the hardening model extrapolation using tension test data, the novel experimental methodology of Rahmaan et al. [20] using simple shear and tension tests will be adopted. The formability of both 3rd Gen AHSS will be characterized using both Marciniak and Nakazima tests to demonstrate the influence of the process-effects on the Nakazima FLC. The formability predictions of the MK model, the MMFC model, and two variants of the Bressan–Williams (BW) [21] critical shear stress model will be compared with the corrected Marciniak and Nakazima FLC data. Extensions to the MMFC model and BW models were proposed to enhance the predictive accuracy while not introducing any new calibration parameters. Finally, to evaluate the proposed framework for FLC prediction for a larger range of automotive sheet metals, a DP980 and aluminum AA5182 alloy are also considered that were characterized for in-plane formability by Noder and Butcher [18].

2. Constitutive Characterization

2.1. Characterization of Anisotropy

The two third generation steels considered in this study are commercially available and were provided by steel member companies of the Automotive Program of the American Iron and Steel Institute (AISI) (Washington, DC, USA). The identity of the suppliers was kept blind to the parties involved, including the authors. Two third generation advanced high-strength steels (AHSS), denoted as 3rd Gen 980 and 3rd Gen 1180, with 1.4 mm nominal thickness and nominal ultimate tensile strength (UTS) of 980 MPa and 1180 MPa were selected for this study. The mechanical properties of both steels were characterized in uniaxial tension with the JIS No. 5 specimen geometry (Figure 1a) and simple shear with the geometry of Peirs et al. [22] shown in Figure 1b. Disc compression tests with a diameter of 5 mm were performed according to the procedure of Tian et al. [23] at strain levels up to approximately 19% to determine the biaxial R-value. Tensile tests were conducted in five orientations in 22.5° increments with respect to the rolling direction with vertical and horizontal gage lengths of 50 mm and 25 mm, respectively. The shear tests were extracted such that the principal stress directions are initially aligned in the rolling (RD) and transverse directions (TD). DIC strain measurement was performed using the Vic-3D® 7 software (Correlated Solutions Inc., Irmo, SC, USA). The virtual strain gage length (VSGL) is commonly reported and provides a measure for the local region used for strain computation in the DIC analysis. In the shear tests, the VSGL of 0.3 mm was computed from the product of the step size (7), filter size (5 pixel), and camera resolution (0.0085 mm/pixel).
V S G L = s t e p   s i z e × s t r a i n   f i l t e r × r e s o l u t i o n
The shear test geometry has a nominal gage length of 3.0 mm to determine the shear stress which is relatively homogeneous in the adopted shear geometry. Additional details on DIC analysis and validation of the shear geometry for constitutive characterization can be found in Rahmaan et al. [20].
Table 1 provides a summary of the mechanical data retrieved from tensile tests in the TD. The material yield strength was obtained from a 0.2% offset of the equivalent strain that was obtained from a 50 mm virtual extensometer. The Considère [24] criterion was adopted for identification of the uniform elongation. Surface roughness measurements performed with a profilometer and a characteristic length of 2.5 mm revealed similar average roughness values for both steel grades. The anisotropy parameters are summarized in Table 2. The tensile R-values were determined by averaging the DIC strain field in an area of 25 × 50 mm2 over a range of true strain from 0.05–0.15 and 0.03–0.08 for the 3rd Gen 980 and the 3rd Gen 1180, respectively, which approximately corresponds to the range of uniform deformation. The limiting direction for both steels was in TD and the plastic work and equivalent plastic strain at the onset of diffuse necking corresponded to 164.7 MJ/m3 and 0.15 respectively for the 3rd Gen 980 and 88.4 MJ/m3 and 0.07 respectively for the 3rd Gen 1180. The dimensionless stress ratios of the tensile and shear stress with respect to the stress in RD were determined at the limiting plastic work level.

2.2. Determination and Calibration of the Isotropic Hardening Behavior up to Large Strains

Analytical predictions of formability can be very sensitive to the selection of the hardening law particularly in biaxial stretching where the equivalent limit strains can far exceed the necking strain in uniaxial tension. If only uniaxial tension data is available, then the accuracy of the predictions depends upon the unverified accuracy of the post-uniform extrapolation [25]. In order to obtain the hardening response to higher strains to remove uncertainty in the limit strain prediction, biaxial bulge tests can be performed. Hydraulic bulge tests require specialized test equipment and accurate extraction of the hardening curve requires careful analysis of the DIC data as detailed by Min et al. [16]. Simple shear tests are an attractive alternative for materials that exhibit isotropic hardening since they can be readily performed on a universal test frame along with the tensile tests. Shear tests are not limited by a tensile instability as in uniaxial tension or bulge tests so that very large strain levels can be obtained prior to fracture.
A novel experimental methodology to use simple shear to obtain the isotropic hardening behavior has been developed by Rahmaan et al. [20] and is utilized in the present study for the two steels. The method converts the uniaxial and shear stress responses to be in terms of the plastic work. The tensile hardening response is used until the onset of diffuse necking and the shear stress ratio at this work level is used to convert the shear stress to an equivalent tensile stress. Figure 2 serves to show the approximately stable stress conversion ratio by the plastic work level corresponding to the tensile instability that justifies the assumption of isotropic hardening for the studied steel grades. Next, the equivalent plastic strain is calculated from the plastic work. A limitation of the methodology is that it does not account for shear anisotropy due to the material frame rotation, but it can be readily accounted for by using the procedure of Abedini et al. [26] that requires shear tests to be performed in different orientations. For a DP980 and DP1180 steel, Abedini et al. [26] reported that the error associated with neglecting material frame rotation in the determination of the hardening response was on the order of 2% for the AHSS but was 5% for AA5182 aluminum and 15% for an AA6063-T6 aluminum extrusion. Based upon the results of Rahmaan et al. [20] for a DP600 steel along with the DP980 and DP1180 of Abedini et al. [26], only one shear test was performed to obtain the hardening response. The use of a single shear test is considered to be at least first-order accurate for the hardening response of the 3rd Generation steels and only adds a single test to be performed alongside the basic tensile characterization. The hardening response for the tensile and shear tests for both steels are shown in Figure 3. The validity of the experimental hardening curve obtained using the tensile and shear tests is evaluated in Section 2.4 using 3D simulations of the tensile test where large strains develop due to localization.
Recent work by Noder and Butcher [18] highlighted the importance of the calibration procedure used in the hardening model and how it can significantly influence analytical formability predictions. A constrained calibration must be performed to enforce the Considère criterion [24] for the beginning of diffuse necking in uniaxial tension, which occurs when the hardening rate is equivalent to the major principal stress such that
d σ 1 d ε 1 = σ 1
Failure to enforce the Considère constraint of Equation (2) upon the hardening model at the experimentally measured plastic strain for the uniform elongation will result in shifting of the FLC0 in analytical formability models. It is particularly problematic for the MK model since the imperfection factor will then be adjusted to compensate for the shifted FLC0 leading to a false conclusion that the imperfection factor has a strong dependence upon the hardening model. Butcher et al. [17] showed that the simple enforcement of the Considère constraint can effectively remove the dependence of the MK imperfection factor upon the selection of hardening model.
The present study has adopted the modified Hockett–Sherby (MHS) model of Noder and Butcher [18] in Equation (3) which is flexible enough to satisfy the constraint of Equation (2) and does not saturate at high strains like the regular Hockett–Sherby model. The MHS model is defined as
σ ¯ M H S = C 1 ( C 1 C 2 ) exp ( C 3 ε ¯ C 4 ) + C 5 ε ¯
where σ ¯ is the flow stress, ε ¯ is the equivalent plastic strain, and C1–5 are calibration parameters. The MHS coefficients were calibrated using a constrained least squares minimization in MATLAB® software using the fmincon subroutine and are tabulated in Table 3. The Considère constraint of Equation (2) was enforced at the true plastic strain corresponding to the uniform elongation determined in the tensile tests stated in Table 1. The constraint was enforced to a tolerance of 1 × 10⁻⁸. A comparison of the MHS model calibrations with the tensile and converted shear data and the computed hardening rate are illustrated in Figure 3. It should be noted that since all of the formability tests were conducted in the TD, the hardening response was characterized in the TD. In the anisotropic yield function that uses the rolling direction as the reference, the TD hardening data was converted to the RD by the uniaxial stress ratios given in Table 2 and the MHS model coefficients are provided in Table 3.

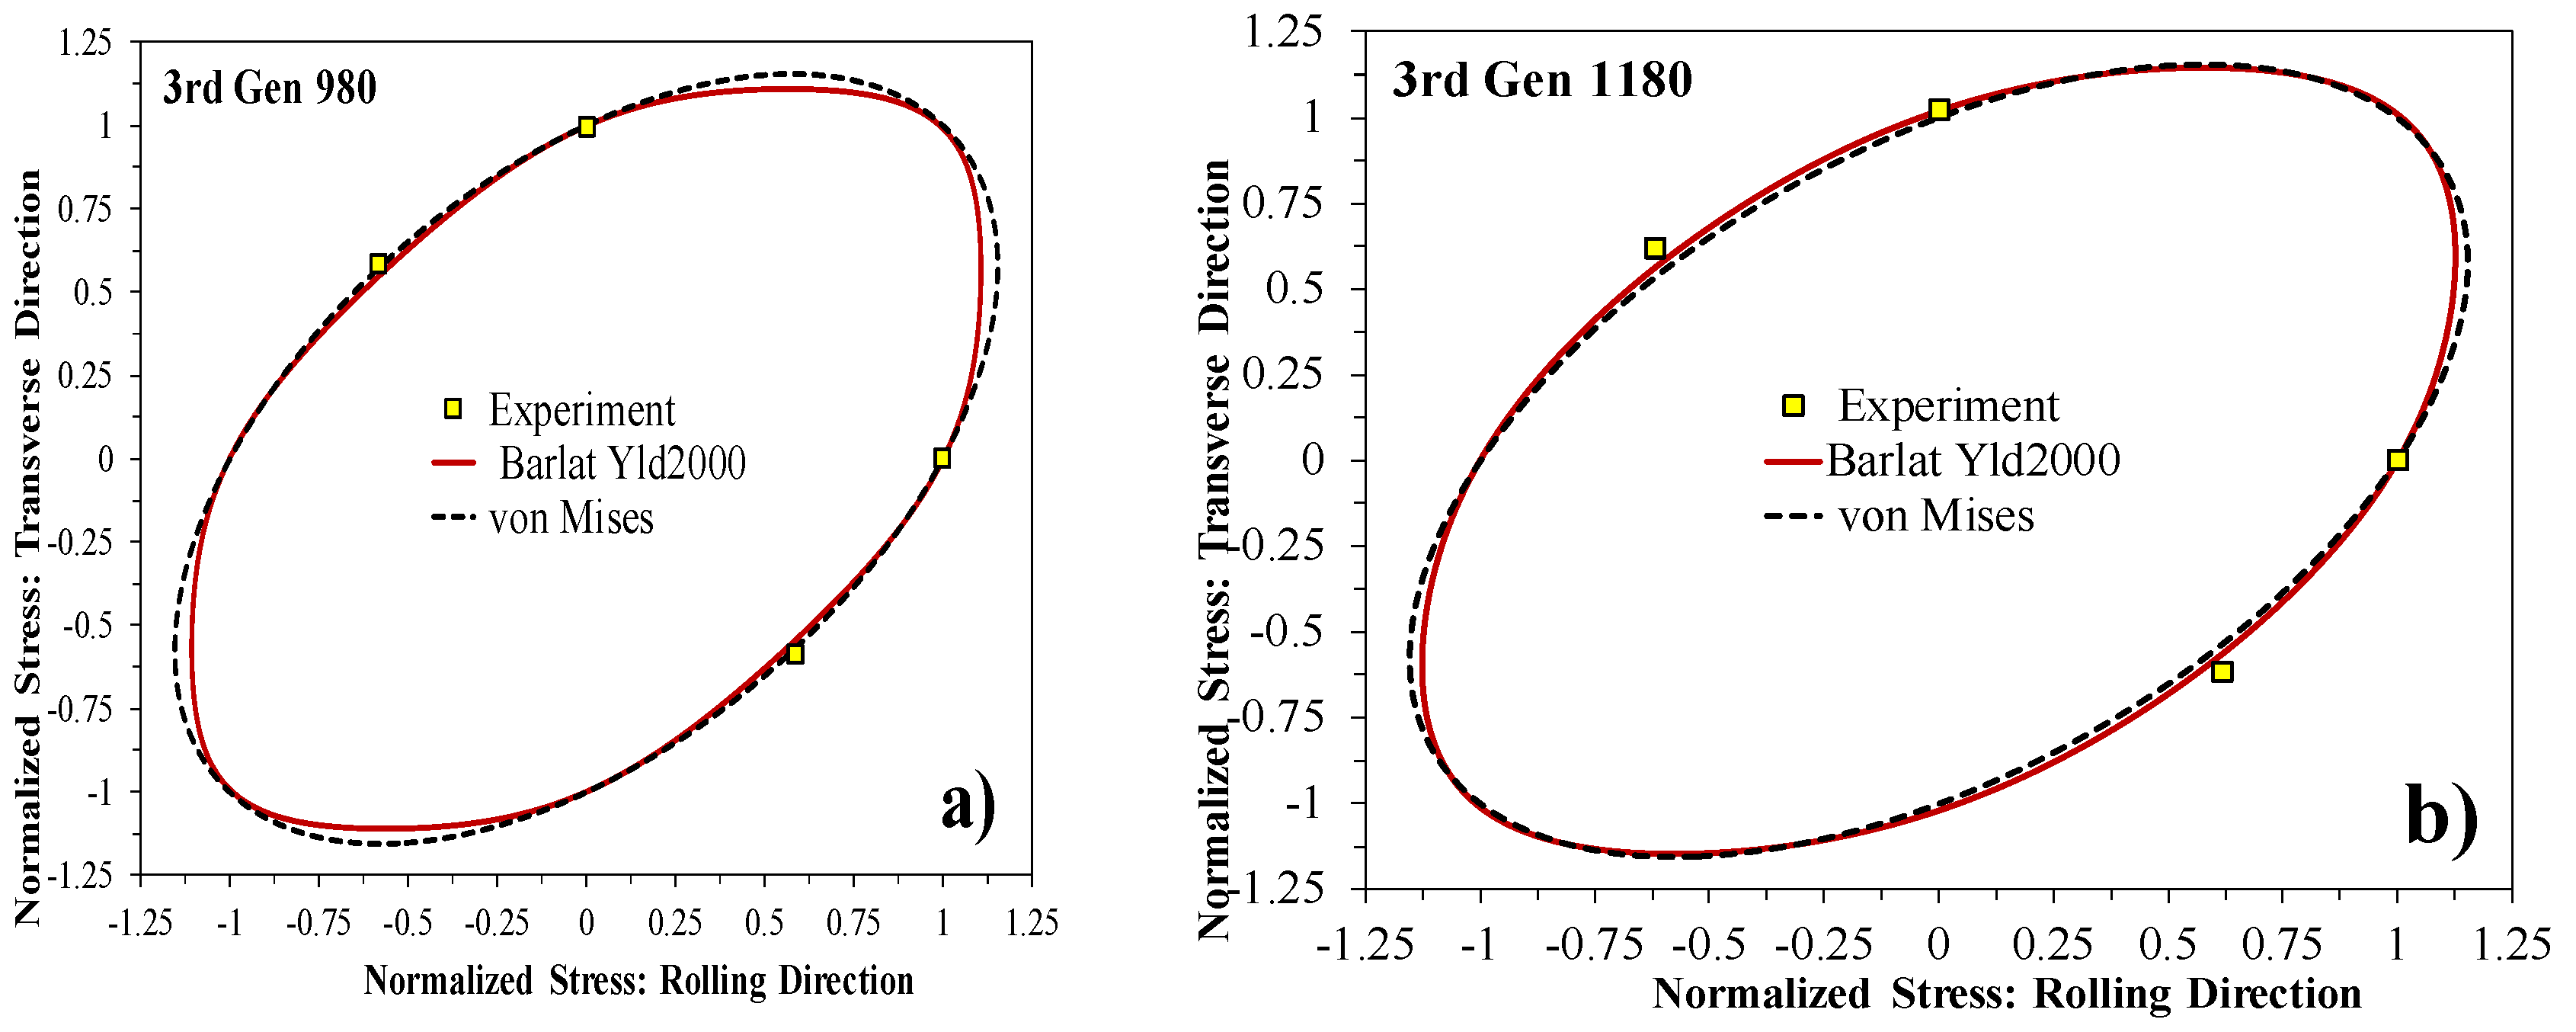
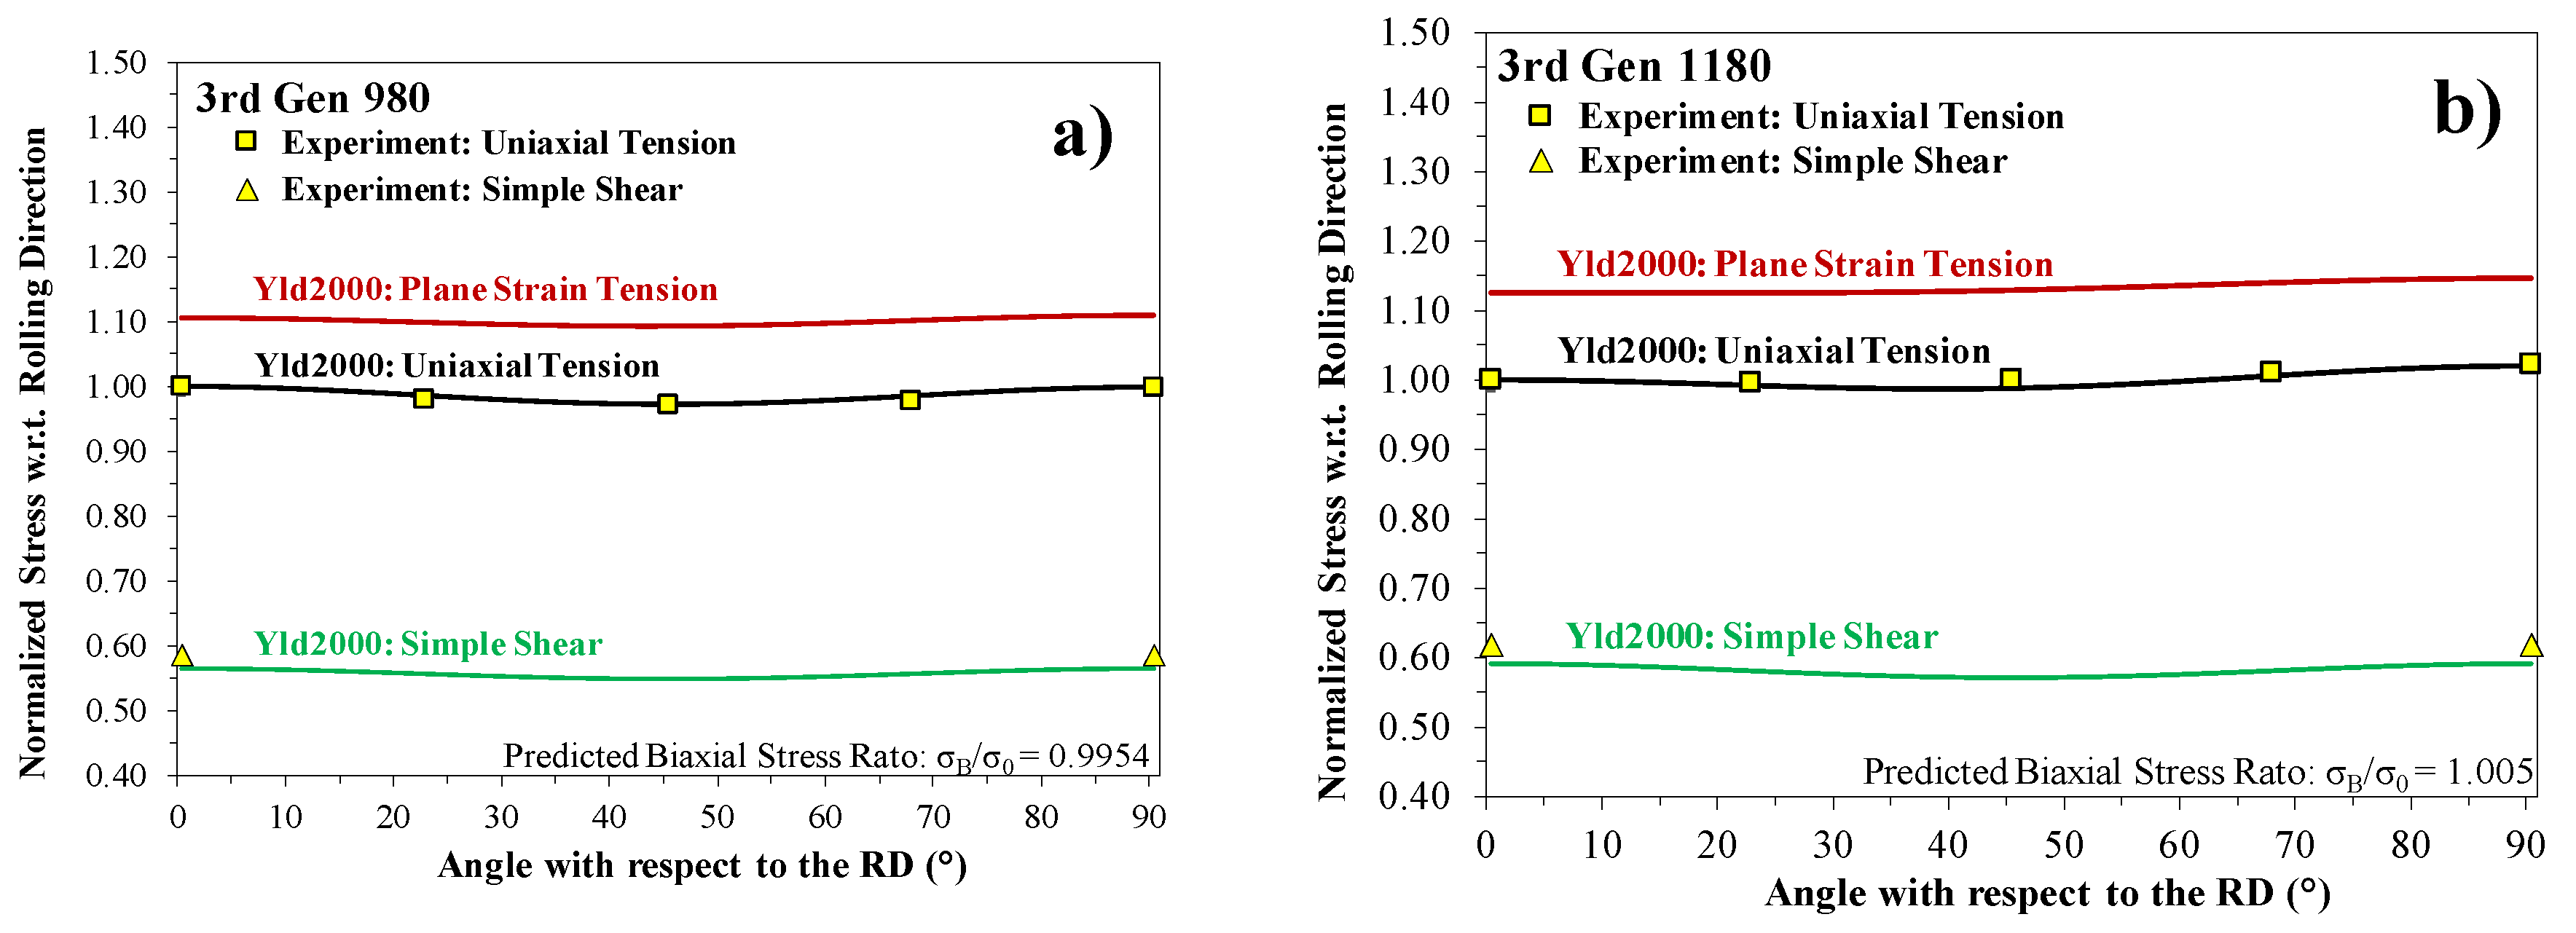
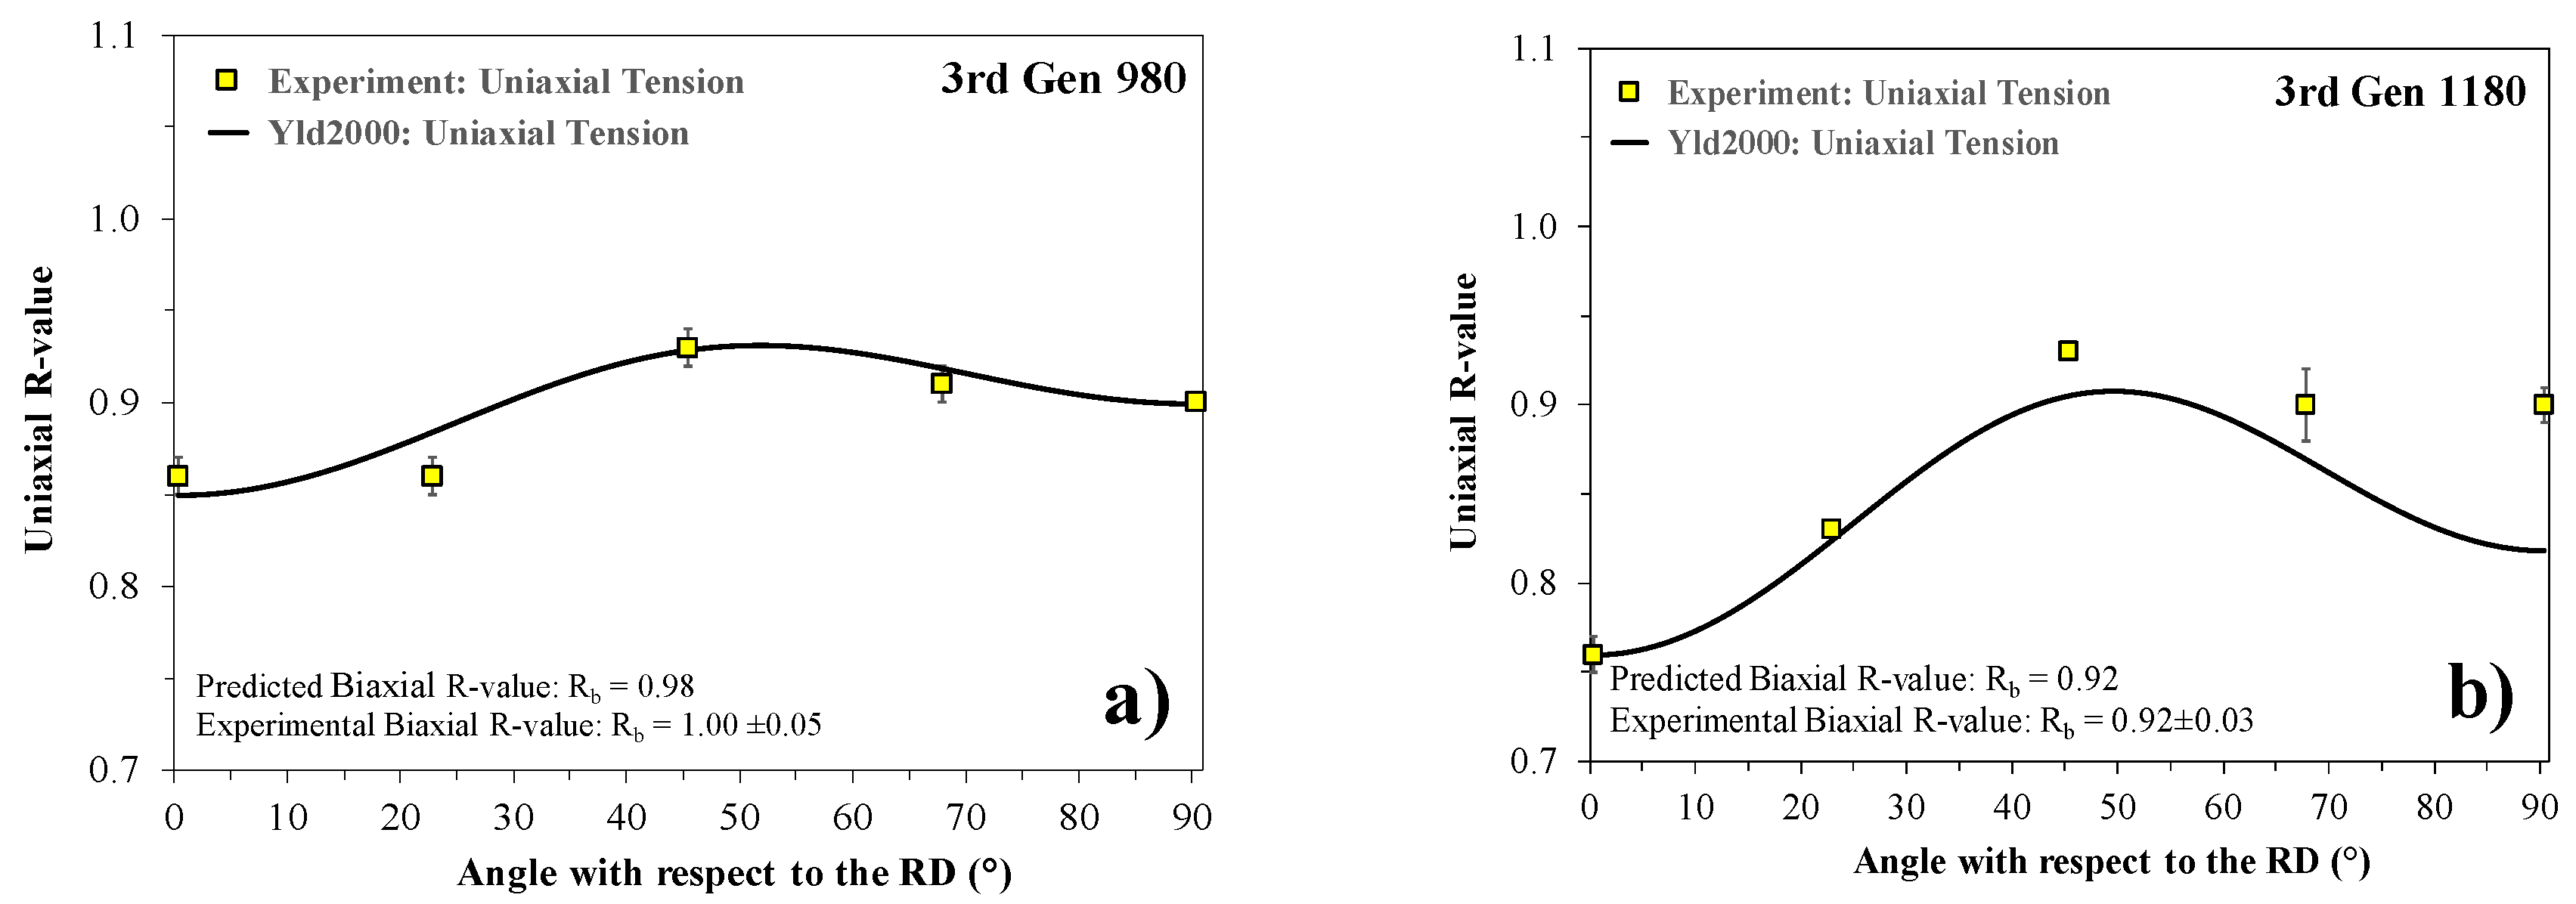
2.3. Calibration of the Yld2000 Anisotropic Yield Function

The choice of yield function was shown by Barlat [27] and Lian et al. [28] to significantly influence the MK formability predictions through the yield surface shape and the ratio of the yield strength in plane strain to equal-biaxial tension. The adoption of a quadratic yield surface tends to significantly overestimate the biaxial limit strains in the MK model. To account for the influence of anisotropy on the formability predictions, the non-quadratic plane stress Yld2000 model of Barlat et al. [29] was adopted for both 3rd Gen steels. The Yld2000 model contains eight calibration parameters, a1–8, and an exponent, m. For steels with a Body Centered Cubic (BCC) crystal structure an initial estimate for the yield exponent is 6. The equivalent stress in the Yld2000 model is
σ e q Y L D 2000 = ( | X 1 X 2 | m + | 2 X 2 + X 1 | m + | 2 X 1 + X 2 | m 2 ) 1 / m
where Xi′ and Xi″ are the principal deviatoric stresses from two linear transformations defined by, X = L : σ and X = L : σ . The eight anisotropy parameters are embedded within the two fourth-order transformation tensors L and L . For brevity, the reader is referred to Barlat et al. [29] for a detailed description of the yield function and its derivation. Least squares optimization was performed in MATLAB® with the twelve experimental data points in Table 2. The calibrated anisotropy parameters and yield exponents are tabulated for both steels in Table 4. Note that for the 3rd Gen 1180, better experimental agreement was obtained with a slightly lower yield exponent of 4.7 that correlated well with the study of Kuwabara and Nakajima [30] who used yield exponents ranging from 4–6 for DP980. A comparison of the calibrated yield surfaces with respect to the von Mises yield criteria is presented in Figure 4 along with the predictions of the tensile stress ratios and R-values in Figure 5 and Figure 6, respectively. Although the Yld2000 model is over-constrained with more experimental data points than parameters, it is able to accurately describe the anisotropy of both steels with the exception of shear where the yield stress is underestimated. For the present study where the focus is on the prediction of formability in tensile loading, the error in the predicted shear stress is acceptable. Future work could consider more advanced yield functions such as the Drucker-based model by Yoshida et al. [31] to improve the overall accuracy in shear stress states.
The plane strain yield strength is important for the prediction of the FLC0. The normalized plane strain yield strengths were predicted by the Yld2000 model to be 1.11 and 1.146 for the 3rd Gen 980 and the 3rd Gen 1180 in the TD, respectively. For equal-biaxial stretching where no yield stress data was available, the predicted biaxial stress ratio was 0.995 and 1.005 for the 3rd Gen 980 and the 3rd Gen 1180, respectively.

2.4. Validation of the Hardening Model in Tensile Simulations

Accurate calibration of the hardening model is paramount for reliable model predictions of the material formability. To highlight the applicability of the experimentally-based method to obtain the hardening behavior to large strains using shear and tensile tests to the AHSS, the uniaxial tensile tests were simulated with the identified hardening parameters in Table 3 using the Finite Element (FE) solver LS-DYNA® (LSTC, Livermore, CA, USA) with an implicit time integration scheme. In order to capture the post-uniform behavior associated with strain localization, the specimen sheet thickness was discretized with a total of 10 fully integrated solid elements (Type-2 in LS-DYNA®), resulting in brick elements of 0.3 × 0.3 × 0.14 mm3. Unfortunately, the use of 3D elements to capture localization within the neck precludes the use of the plane stress Yld2000 model used in the formability predictions. For simplicity and in light of the mild tensile anisotropy in TD recorded in Table 2, the isotropic von Mises yield surface was adopted for the 3D tensile simulations. A velocity-controlled boundary condition with a test speed of 0.05 mm/s was applied and degrees of freedom in the specimen gripping area were constrained in accordance with clamping in the experiments.
Model predictions for both steels are shown in Figure 7 and were in good agreement with the global stress-strain response in the tests until just prior to fracture where the isotropic model did not capture localization as well. For the analytical prediction of formability, the hardening models obtained with the tensile and shear tests appears to be sufficiently accurate.

3. Experimental Formability Characterization

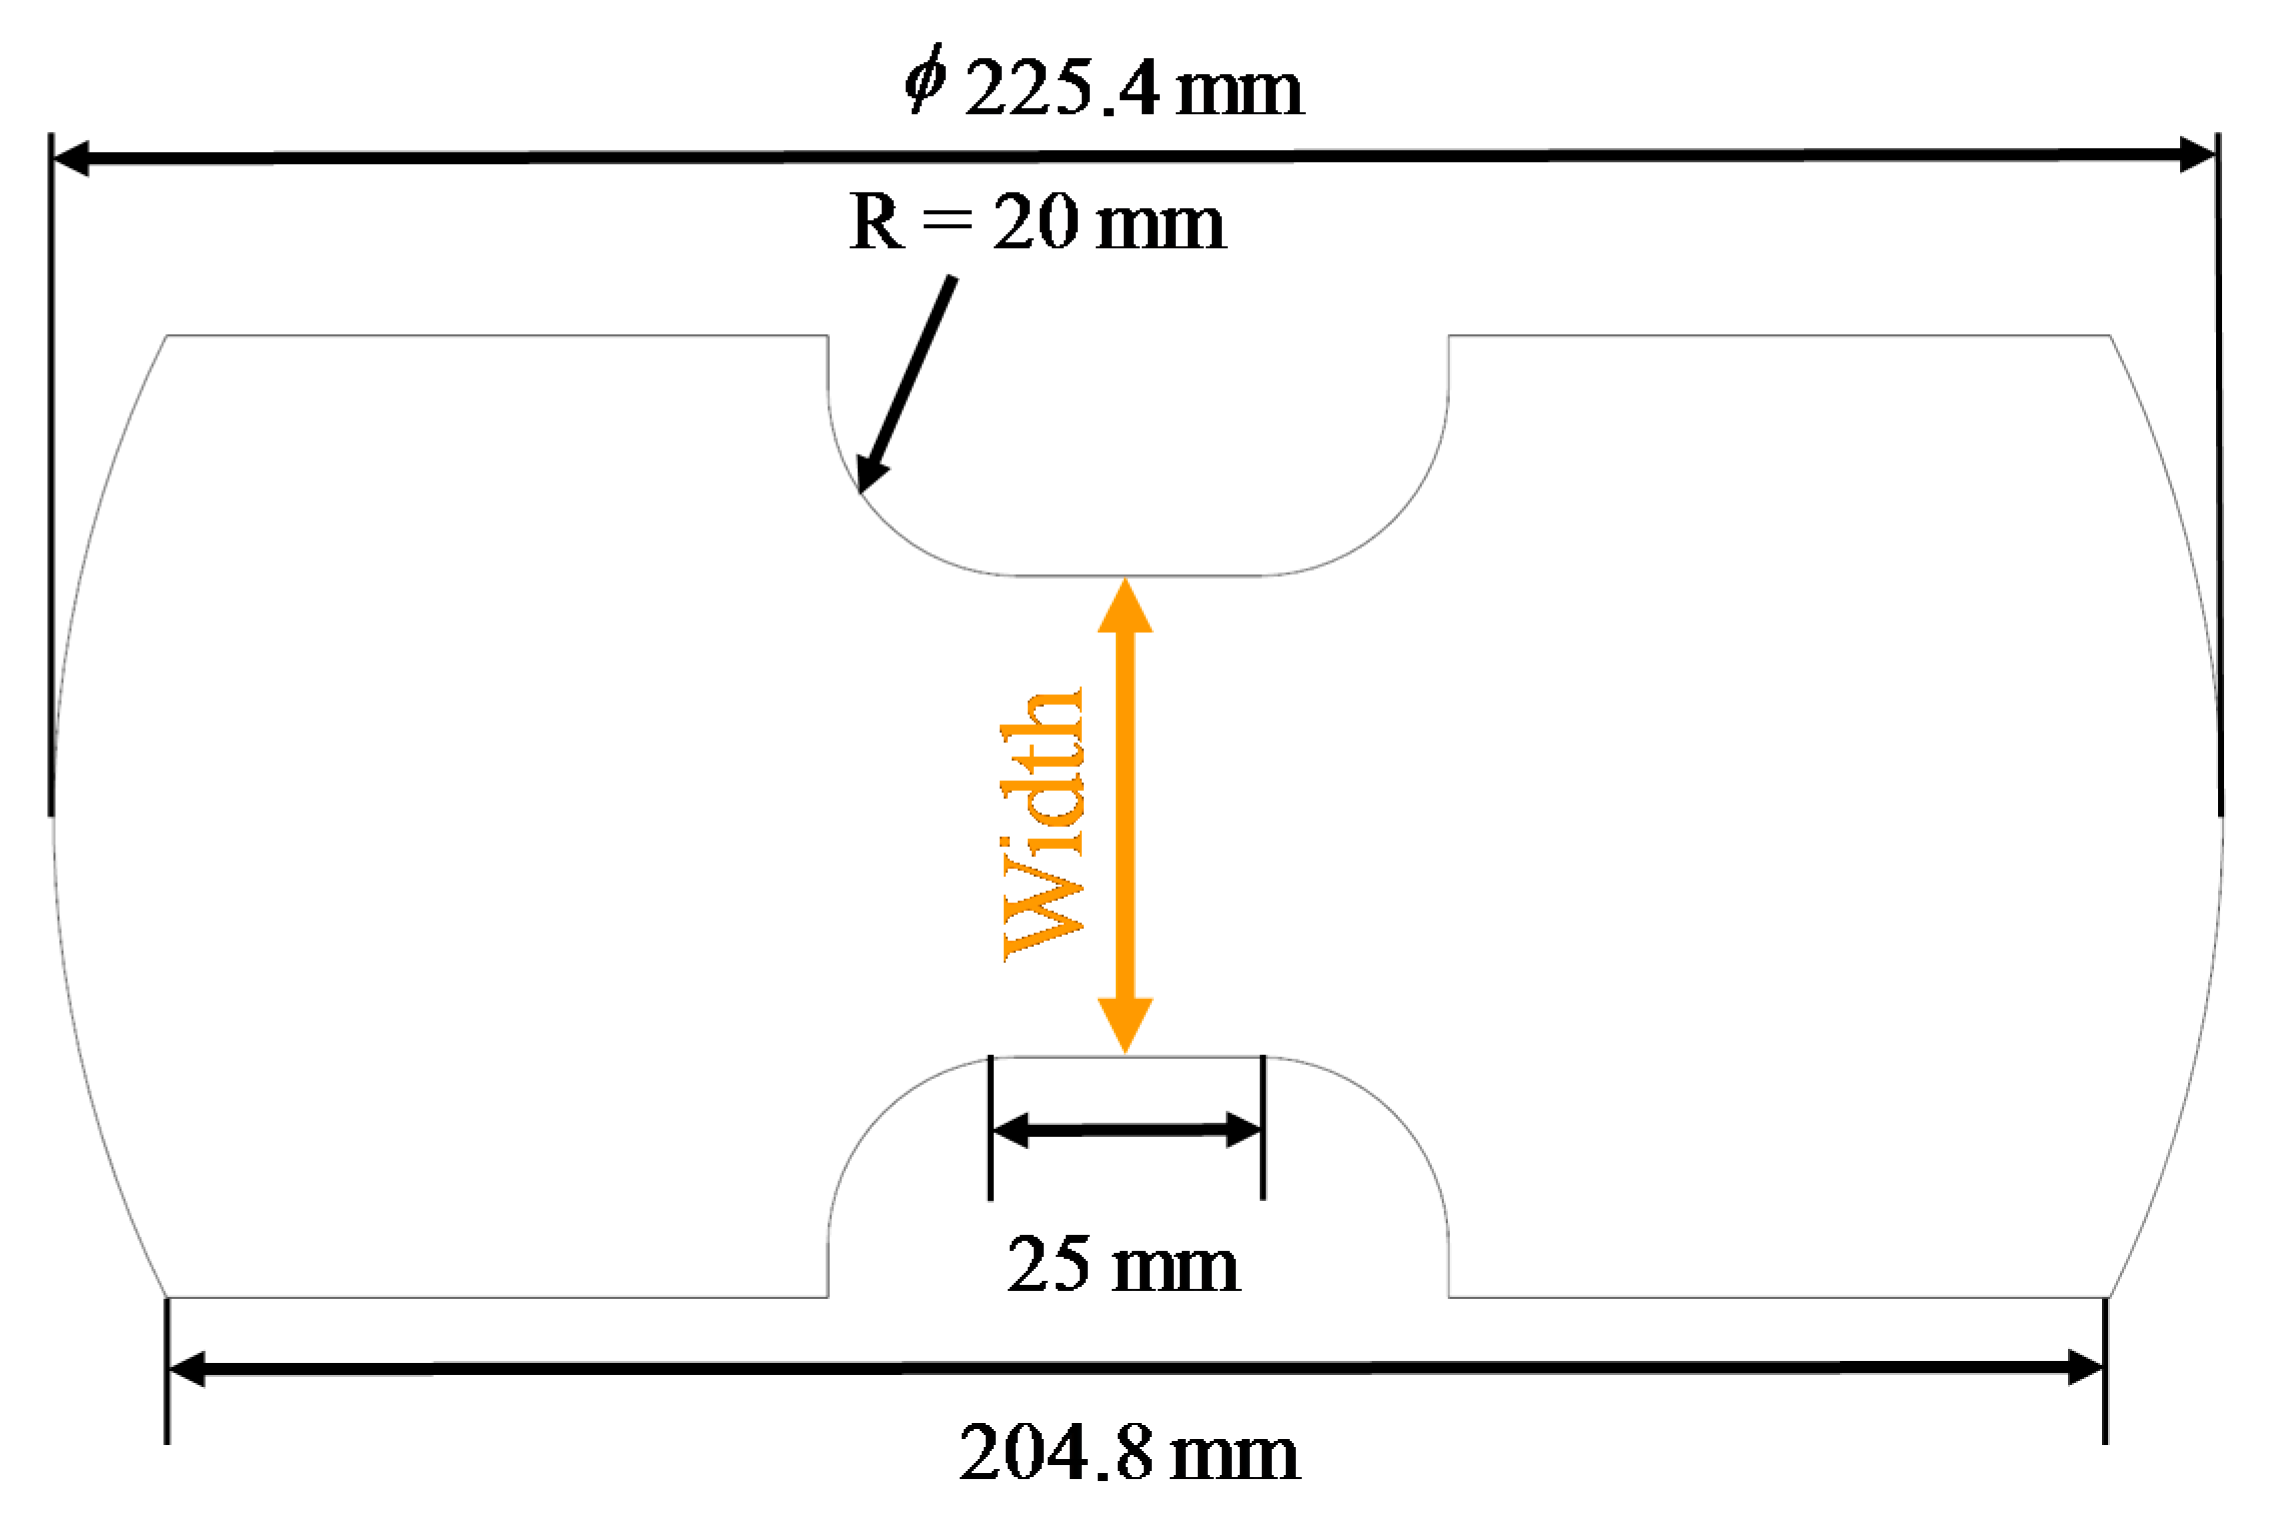
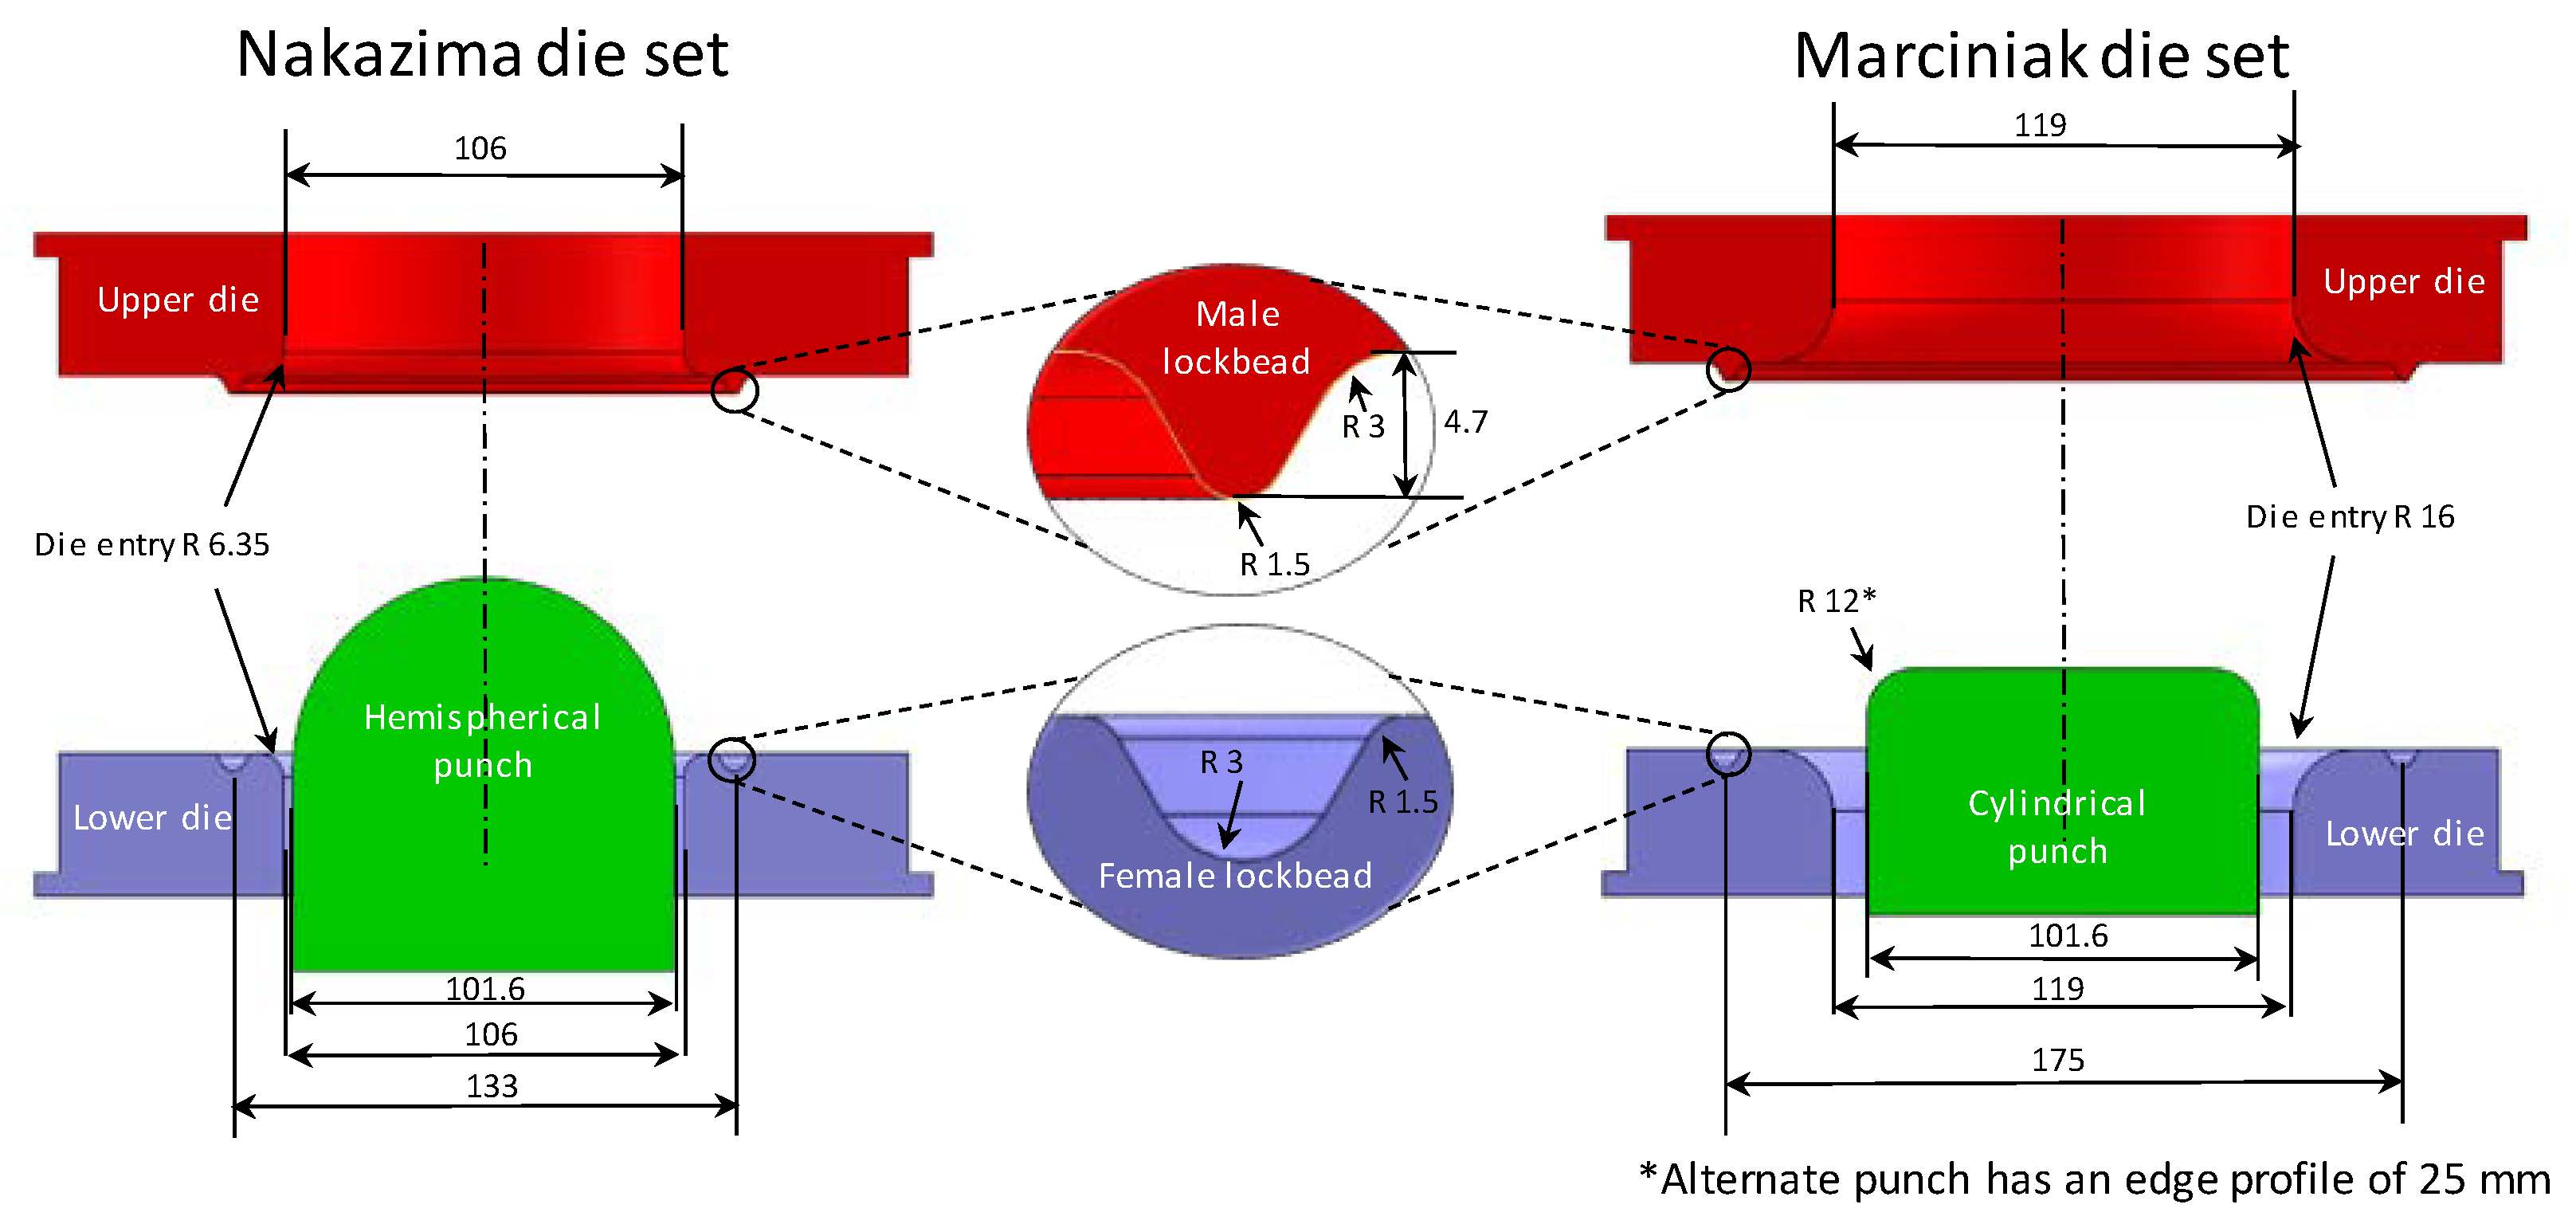
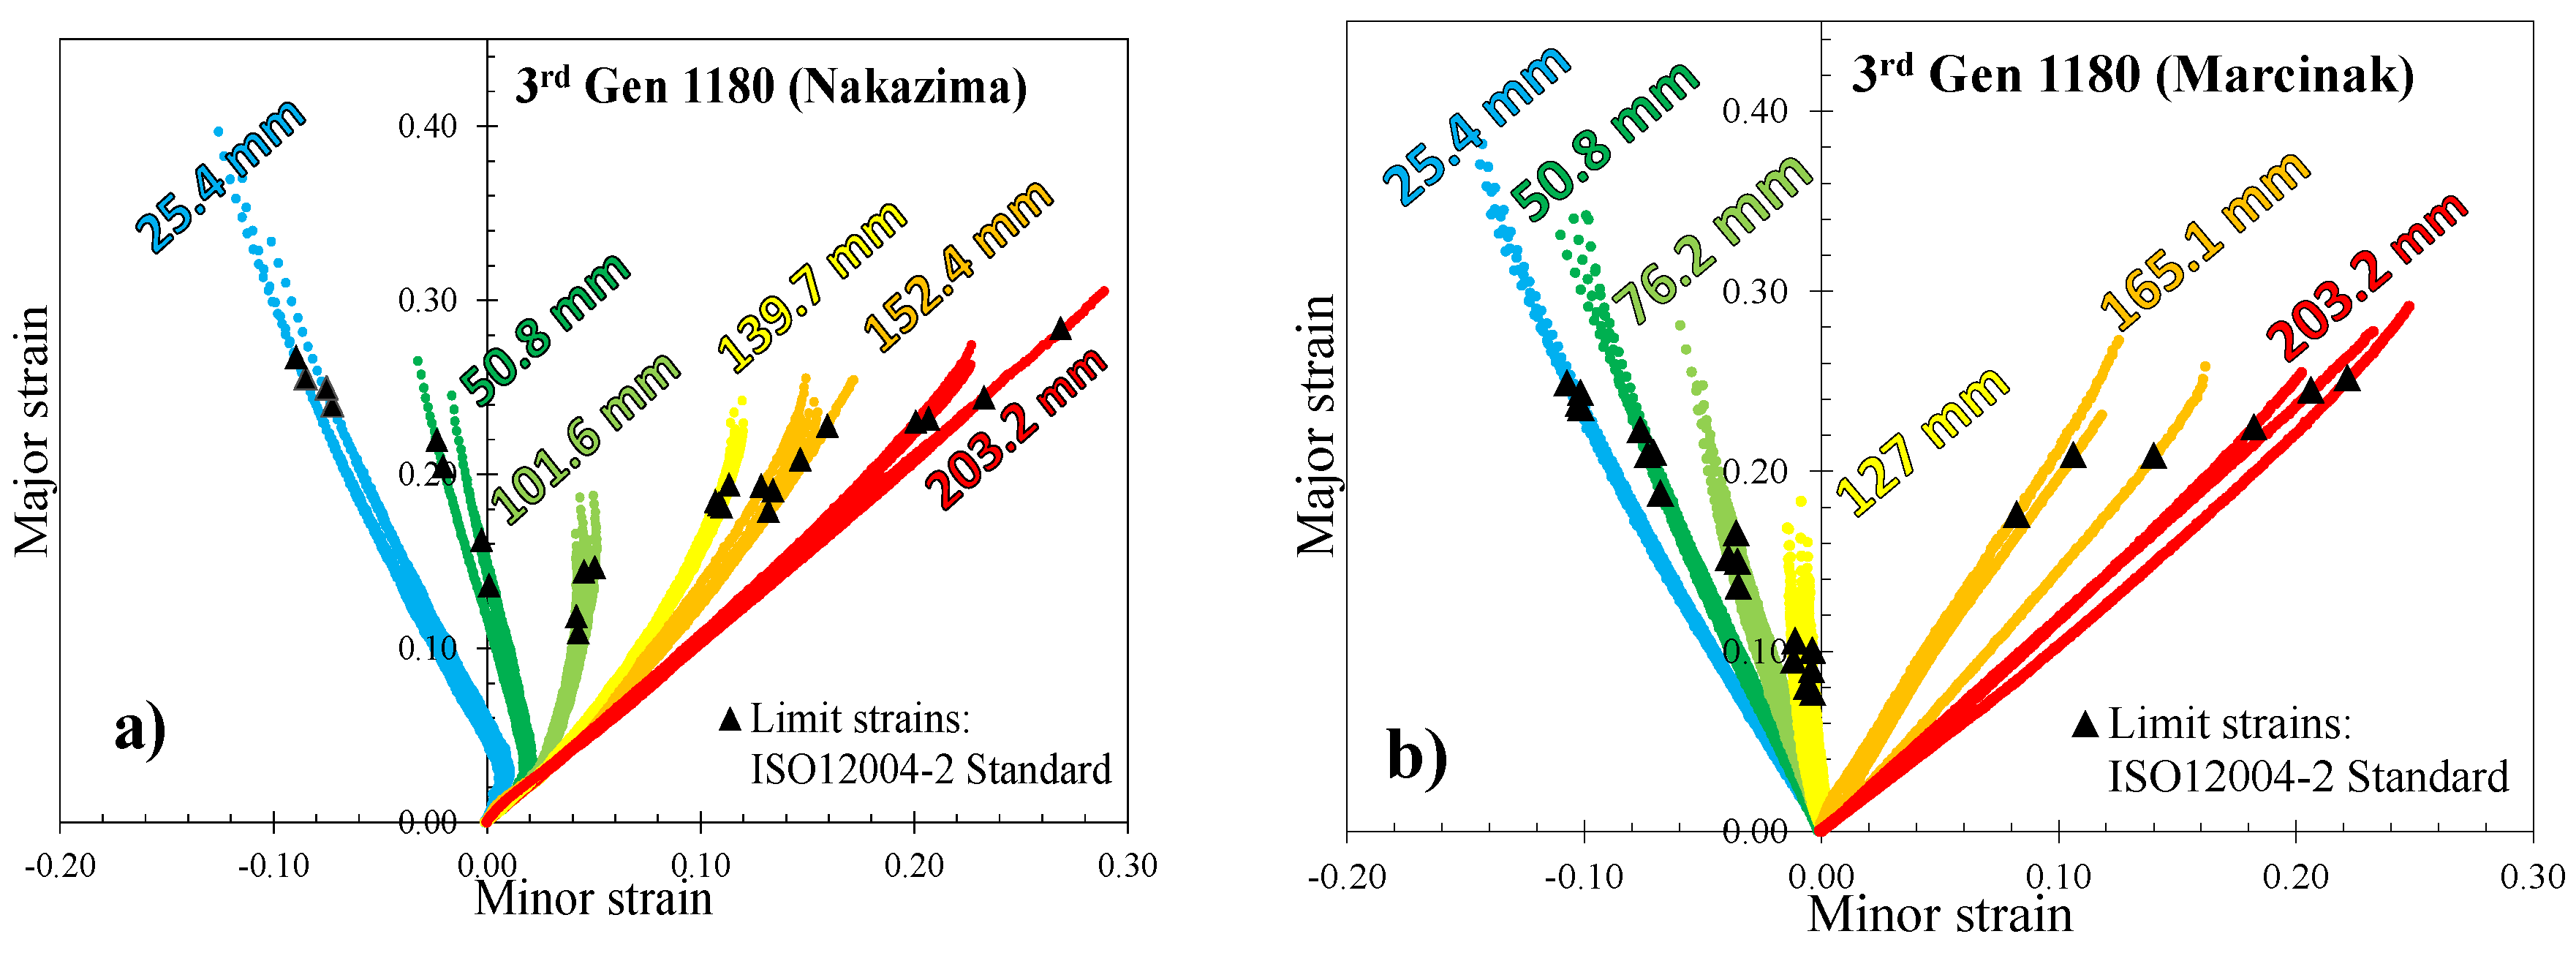
3.1. Marciniak and Nakazima Tests

The Marciniak and Nakazima experiments were conducted in accordance with the ISO12004-2 standard to explore strain paths from approximately uniaxial to equal-biaxial stretching by varying the width of the test specimen from 25.4 mm to 203.2 mm, shown in Figure 8 and recorded in Table 5. All specimens were extracted and tested in the TD.
Tool sets for both Marciniak and Nakazima tests correspond to the ISO 12004-2 standard with toolset dimensions shown in Figure 9. The Nakazima test uses a hemispherical punch with a 101.6 mm diameter whereas a cylindrical punch was used for the Marciniak test with the same diameter and 12 mm radius at the edge of the punch. The Nakazima tooling had a 106 mm inner diameter with a 6.35 mm entry radius and for the Marciniak tooling, a 119 mm inner diameter and a 16 mm die entry radius. The lockbead on both toolsets have a 4.7 mm height and a clamping force of 640 kN was adopted. For biaxial Marciniak tests done on 3rd Gen 1180, an alternate punch with a 25 mm profile radius was used due to the less ductile properties of 3rd Gen 1180 as radius fracture would occur with the standard punch. The punch velocity was 0.25 mm/s and layers of 0.1 mm thick circular Teflon® sheets (two small circles and three large circles) lubricated with petrolatum were placed in between the sample and the punch to aid in promoting center fracture on the specimen. For the Marciniak tests, the Teflon® sheets were placed between the punch and carrier blank.
The choice of carrier blank is important for the Marciniak tests since they are used to achieve the in-plane stretching and promote localization of the blank over its central hole. A 0.9 mm thick 1004 cold-rolled mild steel (MS) that was sand-blasted was initially selected for the carrier blank material for both steels. The carrier blanks were square with a side length of 203.2 mm with a 32 mm diameter hole located in the center that was machined by laser cutting. However, due to the relatively high formability of the 3rd Gen 980, a more ductile stainless steel (SS) carrier blank (27 mm hole diameter and 1.2 mm sheet thickness) was selected for biaxial strain paths to inhibit premature failure at the hold edge. The carrier blank materials for each specimen width in the Marciniak tests are listed in Table 5.

3.2. DIC Settings and Limiting Strain Methodology

Stereoscopic full-field DIC and the software Vic-3D 7® (Correlated Solutions Inc., Irmo, SC, USA) with a step size of 2, strain filter size of 9 pixels, a resolution of 0.057 mm/pixel and a subset of 35 pixels, corresponding to a VSGL of approximately 1.0 mm, were adopted for formability strain analysis. In order to capture a minimum of 300 images per test for both 3rd Gen steels, a frame rate of 5–6 images per second was utilized.

Limit Strain Detection: ISO12004-2
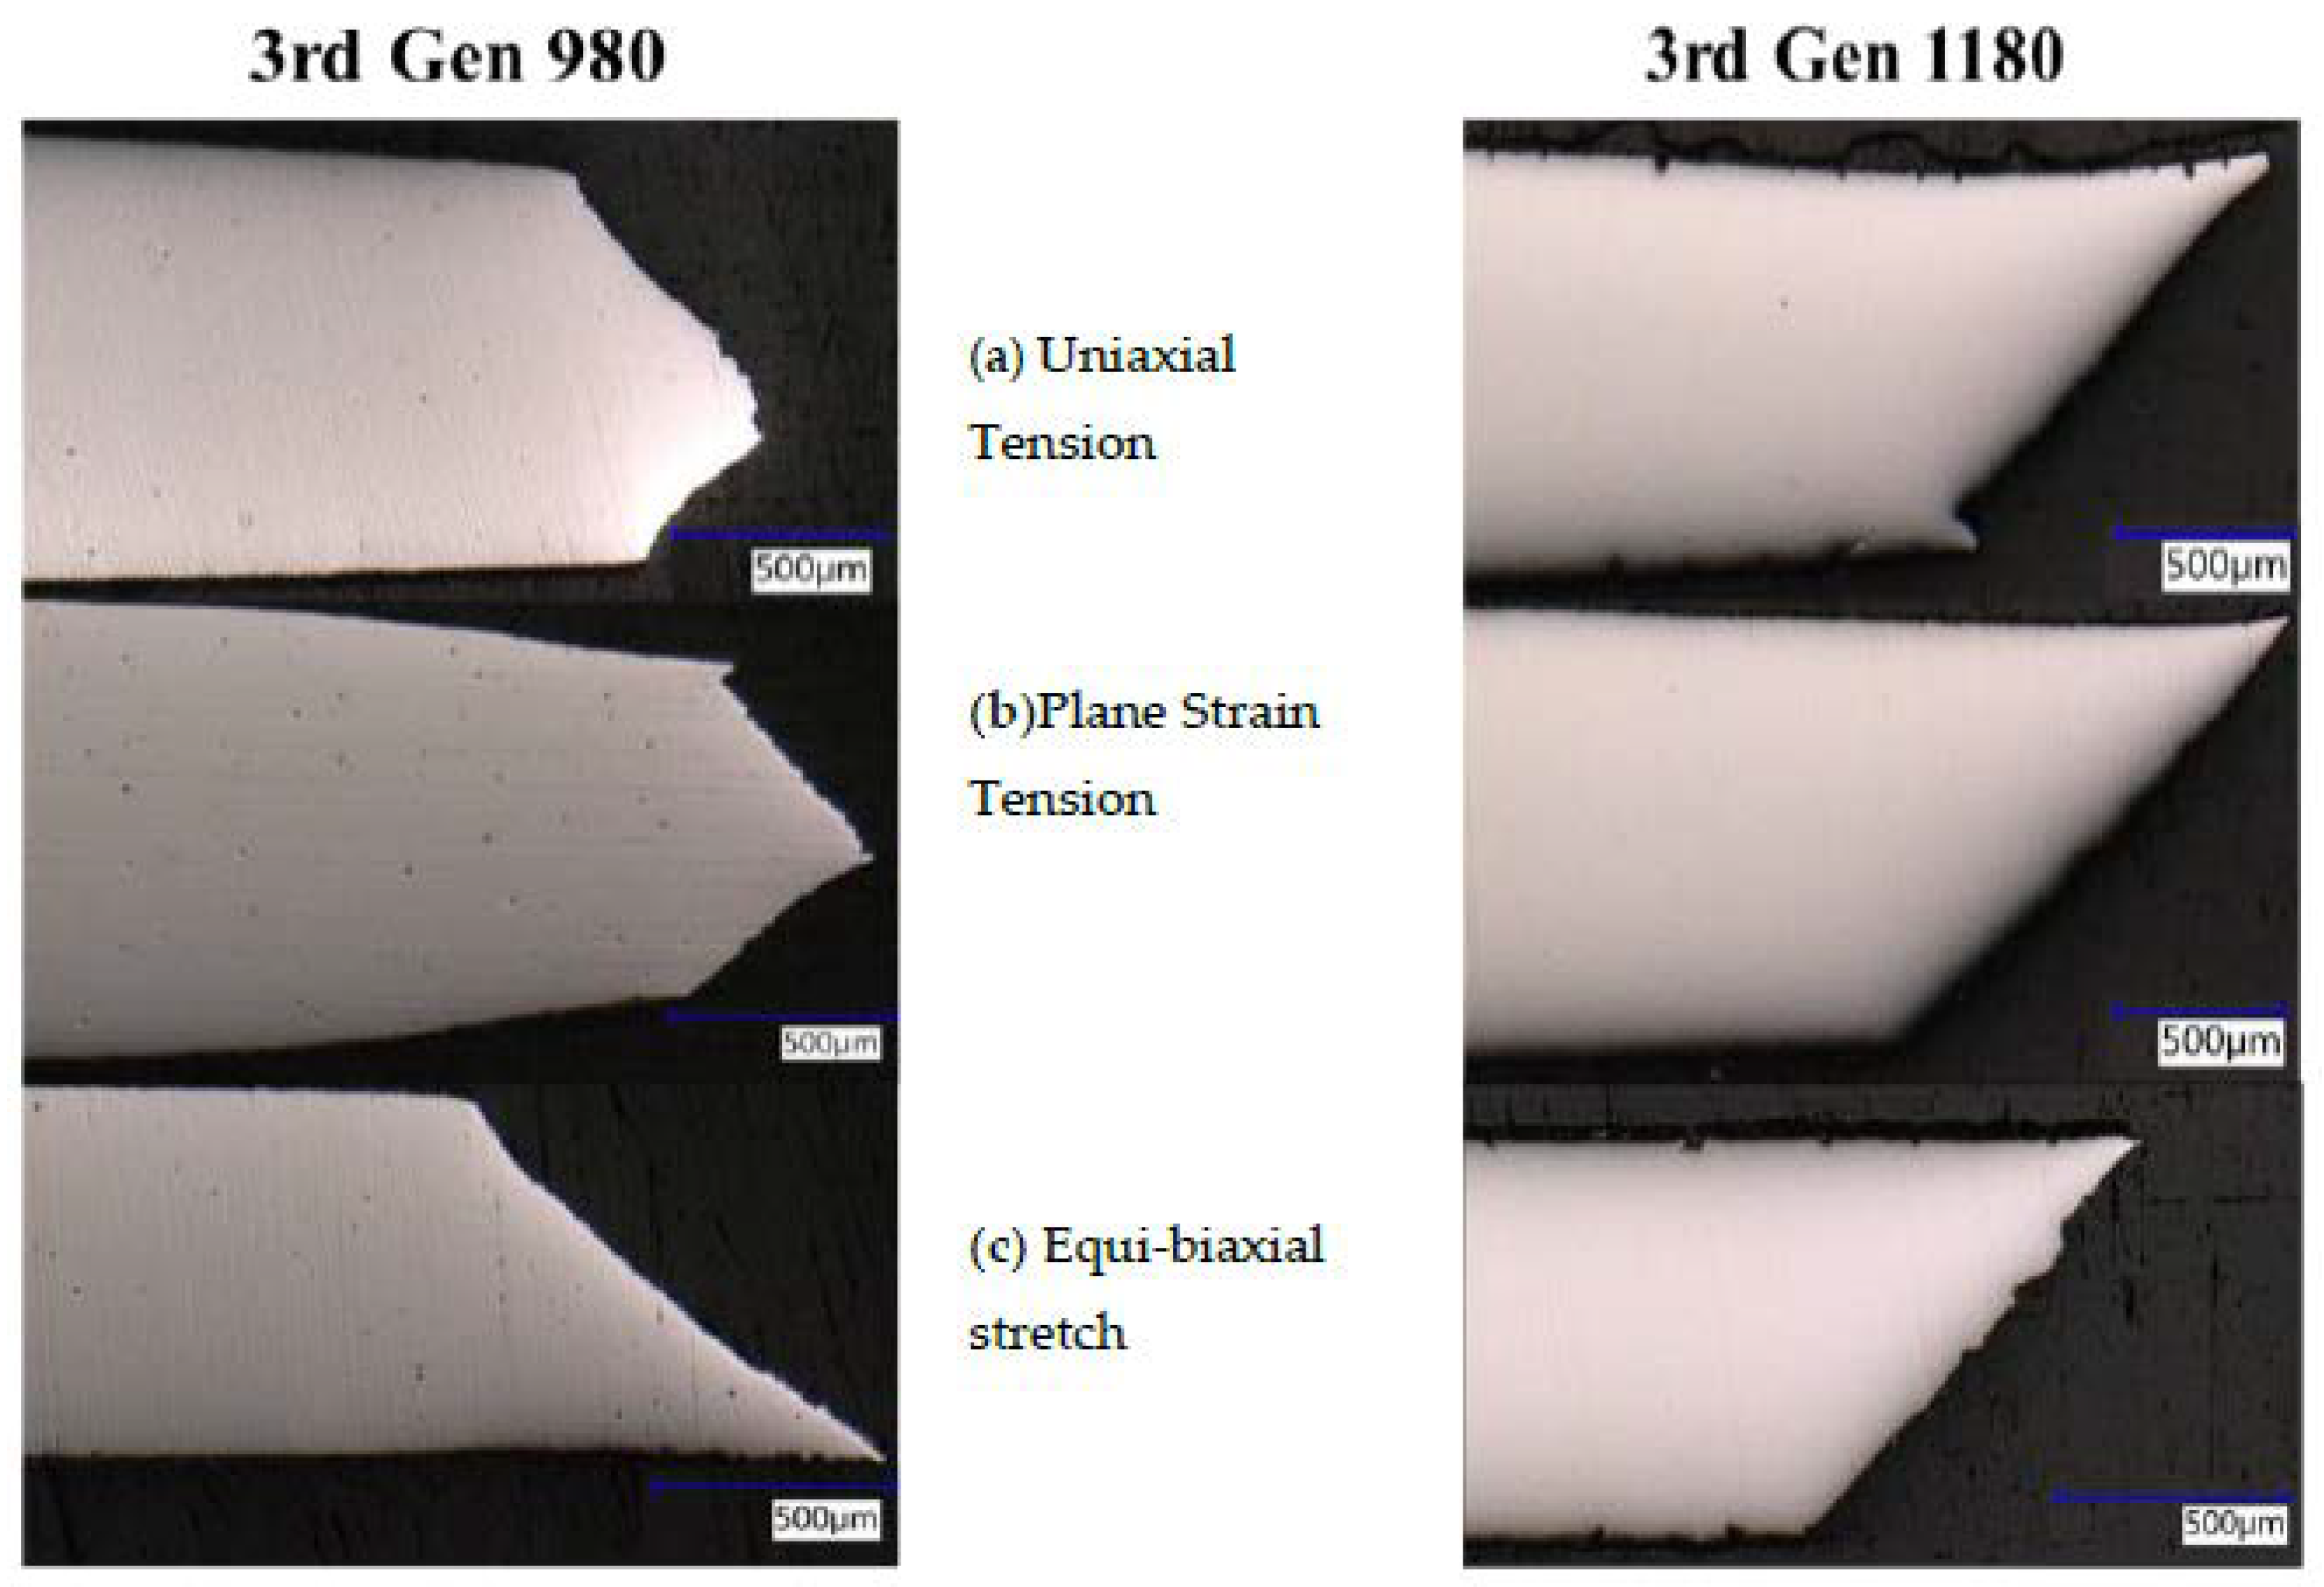
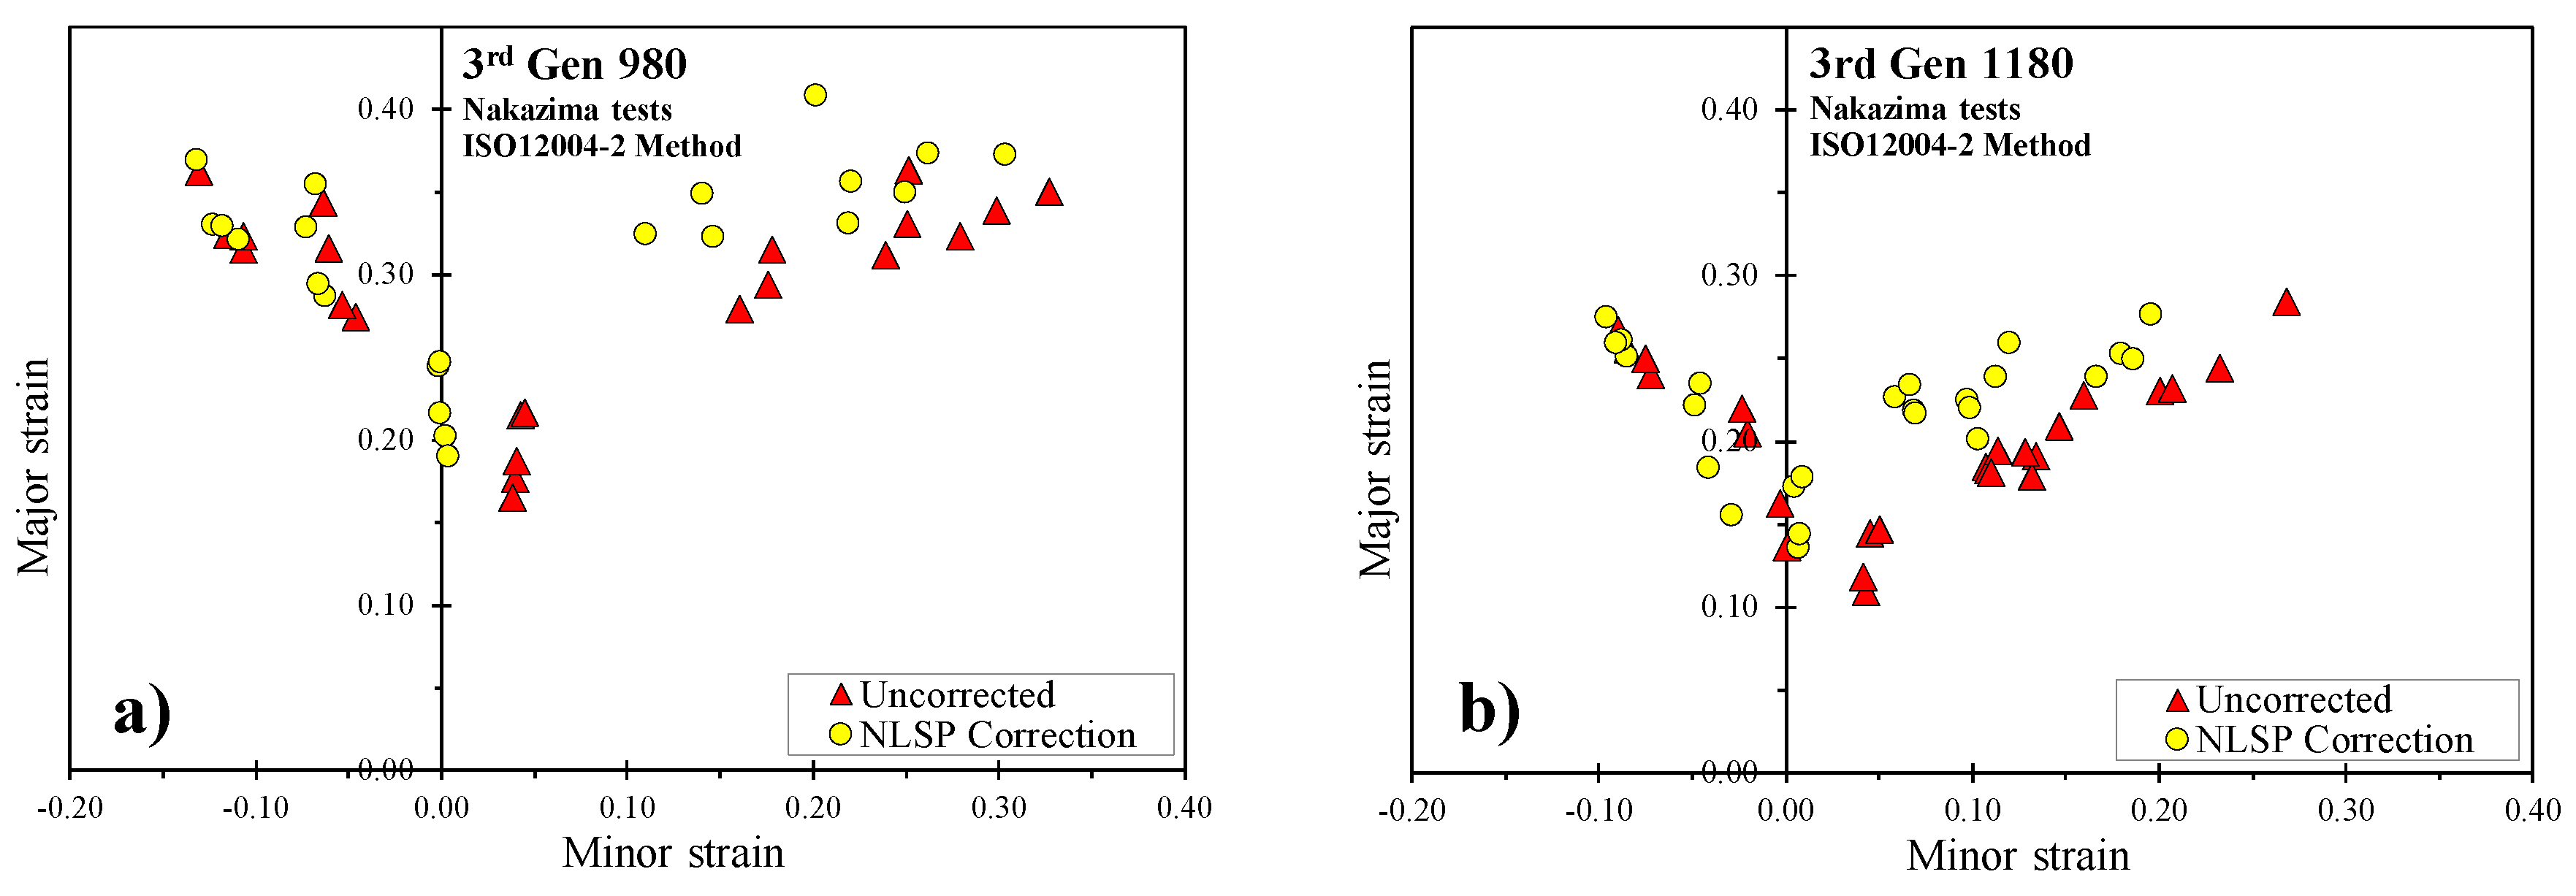
The DIC-based methodology within the ISO12004-2 was followed to determine the limit strains in all tests. For each specimen, five DIC line slices were extracted oriented perpendicular to the location of fracture where five limit strains were determined and averaged to determine the limit strain. The ISO12004-2 standard fits parabolas to the thickness strain and major strain distribution and uses volume conservation to acquire the minor strain. Consequently, the minor strain may not lie on the measured strain path at the necking location. In order to correct this inconsistency, the procedure by Noder and Butcher [18] was followed where the minor strain was selected from the measured DIC strain path when the major limit strain was reached.
Figure 10 and Figure 11 provide the strain path and superimposed limit strains obtained from Marciniak and Nakazima tests for both steel grades. The limiting strains for all tests are tabulated in Appendix A. Non-linear strain paths are evident from Nakazima tests shown in Figure 10a and Figure 11a for which the hemispherical dome induces an equi-biaxial pre-stretch prior to transitioning to the target strain path. Contrary, tests performed with the flat Marciniak punch do not exhibit non-linearity in the strain path.

3.3. Fracture Modes

Localization within the Marciniak tests for both steels followed a similar trend; localization occurred at an angle in uniaxial tension and transitioned to be perpendicular to the principal stretching direction for plane strain to biaxial tension. The localization behavior in terms of the major principal strain prior to fracture is shown for the 3rd Gen 1180 AHSS in Figure 12. In the Nakazima tests, the hemispherical punch geometry promoted localization and fracture to occur perpendicular to the principal stretching direction for all test conditions.
Cross-sections of the failed Marciniak samples for the two steels were then inspected for the fracture mode through an optical microscope. Specimens with a strain path of approximately uniaxial tension, plane strain tension, and balanced biaxial stretching are shown in Figure 13. The local thinning near the fracture surface for the 3rd Gen 980 steel is indicative of preceding necking prior to fracture. Contrary, the 3rd Gen 1180 steel experienced significantly less necking and samples appear to have failed in a through-thickness shear fracture mode.

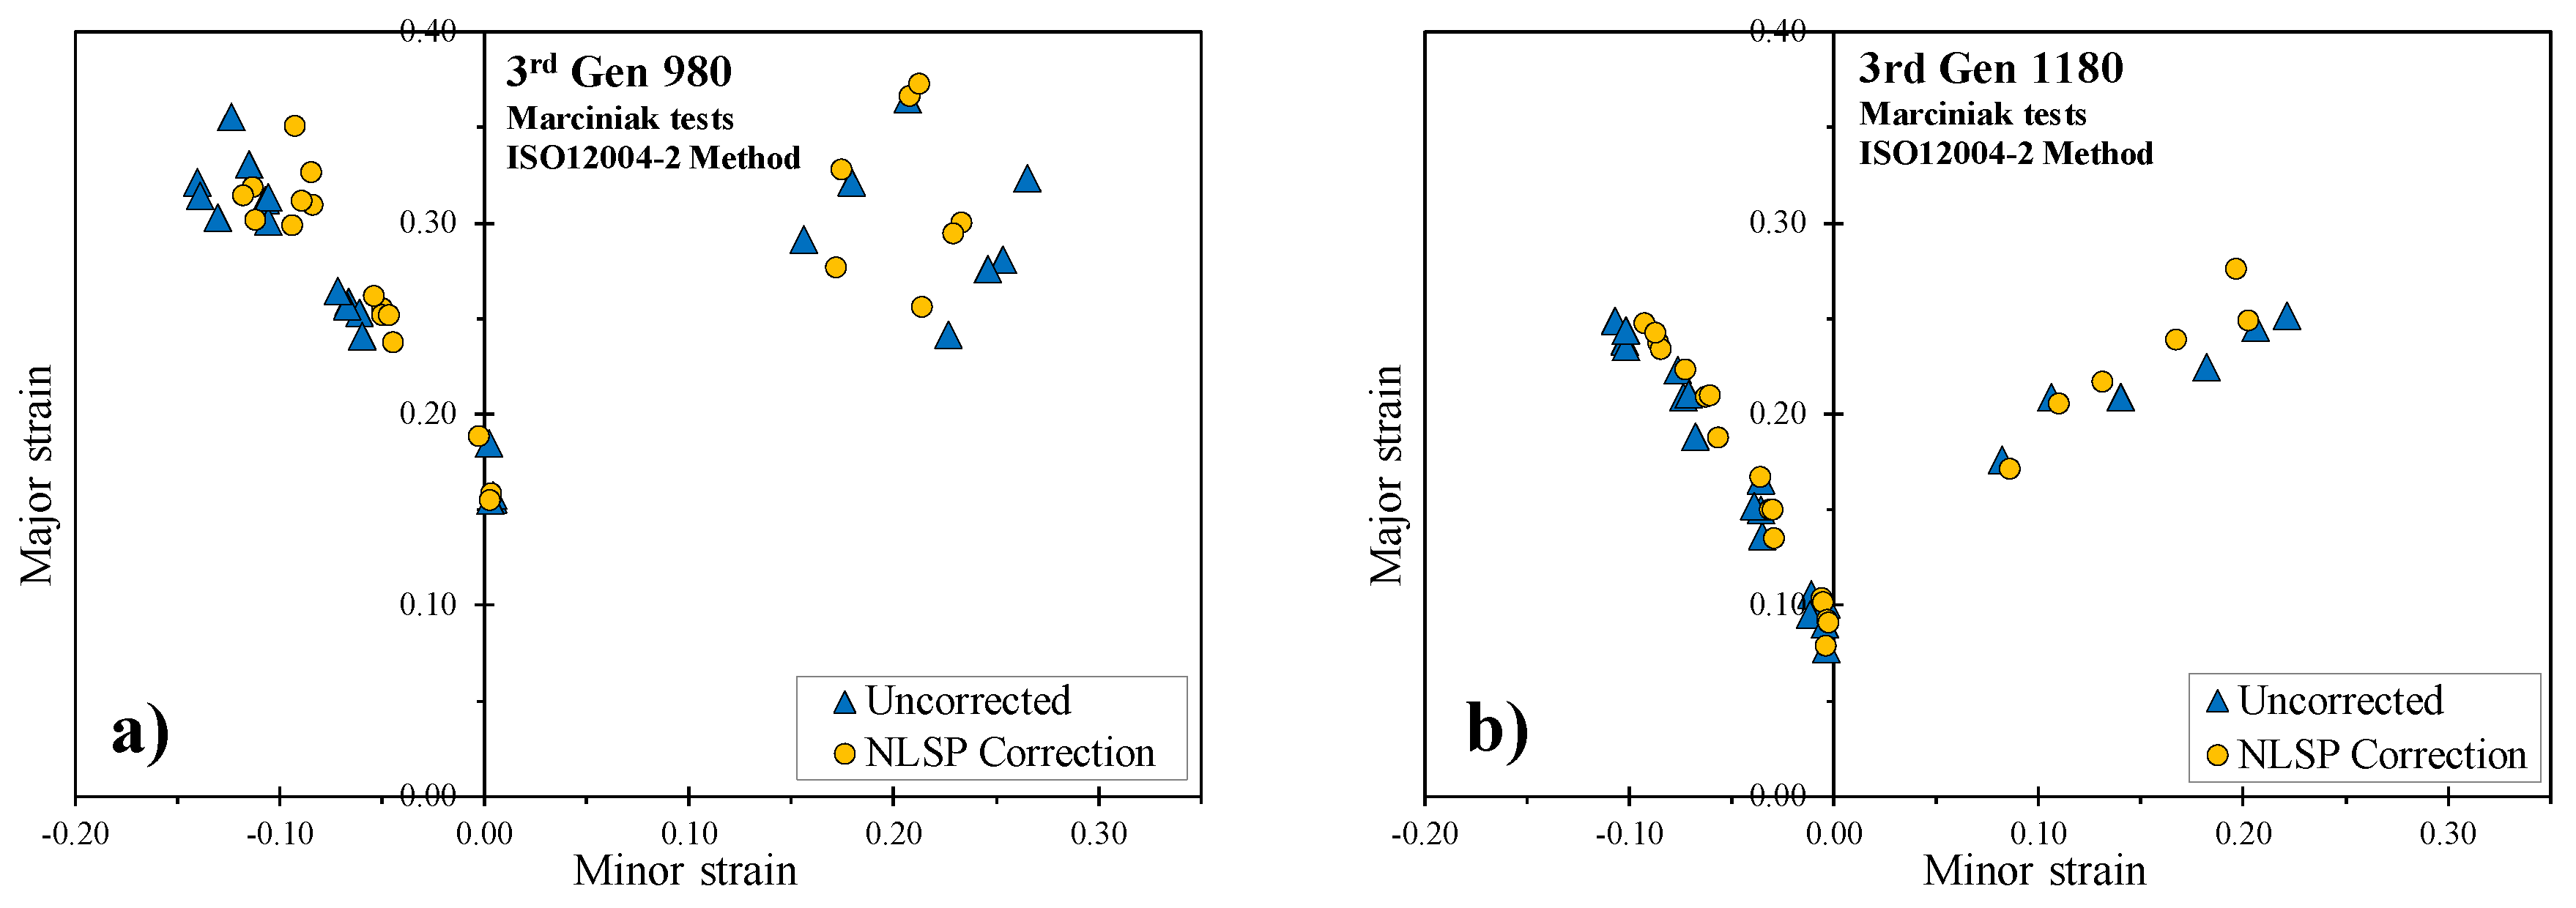
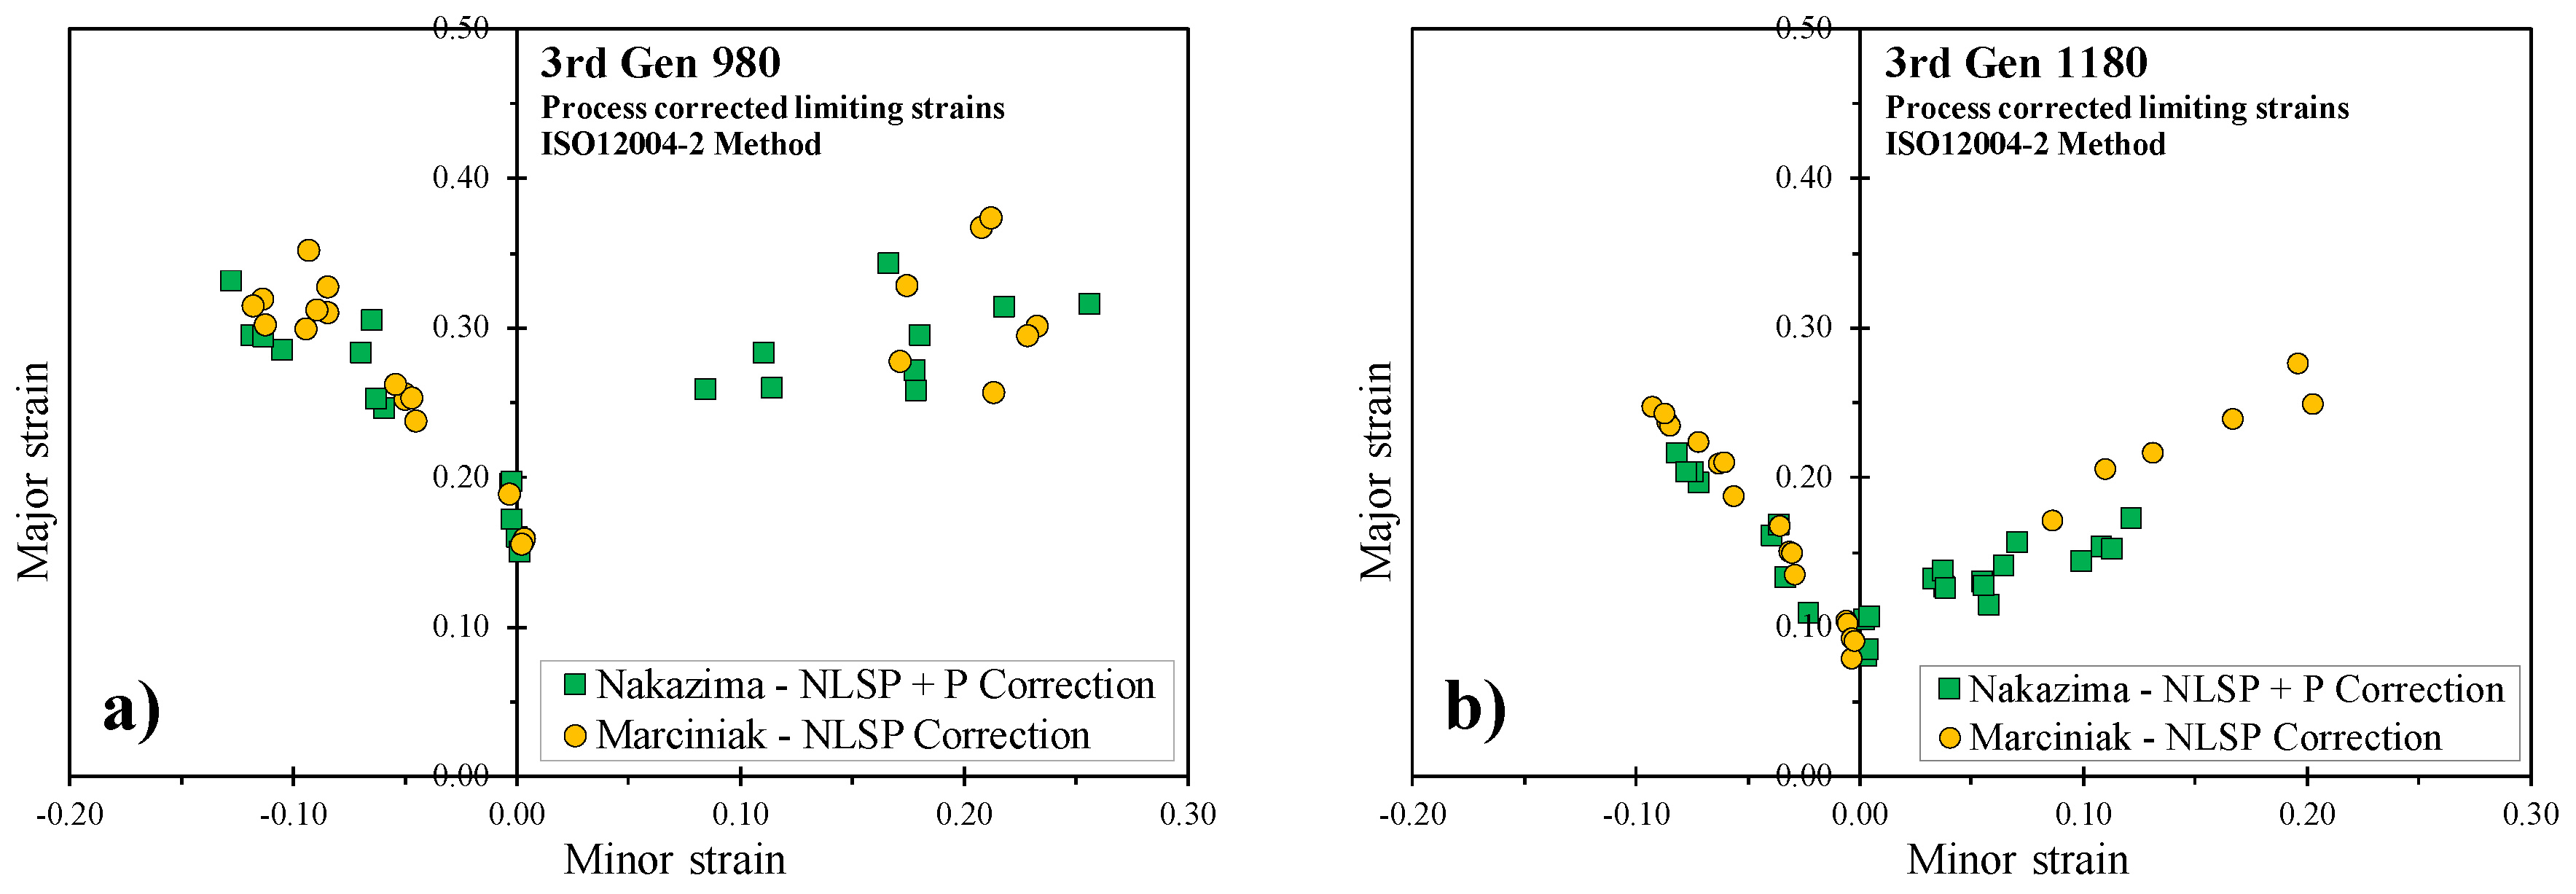
3.4. Process Corrections of the Limiting Strains

Direct comparison of analytical formability predictions under proportional in-plane stretching conditions in Section 5 requires the correction of the measured necking strains for process effects such as curvature, non-linear strain path, and through-thickness stress due to tool contact. Contrary to Nakazima tests, Marciniak tests do not require correction for contact pressure due to the presence of a carrier blank and curvature effects are negligible due to the use of the cylindrical punch. The strain paths in the Marciniak test are fairly linear (see Figure 10b and Figure 11b) with the only non-linearity arising from the transition to plane strain tension during localization. Thus, the non-linear strain path corrections for the Marciniak tests are expected to be minor. For the Nakazima tests, the process effects can be significant and the methodology of Min et al. [19] was adopted for this study and will be summarized for brevity.
For simplicity, the elastic strains are neglected by assuming a rigid-plastic material such that the DIC strains are taken as plastic strains. In light of the large radius of the Nakazima punch and the thin sheet gauges of the steels considered, the strain gradient through the thickness of the sheet caused by bending is assumed to be a second-order effect with respect to the influence of the contact pressure and non-linear strain path (NLSP). A procedure to account for the influence of curvature in both the major and minor strain directions and its influence on the through-thickness strain gradient in Nakazima tests was provided by Min et al. [19]. For more severe bending scenarios, such as the adoption of smaller punch radii, curvature corrections should be considered. The small degree of curvature due to crowning of the blank in Marciniak tests was shown by Min et al. [19] to have a negligible influence on the through-thickness strain gradient. The critical layer of material for necking in the Nakazima tests was taken as the inner layer that is in contact with the punch that will experience a compressive stress that will delay localization. The convex (outer) surface of the blank is in plane stress while the inner layer is in a three-dimensional state of stress.
The instantaneous principal strain ratio, ρ exp , can readily be computed from the ratio of the second principal to the first principal strain measured from DIC. Adoption of an associated flow rule provides the principal in-plane normal stress ratio, α :
ρ exp = d ε 2 d ε 1 = N 2 N 1 = σ e q / σ 2 σ e q / σ 1
α = σ 2 σ 1
The through-thickness stress ratio, χ , can be approximated from the equation provided by Min et al. [19]
χ = σ 3 σ 1 = t R 1 ( 1 + t 2 R 2 ) t R 2 ( 1 + t 2 R 1 ) α
t = t o exp [ ( 1 + ρ exp ) ε 1 ]
where R1 and R2 represent the principal curvature on the convex (outer) surface. Since strain localization for the two AHSS considered occurred at locations in close proximity to the specimen apex, the 50.8 mm Nakazima punch radius was selected for the curvature in both principal directions. Material thinning was approximated from Equation (8) where t0 and t refer to the initial and instantaneous sheet thickness, respectively.
The equivalent plastic strain, ε ¯ , at the initiation of necking can be computed by integration of the equivalent strain utilizing the incremental plastic work balance, where σ ¯ corresponds to the material flow stress and k represents the stress ratio of the first principal stress to the equivalent stress, σ e q , which is dependent upon the selection of yield function such that
ε ¯ ( α , χ ) = σ : d ε p σ ¯ = k ( α , χ ) [ 1 + α ρ exp ( 1 + ρ exp ) χ ] d ε 1
k ( α , χ ) = σ 1 σ e q ( α , χ )
The strain-path corrected principal strains, ε 1 l i n e a r and ε 2 l i n e a r , are obtained through linearization of the equivalent plastic strain using the instantaneous stress and strain state when the limit strain is reached as
ε 1 l i n e a r = ε ¯ k ( α , χ ) [ 1 + α ρ exp ( 1 + ρ exp ) χ ]
ε 2 l i n e a r = ρ exp ε 1 l i n e a r
In order to correct for the through-thickness stress caused by tool contact in the Nakazima test, Min et al. [19] adopted a phenomenological mapping from a 3D to a 2D stress state under the assumption of a constant in-plane stress ratio. The in-plane stress ratio of the triaxial stress state is utilized to determine the equivalent stress related to the in-plane stresses as, σ e q P S , in Equation (13). The corresponding equivalent plastic strain due to the in-plane loading, ε ¯ P S , is determined from inversion of the hardening law such that σ ¯ P S ( ε ¯ P S ) = σ e q P S . An effective in-plane strain ratio, ρ P S , is then calculated based upon the flow rule using only the in-plane stress ratio as follows
σ e q P S ( α ) = σ ¯ P S ( ε ¯ P S , α ) = σ 1 k ( α ) = k ( α , χ ) σ ¯ ( ε ¯ ) k ( α )
ρ P S ( α ) = d ε 2 d ε 1 = σ e q P S / σ 2 σ e q P S / σ 1
The principal limit strains for the effective plane stress state are readily determined from decomposition of the equivalent plastic strain as
ε 1 P S = ε ¯ P S k ( α ) [ 1 + α ρ P S ]
ε 2 P S = ρ P S ( α ) ε 1 P S
This phenomenological mapping procedure of the limit strains between 3D and plane stress states under a constant in-plane stress ratio was first suggested by Smith et al. [32]. Matin and Smith [33] reported that the methodology is sensitive upon the selection of hardening model and Noder and Butcher [18] showed that materials with low hardening rates are predicted to have limit strains that are strongly dependent upon the contact stress.
In the process correction methodology, the influence of the NLSP effects are first removed followed by the contact pressure. As expected, the NLSP corrections in Marciniak tests are minor as seen in Figure 14. Given the small magnitude of the NLSP correction and when weighed against the additional complexity introduced into the analysis and error associated with assuming a yield function and flow rule to integrate the equivalent strain, the NLSP could be neglected for the Marciniak tests.
In contrast to the relatively linear in-plane deformation encountered in the Marciniak tests, Nakazima tests are characterized by out-of-plane stretching. Due to the hemispherical punch, initial deformation is approximately biaxial bending which shifts the limit strains such that the FLC0 does not occur at zero minor strain. The NLSP correction is on the order of up to 0.04 average major strain for both 3rd Gen AHSS shown in Figure 15. The limit strains are shifted up and to the left which restores the lowest limiting strains to occur at approximately zero minor strain in plane strain tension.
Due to tool contact in the Nakazima test, the limit strains need to be corrected for the induced stress through the sheet thickness. Figure 16 demonstrates that the pressure corrections can be quite significant with a reduction in the average major strain of 0.04 to 0.07 for the 3rd Gen 980 and 0.06–0.10 for the 3rd Gen 1180 with respect to the NLSP corrected limit strains. Referring to Figure 3b, the 3rd Gen 1180 exhibits a lower hardening rate relative to the 3rd Gen 980 that directly affects the pressure corrections owing to the inversion of the hardening law.
A direct comparison of the corrected limiting strains acquired from the Marciniak and Nakazima tests for both AHSS are shown in Figure 17. Overall, the process-corrected limiting strains of the two test methodologies are in good agreement, particularly around plane strain tension and on the draw side of the FLC.

4. Analytical FLC Models

4.1. MK Model

The well-known MK model is based upon deformation of a sheet metal in plane stress that has a thickness imperfection in the form of a band inclined at an angle, θ , visualized in Figure 18. Deformation is proportional and homogeneous in the region outside of the imperfection band, denoted with subscript ‘a’, and the material inside the imperfection band, denoted with subscript ‘b’. Deformation is prescribed upon the homogeneous zone and deformation within the band is governed by the equilibrium and compatibility equations at the boundary of the band that lead to
σ n n b = σ n n a f ,  
σ n t b = σ n t a f ,
d ε t t a = d ε t t b
where the components of stress and strain are denoted with a subscript, nn for normal to the band, tt, for tangential to the band and nt to denote shear in the band. The thickness imperfection factor, f, evolves with deformation as
f = f 0 exp ( ε 3 b ε 3 a )
Localization has occurred when the equivalent plastic strain increment in the imperfection band is 10 times greater than the equivalent plastic strain in the homogenous zone. The Newton-Raphson solution procedure of Butuc [34] to integrate the MK model was adopted in the present work. For each proportional stress state, the limit strains were evaluated for band angles in 2 degrees increments and the lowest strains for all of the bend angles were taken as the limit strains.
Predicted limit strains by the MK model can be highly sensitive to the selection of the imperfection factor as shown by Ratchev et al. [35]. Barlat and Jalinier [36] reported an imperfection factor of 0.996 to be reasonable based on imperfections of commercial sheet metals that was adopted in this study. The thickness imperfection factor can also be approximated from the surface roughness (refer to Table 1) which yielded an imperfection factor of 0.9992 and 0.9993 for the 3rd Gen 980 and the 3rd Gen 1180, respectively. The imperfection factor is often calibrated based upon a best-fit calibration to the FLC or can be calibrated using only the limit strain in plane strain using the solution of Soare [10]. These strategies are not considered in the present study because the MK predictions are no longer deterministic and require a priori knowledge of the limit strains.

4.2. MMFC Model

The MMFC model was proposed by Hora et al. [9] and is based upon the model of Swift [37] for the initiation of diffuse necking. Hora et al. [9] introduced a second term in Equation (21) to describe the change in the first principal stress with respect to the strain ratio to account for the change in the stress and strain state towards plane strain tension where an acute neck has formed such that
d σ 1 d ε 1 + d σ 1 d ρ σ 1
The derivative of the major stress with respect to the strain ratio is
d σ 1 d ρ = d σ 1 d α d α d ρ = σ ¯ d k d α / ( d ρ d α )
where
d ρ d α = 1 N 1 ( d N 2 d α ρ d N 1 d α )
N i = σ e q σ i
The limit strains in the MMFC model are identified when the strain state has transitioned to plane strain tension corresponding to ρ = 0. The limit strains are therefore obtained under a non-linear path which is in contrast with the experimental limit strains that have been corrected for NLSP and process effects. This is an inconsistency in the MMFC model that does not appear in the MK model since the strains outside of the band are reported as the limit strains. Therefore, a linearized version of the MMFC model is required for consistency with the FLC test data and comparison with other analytical models. The average strain path was selected for linearization of the MMFC predictions by averaging the strain history ρ ¯ , that is computed by integrating the equivalent plastic strain as
ρ ¯ = 1 ε ¯ ρ d ε ¯
The average stress ratio, α ¯ , is then determined from the flow rule using ρ ¯ and the linearized principal strains are obtained following Equations (15) and (16).

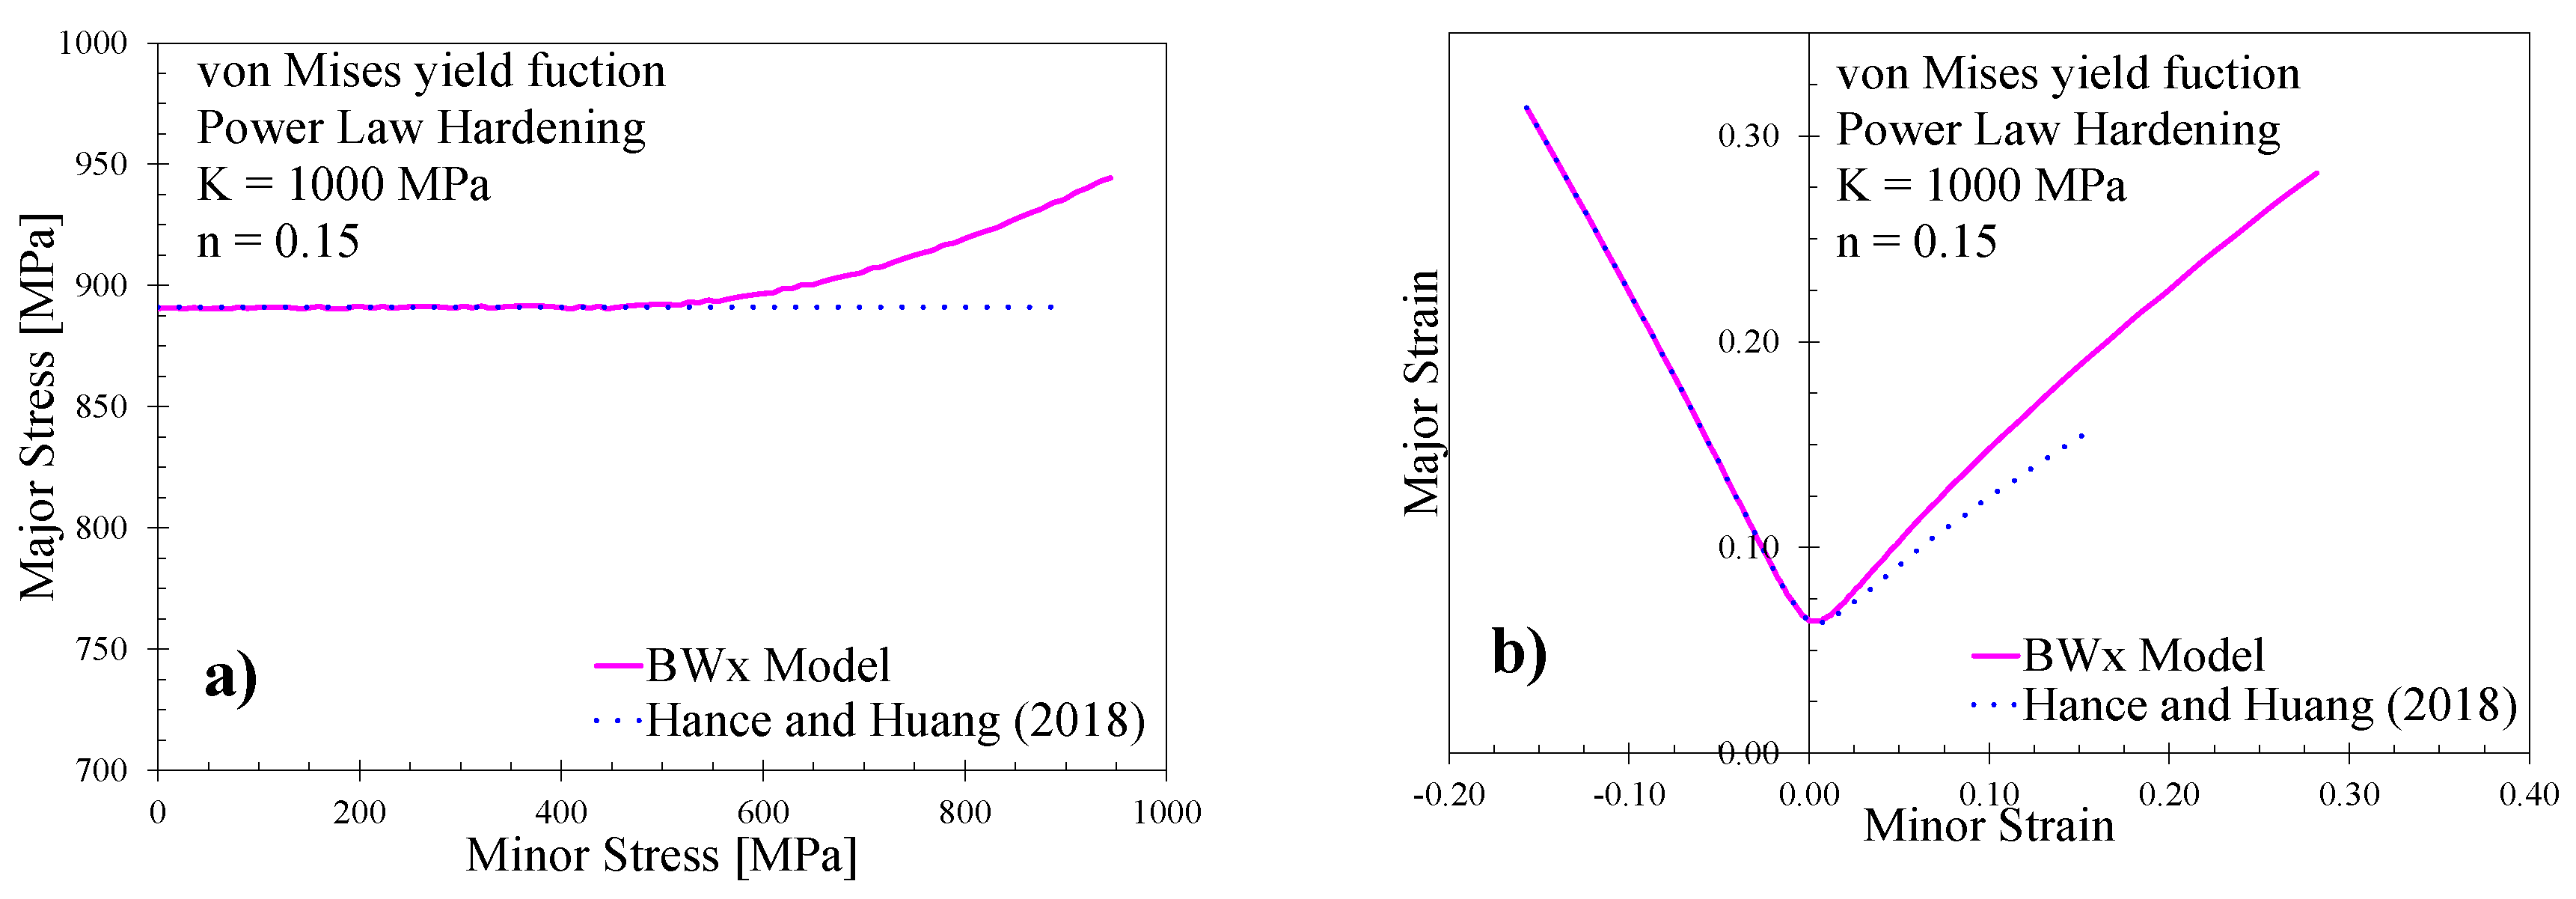
4.3. Bressan-Williams-Hill Model

Bressan and Williams [21] postulated an instability criterion where localization occurs through the thickness of the sheet in plane stress biaxial stretching at the angle of zero-extension, ϕ , which correlated well with the post-test fracture surfaces for the 3rd Gen 1180 in Figure 13. The zero-extension direction during biaxial stretching is illustrated in Figure 19 where a strain transformation yields the through-thickness localization angle as
cos 2 ϕ = ρ 2 + ρ ,   ρ 0
In the BW model, it is assumed that the through-thickness instability will occur when the local shear stress reaches a critical shear stress as
τ c r = σ 1 2 sin 2 ϕ = k ( α ) σ ¯ ( ε ¯ ) 1 + ρ 2 + ρ ,   ρ 0
The critical shear stress is taken as a material constant. In the present study, the critical shear stress is identified in plane strain tension from the maximum force criterion of Swift [37] which is also identical to the solution of Hill [38] for plane strain tension. The formation of an acute neck in the zero-extension model of Hill [38] is predicted to occur when
k ( α ) d σ ¯ d ε ¯ = σ ¯ ( 1 + ρ 1 + α ρ ) ,   ρ 0
The critical shear stress for the BW model in Equation (27) is determined by evaluating Equation (28) in plane strain with α identified from the yield function corresponding to ρ = 0 . The BW model is restricted to biaxial stress states so that Hill’s [38] zero-extension model of Equation (28) is used for uniaxial stretching to form the so-called BWH model proposed by Alsos et al. [39]. Localized necking occurs in-plane at the zero-extension angle shown in Figure 18 and is denoted by
θ = tan 1 ( ρ ) , ρ 0

BWx Model

The BWH model is consistent in terms of its formulation based upon localization along the zero-extension direction but is inconsistent in that the limit strains in biaxial tension are based upon a critical shear stress whereas this parameter is excluded in uniaxial stretching. Therefore, we can propose a simple extension of the BW model, denoted as BWx, that also uses the critical shear stress for the draw side of the FLC instead of the Hill solution such that
τ c r B W x = { σ 1 2 = k ( α ) σ ¯ ( ε ¯ ) 2 , ρ 0 σ 1 2 sin 2 ϕ = k ( α ) σ ¯ ( ε ¯ ) 1 + ρ 2 + ρ , ρ 0  
This BWx model could alternatively be viewed as a modification of the maximum normal stress model used by Hance and Huang [40] to predict the formability of 3rd Gen AHSS. The maximum normal stress model is equivalent to idealizing a stress-based FLC to be a flat line that is independent of the minor stress which is visualized in Figure 20a. To visualize the representation of the stress-based FLC in principal space, a power law hardening material with n = 0.15 and the von Mises yield function were arbitrarily adopted to generate Figure 20b. It is important to note that for plane stress states from uniaxial to biaxial tension, the maximum shear stress and maximum normal stress only differ by a factor of two, and thus would predict the same FLC if the model was defined in terms of the normal stress or shear stress. Therefore, we will refer to the model of Hance and Huang [40] as a maximum shear stress criterion for consistency with the BW model. The BWx model retains the critical shear stress for the draw side as done by Hance and Huang [40] but instead uses the BW model for biaxial stress states where localization occurs through-thickness. No new parameters are introduced into the BWx model.

5. Results

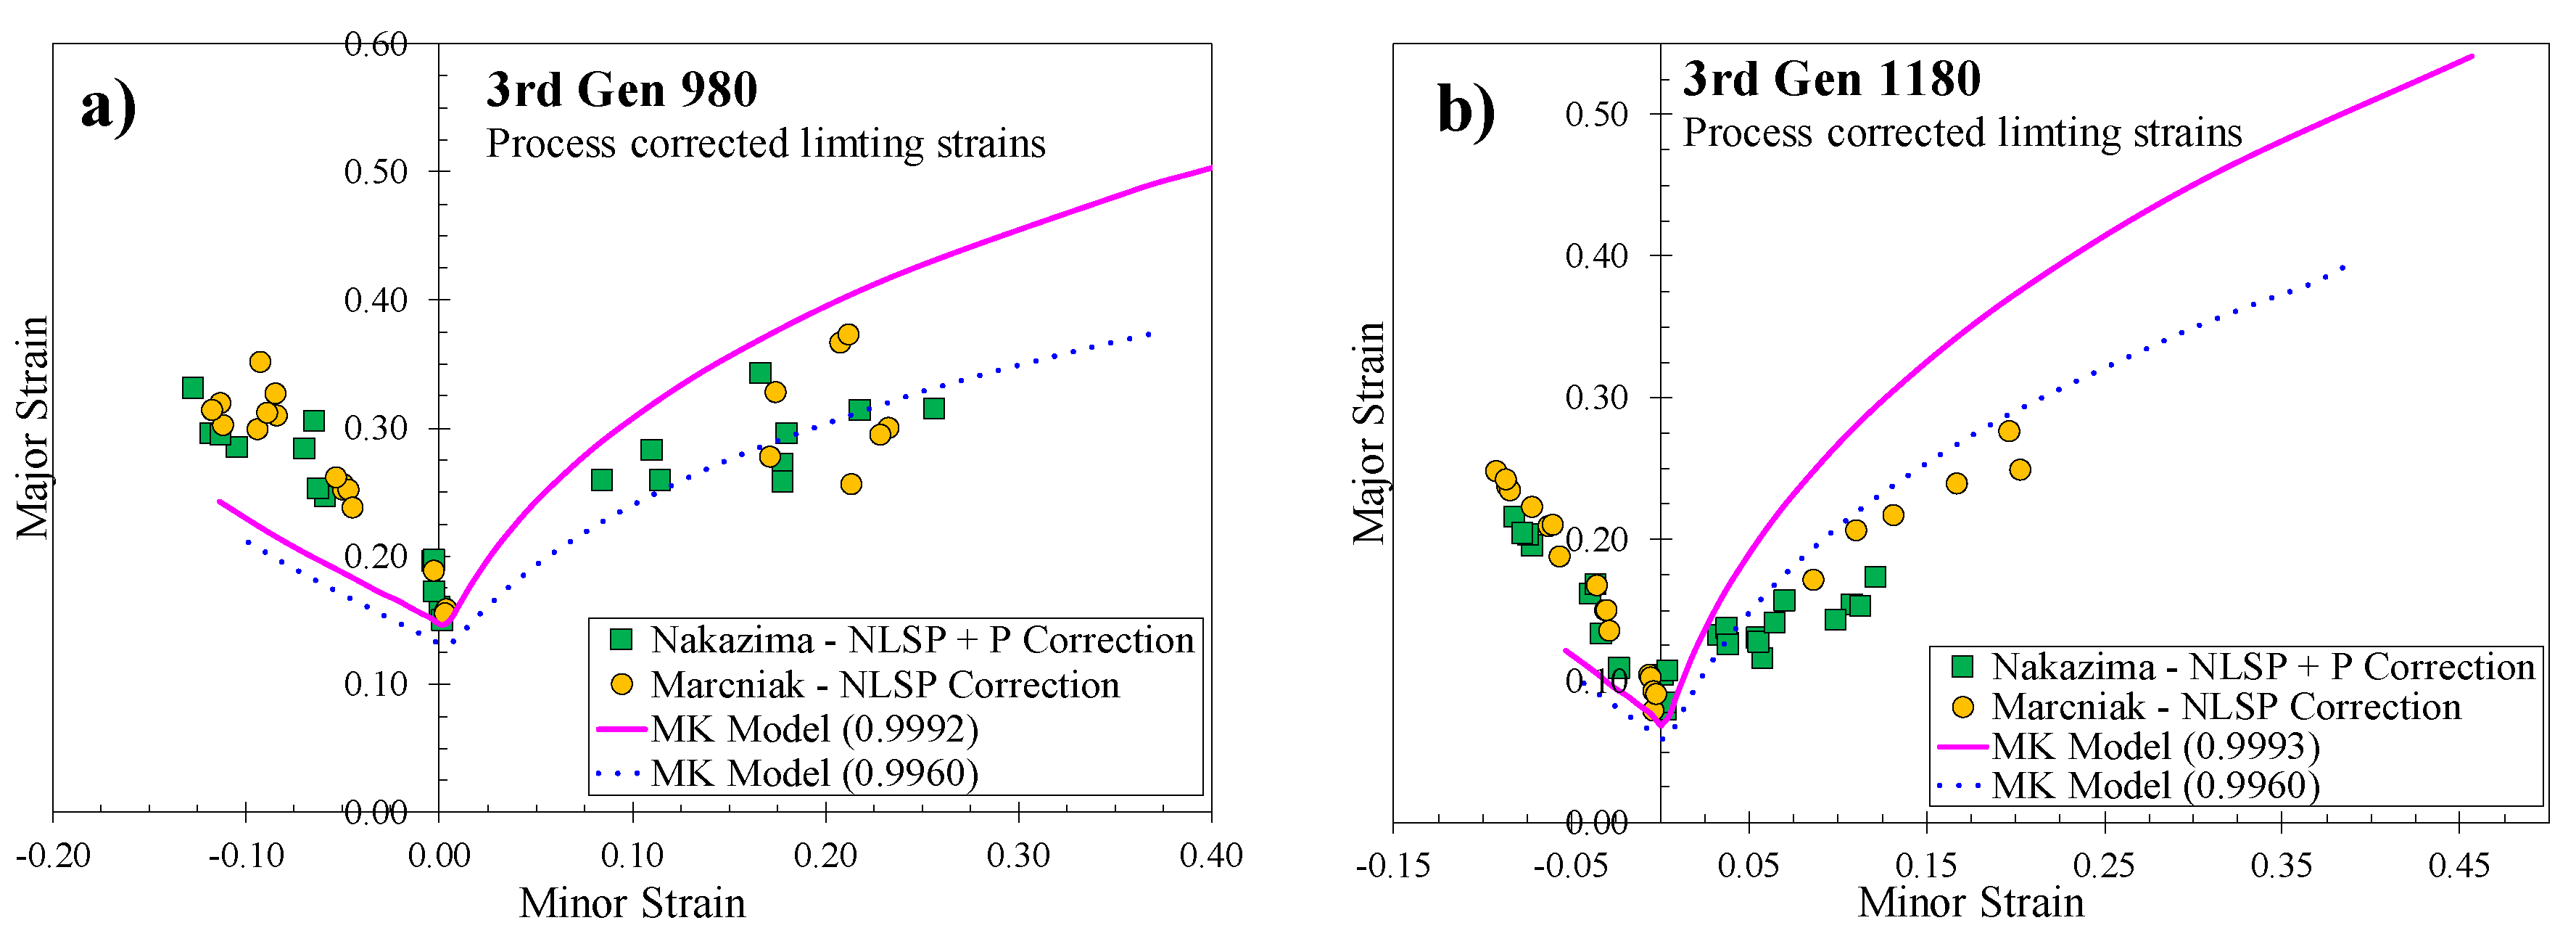
5.1. MK Model Predictions

The analytical FLC predicted by the MK model using the imperfection factor of 0.996 proposed by Barlat and Jalinier [36] can well describe the limit strains in biaxial stretch but underestimates the limit strains in uniaxial tension for both steels shown in Figure 21. Using alternate imperfection factors based on the surface roughness did not lead to improved predictions for either steel since the entire FLC was shifted upwards that led to a marked overprediction of the biaxial limit strains. A marginal increase in the draw side limit strains was observed but was not sufficient to appreciably improve the agreement. The larger effect of the choice of imperfection factor for biaxial strain paths relative to the draw side of the FLC was also noted by Chan et al. [41] and Ratchev et al. [35]. It has been reported in literature that MK model predictions on the draw side are significantly more sensitive upon strain-rate effects relative to the biaxial side [42]. Zhang et al. [43] reported a 73% increase in the limit strains for uniaxial tension whereas the biaxial FLC only increased by 12% when the strain rate index was increased from 0.01 to 0.04. For consistency with the other quasi-static analytical models considered in the study, no strain rate sensitivity has been included in the MK model.

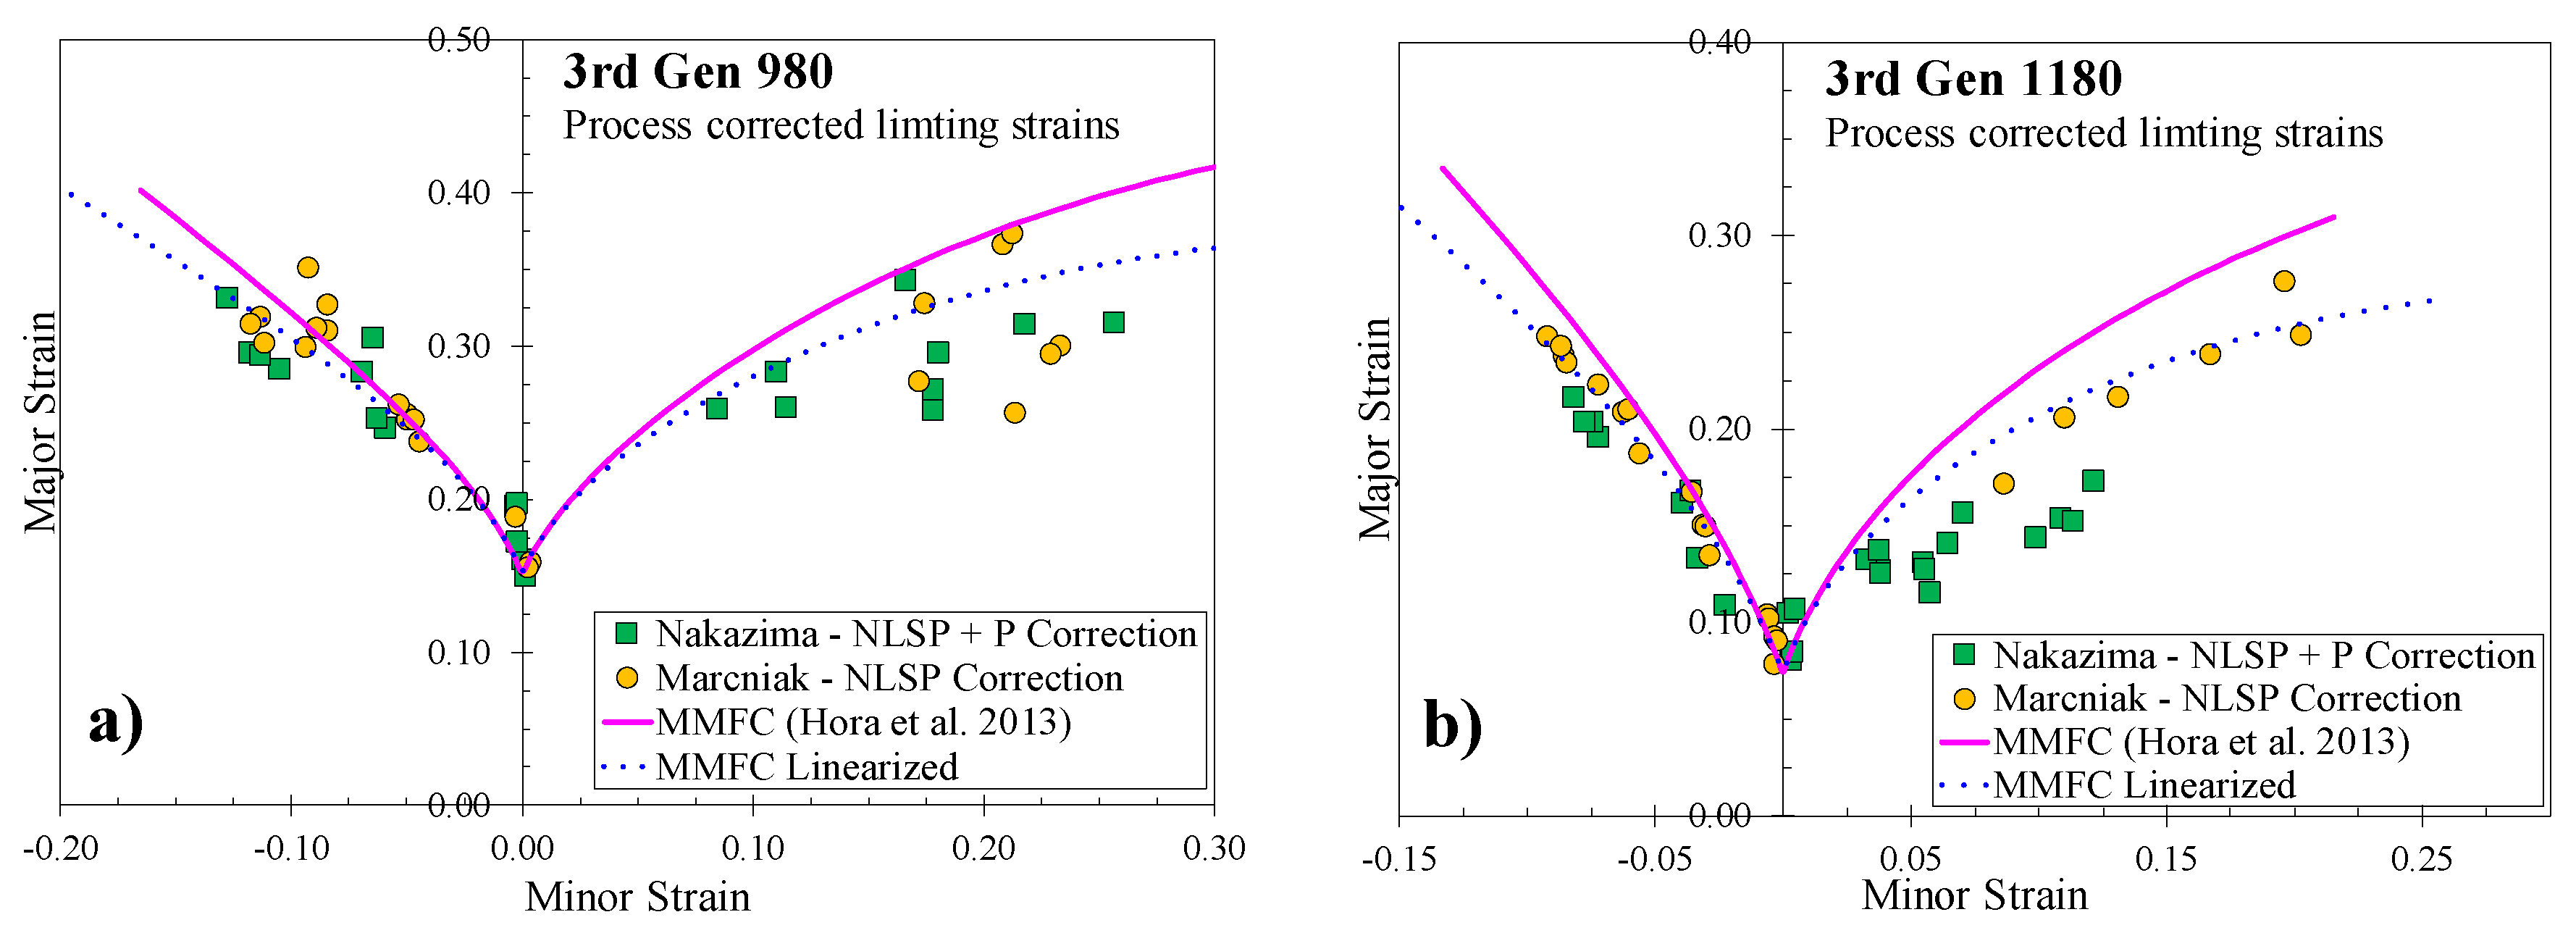
5.2. MMFC Model Predictions

A comparison of the MMFC model by Hora et al. [9] and its linearized form is depicted in Figure 22. For both steels, the predicted FLC0 limit strain is in very good agreement with the process-corrected limit strains. The differences between the two MMFC variants are prominent on biaxial stretching where the strains are largest and the NLSP effects are magnified. The MMFC predictions are somewhat higher and represent the upper limit of the experimental limit strains whereas the linearized version shows better correlation with the overall FLC trend for each material. Most importantly, the linearized version of the MMFC is more consistent with the underlying assumption of a linear strain path and does not introduce any calibration parameters into the model.

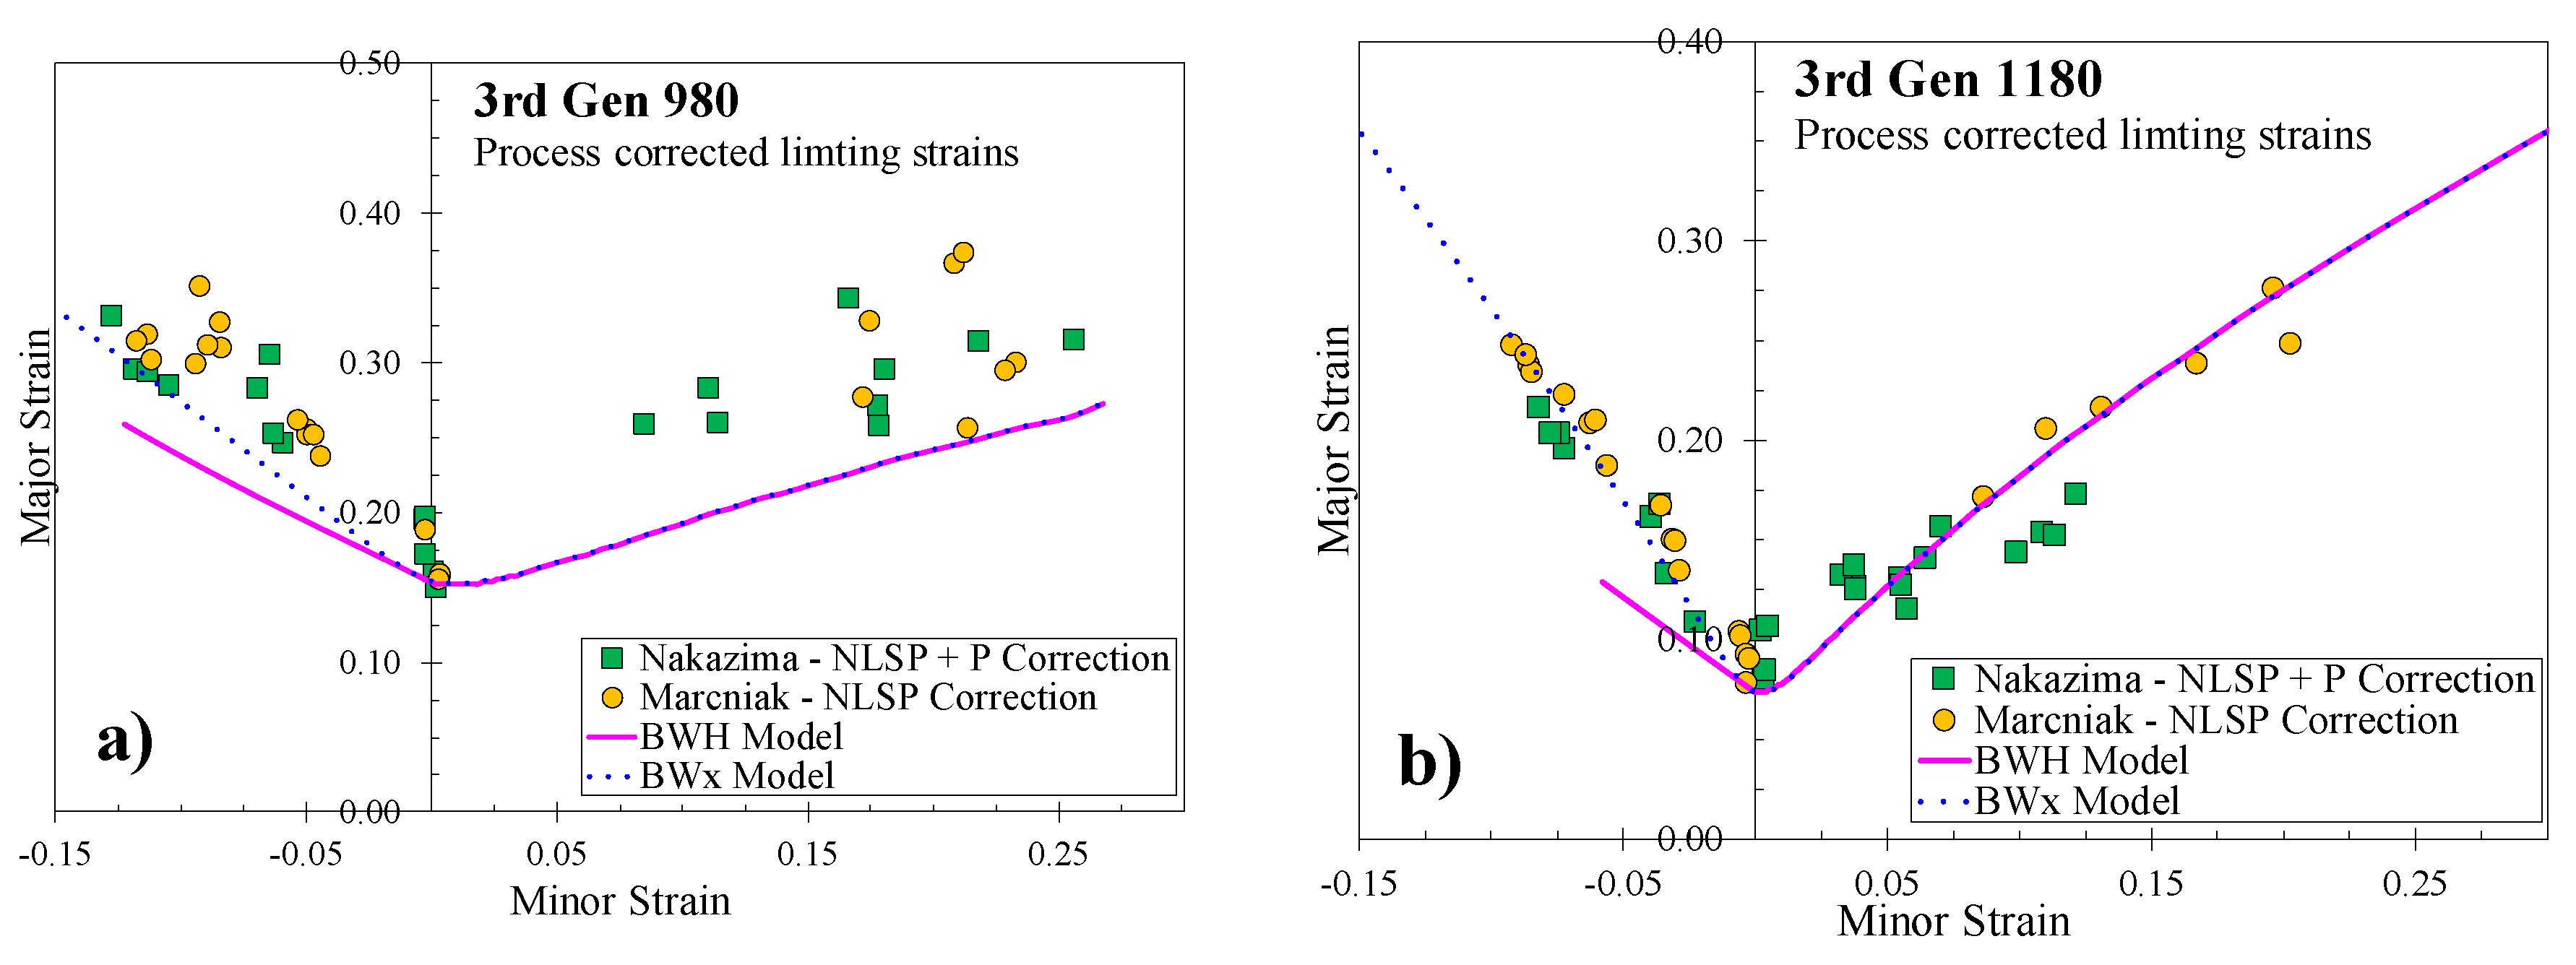
5.3. BWH and BWx Model Predictions

A comparison of the predicted FLC using the BWH and BWx models for each steel is shown in Figure 23. In biaxial tension for which both models are equivalent and follow the BW criterion, the predictions are conservative for the 3rd Gen 980 and excellent for the 3rd Gen 1180 steel. This is consistent with the experimental observations of the fracture modes in Section 3.3 where the 3rd Gen 1180 displayed marginal necking with through-thickness shear fracture compared to the 3rd Gen 980, which showed more necking. The MK model based on tensile localization was better able to predict the biaxial limiting strains for the 3rd Gen 980 and slightly overestimated the limit strains for the 3rd Gen 1180 AHSS.
On the draw side, the limit strains predicted by Hill’s zero-extension criterion in the BWH model are similar to the MK model and significantly underestimated the formability of both steels. The BWx model predictions show a marked improvement over the Hill model, particularly for the 3rd Gen 1180. It is interesting that the rather simple BWx model can predict the FLC to such good agreement to be comparable to the more sophisticated MMFC and MK models. Overall, the BWx model appears to provide improved predictions on the draw side of the FLC compared to the BWH model and can accurately predict the biaxial limit strains for materials that exhibit a strong sensitivity to through-thickness localization such as the 3rd Gen 1180 steel. Otherwise, the predicted biaxial limit strains will be underpredicted using the BW model for materials that have more tensile localization and thinning such as the 3rd Gen 980 steel.

6. Discussion

Three analytical models to predict the FLC using only material property data have been evaluated for both 3rd Gen AHSS. It is now instructive to compare the most successful variants of each model to evaluate their predictive accuracy. To draw conclusions on the models across a larger data set, an aluminum alloy, AA5182, and a dual phase steel, DP980, characterized by Noder and Butcher [18] will also be revisited with the linearized MMFC, MK model, and the BWx model. The AA5182 will be shown to be provide an interesting counterpart to the three AHSS as a consequence of its saturation-type behavior at large strains and higher or non-quadratic yield functions representative of a Tresca-type yield function.

6.1. Comparison of Analytical FLC Predictions for 3rd Gen AHSS

A comparison of the three analytical models with the in-plane limit strain data is presented in Figure 24 and Figure 25 for the 3rd Gen 980 and the 3rd Gen 1180, respectively.
In biaxial stretching, the MK and linearized MMFC models predicted similar limit strains that are in excellent agreement with the experiment values while the BWx model systematically underpredicted the biaxial limit strains. On the draw side of the FLC, the MK model predictions are conservative while the MMFC and BWx models can both predict the limit strains within the variation of the test data. While the MMFC and BWx models both accurately predict the FLC0 from the diffuse necking limit in plane strain, the MK model will always predict a lower FLC0 value due to the imperfection factor [10].
For the 3rd Gen 1180 AHSS, the BWx and the linearized MMFC models provided the best overall agreement while the MK significantly underestimated the draw side limit strains and slightly overestimated the biaxial strains. The simple BWx model was able to accurately describe the FLC which is consistent with the observed sensitivity of the 3rd Gen 1180 to shear failure. The MMFC and MK models that cannot account for through-thickness shear failure both tended to overestimate the biaxial limit strains as a result. However, the MMFC model did provide accurate predictions on the draw side of the FLC while the MK predictions were very conservative, which might be attributed to the absence of a strain-rate dependent constitutive model.

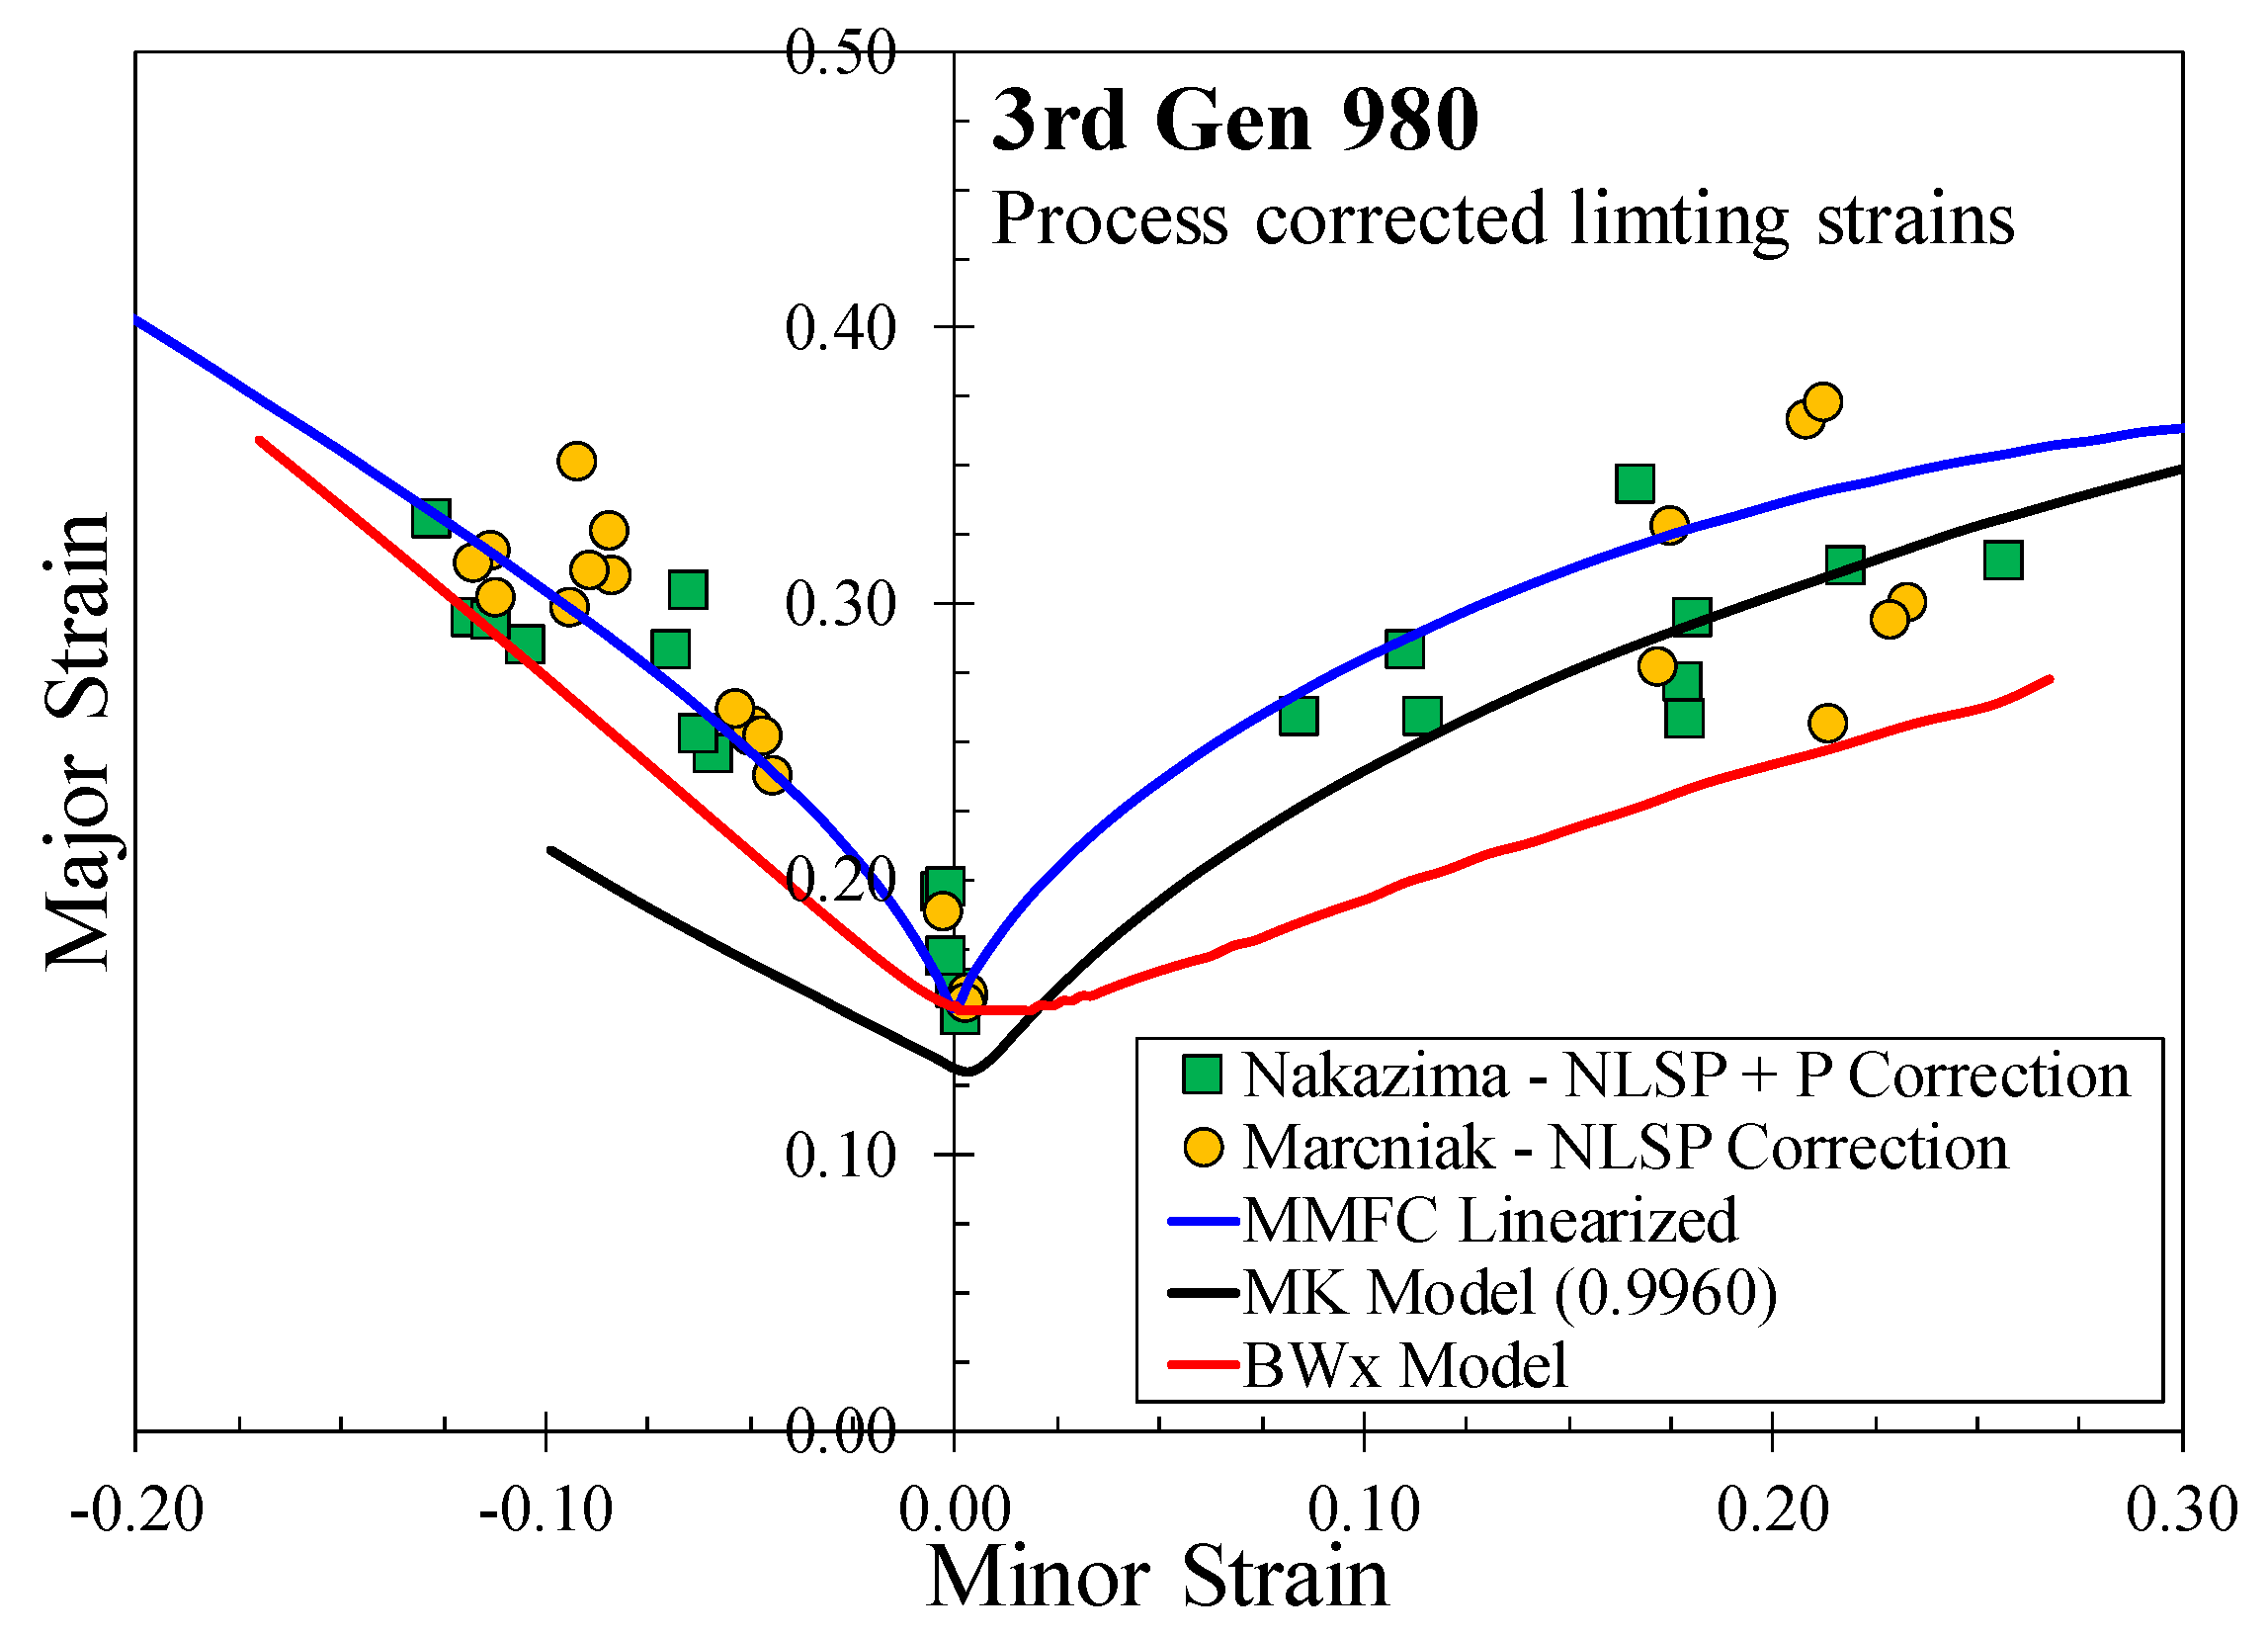
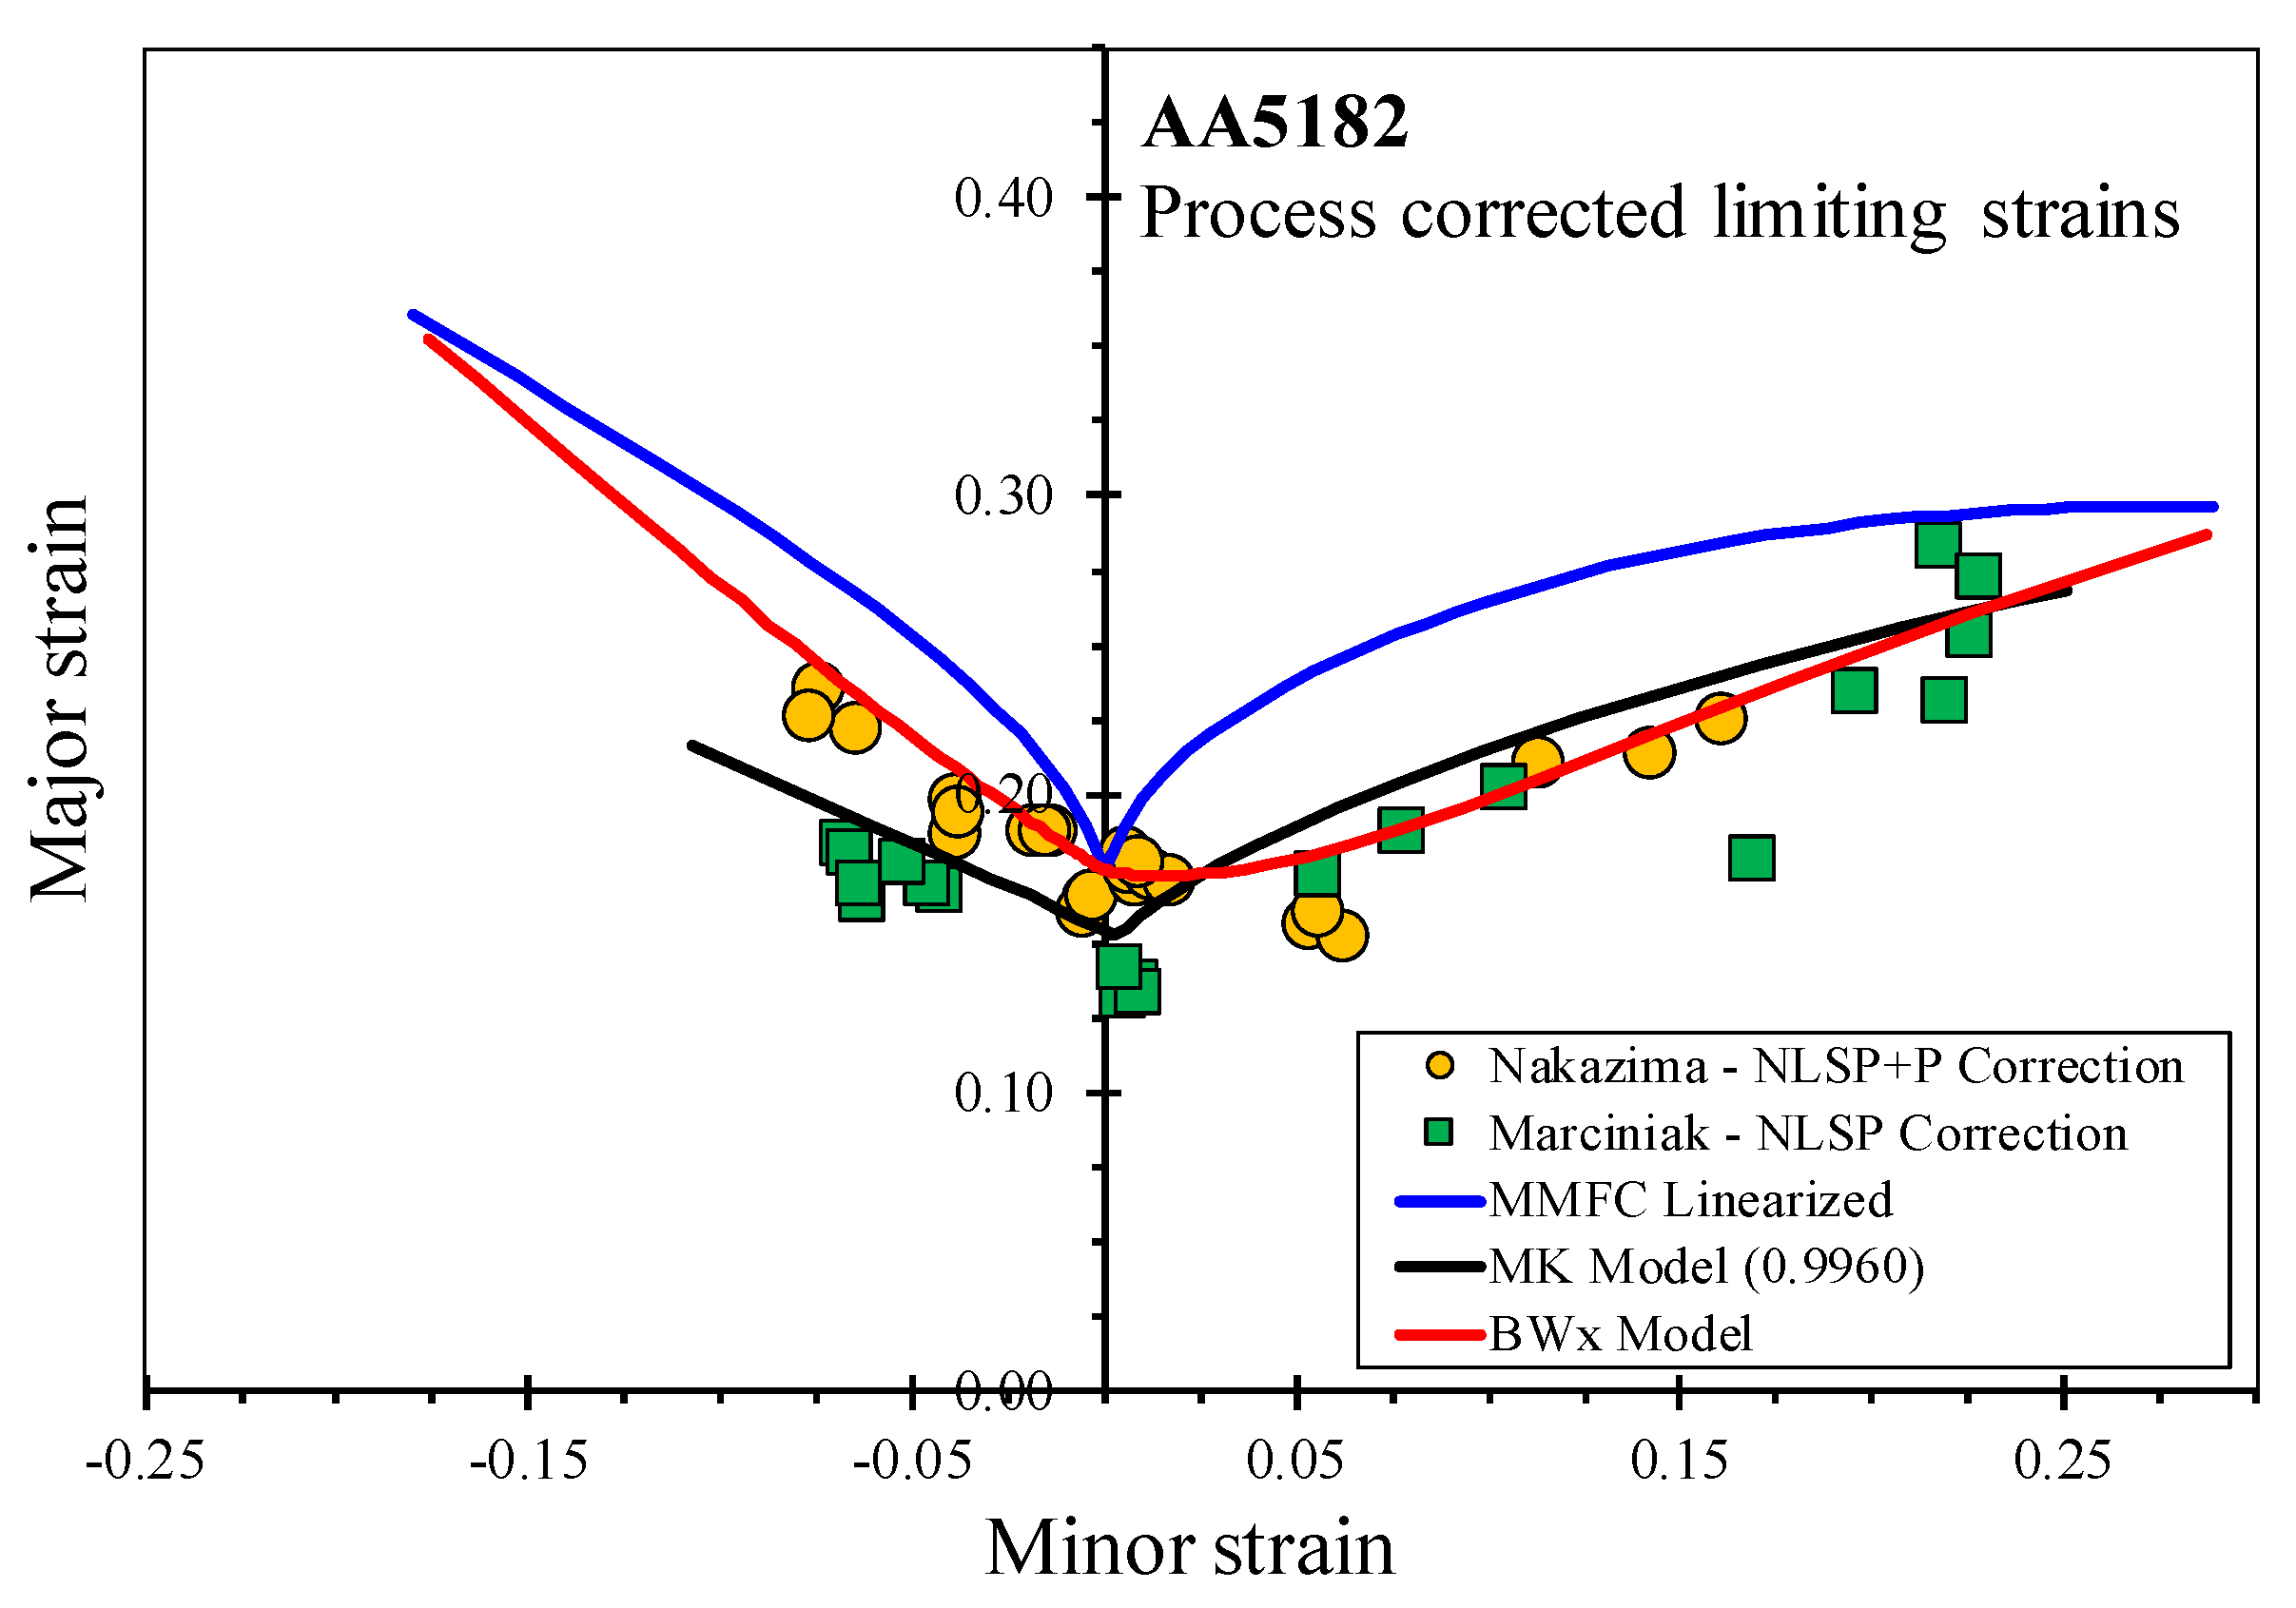
6.2. Application to DP980 and AA5182

To evaluate the proposed framework for FLC characterization and prediction to a larger range of automotive alloys, the AA5182 aluminum and DP980 AHSS of Noder and Butcher [18] who reported Marciniak and process-corrected Nakazima FLC data, are revisited. The limit strains were determined from a modified linear best fit (LBF) method by Volk and Hora [44].
Detailed characterization data for plastic anisotropy for the two alloys was not provided so the DP980 is assumed to follow the isotropic Hosford yield criterion with an exponent of 6 and an exponent of 8 for the AA5182. The AA5182 hardening model was calibrated to strain levels beyond the diffuse necking limit obtained in tensile tests while reflecting the plastic uniform elongation using the modified Generalized Voce model defined as
σ ¯ = B 1 + ( B 2 + B 3 ε e q p ) ( 1 exp ( B 4 ε e q p ) )
The MHS model hardening model in Equation (3) was used for the DP980 steel. The calibrated material coefficients are summarized in Table 6 and Table 7.
The critical shear stress in the BWx model was also determined from the hardening model and assumed yield functions of the DP980 and AA5182. The same MK imperfection factor of 0.996 was also employed and the MMFC model contains no calibration parameters.
The FLC predictions of the three models for the DP980 are consistent with the observations for the 3rd Gen AHSS as shown in Figure 26. On the draw side, the MMFC and BWx models provide excellent agreement with the limit strains whereas the MK model is very conservative. For biaxial stretching, all of the models predict similar limit strains that are in good overall agreement with the measured limit strains. The BWx model is slightly conservative with the linearized MMFC providing the best overall predictions. For AHSS, the linearized MMFC appears to be preferable or the simple BWx if the steel is sensitive to through-thickness shear fracture in biaxial stretching. The MK model systematically underestimated the draw side of the FLC for the three AHSS considered in the paper and is better suited for the biaxial limit strains.
A comparison of the predicted FLCs for the AA5182 is presented in Figure 27. The linearized MMFC model did not predict the aluminum FLC as accurately as it did for the AHSS. The shape of the FLC does not resemble the experimental FLC and the limit strains are systematically overestimated. For the AA5182, the termination criterion of the MMFC model based on the strain path reaching plane strain appears problematic although it worked very well for the three AHSS considered. It is possible that this can be attributed to the omission of strain-rate sensitivity in the analysis. AHSS have positive rate sensitivity that stabilizes the neck and slows the transition to plane strain. The termination criterion of reaching plane strain while neglecting rate dependence may be offsetting the error for the AHSS within the MMFC model such that good limit strain predictions were still obtained. For the AA5182, which has been reported to exhibit negative rate sensitivity at room temperature [45], the localization process would be accelerated and the termination criterion of reaching a plane strain condition may not be appropriate.
In contrast to the MMFC model, the MK and BWx models are both able to predict the FLC of the AA5182 with excellent agreement in biaxial stretching. The limit strains generated by the MK model in the biaxial region are widely known to be dependent upon the yield exponent and in particular the ratio of the plane strain yield strength to the biaxial yield strength [27]. The high yield exponent of 8 for the aluminum in the Hosford model reduces this critical ratio compared to the quadratic von Mises yield function and enabled the correct prediction of the shape and magnitude of the FLC in biaxial stretching. Similarly, the BWx model also captures this effect since there will be a smaller difference in the limit strains based on a critical shear stress as the yield surface becomes flatter with higher exponents. On the draw side of the FLC there is some variation within the measured limit strains with both the BWx and MK models describing the upper and lower bounds of the data, respectively. Although additional aluminum alloys should be investigated to support these conclusions, the MK and BWx models appear to be preferable for the aluminum while the linearized MMFC and BWx performed well for the AHSS with the MK better suited for the biaxial limit strains.

7. Conclusions

From the current study of three variants of AHSS and a disparate aluminum alloy, an objective and deterministic approach to analytically predict forming limit strains has been developed. Different variants of the commonly used analytical FLC models for in-plane stretching were considered with modifications proposed for the MMFC and BW models to improve their predictive accuracy without adding new calibration parameters. Only mechanical property data from tensile and shear tests was required to objectively predict the FLC for in-plane stretching to avoid calibration bias. The following conclusions can be drawn from this study:
  • Finite element simulations of uniaxial tensile tests confirmed that the experimental shear conversion methodology proposed by Rahmaan et al. [20] provides a reliable technique to accurately obtain the material hardening response of AHSS to large strains that is suitable for formability prediction.
  • Nakazima forming limit curves should be corrected for process effects associated with out-of-plane deformation to be consistent with analytical formability models for proportional plane stress loading.
  • The MK model, when evaluated deterministically using an assumed imperfection factor of 0.996, predicted the biaxial limit strains to good agreement but were too conservative for the uniaxial tension of the three AHSS. The best performance of the MK model was found for the AA5182 aluminum.
  • The BWH model was found to be unsatisfactory on the draw side of the FLC due to its reliance upon the Hill model. The proposed extension to the BW model to employ the maximum shear stress criterion on the draw side (BWx model) led to superior formability predictions without adding any new parameters. Aside from its simplicity, the BWx model is particularly attractive for materials sensitive to through-thickness shear such as the 3rd Gen 1180 and performed well for AA5182.
  • Among the studied analytical models, the linearized MMFC [9] proposed in this study showed a superior correlation with experiments for the three AHSS but overestimated the formability of the AA5182. The predicted necking strain in the MMFC was linearized over the average strain path to be more consistent with the process-corrected forming limit strains for in-plane stretching.

Author Contributions

J.E.G., J.N., and C.B. contributed in the technical analysis and preparation of this manuscript. All authors have read and agreed to the published version of the manuscript.

Funding

This study was funded by the American Iron and Steel Institute Automotive Program, the National Science and Engineering Research Council (NSERC) of Canada and the Ontario Centres of Excellence (OCE).

Acknowledgments

The authors would like to acknowledge Hesham Ezzat of AISI, Jim Dykeman, Cameron O’Keeffe and Skye Malcolm of Honda Research Americas (HRA), and Neil Parker of Bowman Precision Tooling for their many valuable insights and discussions on the formability of AHSS that helped to guide this study.

Conflicts of Interest

The authors declare no conflict of interest.

Appendix A. Process Corrected Limiting Strains

Table A1. Forming Limiting strains and process corrected limit strains for the 25.4 mm wide 3rd Gen 980 samples.
25.4 mm Wide 3rd Gen 980 Samples
-NakazimaMarciniak
RepeatLimit StrainsAfter NLSP CorrectionAfter Pressure CorrectionLimit StrainsAfter NLSP Correction
-ε1ε2ε1ε2ε1ε2ε1ε2ε1ε2
R10.32−0.110.32−0.110.29−0.100.32−0.140.32−0.11
R20.32−0.120.33−0.120.30−0.120.30−0.130.30−0.11
R30.36−0.130.37−0.130.33−0.130.31−0.140.31−0.12
R40.36−0.130.37−0.130.33−0.13XXXX
R50.32−0.110.33−0.120.29−0.11XXXX
Av0.33−0.110.34−0.120.30−0.120.31−0.140.31−0.11
Std0.020.010.020.010.020.010.010.010.010.00
Table A2. Forming limit strains and process corrected limit strains for the 50.8 mm wide 3rd Gen 980 samples.
50.8 mm Wide 3rd Gen 980 Samples
-NakazimaMarciniak
RepeatLimit StrainsAfter NLSP CorrectionAfter Pressure CorrectionLimit StrainsAfter NLSP Correction
-ε1ε2ε1ε2ε1ε2ε1ε2ε1ε2
R10.27−0.050.29−0.060.25−0.060.31−0.110.31−0.08
R20.34−0.060.35−0.070.30−0.060.30−0.110.30−0.09
R30.32−0.060.33−0.070.28−0.070.31−0.110.31−0.09
R40.28−0.050.29−0.070.25−0.060.33−0.110.33−0.08
R5XXXXXX0.36−0.120.35−0.09
Av0.30−0.060.32−0.070.27−0.060.32−0.110.32−0.09
Std0.030.010.030.000.030.000.020.010.020.00
Table A3. Forming limit strains and process corrected limit strains for the 76.2 mm wide 3rd Gen 980 samples.
76.2 mm Wide 3rd Gen 980 Samples
-NakazimaMarciniak
RepeatLimit StrainsAfter NLSP CorrectionAfter Pressure CorrectionLimit StrainsAfter NLSP Correction
-ε1ε2ε1ε2ε1ε2ε1ε2ε1ε2
R1XXXXXX0.26−0.070.26−0.05
R2XXXXXX0.25−0.060.25−0.05
R3XXXXXX0.26−0.070.25−0.05
R4XXXXXX0.24−0.060.24−0.04
R5XXXXXX0.26−0.070.26−0.05
AvXXXXXX0.25−0.070.25−0.05
StdXXXXXX0.010.000.010.00
Table A4. Forming limit strains and process corrected limit strains for the 101.6 mm wide 3rd Gen 980 samples.
101.6 mm Wide 3rd Gen 980 Samples
-NakazimaMarciniak
RepeatLimit StrainsAfter NLSP CorrectionAfter Pressure CorrectionLimit StrainsAfter NLSP Correction
-ε1ε2ε1ε2ε1ε2ε1ε2ε1ε2
R10.210.040.240.000.200.00XXXX
R20.220.040.250.000.200.00XXXX
R30.180.040.200.000.160.00XXXX
R40.190.040.220.000.170.00XXXX
R50.170.040.190.000.150.00XXXX
Av0.190.040.220.000.170.00XXXX
Std0.020.000.030.000.020.00XXXX
Table A5. Forming limit strains and process corrected limit strains for the 127 mm wide 3rd Gen 980 samples.
127 mm Wide 3rd Gen 980 Samples
-NakazimaMarciniak
RepeatLimit StrainsAfter NLSP CorrectionAfter Pressure CorrectionLimit StrainsAfter NLSP Correction
-ε1ε2ε1ε2ε1ε2ε1ε2ε1ε2
R1XXXXXX0.180.000.190.00
R2XXXXXX0.160.000.160.00
R3XXXXXX0.160.000.160.00
R4XXXXXX0.150.000.150.00
AvXXXXXX0.160.000.160.00
StdXXXXXX0.010.000.020.00
Table A6. Forming limit strains and process corrected limit strains for the 139.7 mm wide 3rd Gen 980 samples.
139.7 mm Wide 3rd Gen 980 Samples
-NakazimaMarciniak
RepeatLimit StrainsAfter NLSP CorrectionAfter Pressure CorrectionLimit StrainsAfter NLSP Correction
-ε1ε2ε1ε2ε1ε2ε1ε2ε1ε2
R10.310.180.350.140.280.11XXXX
R20.290.180.320.150.260.11XXXX
R30.280.160.320.110.260.10XXXX
Av0.300.170.330.130.270.10XXXX
Std0.020.010.010.020.010.02XXXX
Table A7. Forming limit strains and process corrected limit strains for the 152.4 mm wide 3rd Gen 980 samples.
152.4 mm Wide 3rd Gen 980 Samples
-NakazimaMarciniak
RepeatLimit StrainsAfter NLSP CorrectionAfter Pressure CorrectionLimit StrainsAfter NLSP Correction
-ε1ε2ε1ε2ε1ε2ε1ε2ε1ε2
R10.360.250.410.200.340.17XXXX
R20.310.240.330.220.270.18XXXX
R30.330.250.360.220.300.18XXXX
Av0.340.250.360.210.300.17XXXX
Std0.030.010.040.010.040.01XXXX
Table A8. Forming limit strains and process corrected limit strains for the 165.1 mm wide 3rd Gen 980 samples.
165.1 mm Wide 3rd Gen 980 Samples
-NakazimaMarciniak
RepeatLimit StrainsAfter NLSP CorrectionAfter Pressure CorrectionLimit StrainsAfter NLSP Correction
-ε1ε2ε1ε2ε1ε2ε1ε2ε1ε2
R1XXXXXX0.290.160.280.17
R2XXXXXX0.370.210.370.21
R3XXXXXX0.320.180.330.17
AvXXXXXX0.330.180.320.18
StdXXXXXX0.040.030.040.02
Table A9. Forming limit strains and process corrected limit strains for the 203.2 mm wide 3rd Gen 980 samples.
203.2 mm Wide 3rd Gen 980 Samples
-NakazimaMarciniak
RepeatLimit StrainsAfter NLSP CorrectionAfter Pressure CorrectionLimit StrainsAfter NLSP Correction
-ε1ε2ε1ε2ε1ε2ε1ε2ε1ε2
R10.320.280.350.250.260.180.240.260.260.21
R20.350.330.470.300.320.260.280.250.300.23
R30.340.300.370.260.310.220.280.250.290.23
Av0.340.300.360.270.300.220.280.250.310.22
Std0.010.020.010.030.030.040.030.020.050.01
Table A10. Forming limit strains and process corrected limit strains for the 25.4 mm wide 3rd Gen 1180 samples.
25.4 mm Wide 3rd Gen 1180 Samples
-NakazimaMarciniak
RepeatLimit StrainsAfter NLSP CorrectionAfter Pressure CorrectionLimit StrainsAfter NLSP Correction
-ε1ε2ε1ε2ε1ε2ε1ε2ε1ε2
R10.24−0.070.25−0.080.20−0.070.25−0.110.25−0.09
R20.26−0.080.26−0.090.20−0.070.24−0.100.24−0.09
R30.27−0.090.27−0.100.22−0.080.24−0.100.23−0.08
R40.25−0.080.26−0.090.20−0.080.24−0.100.24−0.09
Av0.25−0.080.26−0.090.20−0.080.24−0.100.24−0.09
Std0.01−0.010.010.000.010.000.010.000.010.00
Table A11. Forming limit strains and process corrected limit strains for the 50.8 mm wide 3rd Gen 1180 samples.
50.8 mm Wide 3rd Gen 1180 Samples
-NakazimaMarciniak
RepeatLimit StrainsAfter NLSP CorrectionAfter Pressure CorrectionLimit StrainsAfter NLSP Correction
ε1ε2ε1ε2ε1ε2ε1ε2ε1ε2
R10.20−0.020.22−0.050.16−0.040.21−0.070.21−0.06
R20.140.000.15−0.030.11−0.020.22−0.080.22−0.07
R30.160.000.18−0.040.13−0.030.19−0.070.19−0.06
R40.22−0.020.23−0.040.17−0.040.21−0.070.21−0.06
Av0.18−0.010.20−0.040.14−0.030.21−0.070.21−0.06
Std0.040.010.040.010.030.010.010.000.010.01
Table A12. Forming limit strains and process corrected limit strains for the 76.2 mm wide 3rd Gen 1180 samples.
76.2 mm Wide 3rd Gen 1180 Samples
-NakazimaMarciniak
RepeatLimit StrainsAfter NLSP CorrectionAfter Pressure CorrectionLimit StrainsAfter NLSP Correction
-ε1ε2ε1ε2ε1ε2ε1ε2ε1ε2
R1XXXXXX0.17−0.040.17−0.04
R2XXXXXX0.14−0.040.13−0.03
R3XXXXXX0.15−0.040.15−0.03
R4XXXXXX0.15−0.040.15−0.03
AvXXXXXX0.15−0.040.15−0.03
StdXXXXXX0.010.000.010.00
Table A13. Forming limit strains and process corrected limit strains for the 101.6 mm wide 3rd Gen 1180 samples.
101.6 mm Wide 3rd Gen 1180 Samples
-NakazimaMarciniak
RepeatLimit StrainsAfter NLSP CorrectionAfter Pressure CorrectionLimit StrainsAfter NLSP Correction
-ε1ε2ε1ε2ε1ε2ε1ε2ε1ε2
R10.110.040.140.010.080.00XXXX
R20.140.050.170.010.100.00XXXX
R30.150.050.180.010.110.00XXXX
R40.120.040.140.010.080.00XXXX
Av0.130.050.160.010.090.00XXXX
Std0.020.000.020.000.010.00XXXX
Table A14. Forming limit strains and process corrected limit strains for the 127 mm wide 3rd Gen 1180 samples.
127 mm Wide 3rd Gen 1180 Samples
-NakazimaMarciniak
RepeatLimit StrainsAfter NLSP CorrectionAfter Pressure CorrectionLimit StrainsAfter NLSP Correction
-ε1ε2ε1ε2ε1ε2ε1ε2ε1ε2
R1XXXXXX0.11−0.010.10−0.01
R2XXXXXX0.100.000.10−0.01
R3XXXXXX0.10−0.010.090.00
R4XXXXXX0.080.000.080.00
R5XXXXXX0.090.000.090.00
AvXXXXXX0.09−0.010.090.00
StdXXXXXX0.010.000.010.00
Table A15. Forming limit strains and process corrected limit strains for the 139.7 mm wide 3rd Gen 1180 samples.
139.7 mm Wide 3rd Gen 1180 Samples
-NakazimaMarciniak
RepeatLimit StrainsAfter NLSP CorrectionAfter Pressure CorrectionLimit StrainsAfter NLSP Correction
-ε1ε2ε1ε2ε1ε2ε1ε2ε1ε2
R10.180.110.220.070.130.04XXXX
R20.180.110.230.060.130.03XXXX
R30.190.110.230.070.140.04XXXX
R40.180.110.220.070.130.04XXXX
Av0.190.110.220.070.130.04XXXX
Std0.010.000.010.000.010.00XXXX
Table A16. Forming limit strains and process corrected limit strains for the 152.4 mm wide 3rd Gen 1180 samples.
152.4 mm Wide 3rd Gen 1180 Samples
-NakazimaMarciniak
RepeatLimit StrainsAfter NLSP CorrectionAfter Pressure CorrectionLimit StrainsAfter NLSP Correction
-ε1ε2ε1ε2ε1ε2ε1ε2ε1ε2
R10.190.130.220.100.130.05XXXX
R20.180.130.200.100.120.06XXXX
R30.230.160.260.120.160.07XXXX
R40.190.130.220.100.130.06XXXX
R50.210.150.240.110.140.06XXXX
Av0.200.140.230.110.130.06XXXX
Std0.020.010.020.010.020.01XXXX
Table A17. Forming limit strains and process corrected limit strains for the 165.1 mm wide 3rd Gen 1180 samples.
165.1 mm Wide 3rd Gen 1180 Samples
NakazimaMarciniak
RepeatLimit StrainsAfter NLSP CorrectionAfter Pressure CorrectionLimit StrainsAfter NLSP Correction
ε1ε2ε1ε2ε1ε2ε1ε2ε1ε2
R1XXXXXX0.210.110.210.11
R2XXXXXX0.180.080.170.09
R3XXXXXX0.210.140.220.13
AvXXXXXX0.200.110.200.11
StdXXXXXX0.020.030.020.02
Table A18. Forming limit strains and process corrected limit strains for the 203.2 mm wide 3rd Gen 1180 samples.
203.2 mm Wide 3rd Gen 1180 Specimens
-NakazimaMarciniak
RepeatLimit StrainsAfter NLSP CorrectionAfter Pressure CorrectionLimit StrainsAfter NLSP Correction
-ε1ε2ε1ε2ε1ε2ε1ε2ε1ε2
R10.230.200.250.180.150.110.250.210.250.20
R20.230.210.250.190.150.110.220.180.240.17
R30.280.270.240.170.140.100.250.220.280.20
R40.240.230.280.200.170.12XXXX
Av0.250.230.250.180.160.110.240.200.250.19
Std0.020.030.020.010.010.010.010.020.020.02

References

  1. Muttana, S.B.; Mubashir, S. Lightweighting of Passenger Cars: A Comparative Lifecycle Analysis of Energy Consumption and CO2 Emissions; SAE Technical Paper 2013-26-0072; The Automotive Research Association of India: Pune, India, 2013. [Google Scholar] [CrossRef]
  2. Billur, E.; Dykeman, J.; Altan, T. Three generations of advanced high-strength steels for automotive applications, Part II. Stamp. J. 2014, 12–13. Available online: https://ercnsm.osu.edu/sites/ercnsm.osu.edu/files/uploads/S_FormingAHSS/664-2.pdf (accessed on 29 June 2020).
  3. Matlock, D.K.; Speer, J.G. Third Generation of AHSS: Microstructure Design Concepts. In Microstructure and Texture in Steel and Other Materials; Springer: London, UK, 2008; pp. 185–203. [Google Scholar]
  4. Davenport, M.D. Third Generation Advanced High-Strength Steel Emerges. Stamp. J. 2017, 22–28. Available online: https://www.thefabricator.com/stampingjournal/article/stamping/third-generation-advanced-high-strength-steel-emerges (accessed on 29 June 2020).
  5. Billur, E.; Altan, T. Three generations of advanced high-strength steels for automotive applications, Part III. Stamp. J. 2014, 12–13. Available online: https://ercnsm.osu.edu/sites/ercnsm.osu.edu/files/uploads/S_FormingAHSS/664-3.pdf (accessed on 29 June 2020).
  6. Volk, W.; Gaber, C. Investigation and compensation of biaxial pre-strain during the standard Nakajima- and Marciniak test using generalized forming limit concept. Procedia Eng. 2017, 207, 568–573. [Google Scholar] [CrossRef]
  7. Min, J.; Stoughton, T.B.; Carsley, J.; Lin, J. Comparison of DIC Methods of Determining Forming Limit Strain. Procedia Manuf. 2017, 7, 668–674. [Google Scholar] [CrossRef]
  8. Maciniak, Z.; Kuczynski, K. Limit Strains in the Process of Stretch-Forming Sheet Metal. Int. J. Mech. Sci. 1967, 9, 609–620. [Google Scholar] [CrossRef]
  9. Hora, P.; Tong, L.; Berisha, B. Modified maximum force criterion, a model for the theoretical prediction of forming limit curves. Int. J. Mater. Form. 2013, 6, 267–279. [Google Scholar] [CrossRef]
  10. Soare, S. Theoretical considerations upon the MK model for limit strains prediction: The plane strain case, strain-rate effects, yield surface influence and material heterogeneity. Eur. J. Mech. Solids 2010, 29, 938–950. [Google Scholar] [CrossRef]
  11. Nakazima, K.; Kikuma, T. Forming limits under biaxial stretching of sheet metals. Tetsu-to Hagane 1967, 53, 455–458. [Google Scholar]
  12. Ghosh, A.; Hecker, S. Stretching Limits in Sheet Metals: In-Plane Versus Out-of-Plane Deformation. Metall. Trans. 1974, 5, 2161–2164. [Google Scholar] [CrossRef]
  13. Ghosh, A.; Hecker, S. Failure in Thin Sheets Stretched Over Rigid Punches. Metall. Trans. A 1975, 6, 1065–1074. [Google Scholar] [CrossRef]
  14. International Organization for Standardization. Metallic Materials Sheet and Strip—Determination of Forming Limit Curves—Part 2: Determination of Forming Limit Curves in the Laboratory; ISO/DIC 12004-2:2008; International Organization for Standardization: Geneva, Switzerland, 2008. [Google Scholar]
  15. Marciniak, Z.; Kuczynski, K.; Pokora, T. Influence of the plastic properties of a material on the forming limit diagram for sheet metals in tension. Int. J. Mech. Sci. 1973, 15, 789. [Google Scholar] [CrossRef]
  16. Min, J.; Stoughton, T.B.; Carsley, J.E.; Carlson, B.E.; Lin, J.; Gao, X. Accurate characterization of biaxial stress-strain response of sheet metal from bulge testing. Int. J. Plast. 2016, 94, 192–213. [Google Scholar] [CrossRef]
  17. Butcher, C.; Khameneh, F.; Abedini, A.; Connolly, D.; Kurukuri, S. On the Experimental Characterization of Sheet Metal Formability and the Consistent Calibration of the MK Model for Biaxial Stretching in Plane Stress. Int. J. Mater. Process. Technol. 2020. accepted. [Google Scholar]
  18. Noder, J.; Butcher, C. A Comparative Investigation into the Influence of the Constitutive Model on the Prediction of In-Plane Formability. Int. J. Mech. Sci. 2019, 163, 105138. [Google Scholar] [CrossRef]
  19. Min, J.; Stoughton, T.B.; Carsley, J.; Lin, J. Compensation for process-dependent effects in the determination of localized necking limits. Int. J. Mech. Sci. 2016, 117, 115–134. [Google Scholar] [CrossRef] [Green Version]
  20. Rahmaan, T.; Abedini, A.; Butcher, C.; Pathak, N.; Worswick, M.J. Investigation into the shear stress, localization and fracture behaviour of DP600 and AA5182-O shee metal alloys under elevated strain rates. Int. J. Impact Eng. 2017, 108, 303–332. [Google Scholar] [CrossRef]
  21. Bressan, J.D.; Williams, J.A. The use of a shear instability criterion to predict local necking in sheet metal deformation. Int. J. Mech. Sci. 1983, 5, 155–168. [Google Scholar] [CrossRef]
  22. Peirs, J.; Verleysen, P.; Degrieck, J. Novel Technique for Static and Dynamic Shear Testing of Ti6Al4V Sheet. Exp. Mech. 2012, 52, 729–741. [Google Scholar] [CrossRef] [Green Version]
  23. Tian, H.; Brownell, B.; Baral, M.; Korkolis, Y.P. Earing in cup-drawing of anisotropic Al-6022-T4 sheets. Int. J. Mater. Form. 2017, 10, 329–343. [Google Scholar] [CrossRef]
  24. Considère, A. Mémoire sur L’Emploi du Fer et de L’Acier dans les Constructions. In Annales de Ponts et Chaussées; Commission des Annales des Ponts: Paris, French, 1885; Volume 9, pp. 574–775. [Google Scholar]
  25. Mohammadi, M.; Brahme, A.P.; Mishra, R.K.; Inal, K. Effects of post-necking hardening behavior and equivalent stress-strain curves on the accuracy of M-K based forming limit diagrams. Comput. Mater. Sci. 2014, 85, 316–323. [Google Scholar] [CrossRef]
  26. Abedini, A.; Noder, J.; Kohar, C.; Butcher, C. Accounting for shear anisotropy and material frame rotation on the constitutive characterization of automotive alloys using simple shear tests. Mech. Mater. 2020, 148, 103419. [Google Scholar] [CrossRef]
  27. Barlat, F. Crystallographic Texture, Anisotropic Yield Surfaces and Forming Limits of Sheet Metals. Mater. Sci. Eng. 1987, 91, 55–72. [Google Scholar] [CrossRef]
  28. Lian, J.; Barlat, F.; Baudelet, B. Plastic behavior and stretchability of sheet metals. Part II: Effect of yield surface shape on sheet forming limit. Int. J. Plast. 1989, 5, 131–147. [Google Scholar] [CrossRef]
  29. Barlat, F.; Brem, J.C.; Yoon, J.W.; Chung, K.; Dick, R.E.; Lege, D.J.; Pourboghrat, F.; Choi, S.-H.; Chu, E. Plane stress yield function for aluminum alloy sheets—part 1: Theory. Int. J. Plast. 2003, 19, 1297–1319. [Google Scholar] [CrossRef]
  30. Kuwabara, T.; Nakajima, T. Material modeling of 980 MPa Dual Phase Steel Sheet Based on Biaxial Tensile Test and In-plane Stress Reversal Test. J. Solid Mech. Mater. Eng. 2011, 5, 709–720. [Google Scholar] [CrossRef] [Green Version]
  31. Yoshida, F.; Hamasaki, H.; Uemori, T. A user-friendly 3D yield function to describe anisotropy of steel sheets. Int. J. Plast. 2013, 45, 119–139. [Google Scholar] [CrossRef]
  32. Smith, L.M.; Averill, R.C.; Lucas, J.P.; Stoughton, T.B.; Matin, P.H. Influence of transverse normal stress on sheet metal formability. Int. J. Plast. 2003, 19, 1567–1583. [Google Scholar] [CrossRef]
  33. Matin, P.H.; Smith, L.M. Practial limitations to the influence of through-thickness normal stress on sheet metal formability. Int. J. Plast. 2005, 21, 671–690. [Google Scholar] [CrossRef]
  34. Butuc, M.C. Forming Limit Diagrams: Definition of Plastic Instability Criteria. Ph.D. Thesis, Engineering Faculty of Porto University, Porto, Portugal, March 2004. [Google Scholar]
  35. Ratchev, P.; Van Houtte, P.; Verlinden, B.; De Smet, P.; Neutjens, P.; Baartman, R.; Drent, P. Prediction of forming limit diagrams of Al-Mg rolled sheets taking texture into account. Textures Microstruct. 1994, 22, 219–231. [Google Scholar] [CrossRef] [Green Version]
  36. Barlat, F.; Jalinier, J.M. Formability of sheet metal with heterogeneous damage. J. Mater. Sci. 1985, 20, 3385–3399. [Google Scholar] [CrossRef]
  37. Swift, H.W. Plastic instability under plane stress. J. Mech. Phys. Solids 1952, 1, 1–18. [Google Scholar] [CrossRef]
  38. Hill, R. On discontinuous plastic states, with special reference to localized necking in thin sheets. J. Mech. Phys. Solids 1952, 1, 19–30. [Google Scholar] [CrossRef]
  39. Alsos, H.S.; Hopperstad, O.S.; Törnqvist, R.; Jørgen, A. Analyrical and numerical analysis of sheet metal instability using a stress based criterion. Int. J. Solids Struct. 2008, 45, 2042–2055. [Google Scholar] [CrossRef] [Green Version]
  40. Hance, B.M.; Huang, L. A simplified stress-based forming limit criterion for advanced high strength steel (AHSS). IOP Conf. Ser. Mater. Sci. Eng. 2018, 418, 012037. [Google Scholar] [CrossRef] [Green Version]
  41. Chan, K.S.; Koss, D.A.; Ghosh, A.K. Localized Necking of Sheet at Negative Minor Strains. Metall. Trans. A 1984, 15, 323–329. [Google Scholar]
  42. Hutchinson, J.W.; Neale, K.W. Sheet Necking-III. Strain-rate effects. In Mechanics of Sheet Metal Forming; Koisteinen, D.P., Wang, N.-M., Eds.; Springer: Boston, MA, USA, 1978. [Google Scholar]
  43. Zhang, C.; Leotoing, L.; Guines, D.; Ragneau, E. Theoretical and numerical study of strain rate influence on AA5083 formability. J. Mater. Process. Technol. 2009, 209, 3849–3858. [Google Scholar] [CrossRef] [Green Version]
  44. Volk, W.; Hora, P. New algorithm for a robust user-independent evaluation of beginning instability for the experimental FLC determination. Int. J. Mater. Form. 2011, 4, 339–346. [Google Scholar] [CrossRef] [Green Version]
  45. Rahmaan, T. Low to High Strain Rate Characterization of DP600, TRIP780, AA5182-O. Master’s Thesis, University of Waterloo, Waterloo, ON, Canada, 2015. [Google Scholar]
Figure 1. Geometric dimensions of adopted geometries to characterize the material behavior in uniaxial tension using the JIS No. 5 tensile geometry (a) and shear loading using the miniature shear geometry proposed by Peirs et al. [22] (b). All dimensions are in milimeters.
Metals 10 00902 g001
Figure 2. Ratio of shear stress to tensile stress at the same plastic work level until the onset of diffuse necking in the tensile test. Note that the plastic work was not computed up to 10 MJ/m3 owing to non-uniform yielding.
Metals 10 00902 g002
Figure 3. Evaluation of the calibrated MHS hardening models with the tensile and converted shear data for both steels in the transverse direction (a) and its hardening rate (b). The MHS model parameters were obtained by using least squares minimization while enforcing the Considère constraint of Equation (2).
Metals 10 00902 g003aMetals 10 00902 g003b
Figure 4. Von Mises and Yld2000 yield functions for the 3rd Gen 980 (a) and the 3rd Gen 1180 (b) steel. No experimental yield stress data was available for plane strain or balanced biaxial tension.
Metals 10 00902 g004
Figure 5. Experimental and predicted tensile and shear stress ratios of 3rd Gen 980 (a) and 3rd Gen 1180 (b) steel using the associated Yld2000 yield function. No experimental yield stress data was available for plane strain tension or equal-biaxial tension.
Metals 10 00902 g005
Figure 6. Comparison of the experimental and predicted R-values of 3rd Gen 980 (a) and 3rd Gen 1180 (b) steel using the associated Yld2000 yield function. The experimental biaxial R-value was measured using disc compression tests.
Metals 10 00902 g006
Figure 7. Comparison of the engineering stress-strain response in the experiments with finite element model predictions. Owing to the mild tensile anisotropy in the TD, the von Mises yield function was adopted for the 3D solid element simulations. (a) 3rd Gen 980 AHSS; (b) 3rd Gen 1180 AHSS.
Metals 10 00902 g007
Figure 8. Specimen geometry for Marciniak and Nakazima tests with the widths specified in Table 5.
Metals 10 00902 g008
Figure 9. Nakazima (left) and Marciniak (right) tool sets. Dimensions are in mm in conformance with ISO 12004-2 standard.
Metals 10 00902 g009
Figure 10. Strain paths to fracture superimposed with limit strains obtained using the ISO12004-2 standard for 3rd Gen 980 obtained from Nakazima tests (a) and Marciniak tests (b).
Metals 10 00902 g010
Figure 11. Strain paths to fracture superimposed with limit strains obtained using the ISO12004-2 standard for 3rd Gen 1180 obtained from Nakazima tests (a) and Marciniak tests (b).
Metals 10 00902 g011
Figure 12. Major strain distributions of 3rd Gen 1180 Marciniak tests for sample widths that correspond to approximately uniaxial tension (a), in between uniaxial tension and plane strain tension (b) and plane strain tension (c). Figure of the DIC contour corresponds to strain localization prior to fracture with its post-fracture image on the right.
Metals 10 00902 g012
Figure 13. Cross-section of tested Marciniak specimens of 3rd Gen 980 (left) and 3rd Gen 1180 (right) under approximately (a) uniaxial tension, (b) plane strain tension and (c) equi-biaxial stretch.
Metals 10 00902 g013
Figure 14. Marciniak Limiting strains before and after correcting for non-linear strain path (NLSP). (a) 3rd Gen 980; (b) 3rd Gen 1180.
Metals 10 00902 g014
Figure 15. Overlaid limiting strains before and after non-linear strain path (NLSP) corrections in the Nakazima test. (a) 3rd Gen 980; (b) 3rd Gen 1180.
Metals 10 00902 g015
Figure 16. Overlaid limiting strains before and after correcting the NLSP corrected limit strains for pressure (P) effects in the Nakazima test. (a) 3rd Gen 980; (b) 3rd Gen 1180.
Metals 10 00902 g016
Figure 17. Comparison of corrected necking strains in the Nakazima and Marciniak tests. Note that the limiting strains in the Nakazima test were corrected for non-linear strain path (NLSP) and pressure (P) whereas the limiting strains in the Marciniak test were only corrected for the NLSP effects. (a) 3rd Gen. 980; (b) 3rd Gen. 1180.
Metals 10 00902 g017
Figure 18. Schematic of the inclined imperfection band for biaxial stretching under plane stress conditions in the MK model.
Metals 10 00902 g018
Figure 19. Strain increment oriented at the zero-extension angle through the sheet thickness.
Metals 10 00902 g019
Figure 20. Stress-based FLC (a) of an isotropic material following power law hardening showing the straight, horizontal stress-based FLC using the methodology of Hance and Huang (2018) [40] and the BWx model and its converted strain-based FLC (b).
Metals 10 00902 g020
Figure 21. Comparison of analytical MK model predictions using different imperfection factors for 3rd Gen 980 (a) and 3rd Gen 1180 (b).
Metals 10 00902 g021
Figure 22. Comparison of analytical MMFC predictions using the methodology of Hora et al. (2013) [9] and a linearized version with process-corrected limit strains for 3rd Gen 980 (a) and 3rd Gen 1180 (b).
Metals 10 00902 g022
Figure 23. Comparison of analytical BW model predictions with process-corrected limits strains for 3rd Gen 980 (a) and 3rd Gen 1180 (b).
Metals 10 00902 g023
Figure 24. Analytical FLC variants with the best overall agreement overlaid with process-corrected limiting strains for 3rd Gen 980.
Metals 10 00902 g024
Figure 25. Analytical FLC variants with the best overall agreement overlaid with process-corrected limiting strains for 3rd Gen 1180.
Metals 10 00902 g025
Figure 26. Comparison of the linearized MMFC, the MK model, and the extended BWx model with the process-corrected limiting strains for DP980. Note that the limit strains were obtained from Noder and Butcher (2019) [18].
Metals 10 00902 g026
Figure 27. Comparison of the linearized MMFC, the MK model, and the extended BWx model with the process-corrected limiting strains for AA5182. Note that the limit strains were obtained from Noder and Butcher (2019) [18].
Metals 10 00902 g027
Table 1. Standard tensile mechanical properties in the TD obtained using JIS uniaxial tension tests.
GradeSheet Thickness (mm)Yield Strength (MPa)Ultimate Tensile Strength (MPa)Uniform Elongation UE (%)Total Elongation TE (%)Surface Roughness Ra (µm)
3rd Gen 9801.39 (±0.02)681 (±8)1034 (±10)18.0 (±0.5)24.9 (±0.6)1.07 (±0.07)
3rd Gen 11801.43 (±0.02)950 (±12)1251 (±8)8.4 (±0.2)14.1 (±0.6)1.08 (±0.08)
Table 2. Overview of the plastic anisotropy and normalized stress in tension (σ) and shear (τ) with respect to uniaxial tension in the RD.
3rd Gen 980σ0/σ0σ22.5/σ0σ45/σ0σ67.5/σ0σ90/σ0τ0/σ0
1.000 (±0.013)0.981 (±0.001)0.971 (±0.006)0.979 (±0.003)0.998 (±0.008)0.585
R0R22.5R45R67.5R90RB
0.86 (±0.01)0.86 (±0.01)0.93 (±0.01)0.91 (±0.01)0.90 (±0.00)1.00 (±0.05)
3rd Gen 1180σ0/σ0σ22.5/σ0σ45/σ0σ67.5/σ0σ90/σ0τ0/σ0
1.000 (±0.015)0.996 (±0.010)1.001 (±0.004)1.010 (±0.007)1.022 (±0.006)0.618
R0R22.5R45R67.5R90RB
0.76 (±0.01)0.83 (±0.00)0.93 (±0.00)0.90 (±0.02)0.90 (±0.01)0.92 (±0.03)
Table 3. MHS model coefficients for the RD determined using tensile and shear tests. Least squares minimization was adopted to enforce the Considère constraint at the plastic uniform elongation strain.
SteelModified Hockett-Sherby Model Parameters
GradeC1
(MPa)
C2
(MPa)
C3C4C5
(MPa)
Plastic Strain at Uniform Elongation
3rd Gen 1180 RD1323.56785.185.290.395281.460.075
3rd Gen 980 RD985.73664.7920.341.103634.690.158
Table 4. Parameters for the Yld2000 yield function with the rolling direction as the reference direction.
SteelBarlat Yld2000 Calibration Coefficients
Grade a 1 a 2 a 3 a 4 a 5 a 6 a 7 a 8 m
3rd Gen 9800.9701.0051.0011.0071.0110.9921.0151.0796
3rd Gen 11800.9690.9460.9780.9981.0160.9640.9931.0664.7
Table 5. Sample width and carrier blank material used for Marciniak and Nakazima experiments where MS denotes mild steel and SS denotes stainless steel.
Test MethodologySample Width (mm)
Nakazima experiments 25.450.8 X 101.6 X 139.7152.4 X 203.2
(FLC0)
Marciniak experiments25.450.876.2 X 127 X X 165.1203.2
(FLC0)
Carrier Blank Material for 3rd Gen 980 MS MS MS X MS X X SS SS
Carrier Blank Material for 3rd Gen 1180 MS MS MS X MS X X MSMS
Table 6. Calibrated coefficients for the AA5182-O aluminum alloy for the mod. Generalized Voce model obtained from Noder and Butcher [18].
AlloyB1 (MPa)B2 (MPa)B3 (MPa)B4
AA5182-O, 1.55 mm thickness 134.73182.76144.0916.25
Table 7. Calibrated coefficients for the DP980 steel alloy for the mod. Hockett-Sherby model obtained from Noder and Butcher [18].
GradeC1 (MPa)C2 (MPa)C3C4C5 (MPa)
DP980, 1.2 mm thickness 615.991092.5411.540.50333.25

