Article

Numerical Simulation of Moving Heat Flux during Selective Laser Melting of AlSi25 Alloy Powder

1
School of Materials Science and Engineering, Tongji University, Shanghai 201804, China
2
Shanghai Key Laboratory R&D Application of Metallic Functional Materials, Shanghai 201804, China
3
School of Physics and Engineering, Tongji University, Shanghai 200092, China
*
Author to whom correspondence should be addressed.
Metals 2020, 10(7), 877; https://doi.org/10.3390/met10070877
Submission received: 6 June 2020 / Revised: 25 June 2020 / Accepted: 28 June 2020 / Published: 1 July 2020

Abstract

:
A single-layer three-dimensional model was created to simulate multi-channel scanning of AlSi25 powder in selective laser melting (SLM) by the finite element method. Thermal behaviors of laser power and scanning speed in the procedure of SLM AlSi25 powder were studied. With the increase of laser power, the maximum temperature, size and cooling rate of the molten pool increase, while the scanning speed decreases. For an expected SLM process, a perfect molten pool can be generated using process parameters of laser power of 180 W and a scanning speed of 200 mm/s. The pool is greater than the width of the scanning interval, the depth of the molten pool is close to scan powder layer thickness, the temperature of the molten pool is higher than the melting point temperature of the powder and the parameters of the width and depth are the highest. To confirm the accuracy of the simulation results of forecasting excellent process parameters, the SLM experiment of forming AlSi25 powder was carried out. The surface morphology of the printed sample is intact without holes and defects, and a satisfactory metallurgical bond between adjacent scanning channels and adjacent scanning layers was achieved. Therefore, the development of numerical simulation in this paper provides an effective method to obtain the best process parameters, which can be used as a choice to further improve SLM process parameters. In the future, metallographic technology can also be implemented to obtain the width-to-depth ratio of the SLM sample molten pool, enhancing the connection between experiment and theory.

1. Introduction

As one of the most widely-investigated fabrication techniques, selective laser melting (SLM) has outstanding advantages in obtaining 3D metal parts with high density and dimensional precision [1,2], which ensures the direct forming of thin-walled parts and complex precision parts [3,4]. During the SLM process, the model is sliced into two-dimensional data in the post-processing software, in order to be recognized and imported to the equipment. Under the protection of the inert gas atmosphere, the laser beam is utilized to scan the contour of the slicing model on the powder bed. The powder absorbs heat to melt and solidifies when cooled. Due to its high specific strength with low mass, aluminum alloys are extensively used in domains such as medicine [5,6] and industrial design [7]. The remarkable flexibility of SLM techniques gives access to the improvement of mechanical properties and aluminum alloys quality [8,9]. Furthermore, considering advantages in regard to convenient utilization of traditional manufacturing facilities and reduction of cycle time, SLM technology gradually becomes critical hotspot [10,11].
However, complex physical and chemical reactions are concomitant with SLM, during which defects such as pores, cracks, warpage and delamination are easy to initiate, severely limit the application of parts and even result in difficulties of formation [12,13]. During the process of scanning forming, factors such as molten pool splashing, spheroidization and sticky powder serve as potential drawbacks which increases the surface roughness of workpieces [14]. The aforementioned problems severely limit the widespread application of SLM technology. However, the defects of the SLM workpiece and the lack of dimensional accuracy are fundamentally caused by the uneven distribution of the temperature field and the inherent instability of the stress field in the molding process. The excessive energy input generates salient temperature gradient and thermal stress. As a result, cracking, slag hanging and powder sticking will occur [15]. If energy contribution is insufficient, the scanned area cannot be overlapped to form a continuous melting channel, leading to insufficient density of the processed sample and even the inability to formation [16,17]. Therefore, it can be concluded that studying the temperature and stress fields in the SLM product is the fundamental way to solve the SLM forming drawbacks [18]. If other process parameters remain unchanged, the input laser energy level greatly affects the process of the workpiece [19,20]. By maintaining high laser power and controlling low scanning speed within the allowable parameters of the equipment, the influence of parameters on the forming quality of the workpiece can be studied. Due to the rapid movement of the laser source in the SLM process, the molten pool exists for a short time and the solidification rate is fast, which makes it extremely difficult to capture. Numerical simulation is an effective means to obtain temperature and stress field data [21,22,23].
The Current research on SLM formed aluminum alloys mainly focuses on low-silicon aluminum alloys, with AlSi10Mg alloys as typical representatives [24,25,26]. However, there are limited reports of high-silicon content aluminum alloys. Previous studies are still far from exhaustive in terms of material range, process and application to industrial production. With the rapid development of industry, more requirements have been proposed for the properties of aluminum alloy materials. Al high-Si alloy (SLM) has been widely used in the automobile and electronic packaging industries due to its high wear resistance and hardness [27,28]. Pei et al. [29] showed that, after laser cladding AlSi40 functionally graded material in the aluminum alloy matrix, which results in a significant increase in its hardness, from about 70–90 HV to about 230 HV, the wear resistance was also improved. Nan Kang et al. [30,31] prepared dense hypereutectic Al-50Si alloy by SLM. The morphology of the primary Si phase and the effect of laser power on the size was studied. The results demonstrate that the size of the primary Si phase is smaller than that of the conventional hypereutectic Al-Si alloys. Maximum microhardness of the sample was 188 HV. With the increase of Si content in the aluminum alloy, a large amount of primary crystal silicon formed in the alloy is distributed as a hard phase in the matrix α-Al. The coarse or long strip primary silicon seriously breaks the continuity of the alloy, increases the brittleness of the alloy and reduces the machining and mechanical properties [32]. Due to the low cooling rate, conventional cast Al-Si alloys always show rough primary silicon microstructure, resulting in poor mechanical properties and machinability [33]. Evenly distributed, spherical, fine primary silicon and primary silicon phase refined by adding modifiers such as Sr and P can help improve the wear and mechanical properties of Al-Si alloys [34,35,36]. Another effective method to improve the microstructure of high Si-Al alloy is rapid solidification [37,38]. To attain the desired parts and avoid the extra mechanical processing technology leading to the increase of the cost and time consumption, SLM technology provides the possibility of primary silicon refining of high Si-Al alloys by increasing the cooling rate during solidification. The hypereutectic Al-high Si alloy prepared by SLM has a dense ultrafine structure. Meanwhile, samples with a suitable size of original silicon show superior wear resistance. EO Olakanmi et al. [39] summarized the characteristics of SLM in producing pure Al, Al-Mg alloy and Al-Si alloy. It is evident that Al-Si alloy is suitable for SLM because of its low thermal expansion and uniform distribution. Theresa Hanemann et al. [40] proposed a new method of AlSi10Mg + Si alloy with 25 wt % and 50 wt % Si manufactured by in-situ alloying SLM of powder mixture. It could be implemented to prepare parts with densities ≥99% by using laser power ≥275 W and scan speeds ≥1500 mm/s for the alloy containing 25 wt % Si and laser power of 400 W and scan speeds ≥1500 mm/s for the alloy containing 50 wt % Si. Cracks were observed in both AlSi50 samples prepared at 400 W and 750 mm/s. As the laser power increases and/or the scanning speed decreases (which is related to the increase in energy density), the formation of cracks is reduced. However, the increase in energy input leads to the formation of excessive pores. Therefore, a balance must be kept between crack formation and porosity. However, cracks not being found in the AlSi25 sample at higher laser power and slower scanning speed may be related to the thermal gradient and cooling rate reduction resulted from the heat accumulation inside the part during processing. Because the thermal history of SLM parts is complex and depends on many parameters, it is required to further explore the reason for the easy formation of cracks during the forming process of high-silicon aluminum alloys by SLM. Generally speaking, the research on SLM printing of high-silicon aluminum alloys mainly focuses on the most basic trial and error method. There is still a lack of systematic research on the mechanism of the impact of high-silicon aluminum alloy powder performance and printing process parameters on the properties of printed parts, especially the body performance on the densification of printed parts, which greatly limits the large-scale industrial application of high-silicon aluminum alloy SLM printing. Compared with other materials, aluminum silicon powder has high economic performance, thus we launched the SLM self-developed AlSi25 powder process.
Many scholars have carried out numerical simulations to study the temperature distribution of SLM. In the early finite element model established by Dai. [41] and Roberts et al. [42], the linear conversion method is operated to suppose the variation in thermal conductivity during the state of the powder-to-solid transition, and the state transition is simulated by using the life and death unit technology. Hu [43] simulated the multilayer SLM deposition of AlSi10Mg powder, exploring the cooling rate and solidification morphology parameters, as well as evaluating the input laser energy to the influence of forming performance. As the input energy increases, the cooling rate gradually increases, while the solidification rate decreases, which is conducive to good grain formation. Gu et al. [44] applied the finite element model considering the cooling time to a two-phase alloy during powder transportation. They obtained the temperature data and the sizes of the melting pool under certain parameters and summarized the variation mechanism of different process parameters. Xiao et al. [45,46] optimized the designed product. Their study proved that modeling and simulating were increasingly used as auxiliary tools to predict and simplify large-scale random experiments. However, even though SLM simulation has made impressive progress, technical parameters still take a long time to explore [47,48]. Most of the numerical analysis of aluminum alloy in the SLM formation process adopts the life and death unit technology to study the metallurgical properties of the multilayer powder. Because the interaction between layers affects the heat transfer mechanism, the multilayer metal additive manufacturing process considered by combining the temperature history of the previous layer has expanded the impact of transient temperature [43,49]. When the model uses a rough macro model, the scan distance effect is ignored, increasing the possibility of inaccuracy of the numerical calculation results [50]. Aluminum alloys have low laser absorption, superior thermal conductivity and susceptibility to oxidation. In this paper, the physical model is precisely strengthened to collect the thermal behavior data of SLM-shaped high silicon aluminum alloy. The thickness of the powder layer is the average particle size of the powder. The scanning distance and spot size of the heat source model are consistent with the equipment. Because of the high availability of information from a molten line, this approach is used in a newly developed simulation tool that uses homogeneous powder beds with their initial configuration to maintain consistency between calculations and experiments. Since the temperature history of the preceding layer influences the thermal process of the subsequent layer, a single-layer multi-channel prediction model of AlSi25 molten pool temperature field in the SLM process was established using Workbench 19.0 software. The material model was established with variables of thermal conductivity and specific heat capacity proportional to temperature. The temperature field, cooling rate, molten pool existence time and molten structure of powder under the combination of power and scanning speed were studied. It is further proved by experiments that the model is effective in predicting better parameters under the control of laser power and scanning speed. Based on the model, the parameters can be optimized according to the variation rules of molten pool structure and the unnecessary experimental testing and labor cost can be reduced.

2. Materials and Methods

2.1. SLM Process Model

2.1.1. Physical Model

The beginning of the molding process is to scrape the powder from the powder cylinder into the molding cylinder (GUANGDONG HANBANG3D TECHNOLOGY CO., LTD, Zhongshan City, China). After that, the laser starts scanning the contour of the workpiece and moves according to the scanning path. Figure 1 describes the typical thermophysical behavior in the SLM procedure. As the laser reaches upper surface of the powder, some absorbed energy melts the powder to form a miniature size pool, and the remaining energy is lost in the form of thermal convection and radiation. With the occurrence of powder melting, cooling and solidification, metallurgical bonding is formed between adjacent scanning regions.
The transient temperature field of SLM forming process is described by three-dimensional transient thermophysical equation, which can be expressed as [51,52]:
ρ c T t = x ( k T t ) + y ( k T t ) + z ( k T z ) + Q
where ρ represents the power density, C represents the specific heat capacity, T represents the temperature of the powder, t represents the time, K represents the thermal conductivity and Q represents the heat generated per unit volume of the heat transfer medium. The effective thermal conductivity of powder can be expressed as [53]:
G ρ ρ p = G m ( 2 ρ p ρ m )
where Gρ and Gm are the thermal conductivity of powder and solid materials, respectively. The densities of the solid and power materials are represented as ρm and ρn, respectively. In this model, AlSi25 powder is selected as the initial simulation material. As the temperature reaches its melting point, the thermophysical properties of the powder change. The change in the thermophysical properties of AlSi25 powder with temperature is shown in Table 1.

2.1.2. Initial and Boundary Constraints

The details of the initial and boundary conditions are determined by the following formula [55]:
T ( x , y , z ) | t = 0 = T 0 ( x , y , z ) D
The initial temperature T0 is set to 25 °C. The natural boundary conditions can be expressed as [56]:
k T n q + h ( T T 0 ) + δ ε ( T 4 T 0 4 ) = 0 ( x , y , z ) S
where S represents the surface of heat flux, convection and radiation; n represents the normal vector of surface S; q represents the input heat flux; h represents the thermal convection coefficient; σ is 5.67 × 10⁻⁸ W/m2k4; ε is the emissivity; and x, y, z are coordinate points.

2.1.3. Gaussian Heat Source Model Design

A laser beam is used as energy sources of melting powder, and its intensity distribution accords with the Gaussian relation. The expression can be represented as:
E = C 2 e [ ( x x 0 ) 2 + ( y y 0 ) 2 ] C 1 2 e A C ( z z 0 )
where E is heat energy, C1 is the radius of the beam, C2 is the source power intensity, AC is the absorption coefficient of powder and (x0,y0,z0) is the instantaneous position of the heat flow which centers in the scanning path.

2.1.4. Finite Element Setting

The Workbench 19.0 software transient thermal module was selected to obtain the temperature field in the data. The physical models include the upper AlSi25 powder and the lower aluminum alloy 6061 substrate with dimensions of 1.2 mm × 0.64 mm × 0.03 mm and 2 mm × 2 mm × 0.5 mm, respectively. For accurate calculations, a hexahedral element was employed in the powder layer and a rough tetrahedral mesh was used in the matrix. The model was divided into 52,430 units and 197,706 nodes. Figure 2 shows the scanning arrangement of the simulation program.
In the present model, some assumptions are made as follows:
(1)
AlSi25 powder layer is regarded as a new continuous homogeneous isotropic medium.
(2)
Thermal conductivity and specific heat capacity of the material change with the temperature.
(3)
During laser processing, the thermal convection coefficient between the powder surface and the surrounding environment is a fixed constant, which does not vary with temperature.
(4)
The laser beam acting on the AlSi25 powder bed is defined as a Gaussian heat source, which is expressed as a heat flux in the simulation process.
(5)
The vaporization phenomenon is ignored after the material reaches the boiling point.

2.2. Experiment

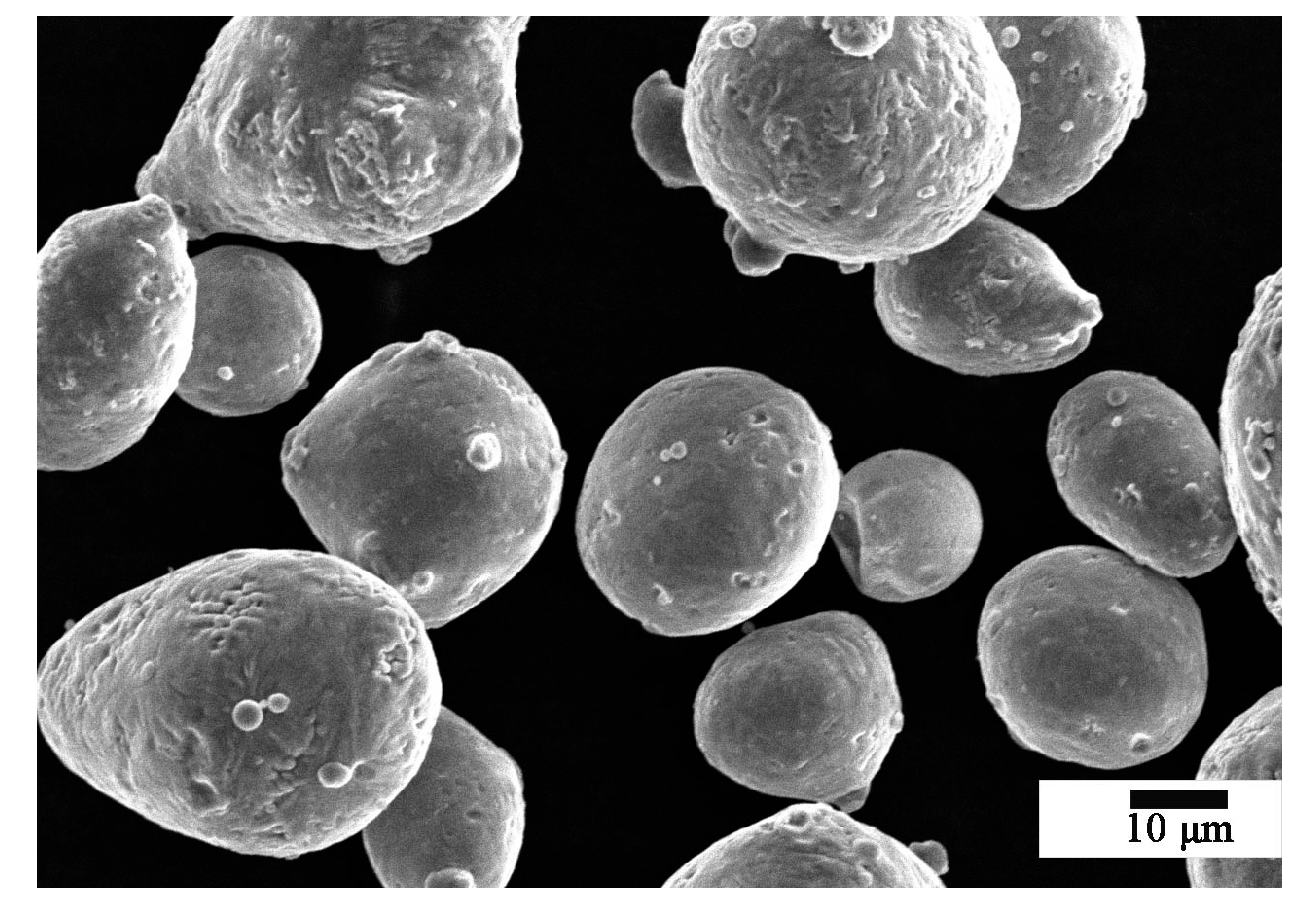
The test raw material is air-atomized AlSi25 alloy powder with an average particle size of 30 μm. The alloy composition is shown in Table 2. Figure 3 shows the scanning electron microscope (SEM) image of the surface morphology of AlSi25 powder samples. Particle size distribution of powder samples was determined by the TRILOS laser particle size analyzer, with D10 being 16.3 μm, D50 being 25.4 μm and D90 being 49.4 μm. The equipment used in this experiment is an HBD-100 metal rapid prototyping machine with a maximum laser power of 200 W produced by GUANGDONG HANBANG3D TECHNOLOGY CO., LTD (Zhongshan City, China). The process parameters (shown in Table 3) in the experiments were the same as those used in the simulations. The whole SLM process was carried out in an argon atmosphere. Before powder printing, the DZF-6090 vacuum drying box was used to keep the heat for more than 10 h at 0.085 MPa and 70 °C. The powder material was formed on the substrate. The substrate material was Al6061 and the substrate size was 105 mm × 105 mm × 20 mm. The size of the formed sample was 10 mm × 10 mm × 10 mm. To study the influence of different parameters on the surface morphology and density of the sample, six squares were printed for each parameter. After the sample was finished, it was separated from the substrate by wire cutting, and then washed and dried with ultrasonic for 60 min. SU1510(HITACHI, Tokyo, Japan) SEM was used to observe the microstructure of the samples. According to Archimedes’ principle, the density of the sample was measured by using the FA2104J electronic density scale (Shanghai Yueping Scientific Instrument Co., Ltd., Shanghai, China).

3. Results and Discussion

3.1. Characteristics of Temperature Distributions

Figure 4 presents the curve of temperature change with time at monitoring Points 1–3, using v (200 mm/s) and P (180 W) The temperature at these monitoring points rises rapidly with the proximity of the laser source and falls sharply with the departure of the laser beam. The peak value of the thermal cycle curve of each monitoring point appears periodically. The peak value appears at the monitoring point where the laser is acting, and the subsequent peak value appears at the monitoring point where the laser acts on the adjacent scanning channel. The maximum peak temperature of the three monitoring points is 1268.6, 1357 and 1510.4 °C, respectively. The thermal cycle curve shows that the metal powder undergoes the process of melting, cooling and solidification. Due to the thermal accumulation of heat from the former channel to the latter channel, the peak temperature of the adjacent monitoring points is increasing.
The laser cladding forming process is a complicated coupling process of light, powder and gas. The laser heats the metal powder to form a molten pool. When the laser beam and the substrate move relative to each other, a series of molten pools are formed. The front pool leaves with the heat source, and, after rapid solidification, it accumulates into a one-dimensional single cladding line. Multiple overlapped channels form a two-dimensional cladding layer. The smallest forming unit in the forming process, “point” (molten pool), is the basis of the accumulative manufacturing process. Under the comprehensive influence of process parameters, the instability of many of the process parameters or the interference of the external environment will lead to the instability of the molten pool, and the size of the molten pool will change. After accumulating and stacking point by point, line by line, surface by surface, defects are formed with uneven wall thickness, uneven upper surface, surface quality decline, overall precision deterioration, etc., which even results in failure of forming process. Improving the dimensional accuracy and stability of the molten pool in the cladding process is imperative to ensure the precision and quality of the accumulative entire manufacturing process. Only by avoiding the discontinuous and unstable phenomenon of distinct scanning channel in laser forming process can the printing failure of the continuous layer due to insufficient melting at a certain point be avoided, thus improving the final performance. Therefore, obtaining the thermal relationship among the scanning tracks forms the basis for a better performance of SLM forming.

3.2. Thermal Behaviors

Figure 5 shows the change rule of the temperature with laser scanning time under different P and v (Point 2). The temperature curve fluctuates with time. The curve’s slope represents the cooling rate of the molten pool. Each wave represents the completion of a scan. As the laser approaches Point 2, its temperature increases rapidly, while, as the laser moves away from it, its temperature decreases rapidly, which will produce a high cooling rate. The fourth peak temperature is the maximum temperature of the laser (Point 2). As the power increases from 100 to 180 W, the cooling speed increases from 1.998 × 10⁶ to 3.72 × 10⁶ °C/s (Figure 5a). However, when the scanning speed increases from 200 to 1000 mm/s, the cooling rate decreases from 3.72 × 10⁶ to 1.31 × 10⁷ °C /s (Figure 5b). It can be noticed that temperature at v = 1000 mm/s is higher than the melting temperature (584 °C), which means that the first layer of material also melts due to sufficient laser penetration energy input.
With the expansion of powder melting activities, the iterative modes of heating and cooling solidification complicate the temperature distribution. The key parameters of the SLM forming process (laser power and velocity) have a significant impact on the heat distribution of SLM. The molten pool cooling rate increases with the increase of power and velocity, and the velocity has more obvious effects among all the process parameters, if the change amount is equal.
Figure 6 shows the maximum temperature and lifetime of the melting pool at Point 2 with different parameters. When P increases from 100 to 180 W, due to the higher energy input, the maximum temperature increases from 822.91 to 1357 °C, and the liquid phase time increases from 0.3083 to 0.554 ms (Figure 6a). When the scanning speed increases from 200 to 1000 mm/s, the temperature of the melting pool decreases from 1357 to 1201.3 °C, the existence time of the melting pool decreases from 0.554 to 0.0938 ms and the maximum temperature and the temperature of the molten pool decrease gently (Figure 6b). Compared with the changes caused by the power, the impact of the speed is of less concern.
On the one hand, increasing P or decreasing v makes the energy absorbed by the powder increase, and it takes more time for the molten poll to form by the thermal diffusion of the energy. On the other hand, the heat absorbed by a lower power (100 W) or a higher speed (1000 mm/s) is not enough to melt the powder instantly, and the existence time will be shorter, which may form a large amount of liquid with high melt viscosity to reduce the melt wettability, as well as cause a late expansion of melt and formation of holes. In the process of SLM, the highest temperature and the existing time of the molten pool depend on P and v. These two parameters affect the size of the pool, which in turn determines the metallurgical bonding in the printing process; therefore, the appropriate power and speed values contribute to obtaining a good lap bonded pool.
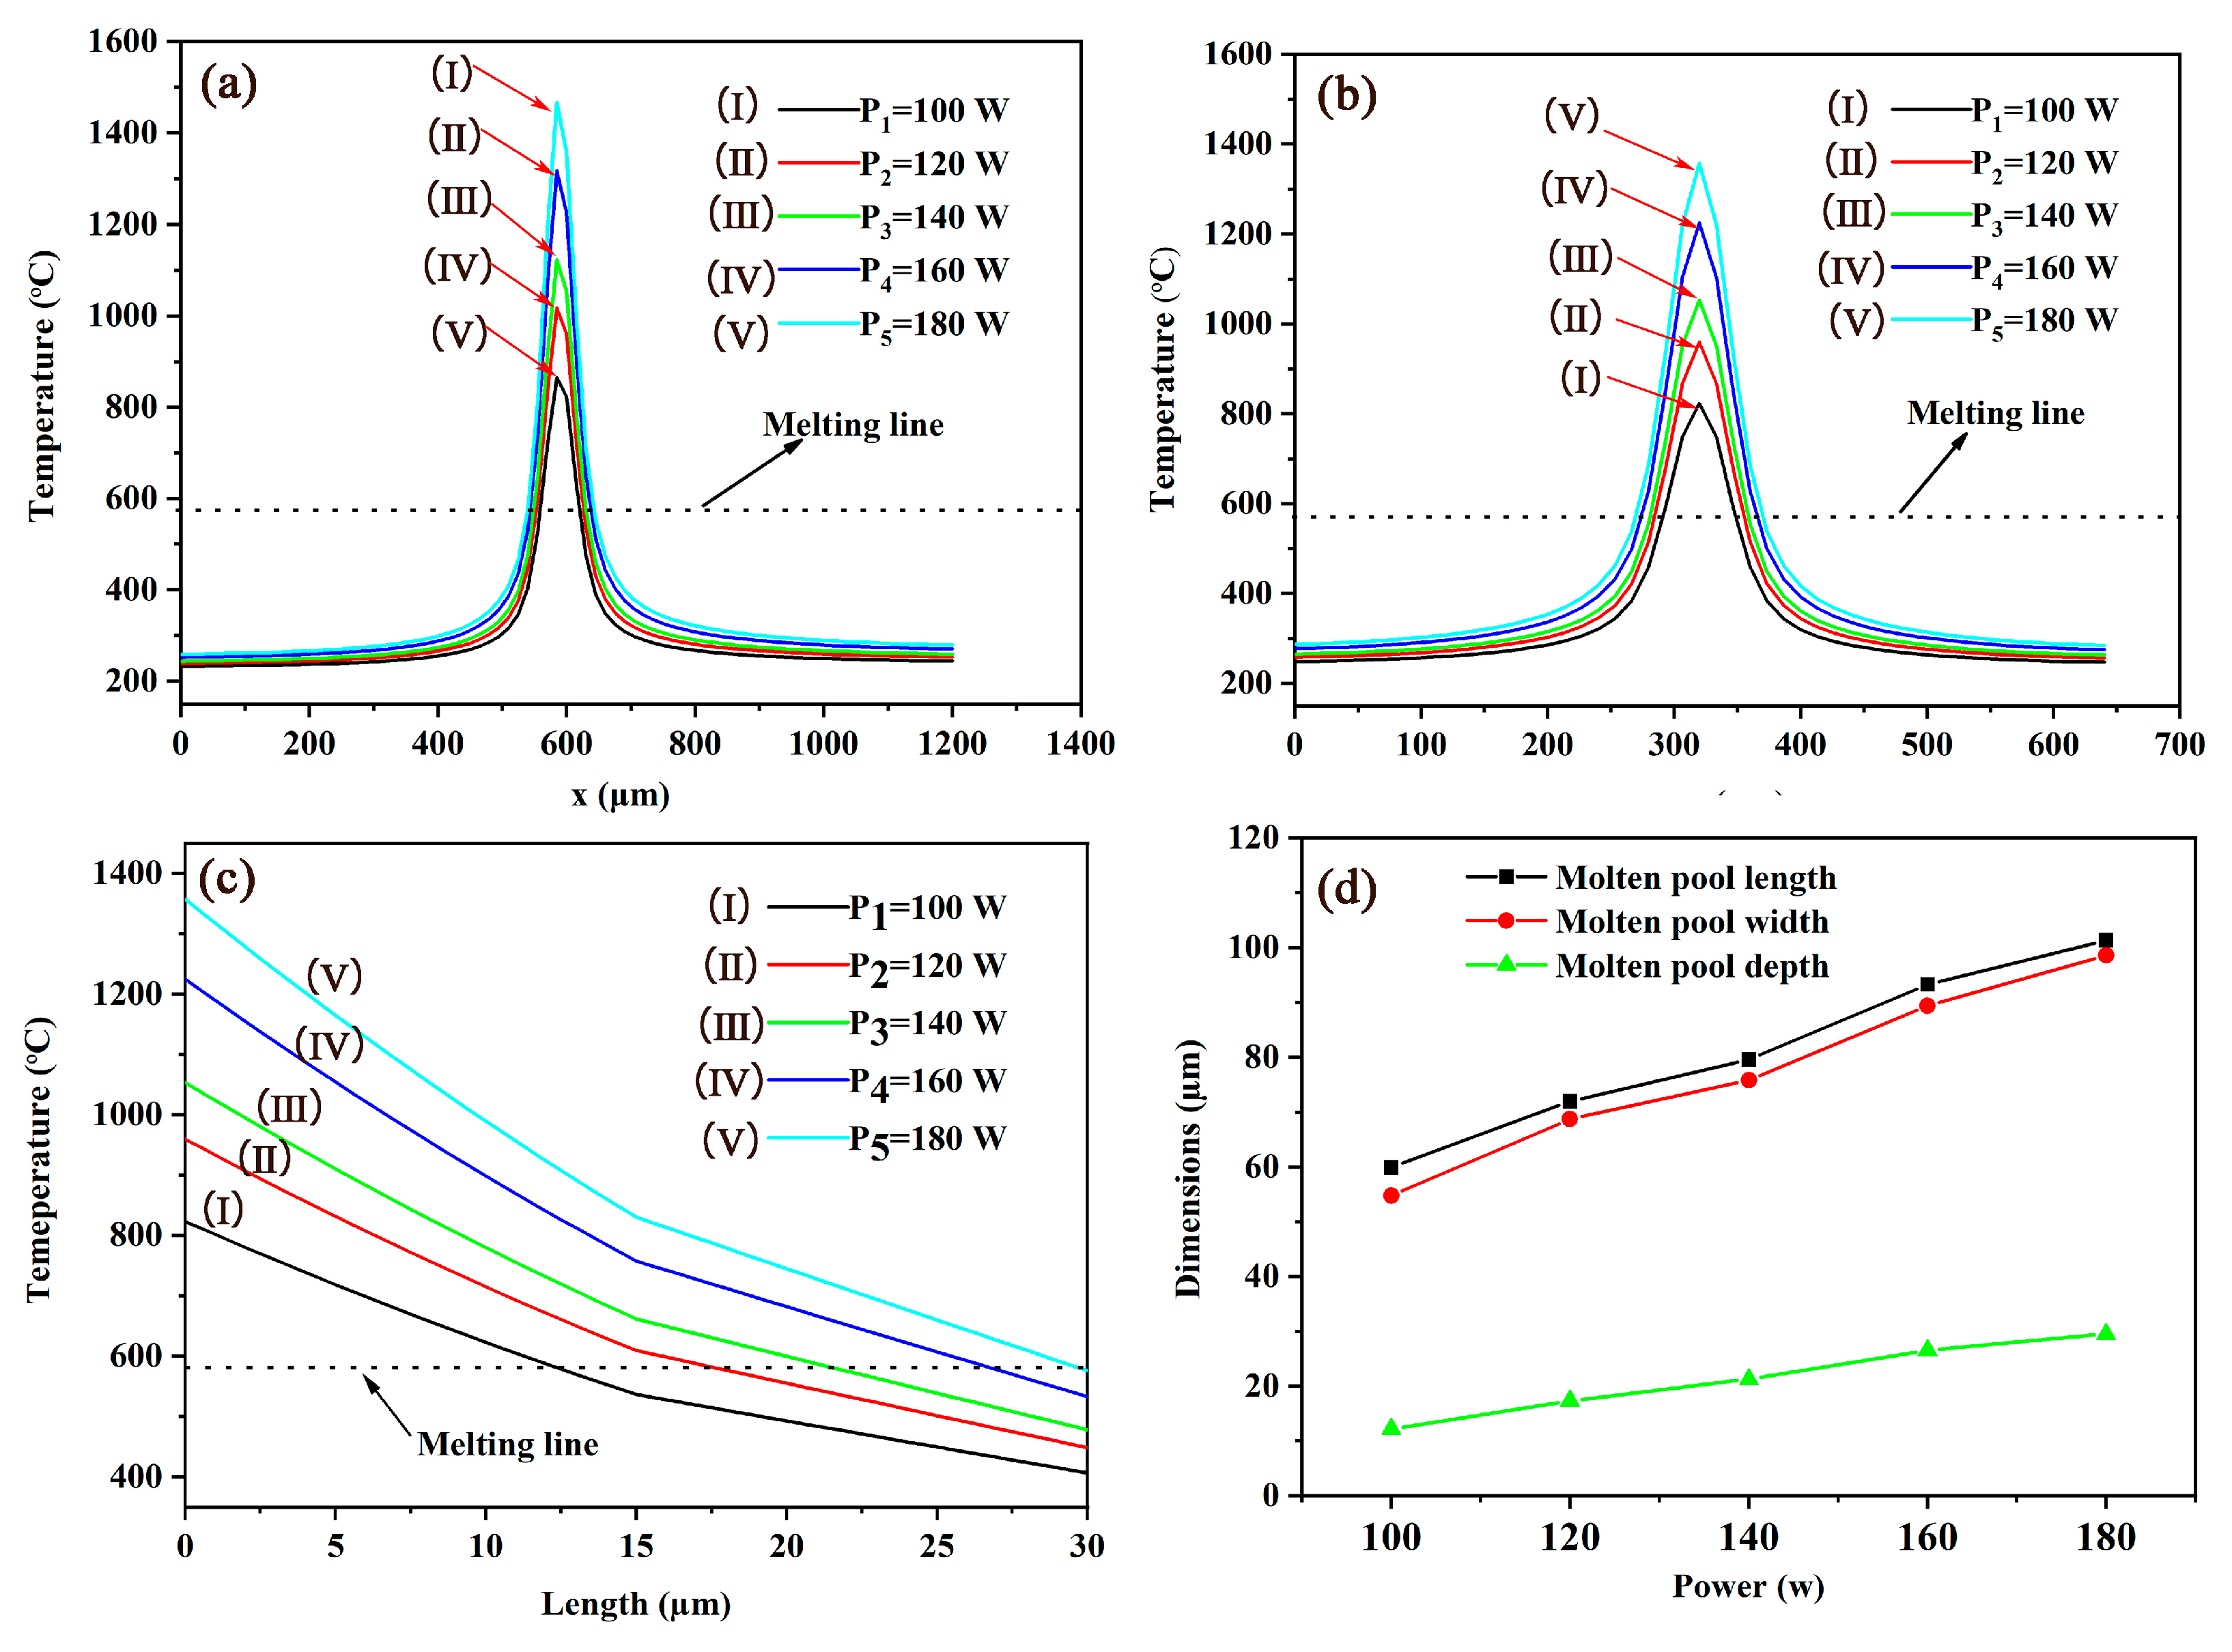
Figure 7a–c, respectively, shows the temperature distribution along the x-axis (parallel scanning direction), y-axis (vertical scanning direction) and z-axis when the laser spot center falls at Point 2 at v of 200 mm/s and different P of 100, 120, 140, 160 and 180 W. By the intersection distance between the melting line and each curve, the dimension of the molten pool using different P can be obtained. When P is 100 W, the length, width and depth of the molten pool are 59.93, 54.79 and 12.18 μm, respectively. Increasing P to 140 W, the length, width and depth of the molten pool increase by 33%, 38% and 74%, respectively. When P is increased further to 180 W, the length, width and depth of the molten pool is increased to 101.35, 98.6 and 29.51 μm, respectively. It can be concluded that increasing P can increase the dimensions of the molten pool (Figure 7d).
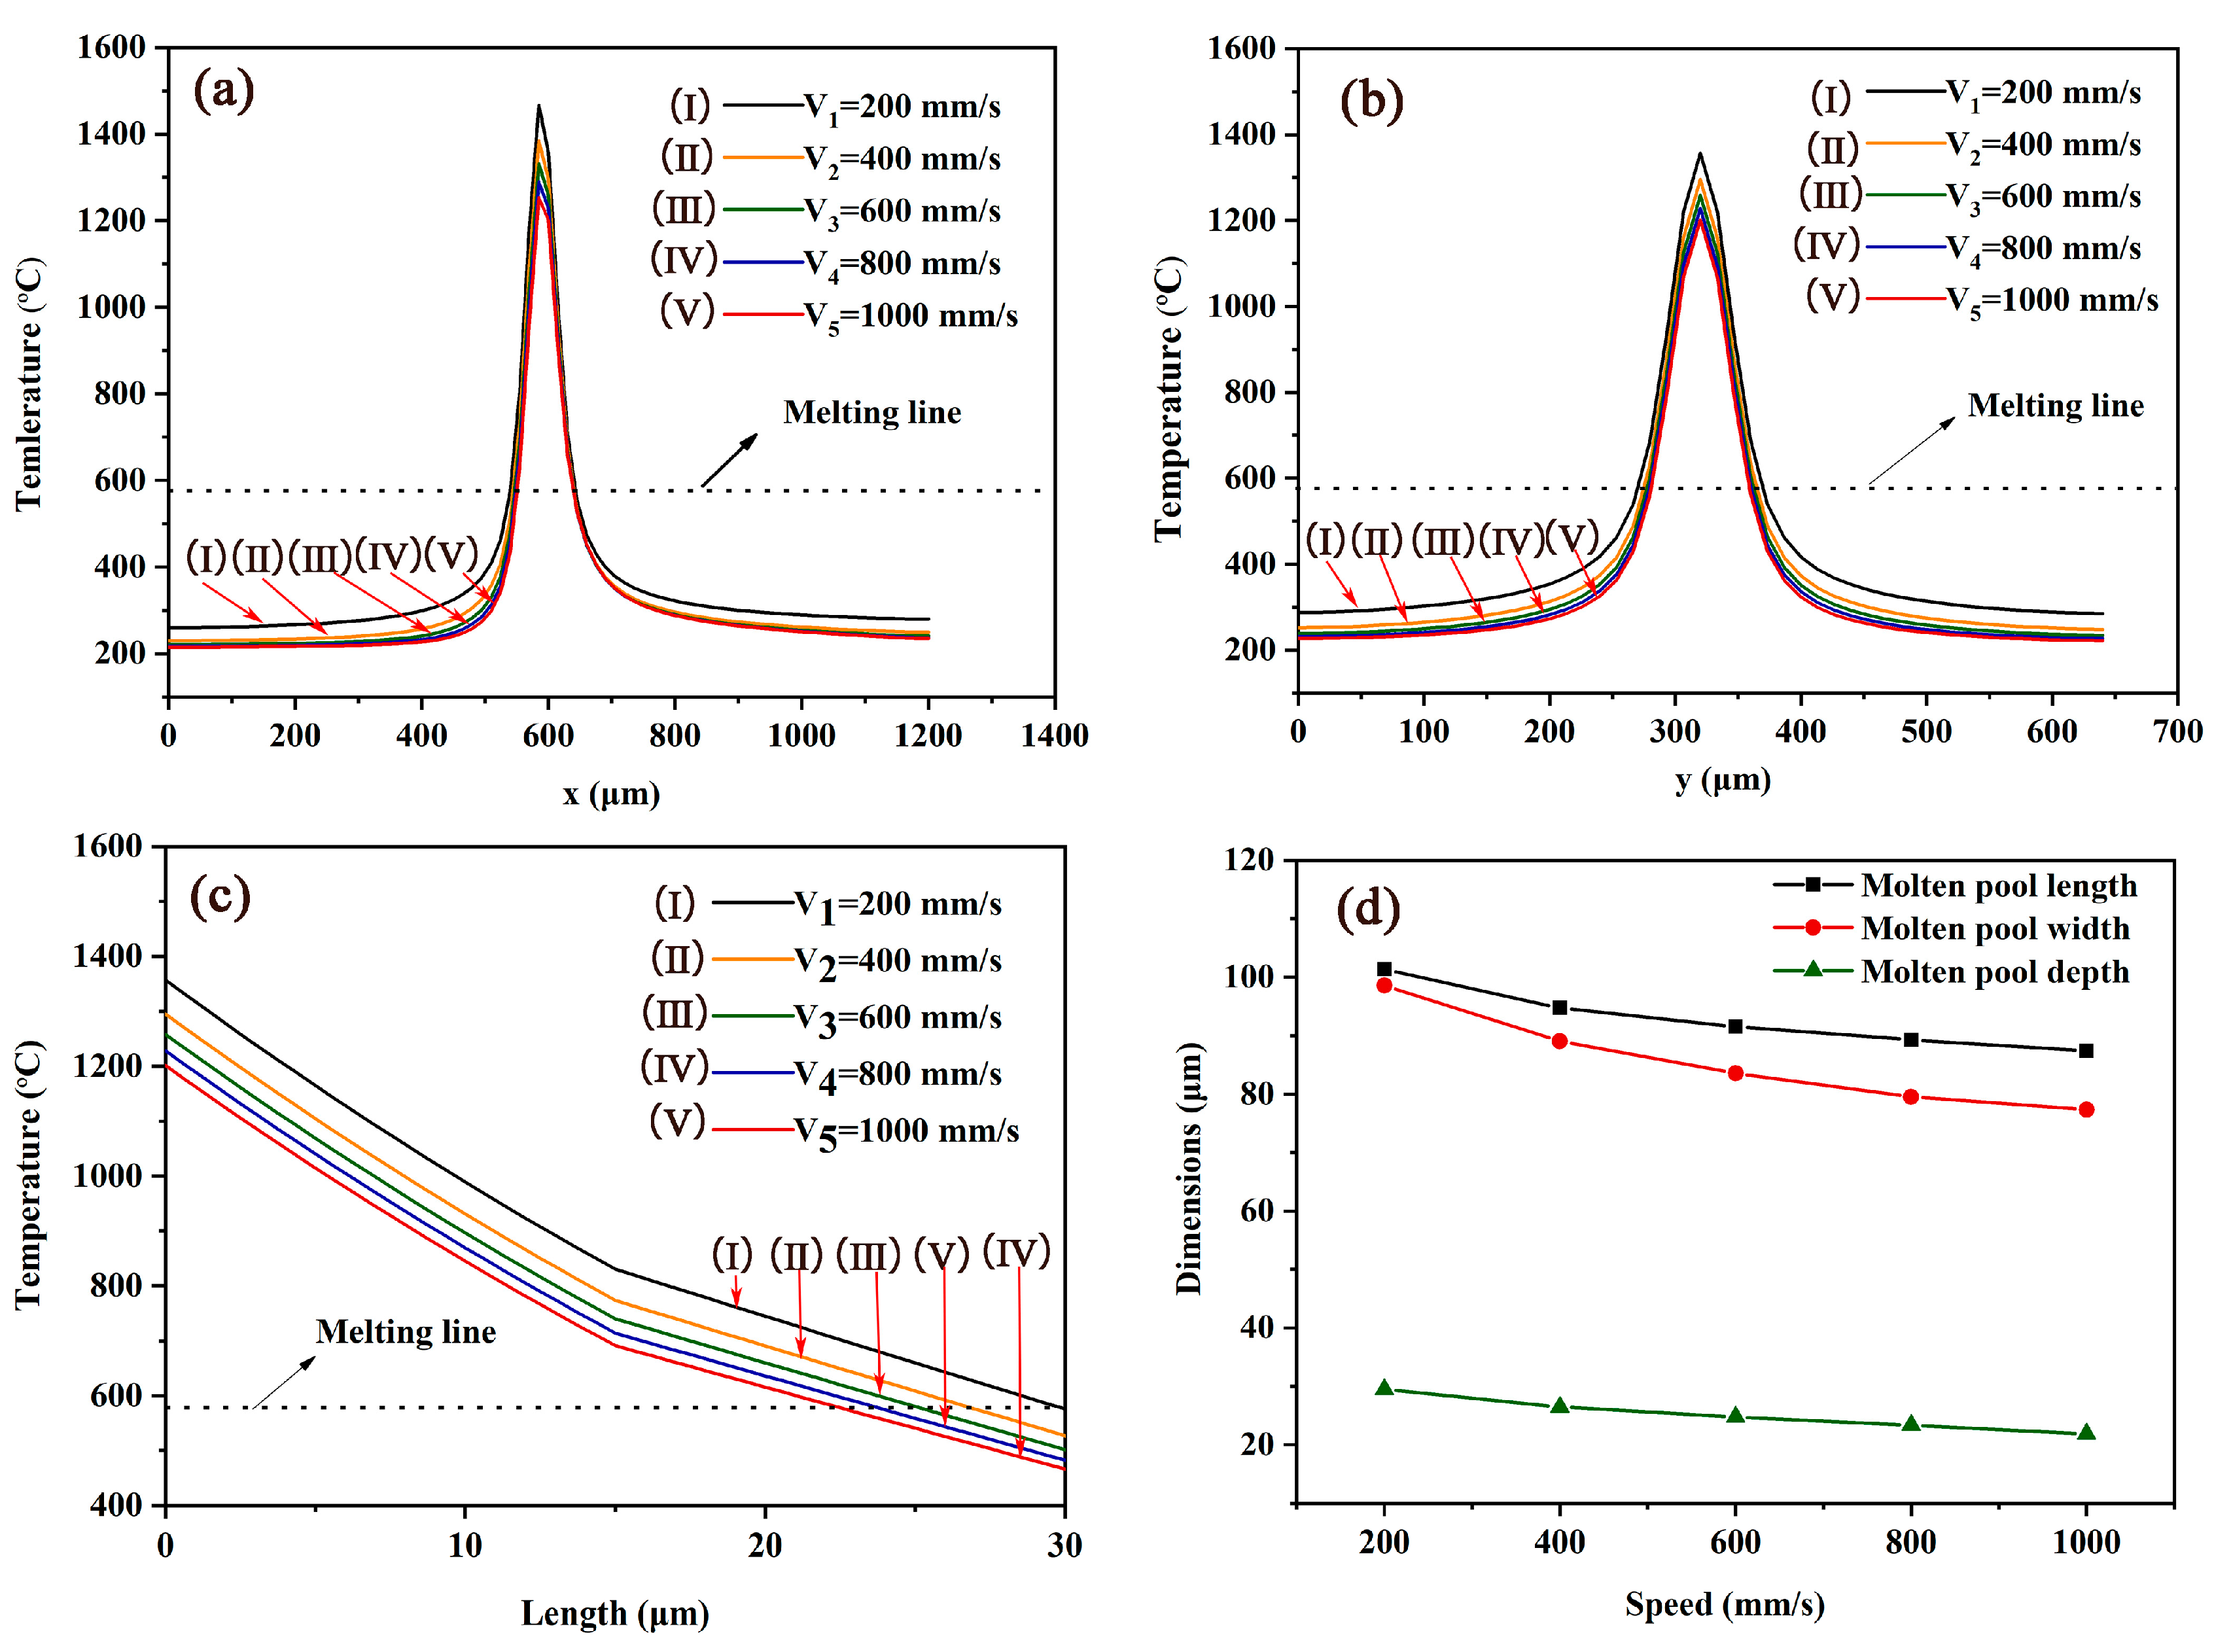
Figure 8a–c shows the temperature distribution along the x-axis (parallel scanning direction), y-axis (vertical scanning direction) and z-axis when P is 180 W and the scanning speed is 200, 400, 600, 800 and 1000 mm/s, respectively, with the laser spot center falling at Point 2. With the increase of scanning speed, the molten pool keeps on decreasing (Figure 8d). When v (200 mm/s) is relatively low, the length, width and depth of the pool are 101.35, 98.6 and 29.51 μm, respectively. When v is increased to 600 mm/s, the length, width and depth of the pool reduce to 91.55, 83.54 and 24.77 μm, respectively. When the speed is increased to 1000 mm/s, the length, width and depth of the pool decrease to 87.38, 77.34 and 21.88 μm, respectively.

3.3. Molten Pool Configurations

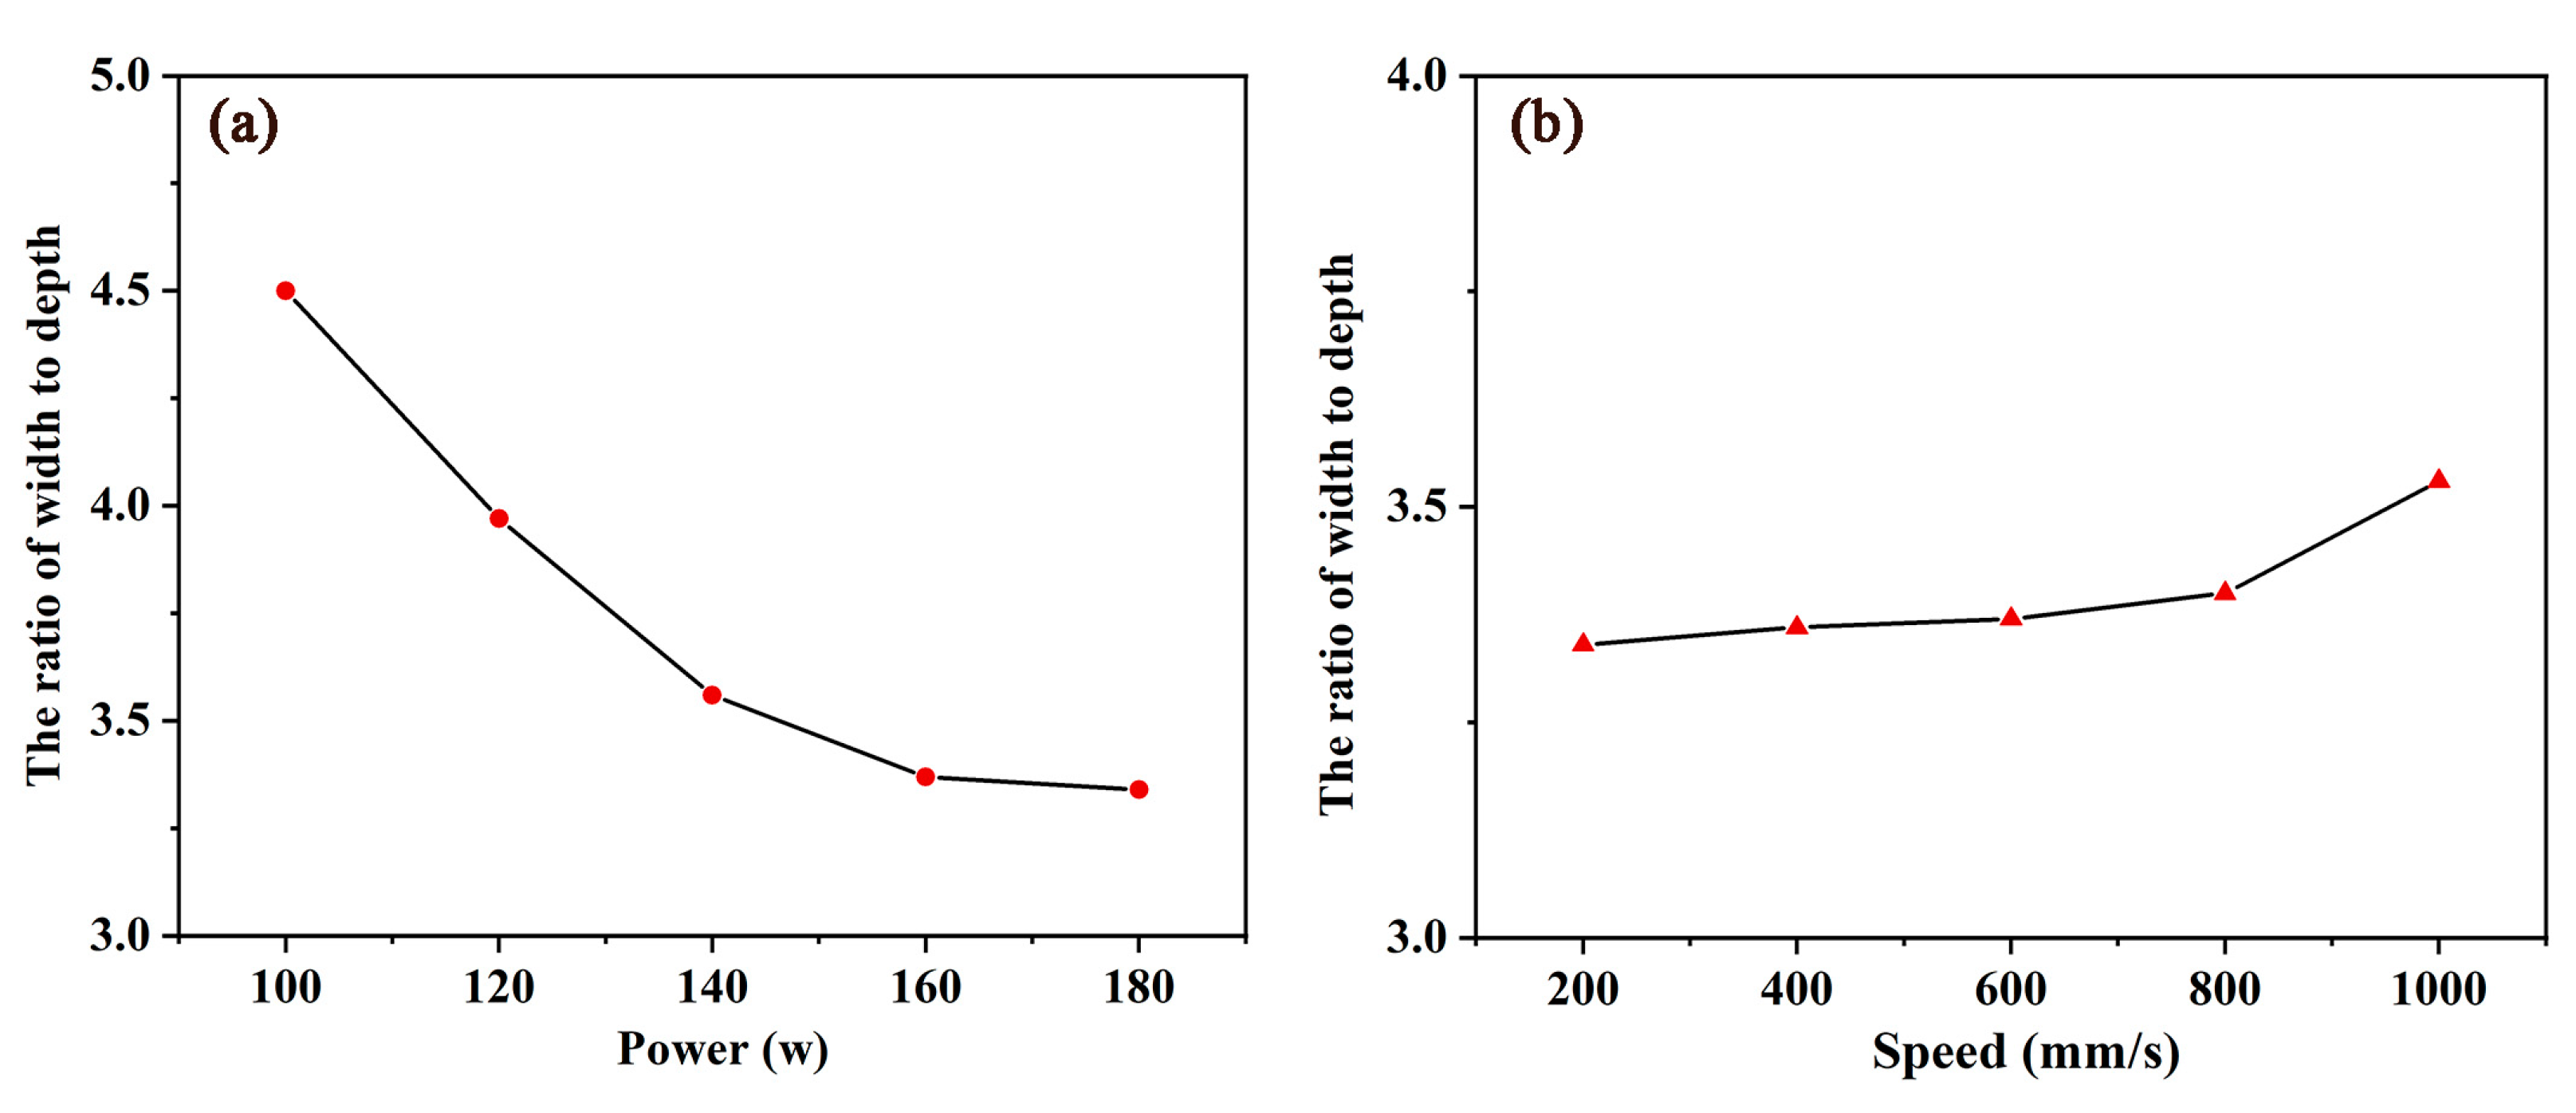
To describe the characteristics of the size change of the molten pool during the formation of AlSi25 by SLM, the width-to-depth ratio was used for a data-based description (Figure 9). The results indicate that the width and depth of the molten pool are significantly affected by the power, while the scanning speed remains basically the same. A complete melting and solidification of the powder is the prerequisite for the areas to be firmly bonded in the powder forming process. The metallurgical bonding of adjacent regions has a crucial influence on the density and geometric dimension accuracy of SLM parts. It should be noted that the intake energy regulated by applied P and v is a key factor in determining the metallurgical bonding force of SLM parts.
When the applied P is 180 W and v is 1000 mm/s, the molten pool formed is narrow, and the width of the molten pool (77.34 μm) is smaller than the scanning pitch (80 μm), which would result in poor combination between adjacent scanning channels. When P is 140 W and v is 200 mm/s, the width of the molten pool (75.83 μm) is less than the scanning pitch (80 μm), and the depth of the molten pool (26.55 μm) is less than the thickness of the powder layer, thus the unsintered parts might be easy to form. When P is at 180 W and the v is at 200 mm/s, the depth of the molten pool (29.51 μm) is roughly the same as the thickness of the powder layer (30 μm), and the combination between adjacent areas would be better. With the progress of the work, the depth of the molten pool will be further expanded and the metallurgical binding energy will be improved. The results show that the size of the molten pool is maximized under the parameters of P = 180 W and v = 200 mm/s, and the actual forming effect may be better. Therefore, this study carried out practical experiments to verify the forming effect of the best parameters obtained by simulation.

3.4. Experimental Investigation

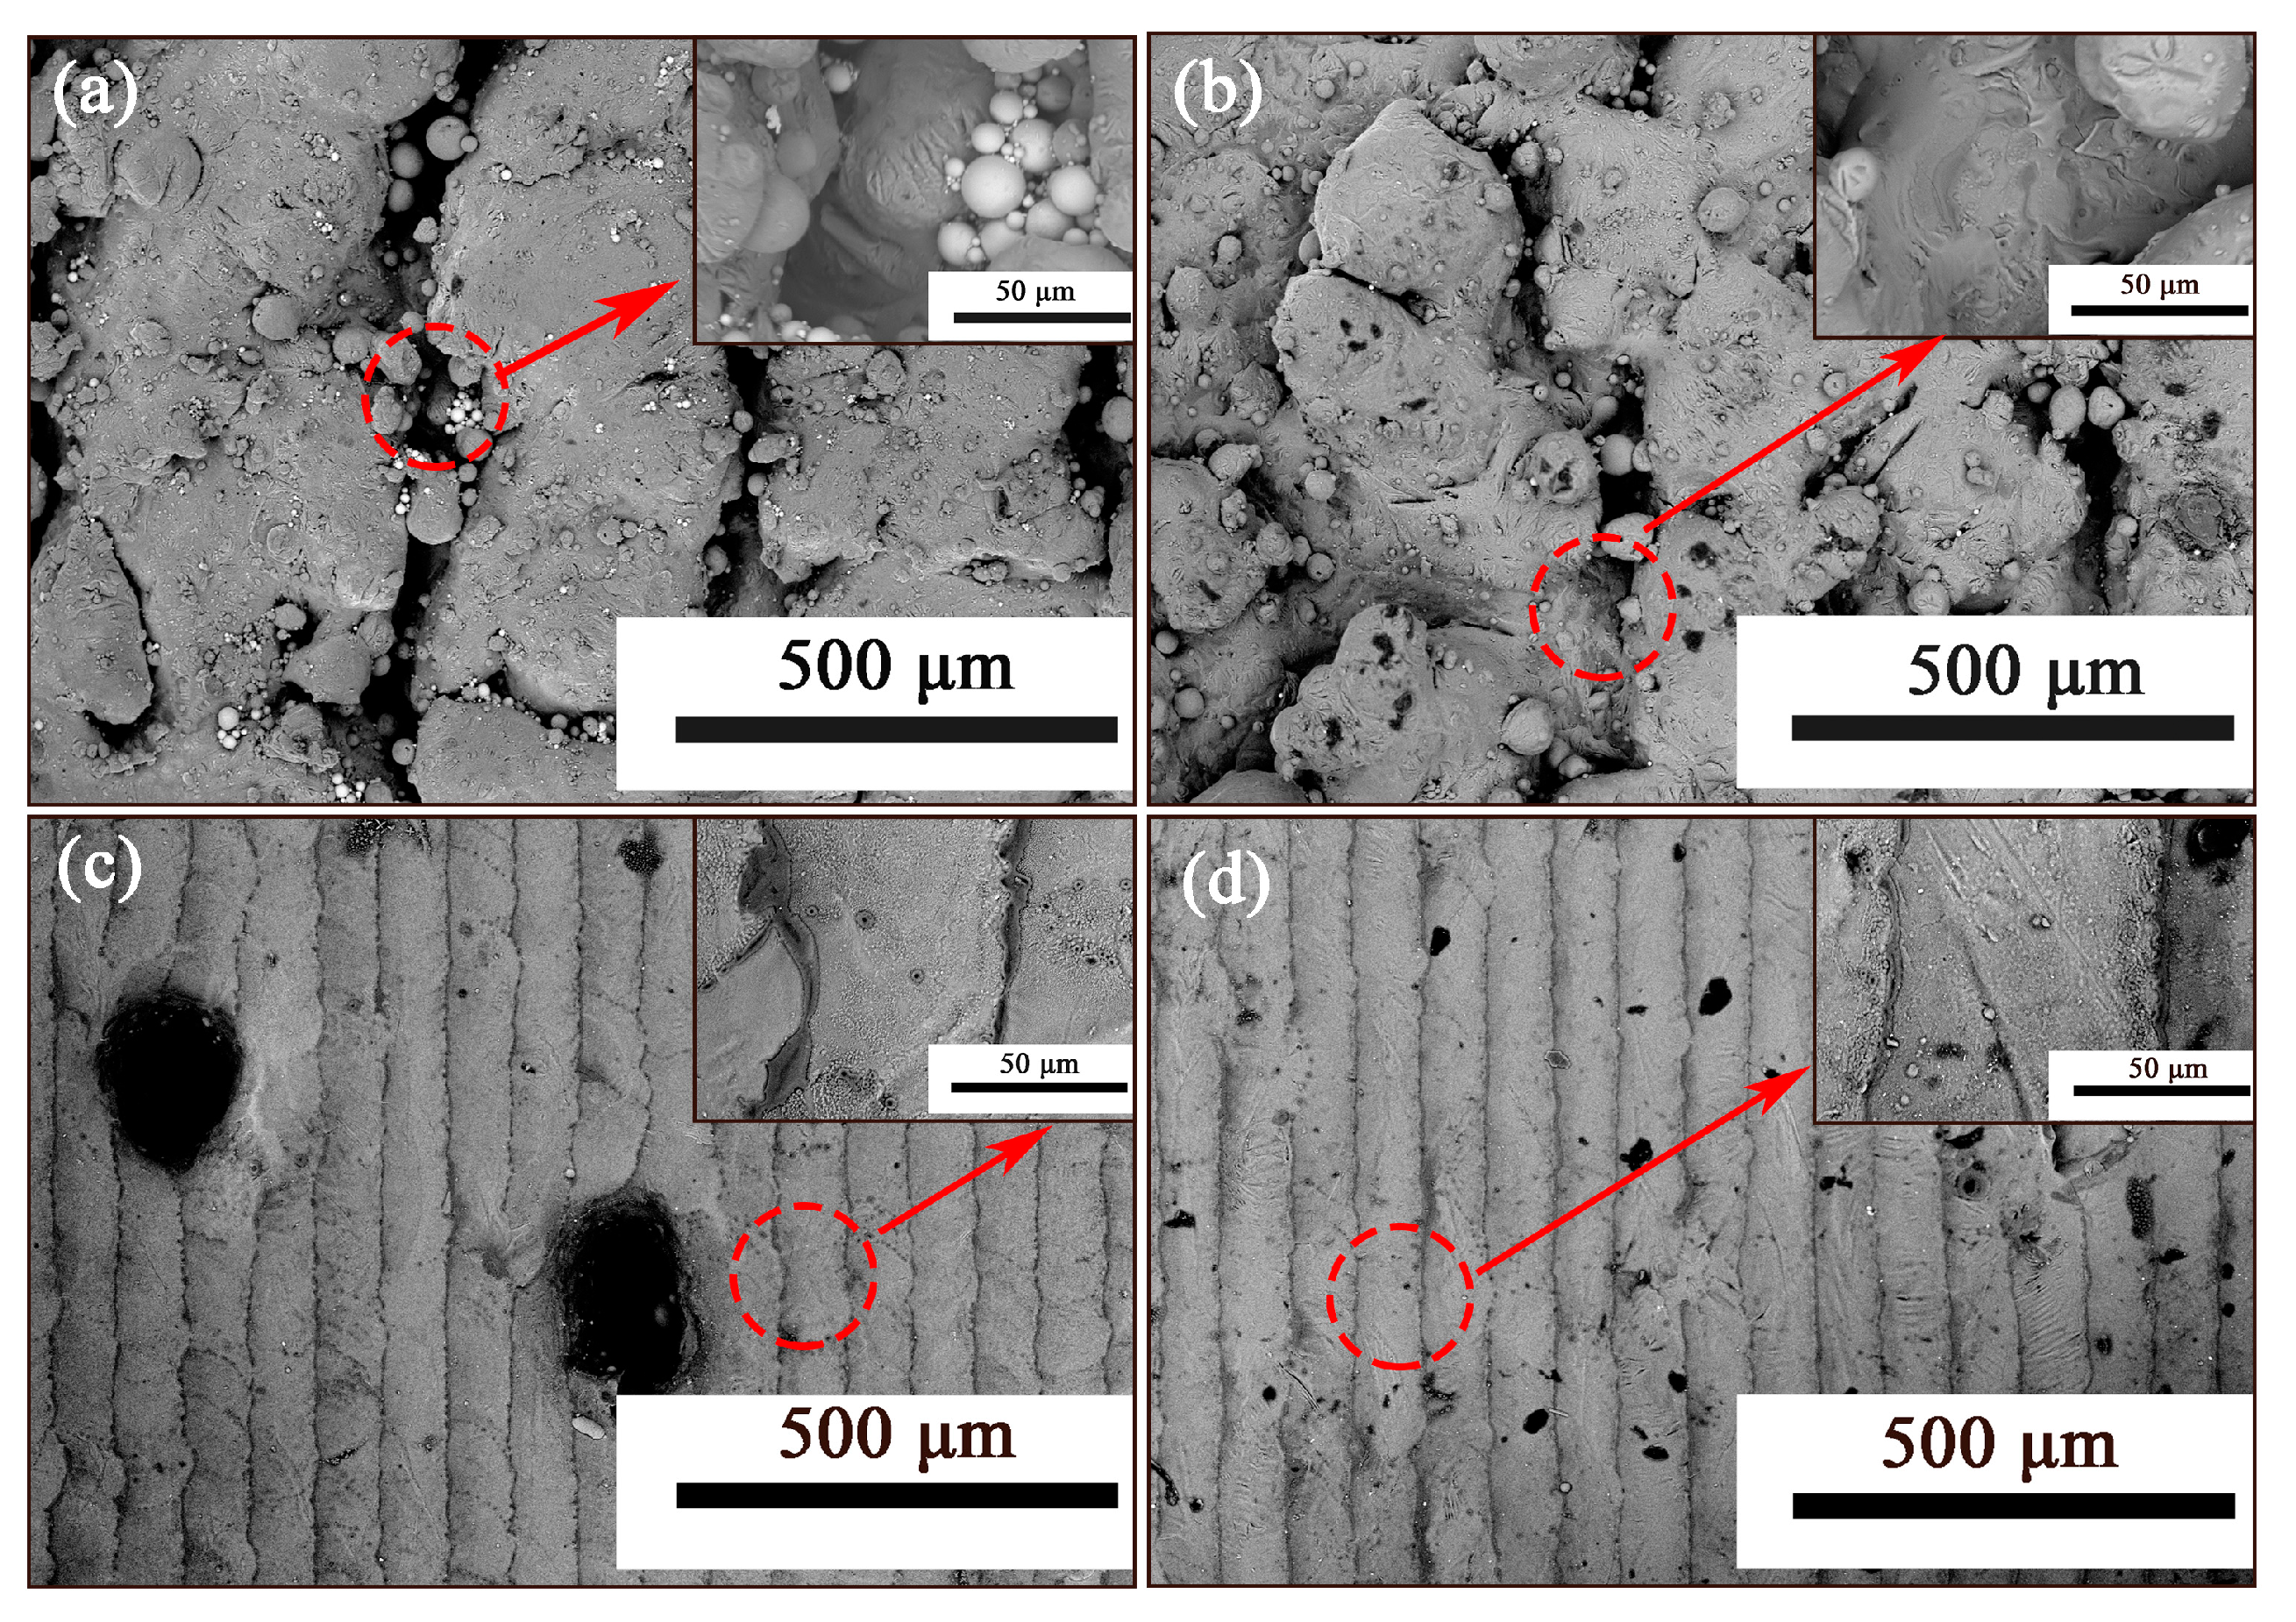
Figure 10 shows BSEM micrographs of the AlSi25 specimen cross-section prepared by SLM under different P. It can be observed that SLM has the characteristics of single-pass scanning and stacking, and there are obvious melting traces between lanes. The temperature of the formed molten pool is relatively low (822.91 °C) and its width is relatively narrow (54.8 μm) with a constant P of 100 W (Figure 6a). Therefore, the amount of liquid produced by AlSi25 is also extremely small, which leads to the layer-to-layer test. Large grooves appear in the cross-section of the sample. Since the melting depth is very shallow, this results in incomplete melting of sintered powder particles that span multiple molten layers (Figure 10a). Several irregular micro-holes are scattered on the surface of the sample when P is fixed at 120 W. The gullies in the region where the tracks meet are decreasing, and the powder in the gullies is almost melting (Figure 10b). On increasing P to 140 W, an intact surface morphology of SLM samples can be obtained. There are almost no gullies in the cross-section, and there are no obvious unfused marks between the channels, but with large holes (Figure 10c). A denser sample can be obtained, and the holes in the cross-section become smaller at P of 160 W (Figure 10d).
Figure 11 shows BSEM micrographs of the microstructure of a typical upper surface of a sample prepared by SLM at different v. When v is 1000 mm/s, the solidified surface quality of the SLM specimen is poor, with large grooves and holes, which is not suitable for our goal of densification (Figure 11a). As v is reduced to 400 mm/s, the grooved belt between the adjacent scanning channels disappears, and most of the SLM sample is a dense solidified surface with a small number of residual holes (Figure 11d). On decreasing v to 200 mm/s, a stable continuous scan line and good metallurgical bonding between the scan lines could be seen on the solidified surface of the SLM sample, resulting in a nearly complete compact and relatively smooth solidified surface (Figure 11e). During the SLM scanning process, the metallurgical bonding force between scanning channels affects the densification degree of SLM parts.
When v is 1000 mm/s, the temperature of the molten pool is lower (1201.3 °C) and the liquid phase exists for a short time (0.093 ms). That is why the liquid AlSi25 formed is less and the viscosity of the liquid is higher (Figure 6b). This limits the full spread of the liquid phase between the scanning channels, which results in the weld pool width (77.34 μm) being lower than the scanning pitch (80 μm), a poor combination between the scanning channels and large grooves and holes generated on the laser scanning line. When v is reduced to 800 mm/s, the amount of liquid AlSi25 produced increases and the width of the formed molten pool increases (79.52 μm), which improves the bonding state of the scanning area and increases the density behavior of SLM (Figure 8d and Figure 11b). when the scanning speed is further reduced to 600 mm/s, more materials are melted due to higher temperature, forming sufficient liquid AlSi25 with good fluidity (Figure 6b and Figure 11c). The width of the melting pool reaches 83.54 μm, which enables adjacent scanning channels to overlap and improves the shapability (Figure 8d). When the scanning speed is reduced to 200 mm/s, the width and depth of the melting pool reach 89.03 and 29.51 μm, respectively, which enables the adjacent channels to have an appropriate melting overlay rate (Figure 8d). Therefore, under this processing condition, the SLM samples can obtain good metallurgical bonding between scanning channels and nearly completely dense solidified surface.
The morphology and defects of the molten pool have changed with the variation of process parameters, which inevitably leads to changes in the density. Figure 12 shows the relative density variation curves of different process parameters. When P is relatively low at 100 W, the relative density is 95.8%. Increasing P to 120 W, the relative density is significantly increased until 97.6%. As the P continues increasing, the relative density increases (Figure 12a). This is mainly because, as the applied P increases, the unfused holes disappear and no longer significantly affect the density of the sample. The occurrence of spheroidization and the small pores caused by gas stagnation have a small effect on the density. It can be concluded that, as the speed increases, the relative density of the sample continuously decreases (Figure 12b). With the increase of v, the contact time between the laser and the powder becomes shorter, which leads to the decrease of fusion pool lapping rate, the increase of pores and the obvious decrease of density. The variation of density should also prove the change law of surface morphology. Under the optimal parameters, the sample surface has no obvious forming defects and the relative density is 98.8%. Compared with previous studies on aluminum alloy materials, the density is lower [40]. It is believed that three main factors may affect the density of the alloy. The first is the relatively low density. The laser scanning process exerts an impact on the fine powder, resulting in powder collision and splashing, which reduces the quality of the molten pool. The second is the high thermal conductivity of the AlSi25 alloy. After the laser scanning, the alloy cools down rapidly, resulting in the solidification of the molten pool without sufficient flow and fusion. Few pores and other defects exist in the alloy. The third reason is that oxidized impurities inevitably form in the SLM forming alloy, causing gaps between layers and molten pools and resulting in a decrease in alloy density. For the reasons mentioned above, the following measures can be taken in the future to improve the densification of the alloy. Firstly, select the powder with the same average particle size containing much coarser powder through the sieve powder device. Secondly, heating equipment can be appropriately adopted to preheat the substrate to reduce the occurrence of warpage caused by thermal expansion and contraction and reduce the generation of pores. Finally, it is suggested to use fine abrasive paper to treat the surface of the sample to reduce the effect of the rough surface on the density test when measuring the density.

4. Conclusions

We are devoted to better controlling the phenomena of the self-developed AlSi25 powder SLM process. A three-dimensional model was used as the carrier for numerical simulation. The simulation results reflect the influence of P and v through the variation of temperature data. The parameters with good molten pool structure were obtained by simulation, which provided valuable theoretical guidance for the printing process of AlSi25 powder. At the same time, the same simulation parameters were used for the SLM forming experiment. The morphology of the molten pool and the density of samples under different parameters were studied, which confirmed the reliability of simulation prediction.
The changes in the molten pool temperature, molten pool time, cooling rate and molten pool size of the powder under different P and v were investigated. Simulation experiments with the same parameters showed that, with the increase of scanning time, the temperature and size of the molten pool in the latter scanning channel are higher and higher due to the heat accumulation in the former scanning channel. The simulation results show that the maximum temperature, existence time and dimensions of the same monitoring point increase with the increase of P and decrease with the increase of v. When P is too low (120 W) or v is too high (1000 mm/s), grooves are likely to occur. Through simulation experiments, under the conditions of P = 180 W and v = 200 mm/s, the width of the molten pool is greater than the scanning interval, the depth of the molten pool is close to the thickness of the scanning powder layer, the temperature of the molten pool is higher than the melting temperature of the powder and the ratio of width to depth of this parameter is the highest, which is the basis for forming a better molten pool structure.
With the change of process parameters, the morphology and defect of molten pool change. When P (100 W) is low, the energy cannot completely melt the metal powder, and the unmelted powder particles are also distributed on the surface of the molten pool. Large gullies appear on the cross-section of the SLM sample, which affects the forming quality. On increasing P to 140 W, the liquid phase time is longer and the cooling rate is lower. The maximum temperature of the pool is higher, the ability to melt powder is stronger and there is no obvious unbound scanning channel but with irregular pores of varying sizes. When the SLM experiment was carried out under the optimized parameters obtained by simulation, the sample surface was relatively flat, the weld pool overlapped well and the spheroidization phenomenon and porosity decreased significantly. Under the conditions of P = 180 W and v = 200 mm/s, the sample density value printed was the highest, slightly lower than previous studies, because it was not polished with fine sandpaper before the density test, reducing the influence of surface residual impurities on its density. Therefore, the density of samples still has room to improve.
SLM technologies can realize the rapid prototyping and manufacturing of metal parts and has great potential and application value in many fields. The selective laser melting temperature field is simulated and the transfer form and temperature accumulation in the powder bed are obtained. Due to the limitations of time and existing conditions, the research on the temperature field is limited to the study on the local small-scale and short-term dynamic energy transfer, and the overall temperature field is not obtained. Therefore, the whole temperature field in the SLM processing process needs to be studied. In depth study of the internal relationship between temperature and forming mechanism is needed. Temperature is one of the most important factors in the entire forming process, which determines the quality of the molded part. In subsequent research, metallographic technology can be used to study the molten pool structure of the printed block. Although there are differences between the size of the model and the actual molten pool, the ratio of width to depth can be used to further strengthen their relationship.

Author Contributions

C.M., X.W. and P.Y. designed and supervised the experiments; C.M. and P.Y. conducted the experiments under the guidance of X.W. and B.Y.; C.M. prepared the manuscript; and P.Y. revised the manuscript. All the authors discussed the results of the manuscript. All authors have read and agreed to the published version of the manuscript.

Funding

This research received no external funding.

Conflicts of Interest

The authors declare no conflict of interest.

References

  1. Wang, Y.M.; Voisin, T.; McKeown, J.T.; Ye, J.; Calta, N.P.; Li, Z.; Zeng, Z.; Zhang, Y.; Chen, W.; Roehling, T.T.; et al. Additively manufactured hierarchical stainless steels with high strength and ductility. Nat. Mater. 2018, 17, 63–71. [Google Scholar] [CrossRef] [Green Version]
  2. Thijs, L.; Kempen, K.; Kruth, J.-P.; Van Humbeeck, J. Fine-structured aluminium products with controllable texture by selective laser melting of pre-alloyed AlSi10Mg powder. Acta Mater. 2013, 61, 1809–1819. [Google Scholar] [CrossRef] [Green Version]
  3. Pham, M.-S.; Liu, C.; Todd, I.; Lertthanasarn, J. Damage-tolerant architected materials inspired by crystal microstructure. Nature 2019, 565, 305–311. [Google Scholar] [CrossRef]
  4. Onal, E.; Frith, J.E.; Jurg, M.; Wu, X.; Molotnikov, A. Mechanical Properties and In Vitro Behavior of Additively Manufactured and Functionally Graded Ti6Al4V Porous Scaffolds. Metals 2018, 8, 200–221. [Google Scholar] [CrossRef] [Green Version]
  5. Vandenbroucke, B.; Kruth, J.-P. Selective laser melting of biocompatible metals for rapid manufacturing of medical parts. Rapid Prototyp. J. 2007, 13, 196–203. [Google Scholar] [CrossRef]
  6. Buj-Corral, I.; Tejo-Otero, A.; Fenollosa, F. Development of AM Technologies for Metals in the Sector of Medical Implants. Metals 2020, 10, 686–716. [Google Scholar] [CrossRef]
  7. Brandl, E.; Heckenberger, U.; Holzinger, V.; Buchbinder, D. Additive manufactured AlSi10Mg samples using Selective Laser Melting (SLM): Microstructure, high cycle fatigue, and fracture behavior. Mater. Des. 2012, 34, 159–169. [Google Scholar] [CrossRef]
  8. Li, S.; Wei, Q.; Shi, Y.; Zhu, Z.; Zhang, D. Microstructure Characteristics of Inconel 625 Superalloy Manufactured by Selective Laser Melting. J. Mater. Sci. Technol. 2015, 31, 946–952. [Google Scholar] [CrossRef]
  9. Edwards, P.; Ramulu, M. Fatigue performance evaluation of selective laser melted Ti–6Al–4V. Mater. Sci. Eng. A 2014, 598, 327–337. [Google Scholar] [CrossRef]
  10. Ma, P.; Gokuldoss, P.K.; Scudino, S.; Jia, Y.; Wang, H.; Zou, C.; Wei, Z.; Eckert, J. Influence of Annealing on Mechanical Properties of Al-20Si Processed by Selective Laser Melting. Metals 2014, 4, 28–36. [Google Scholar] [CrossRef]
  11. Li, Z.; Kuai, Z.; Bai, P.; Nie, Y.; Fu, G.; Liu, W.; Yang, S. Microstructure and Tensile Properties of AlSi10Mg Alloy Manufactured by Multi-Laser Beam Selective Laser Melting (SLM). Metals 2019, 9, 1337. [Google Scholar] [CrossRef] [Green Version]
  12. Ghosh, S.K.; Saha, P. Crack and wear behavior of SiC particulate reinforced aluminium based metal matrix composite fabricated by direct metal laser sintering process. Mater. Des. 2011, 32, 139–145. [Google Scholar] [CrossRef]
  13. Gu, D.; Shen, Y. Balling phenomena in direct laser sintering of stainless steel powder: Metallurgical mechanisms and control methods. Mater. Des. 2009, 30, 2903–2910. [Google Scholar] [CrossRef]
  14. Han, X.; Zhu, H.; Nie, X.; Wang, G.; Zeng, X. Investigation on Selective Laser Melting AlSi10Mg Cellular Lattice Strut: Molten Pool Morphology, Surface Roughness and Dimensional Accuracy. Materials 2018, 11, 392. [Google Scholar] [CrossRef] [PubMed] [Green Version]
  15. Dadbakhsh, S.; Mertens, R.; Hao, L.; Van Humbeeck, J.; Kruth, J.-P. Selective Laser Melting to Manufacture “In Situ” Metal Matrix Composites: A Review. Adv. Eng. Mater. 2019, 21, 1801244. [Google Scholar] [CrossRef] [Green Version]
  16. Zhang, B.; Liao, H.; Coddet, C. Effects of processing parameters on properties of selective laser melting Mg–9%Al powder mixture. Mater. Des. 2012, 34, 753–758. [Google Scholar] [CrossRef]
  17. Manakari, V.; Parande, G.; Gupta, M. Selective Laser Melting of Magnesium and Magnesium Alloy Powders: A Review. Metals 2016, 7, 2–37. [Google Scholar] [CrossRef] [Green Version]
  18. Shi, Y.; Shen, H.; Yao, Z.; Hu, J. An analytical model based on the similarity in temperature distributions in laser forming. Opt. Lasers Eng. 2007, 45, 83–87. [Google Scholar] [CrossRef]
  19. Yadroitsev, I.; Bertrand, P.; Smurov, I.; Bertrand, P. Parametric analysis of the selective laser melting process. Appl. Surf. Sci. 2007, 253, 8064–8069. [Google Scholar] [CrossRef]
  20. Wang, G.; Huang, L.; Liu, Z.; Qin, Z.; He, W.; Liu, F.; Chen, C.; Nie, Y. Process optimization and mechanical properties of oxide dispersion strengthened nickel-based superalloy by selective laser melting. Mater. Des. 2020, 188, 108418. [Google Scholar] [CrossRef]
  21. Qian, N.; Zhao, Z.; Fu, Y.; Xu, J.; Chen, J. Numerical Analysis on Temperature Field of Grinding Ti-6Al-4V Titanium Alloy by Oscillating Heat Pipe Grinding Wheel. Metals 2020, 10, 670–686. [Google Scholar] [CrossRef]
  22. Ning, J.; Mirkoohi, E.; Dong, Y.; Sievers, D.E.; Garmestani, H.; Liang, S.Y. Analytical modeling of 3D temperature distribution in selective laser melting of Ti-6Al-4V considering part boundary conditions. J. Manuf. Process. 2019, 44, 319–326. [Google Scholar] [CrossRef]
  23. Sibalic, N.; Vukcevic, M. Numerical Simulation for FSW Process at Welding Aluminium Alloy AA6082-T6. Metals 2019, 9, 747–761. [Google Scholar] [CrossRef] [Green Version]
  24. Wu, J.; Wang, X.; Wang, W.; Attallah, M.M.; Loretto, M. Microstructure and strength of selectively laser melted AlSi10Mg. Acta Mater. 2016, 117, 311–320. [Google Scholar] [CrossRef]
  25. Aboulkhair, N.T.; Maskery, I.; Tuck, C.; Ashcroft, I.; Everitt, N.M.; Tuck, C. Improving the fatigue behaviour of a selectively laser melted aluminium alloy: Influence of heat treatment and surface quality. Mater. Des. 2016, 104, 174–182. [Google Scholar] [CrossRef]
  26. Delahaye, J.; Tchuindjang, J.T.; Lecomte-Beckers, J.; Rigo, O.; Habraken, A.; Mertens, A. Influence of Si precipitates on fracture mechanisms of AlSi10Mg parts processed by Selective Laser Melting. Acta Mater. 2019, 175, 160–170. [Google Scholar] [CrossRef]
  27. Zhang, G.-H.; Zhang, J.-X.; Li, B.-C.; Cai, W. Characterization of tensile fracture in heavily alloyed Al-Si piston alloy. Prog. Nat. Sci. 2011, 21, 380–385. [Google Scholar] [CrossRef] [Green Version]
  28. Hekimoğlu, A.P.; Çalış, M.; Ayata, G. Effect of Strontium and Magnesium Additions on the Microstructure and Mechanical Properties of Al–12Si Alloys. Met. Mater. Int. 2019, 25, 1488–1499. [Google Scholar] [CrossRef]
  29. Pei, Y.T.; De Hosson, J.T.M. Functionally graded materials produced by laser cladding. Acta Mater. 2000, 48, 2617–2624. [Google Scholar] [CrossRef] [Green Version]
  30. Kang, N.; Coddet, P.; Liao, H.; Coddet, C. Macrosegregation mechanism of primary silicon phase in selective laser melting hypereutectic Al—High Si alloy. J. Alloys Compd. 2016, 662, 259–262. [Google Scholar] [CrossRef]
  31. Kang, N.; Coddet, P.; Chen, C.; Wang, Y.; Liao, H.; Coddet, C. Microstructure and wear behavior of in-situ hypereutectic Al–high Si alloys produced by selective laser melting. Mater. Des. 2016, 99, 120–126. [Google Scholar] [CrossRef]
  32. Yi, H.; Zhang, D. Morphologies of Si phase and La-rich phase in as-cast hypereutectic Al–Si–xLa alloys. Mater. Lett. 2003, 57, 2523–2529. [Google Scholar] [CrossRef]
  33. Anand, S.; Srivatsan, T.S.; Wu, Y.; Lavernia, E.J. Processing, microstructure and fracture behavior of a spray atomized and deposited aluminum–silicon alloy. J. Mater. Sci. Technol. 1997, 32, 2835–2848. [Google Scholar]
  34. Liu, G.; Li, G.; Cai, A.; Chen, Z. The influence of Strontium addition on wear properties of Al–20wt% Si alloys under dry reciprocating sliding condition. Mater. Des. 2011, 32, 121–126. [Google Scholar] [CrossRef]
  35. McDonald, S.A.; Nogita, K.; Dahle, A.K. Eutectic nucleation in Al–Si alloys. Acta Mater. 2004, 52, 4273–4280. [Google Scholar] [CrossRef]
  36. Mao, F.; Wei, S.; Ou, L.; Zhang, C.; Chen, C.; Wang, X.; Cao, Z. Different Influences of Rare Earth Eu Addition on Primary Si Refinement in Hypereutectic Al–Si Alloys with Varied Purity. Materials 2019, 12, 3505. [Google Scholar] [CrossRef] [Green Version]
  37. Gremaud, M.; Allen, D.; Rappaz, M.; Perepezko, J. The development of nucleation controlled microstructures during laser treatment of AlSi alloys. Acta Mater. 1996, 44, 2669–2681. [Google Scholar] [CrossRef]
  38. Roehling, J.D.; Coughlin, D.R.; Gibbs, J.W.; Baldwin, J.K.; Mertens, J.C.; Campbell, G.H.; Clarke, A.J.; McKeown, J.T. Rapid solidification growth mode transitions in Al-Si alloys by dynamic transmission electron microscopy. Acta Mater. 2017, 131, 22–30. [Google Scholar] [CrossRef] [Green Version]
  39. Olakanmi, E.O. Selective laser sintering/melting (SLS/SLM) of pure Al, Al–Mg, and Al–Si powders: Effect of processing conditions and powder properties. J. Mater. Process. Technol. 2013, 213, 1387–1405. [Google Scholar] [CrossRef]
  40. Hanemann, T.; Carter, L.N.; Habschied, M.; Adkins, N.J.; Attallah, M.M.; Heilmaier, M. In-situ alloying of AlSi10Mg+Si using Selective Laser Melting to control the coefficient of thermal expansion. J. Alloys Compd. 2019, 795, 8–18. [Google Scholar] [CrossRef] [Green Version]
  41. Dai, K.; Shaw, L. Thermal and stress modeling of multi-material laser processing. Acta Mater. 2001, 49, 4171–4181. [Google Scholar] [CrossRef]
  42. Roberts, I.; Wang, C.J.; Esterlein, R.; Stanford, M.; Mynors, D. A three-dimensional finite element analysis of the temperature field during laser melting of metal powders in additive layer manufacturing. Int. J. Mach. Tools Manuf. 2009, 49, 916–923. [Google Scholar] [CrossRef]
  43. Hu, H.; Ding, X.; Wang, L. Numerical analysis of heat transfer during multi-layer selective laser melting of AlSi10Mg. Optik 2016, 127, 8883–8891. [Google Scholar] [CrossRef]
  44. Shi, Q.; Gu, D.; Xia, M.; Cao, S.; Rong, T. Effects of laser processing parameters on thermal behavior and melting/solidification mechanism during selective laser melting of TiC/Inconel 718 composites. Opt. Laser Technol. 2016, 84, 9–22. [Google Scholar] [CrossRef]
  45. Xiao, Z.; Yang, Y.; Wang, D.; Song, C.; Bai, Y. Structural optimization design for antenna bracket manufactured by selective laser melting. Rapid Prototyp. J. 2018, 24, 539–547. [Google Scholar] [CrossRef]
  46. Salonitis, K.; Al Zarban, S. Redesign Optimization for Manufacturing Using Additive Layer Techniques. Procedia CIRP 2015, 36, 193–198. [Google Scholar] [CrossRef] [Green Version]
  47. Kruth, J.-P.; Levy, G.; Klocke, F.; Childs, T.H.C. Consolidation phenomena in laser and powder-bed based layered manufacturing. CIRP Ann. 2007, 56, 730–759. [Google Scholar] [CrossRef]
  48. Zhang, G.; Chen, J.; Zheng, M.; Yan, Z.; Lu, X.; Lin, X.; Huang, W. Element Vaporization of Ti-6Al-4V Alloy during Selective Laser Melting. Metals 2020, 10, 435. [Google Scholar] [CrossRef] [Green Version]
  49. Michaleris, P. Modeling metal deposition in heat transfer analyses of additive manufacturing processes. Finite Elem. Anal. Des. 2014, 86, 51–60. [Google Scholar] [CrossRef]
  50. Khan, H.; Dirikolu, M.; Koç, E.; Oter, Z.C. Numerical investigation of heat current study across different platforms in SLM processed multi-layer AlSi10Mg. Optik 2018, 170, 82–89. [Google Scholar] [CrossRef]
  51. Mirkoohi, E.; Seivers, D.E.; Garmestani, H.; Liang, S.Y. Heat Source Modeling in Selective Laser Melting. Materials 2019, 12, 2052–2070. [Google Scholar] [CrossRef] [PubMed] [Green Version]
  52. Hussein, A.; Hao, L.; Yan, C.; Everson, R. Finite element simulation of the temperature and stress fields in single layers built without-support in selective laser melting. Mater. Des. 2013, 52, 638–647. [Google Scholar] [CrossRef]
  53. Dong, L.; Makradi, A.; Ahzi, S.; Remond, Y. Three-dimensional transient finite element analysis of the selective laser sintering process. J. Mater. Process. Technol. 2009, 209, 700–706. [Google Scholar] [CrossRef]
  54. Li, Y.; Gu, D. Parametric analysis of thermal behavior during selective laser melting additive manufacturing of aluminum alloy powder. Mater. Des. 2014, 63, 856–867. [Google Scholar] [CrossRef]
  55. Wang, L.; Jiang, X.; Zhu, Y.; Zhu, X.; Sun, J.; Yan, B. An approach to predict the residual stress and distortion during the selective laser melting of AlSi10Mg parts. Int. J. Adv. Manuf. Technol. 2018, 97, 3535–3546. [Google Scholar] [CrossRef]
  56. Dai, K.; Shaw, L. Finite element analysis of the effect of volume shrinkage during laser densification. Acta Mater. 2005, 53, 4743–4754. [Google Scholar] [CrossRef]
  57. Criales, L.E.; Arısoy, Y.M.; Özel, T. Sensitivity analysis of material and process parameters in finite element modeling of selective laser melting of Inconel 625. Int. J. Adv. Manuf. Technol. 2016, 86, 2653–2666. [Google Scholar] [CrossRef]
Figure 1. Schematic of thermophysical phenomena during SLM forming.
Metals 10 00877 g001
Figure 2. Laser scanning arrangement in the simulation program (Point 1: midpoint of the first scanning line; Point 2: the midpoint of the fourth scanning line; and Point 3: midpoint of the last scanning line).
Metals 10 00877 g002
Figure 3. SEM image of AlSi25 powder sample surface.
Metals 10 00877 g003
Figure 4. Temperature change with time at monitoring Points 1–3 when v = 200 mm/s and P = 180 W.
Metals 10 00877 g004
Figure 5. The temperature variation with time in the AlSi25 powder SLM process (Point 2): (a) different P (v = 200 mm/s); and (b) different v (P = 180 W).
Metals 10 00877 g005
Figure 6. The maximum temperature and the existence time in the AlSi25 powder SLM process: (a) different powers (v = 200 mm/s); and (b) different laser speeds (P = 180 W).
Metals 10 00877 g006
Figure 7. Temperature distribution of the P at Point 2 when v (200 mm/s): (a) the x-axis direction; (b) the y-axis direction; (c) the z-axis direction; and (d) dimensions of the molten pool.
Metals 10 00877 g007
Figure 8. Temperature distribution of the different v at Point 2 when laser power P =180 W: (a) the x-axis direction; (b) the y-axis direction; (c) the z-axis direction; and (d) dimensions of the molten pool.
Metals 10 00877 g008
Figure 9. The width/depth ratio of the molten pool changes under different process parameters: (a) v = 200 mm/s is fixed; and (b) P = 180 W is fixed.
Metals 10 00877 g009
Figure 10. BSEM microstructure of AlSi25 samples at different P when v = 200 mm/s: (a) 100 W; (b) 120 W; (c) 140 W; and (d) 160 W.
Metals 10 00877 g010
Figure 11. BSEM microstructure of AlSi25 samples at different speed when laser power is 180 W: (a) 1000 mm/s; (b) 800 mm/s; (c) 600 mm/s; (d) 400 mm/s; and (e) 200 mm/s.
Metals 10 00877 g011
Figure 12. Variation of SLM sample relative density under different parameters: (a) using different P (v = 200 mm/s); and (b) using different v (P = 180 W).
Metals 10 00877 g012
Table 1. Thermal properties of AlSi25 alloy [54].
Temperature (°C)25100200300400500
Thermal conductivity, Ks (W/m °C )189175158144132121
Specific heat capacity, c (J/kg °C)85490194798710251069
Density, ρ (kg/m3)2684
Table 2. Composition of the AlSi25 powder.
PowderAlSi
Mass fraction (%)75.4424.56
Table 3. Finite element simulation parameters [57].
ParametersValue
Absorption Coefficient, AC0.09
Layer thickness, d (μm)30
Scanning pitch, S (μm)80
Laser facula diameter, D (μm)50
Ambient temperature, T (°C)25
Laser power, P (W)100, 120, 140, 160, 180
Scan speed, v (mm/s)200, 400, 600, 800, 1000