Article

Numerical Analysis of RTD Curves and Inclusions Removal in a Multi-Strand Asymmetric Tundish with Different Configuration of Impact Pad

1
Faculty of Materials Science and Technology, VŠB—Technical University of Ostrava, 17. listopadu 2172/15, 70800 Ostrava, Czech Republic
2
TŘINECKÉ ŽELEZÁRNY, a.s, Průmyslová 1000, Staré Město, 739 61 Třinec, Czech Republic
*
Author to whom correspondence should be addressed.
Metals 2020, 10(7), 849; https://doi.org/10.3390/met10070849
Submission received: 31 May 2020 / Revised: 22 June 2020 / Accepted: 24 June 2020 / Published: 27 June 2020
(This article belongs to the Special Issue Numerical Modelling in Steel Metallurgy)

Abstract

:
To effectively remove non-metallic inclusions from the steel during the flowing in a five-strand asymmetric tundish, the novel configuration of the impact pad was developed. For analysis, complex numerical modelling in the programme ANSYS Fluent was used. The Lagrangian Discrete Phase Model of inclusion tracking was applied. The distribution of inclusions, with sizes ranging from 2 µm to 100 µm and density from 2500 to 3500 kg·m−3, was considered only through the shroud tube. The residence time distribution (RTD) curves and inclusion removal efficiency were used for evaluation of steady state steel flow character depending on internal configuration of a tundish with an impact pad in two design modifications (Modification 1—M1, Modification 2—M2). The preliminary results showed that in the case of asymmetric geometry plays a role the computational mesh independency. The assembly method with cut cell approach was satisfactory even when the tundish geometry was changed. The RTD curves with an M1 showed a huge dead volume in the tundish. In the case with an M2, the RTD curves are more or less uniform for all casting strands, and the removal of inclusions to slag increased from about 55% up to 70% in comparison with M1.

1. Introduction

At present, the world production of continuously cast steel accounts for 96% of the total. In the Czech Republic, approx. 92% of steel is cast by continuous casting [1]. During the continuous casting of steel, the ladle with steel melt is placed on the rotating casting stand of a casting machine. From the ladle, the steel is cast through the shroud tube into the tundish. Then, the steel is taken through the submerged entry nozzle to the oscillating moulds (in the primary cooling zone), where the “controlled” solidification of steel is ensured. There, under the moulds, is a system of guiding and supportive rollers (the secondary cooling zone), including refrigerating nozzles, which ensure the drawing, transforming, and cooling of the casting strand of steel [2,3].
Tundish is one of the most important technology nodes of a continuous casting machine. It primarily serves as the melt reservoir in the sequential casting during the exchange of ladles and ensures the melt distribution into individual casting strands [4,5,6,7,8]. The tundish also regulates the steel mass flow into moulds, reduces ferrostatic pressure of the liquid steel, and homogenizes the melt temperature [9,10,11,12,13]. Flow in the tundish region during the continuous casting of steel can influence many important phenomena, especially removal of the non-metallic inclusions (e.g., [14,15]).
Inclusions are non-metallic particles that can be endogenous or exogenous in nature and, if not removed from the steel melt during its processing, reduce the quality of the finished steel product [16]. The last point where the amount of non-metallic inclusions in the steel melt can be modified during continuous casting is mainly the tundish. Therefore, a number of studies are devoted to the optimization of the flow in the tundish using different weirs and dams [17,18,19,20,21,22,23,24,25], impact pads (e.g., [26,27]), ladle shroud [28], or argon injection [29,30,31]. To study the steel flow, the authors usually utilize the knowledge of experimental measurements or modelling methods, both physical and numerical (e.g., [32]). To evaluate the nature of the flow, they use measuring methods of the tracing agent concentration as it passes through the reactor and determine the so-called RTD (residence time distribution) curves.
The situation becomes more complicated when performing a check of the reduction of inclusions during the flow of steel melt in the tundish. Because the verification of inclusions rising to the top slag in the tundish by means of operational measurements is unrealistic or very demanding in the case of physical modelling [12,14,33,34], the authors of the publications use numerical modelling (e.g., [35,36,37]). However, in the publications dealing with numerical modelling of inclusions removal, there is only a sporadic description of a complex modelling procedure, while the articles are mainly limited to the evaluation of inclusion separation depending on the selected boundary conditions of casting. Nevertheless, the results of numerical modelling depend on the accuracy of the setting of the model. In published papers, the mathematical formulations of solving equations are obviously discussed. In this case, the [38,39,40] presented only short information about the study of mesh independence.
Because numerical modelling is a very valuable tool in metallurgy, especially in cases where a physical model of the equipment is not available, the submitted paper aims to present a complete procedure of numerical solution. Because most authors used the package CFD ANSYS Workbench (CFD—Computational Fluid Dynamics) with software ANSYS Fluent, we also carried out our analysis using this software. The numerical solution of inclusions removal using Lagrangian approach is demonstrated in the development of the configuration change design of the impact pad for an asymmetric five-strand tundish. The presented solution lies in a specific complexity of the geometry of the tundish model, which is, in addition to the asymmetrical shape of the tundish, also complicated by the presence of impact pad and stoppers. Therefore, in addition to the description of the modelling procedure and the selection of appropriate physical models, attention is paid in the discussion to the preparation of an independent computational mesh. An independent computational mesh is important in case of the complex geometry of the modelled area, or in case of change of geometry of the modelled area, and if we do not have other methods of process verification available, and based on the result of numerical modelling, we give recommendations for operation. The flow character of the steel melt in the tundish is studied using velocity vectors, temperature fields profile, RTD curves, retention times and volumes in the tundish (mixed, dead and plug). A removal efficiency of inclusions was evaluated depending on steady state steel flow character and internal configuration of tundish with an impact pad in two design modifications (Modification 1—M1, Modification 2—M2).

2. Numerical Model Description

In order to obtain the RTD curves and apply a Lagrangian approach for the analysis of the inclusions and their removal, it was first necessary to calculate the steady velocity and temperature field of the flowing steel in the tundish. Subsequently, the RTD curves, the trajectories of the inclusions and their separation were calculated for a steady flow pattern. The following assumptions were considered:
The flow was considered to be incompressible, viscous, and turbulent.
The flow represented steady state with constant casting temperature.
The calculation of steel flow included the effect of the natural convection.
The transfer and conduction of heat were assumed through convection as well as conduction.
The heat losses were considered to be through the walls of the tundish and through the melt surface.
The inclusions were spherical in shape and are let into the domain through a shroud tube.
There is no exchange of mass, heat or chemical reactions between the melt and the inclusion.
The inclusion is small enough, and its presence does not affect the velocity field of the melt.
There is no coagulation or coalescence of inclusions. If the inclusion hits a wall, it is reflected. If the inclusion touches the top surface of melt, it is absorbed (as into slag) and escapes the domain.
When taking into account the forces acting on the inclusion particle, the following were included:
Gravity force
Aerodynamic drag force
Influence of pressure gradient
Virtual mass force
The influence of the pressure gradient and the virtual mass force should be considered if the density of the continuum (melt) is greater than the density of the particle (inclusion). The virtual mass force accelerates the surrounding continuous phase in the immediate vicinity of the particles. On the other hand, it can be considered that the sizes of the particles are very small and their response times to the flow are minor. More details about virtual mass force can be found e.g., in [41].
Numerical modelling of steel flow and inclusion removal in a 5-strand asymmetric tundish was therefore modelled in three steps according to the above prerequisites:
  • Basic calculation of steady flow, obtaining a steady velocity and temperature field
  • Calculation of RTD curves
  • Calculation of inclusion removal
The result of the calculation are velocity and temperature fields, RTD curves, the removal efficiency of inclusions escaped into the melt surface and percentage of inclusions torn down into the submerge entry nozzles of the casting strands.
To be able calculate the steel flow, the Navier-Stokes equations together with the model of turbulence must be applied. In RTD curves calculation, the Species Model is good to use because the model enables calculation of the species transport, respectively concentration change monitoring without reaction. To simulate a behaviour of discrete second phase (inclusions) in continuous phase (steel melt), the ANSYS Fluent allows use of the Discrete Phase Model with the Lagrangien approach. This approach is very comfortable, and the calculation is very fast [42].

2.1. Governing Equations

The equations for mass, momentum and energy were solved. For the flow involving species mixing, a species conservation equation was used. For inclusion trajectory calculations the Lagrangian approach was applied.

2.1.1. Steel Flow Equations

The three-dimension steel turbulent flow was described by the Navier-Stokes equation together with the continuity equation and a standard k-ε turbulent model. In the case of non-stationary incompressible isothermal flow, they have the following form [43,44]:
Continuity equation
u x + v y + w z = 0
Navier–Stokes equations
u t + ( u u ) x + ( u v ) v + ( u w ) z = 1 ρ p x + v ( 2 u x 2 + 2 u y 2 + 2 u z 2 ) + f x
v t + ( v u ) x + ( v v ) v + ( v w ) z = 1 ρ p y + v ( 2 v x 2 + 2 v y 2 + 2 v z 2 ) + f y
w t + ( w u ) x + ( w v ) v + ( w w ) z = 1 ρ p z + v ( 2 w x 2 + 2 w y 2 + 2 w z 2 ) + f z
where x, y, and z are coordinates, u, v, w are velocity components, p is pressure, and f is components of outer volume force. The turbulence kinetic energy k and its rate of dissipation ε are obtained from the following transport equations [42]:
t ( ρ k ) + x i ( ρ k u i ) = x j [ ( μ + μ t σ k ) k x j ] + G k + G b ρ ε Y M + S k
t ( ρ ε ) + x i ( ρ ε u i ) = x j [ ( μ + μ t σ ε ) ε x j ] + C 1 ε ε k ( G k + C 3 ε G b ) C 2 ε ρ ε 2 k + S ε
where Gk represents the generation of turbulence kinetic energy due to the mean velocity gradients, Gb is the generation of turbulence kinetic energy due to buoyancy, YM is the contribution of the fluctuating dilatation in compressible turbulence to the overall dissipation rate. C1ε, C2ε, and C3ε are constants. σk and σε are the turbulent Prandtl numbers for k and ε, or more precisely Sk and Sε are user-defined source terms. The turbulent viscosity µt is computed by combining k and ε as follows:
μ t = ρ C μ k 2 ε
where is a constant. The model constant was used with the following default values C1ε = 1.44, C2ε = 1.92, = 0.09, σk = 1.0, and σε = 1.3 [42].

2.1.2. Species Transport

Species model was used in the case of dimensionless concentration monitoring during a steady steel flow in the tundish and determination of residence time distribution curves (RTD curves). The local mass fraction of each species Yi through the solution of a convection-diffusion equation for the ith species was predicted in the following general form [42]:
t ( ρ Y i ) + · ( ρ v Y i ) = · J i + R i + S i
where Ri is the net rate of production of species i and Si is the rate of creation by addition from the dispersed phase.

2.1.3. Lagrangian Discrete Phase Model

The Lagrangian discrete phase model performs trajectory calculations for dispersed phases (particles), including coupling with the continuous phase by integrating the force balance on the particle. This force balance can be written as [42]:
d u p d t = u u p τ r + g ( ρ p ρ ) ρ p + F
where F is an additional acceleration (force/unit particle mass) term, u u p τ r is the drag force per unit particle mass and
τ r = ρ p d p 2 18 μ 24 C d R e
where τr is the droplet or particle relaxation time, u is the fluid phase velocity, up is the particle velocity, µ is the molecular viscosity of the fluid, ρ is the fluid density, ρp is the density of the particle, and dp is the particle diameter. Cd is drag force coefficient. Re is the relative Reynolds number.

2.2. Model Setting

The basic 3D geometry of the 5-strand asymmetric tundish represents the internal volume of the modelled area (see Figure 1). The volume of the tundish is affected by a shroud tube, which is 650 mm away from the bottom. Below the shroud tube there is an impact pad, which has been designed in two design modifications M1 and M2 for the purpose of optimizing the separation of inclusions, as can be seen in Figure 1a,b. The height of the steel level in the tundish corresponds to a working volume of 32 ton and is 925 mm. The inner volume of the tundish is also reduced by the presence of stoppers. The modelled geometry includes submerged entry nozzles referred to as CS1 to CS5 (Casting Strand 1—Casting Strand 5). The distance between individual submerge entry nozzles was 1500 mm. The total length of the tundish was 6387 mm.
The design of the impact pad, referred to as M1 (Figure 1a), is a raised hollow square construction block bounded by walls so that the flowing steel stream from a shroud tube is directed to the surface of steel melt in the tundish. Another design of the impact pad, referred to as M2 (Figure 1b), is represented by a hollow rectangular construction block extended to the entire width of the central part of the bottom of the tundish. In both cases, i.e., M1 and M2, this is an eccentric position of the impact point between the CS3 and CS4. In addition to adjusting the impact pad’s shape, we also changed the position of the shroud tube so that it would always point to the centre of the bottom of impact pads. The inner diameter of the shroud tube corresponds to a hydraulic diameter used on the inlet (see Table 1).
Some curvatures of the geometry, especially between the transition of vertical outer walls of the tundish and the bottom, were neglected due to the subsequent preparation of the computational mesh. The details in the area of stoppers and outlet nodes, or more precisely the details of the impact pads have been maintained.
A velocity-inlet boundary condition was defined at the mouth of the shroud tube with a constant inlet velocity of 1.04 m·s−1 (corresponding to a mass flow of 2 t·min−1) and a constant casting temperature of 1773 K. Turbulence was defined by a hydraulic diameter of 0.085 m and an intensity of 10%. The outflow boundary condition was considered on the outlets. Zero shear stress was defined on the melt surface.
The steady state flow calculation included the effect of natural convection. The transfer and conduction of heat were assumed by through convection as well as conduction. The heat losses were considered to be through the walls of the tundish and through the melt free surface. The value of the heat losses through the bottom and walls of the tundish was 2500 W·m−2. Values of heat losses through the walls of the tundish used in the numerical simulation were set based on the literature [18,45,46,47]. In the case of heat flux on the free surface of steel melt, a slag thickness of 30 mm was considered. The heat fluxes on the wall were averaged and take into account the insulating effects of the brickwork lining. Thermo-physical properties of steel were defined as a function of temperature. To simulate the concentration change, it was necessary to define two components: the old and the new melt as a mixture (no reaction was considered, the thermo-physical properties are the same). The change in the concentration was performed using the species mass fraction function from value 0 (old melt) up to value 1 (new melt). All parameters of model setting are summarizing in Figure 1 and in Table 1, Table 2 and Table 3. Distribution sizes and densities of inclusions are listed in Table 4 and Table 5.

3. Results and Discussion

The results of numerical modelling predict velocity, temperature, and concentration profiles under steady steel flow in the tundish. The size of the plug, mixed and dead volume are assessed using RTD curves. The distribution and tracing of inclusions are assessed both by residence times and distribution profiles of inclusions as well as by the removal efficiency of inclusions obtained from the data statements of the calculation. An analysis of the independence of the computational mesh was performed before the evaluation of the results of numerical simulation was initiated.

3.1. Independence of Computational Mesh

During the optimization of steel flow in the tundish, numerous types of results can be observed. And if we want to ensure a timely response to the technical problems connected with final quality of steel billets influenced by the tundish metallurgy, we need the optimal, quickly prepared and universal method of numerical approach. The importance of computational mesh independence is especially important if we do not have verification methods other than numerical simulations available for the first process optimization designs.
For this reason, we validated the approaches of computational mesh generation for the case of optimization of internal configuration of tundish construction, which affects the steel flow, or removal of non-metallic inclusions. For generation of mesh, the ANSYS Meshing was applied.
The computational mesh is necessary for the discretization of equations of flow and heat-transfer or substance redistribution, etc., which are solved using the numerical methods. On the other hand, we need the mesh to be as coarse as possible, but at the same time, it must be able to capture the potential of the task and all variables. Also, it is good to take into account the mesh requirements for the computing performance (CPU and memory requirements). Bad quality of the computational mesh can lead to convergence difficulties, bad physics description, and diffuse solution.
Therefore, at first, the mesh quality can be controlled by mesh metric tools, such as Element Quality, Aspect Ratio, Jacobian Ratio, Warping Factor, Parallel Deviation, Maximum Corner Angle, Skewness and Orthogonal Quality. Especially in the case of CFD simulation, it is good to control the skewness and orthogonal quality when the values are between 0 to 1. The value of metrics with an evaluation of quality mesh is defined in Table 6 [42].
After the tundish meshing, it is necessary to realize the primary simulations with control not only of the character of convergence solution by residuals but also to monitor the velocity and temperature at the point or through the surface at the inlet and outlet area to achieve constant values of variables.
To prepare the computational mesh for an asymmetric five-strand tundish with an impact pad and stoppers, in our case during the mesh tuning we compared the solution using the mesh with tetrahedral and hexahedral elements. In all verified cases, at/on the inlet and outlets, we monitored the velocity and temperatures using the velocity surface monitor and temperature point monitor. For generation of the mesh, we used initially the hexahedral method with patch conforming algorithm of mesh generation, and then the same method with patch independent algorithm as well as the multizone method.
The direct utilization of Hexa dominant method was not possible. To use the multizone method, there was a need to slice the geometry and to define the interfaces between the individual slice surfaces of geometry in ANSYS fluent. This method was very time-consuming and difficult. Therefore, for the next validation of approaches, it was evaluated as not suitable.
In the case of patch conforming algorithm, the size of elements was not sufficiently small, which was manifested even during the unstable convergence of the calculation and also by the large distortion of the calculated velocity at the nozzle, or in the velocity differences between nozzles (Figure 2). Therefore, the patch independent method was used, which neglected some small edges. At the same time, to achieve good mesh quality, it was necessary to reduce the size of the elements, which led to an increase in the number of elements up to 5 million and an increase in computing time.
Eventually, the assembly method with a cut cell approach, which could be used only for CFD calculation, was tested. The size of 5.3 mm was achieved as an independent size of the element and at the same time a high-quality mesh was obtained. Just couple of cells achieved substandard metrics, such as skewness and orthogonality. At the same time, by using this method we achieved a very fast stabilization of the expected velocity (depending on the flow rate on the inlet) at the outputs that were equal and constant through of all outlets. The approach chosen was satisfactory even when the tundish geometry was changed. The statistics of individual meshes are given in Table 7. Comparison of final meshes is shown in Figure 3. The total number of elements was 670,008 for the configuration with an M1 impact pad, respectively 708,778 for M2 impact pad, using the assembly method with cut cell. The computational time of flowing under steady state condition on PC with 6 cores took about 4 h.

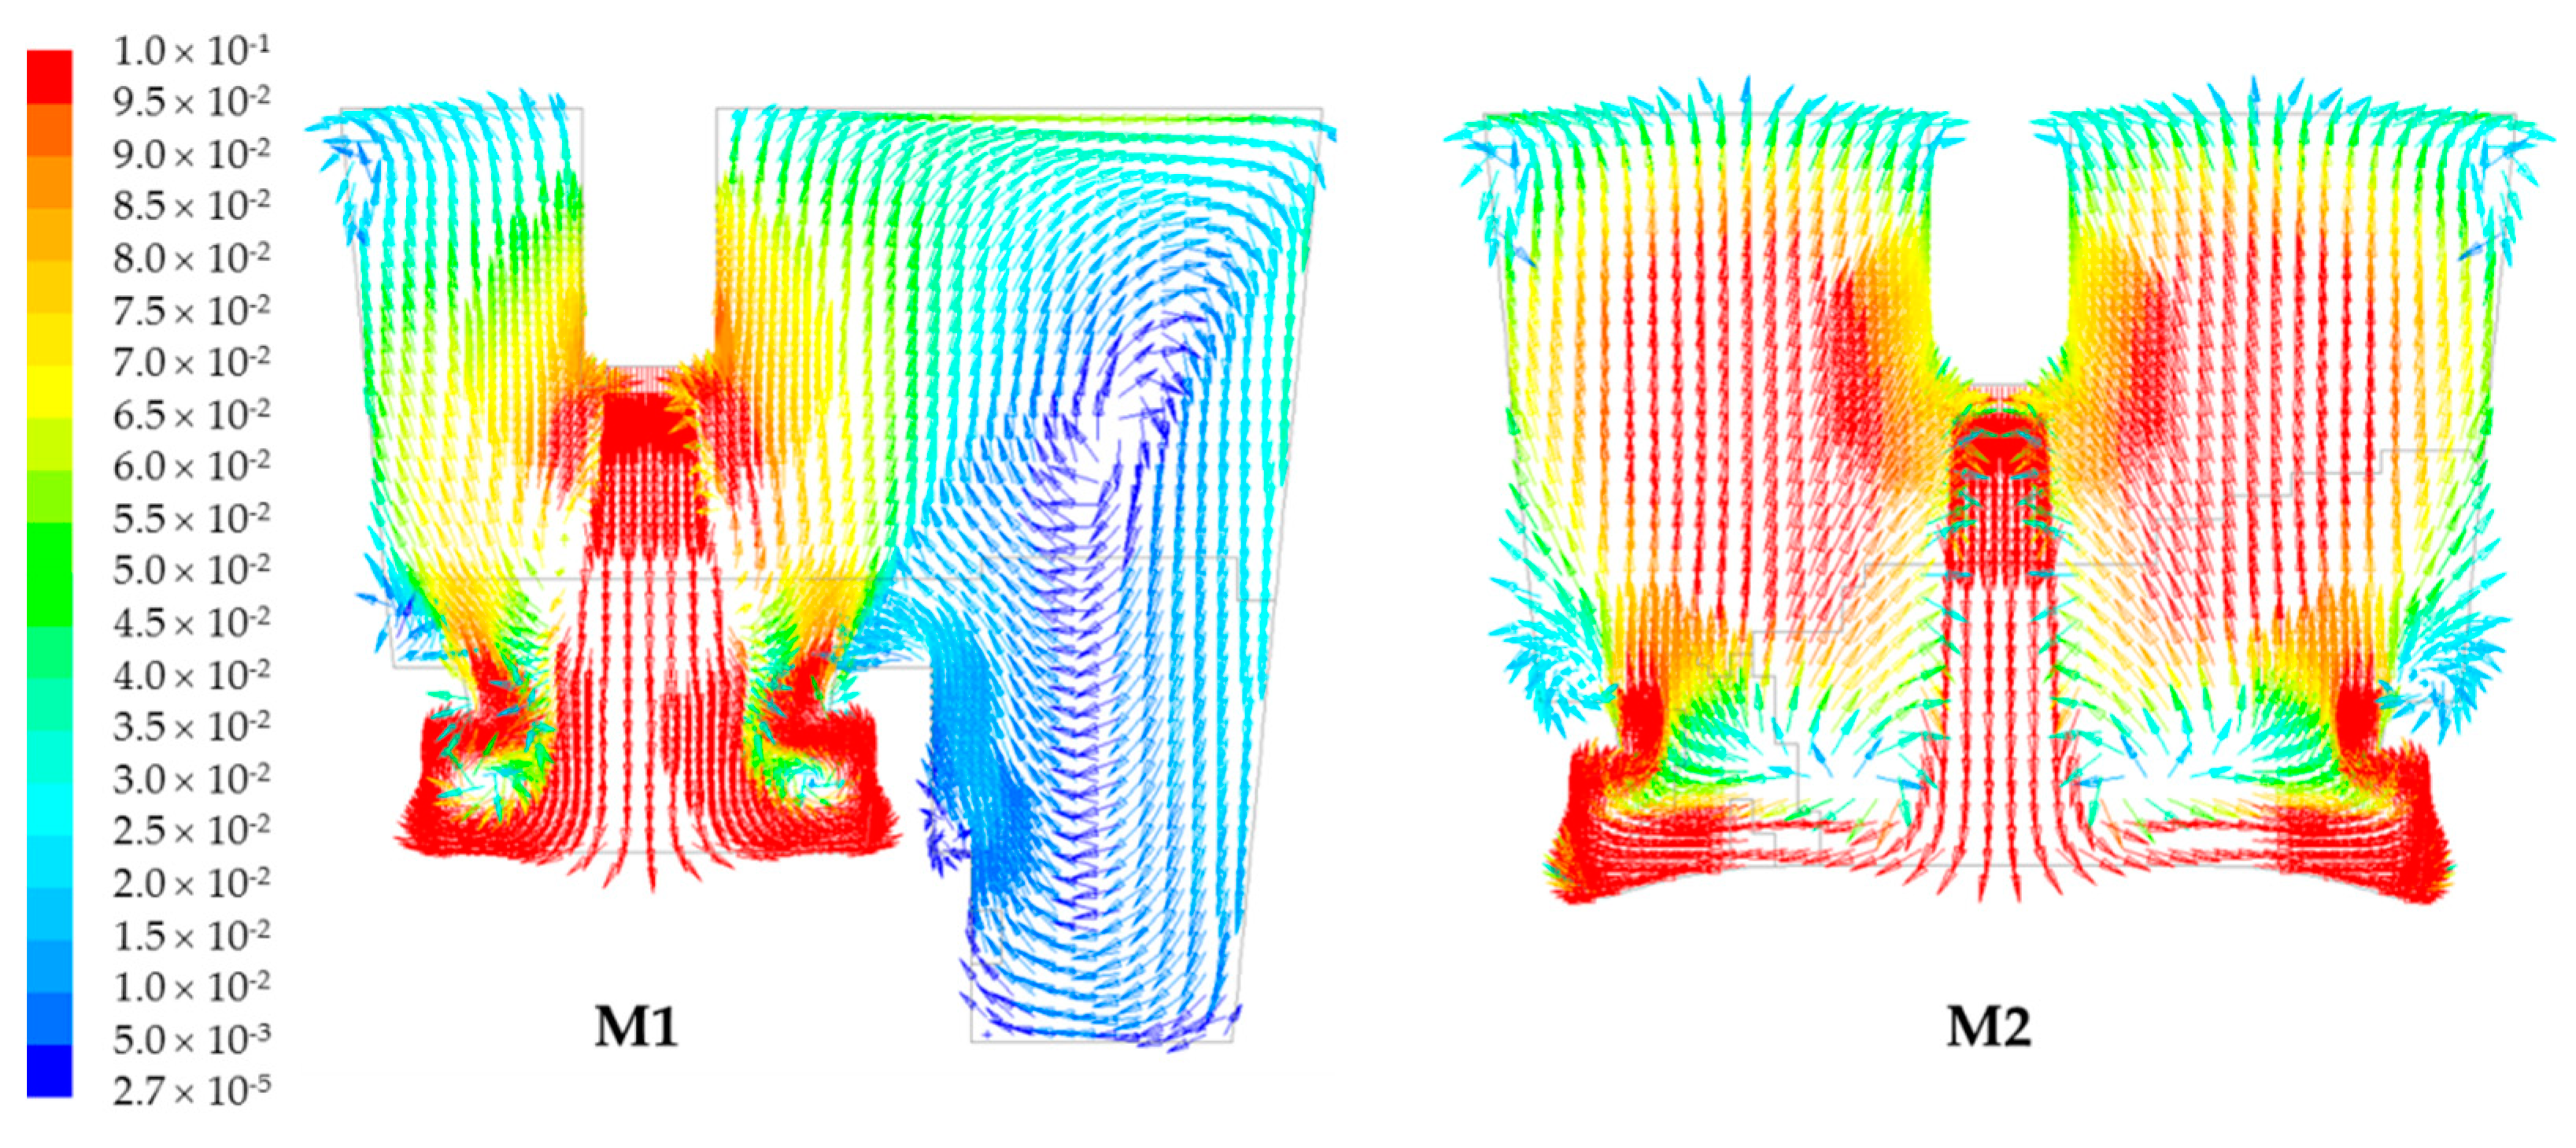
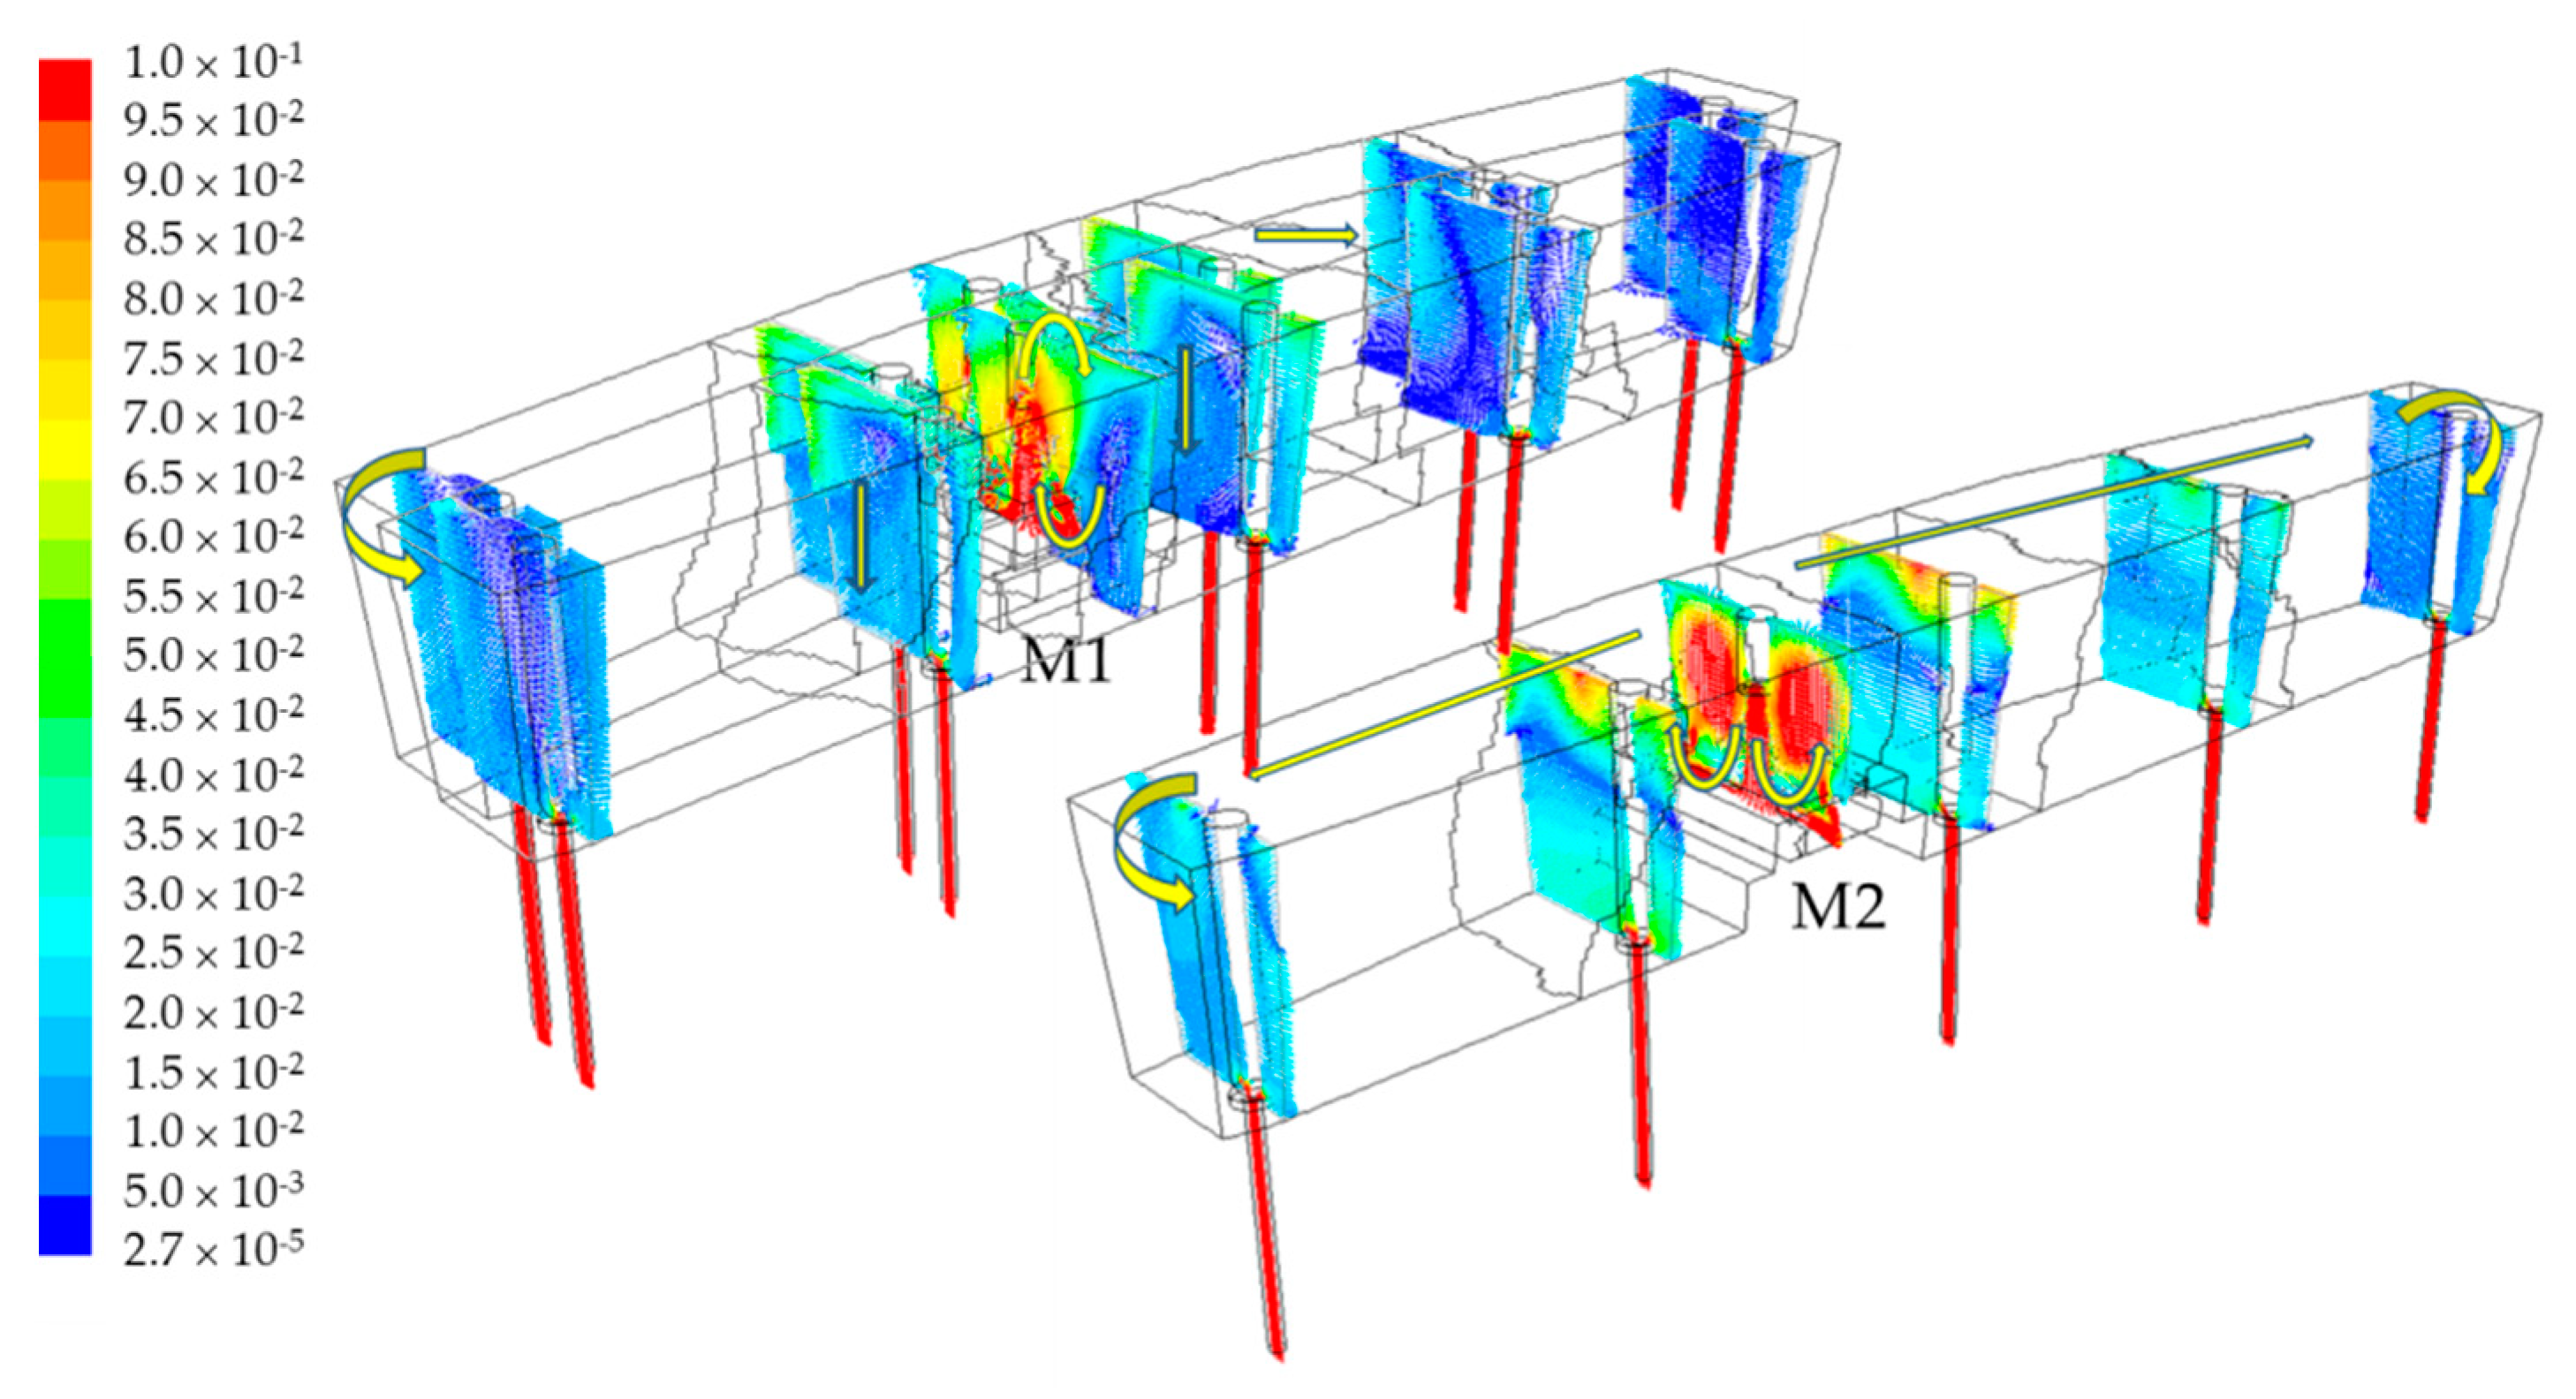
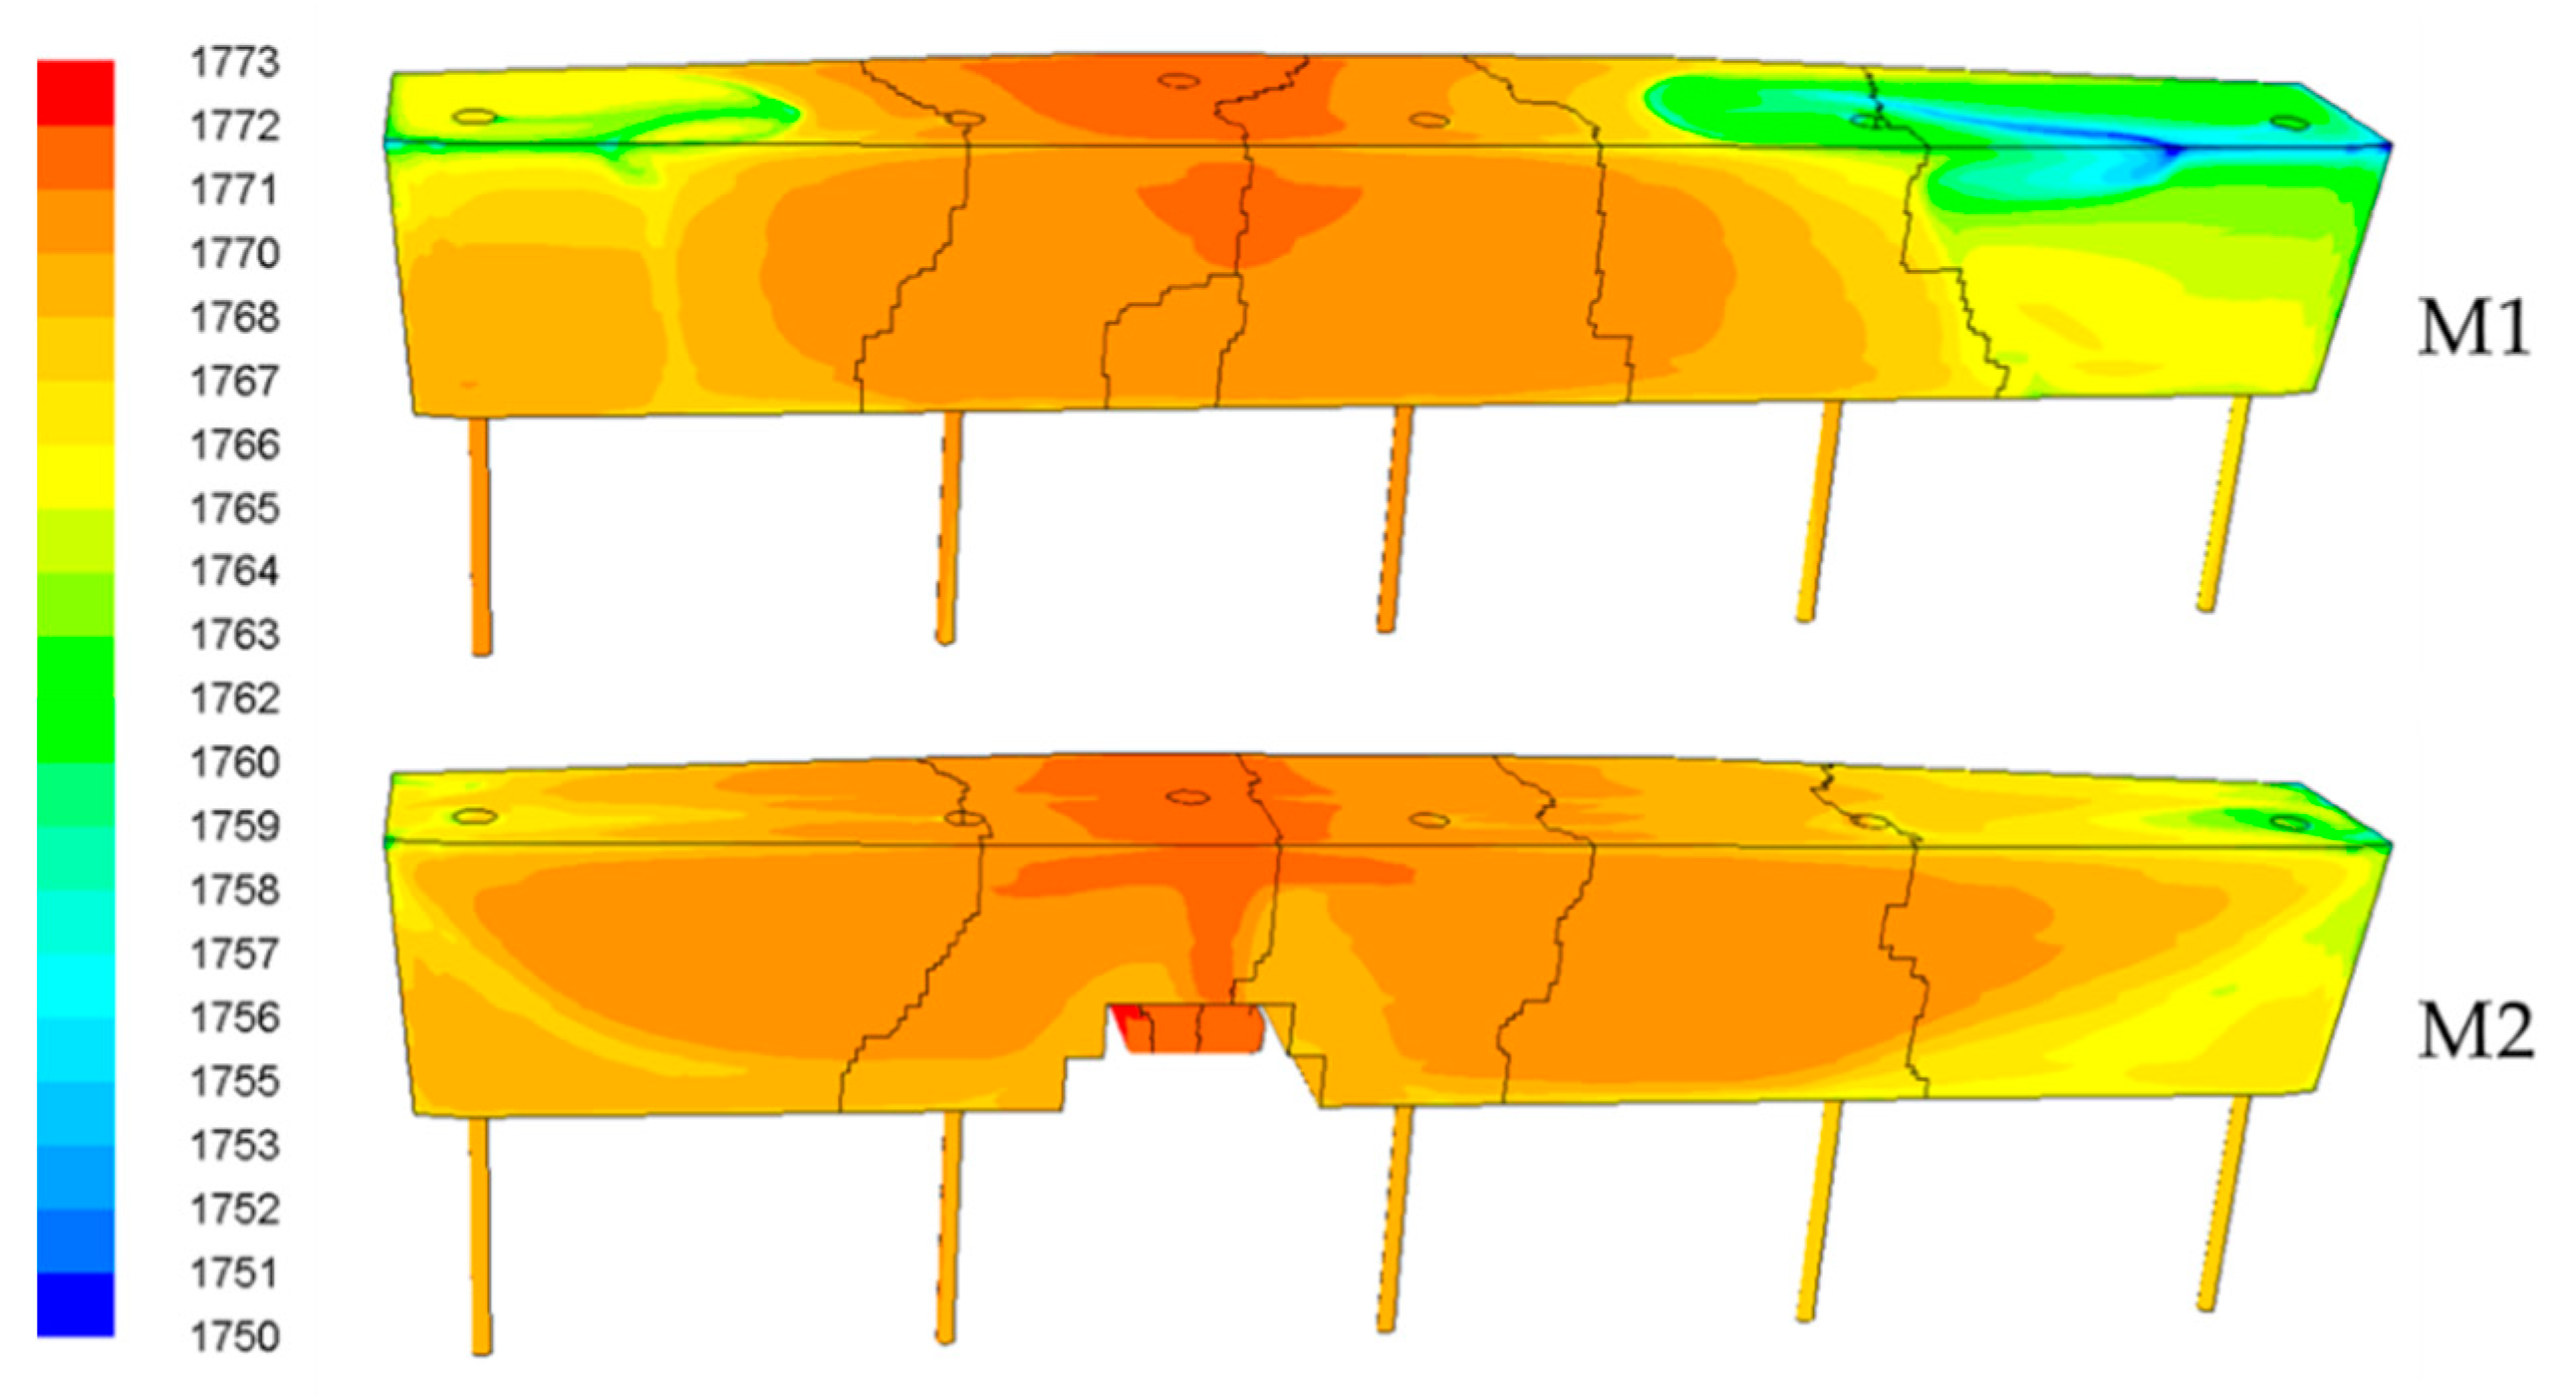
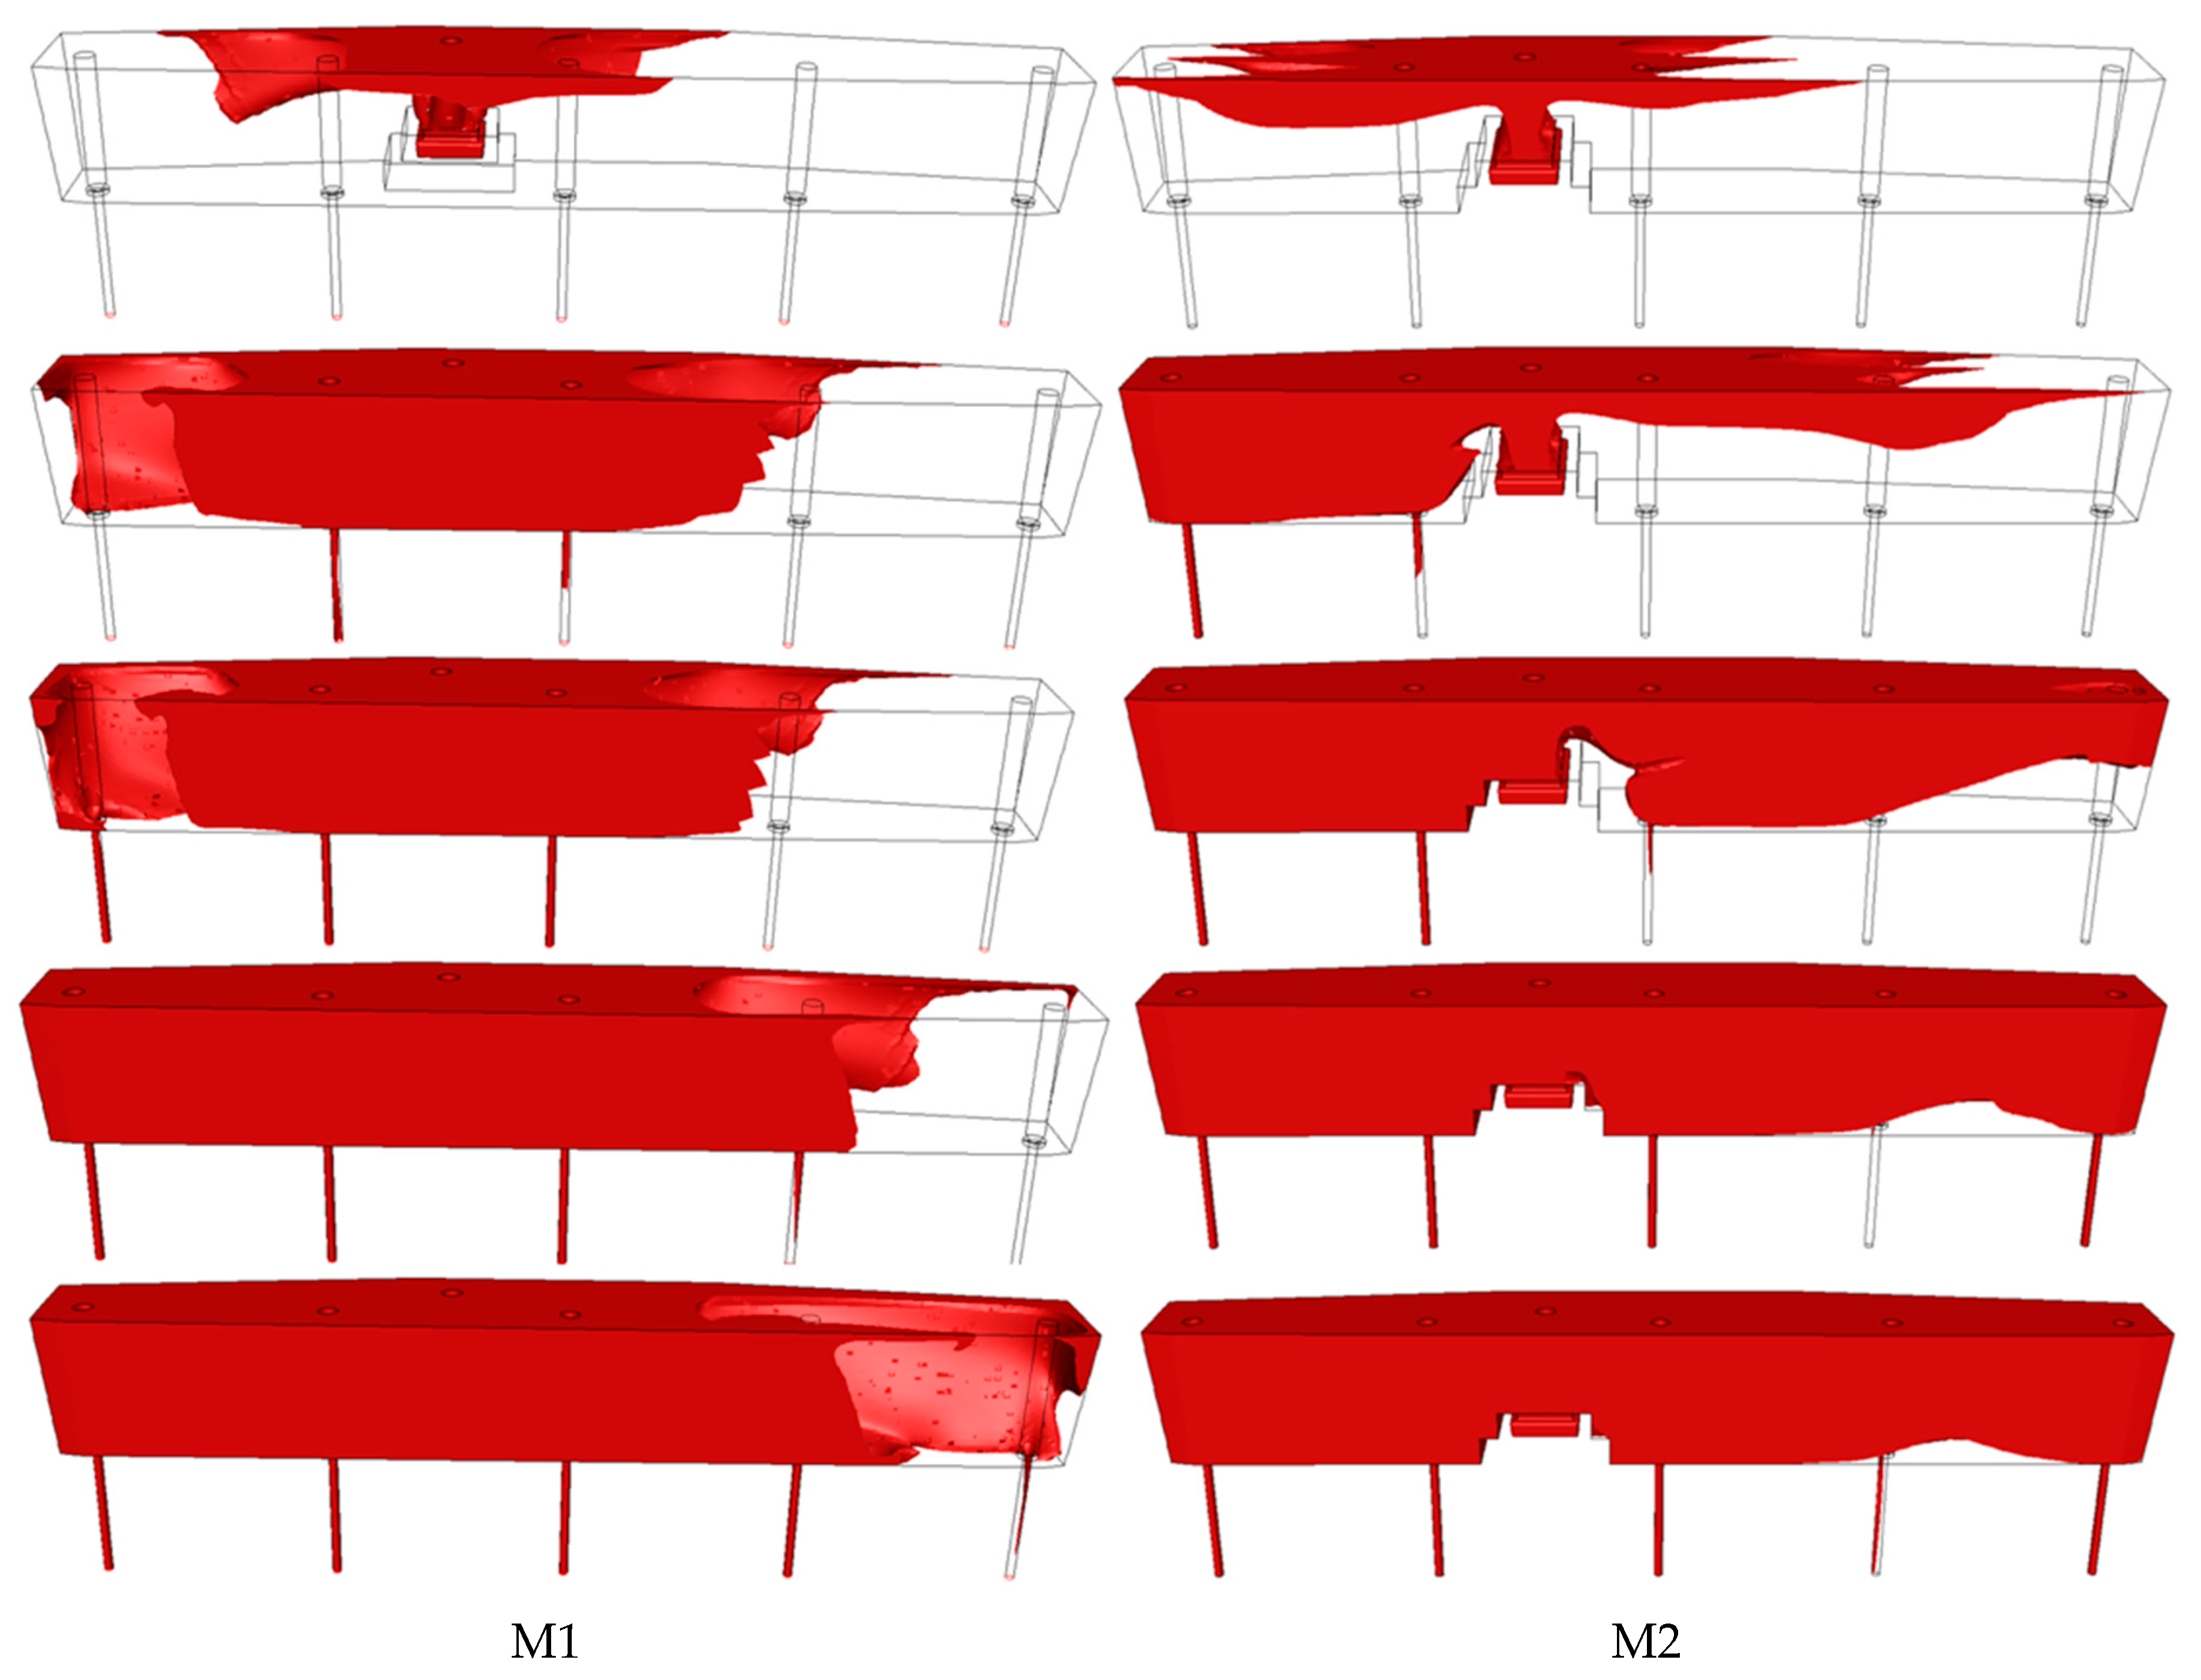
3.2. Flow and Temperature Fields

As can be inferred from the longitudinal and transverse sections of the velocity vectors for the M1 configuration in Figure 4, Figure 5 and Figure 6, the impacting casting stream from a shroud tube bounces from the bottom of the impact pad. The bounded impact space of the square impact pad M1 directs the impacting stream back concentratedly towards the surface. From the surface, the stream is directed to the front and rear walls of the tundish. As Figure 5 and Figure 6 indicate, in the tundish with M1 impact pad, the circulation field was predicted between the front wall of the tundish and the impact pad. After the stream reflects against the front wall of the tundish, it continues towards the rear wall of the tundish, where it meets the strand near the rear wall of the tundish. At the same time, when the front space of the tundish is filled, steel begins to flow into the nozzles of CS3 and CS4. The higher flow velocity at the rear wall directs the steel flow along the wall toward the nozzle of CS5. The stream headed toward the right behaves similarly (from the front view of the tundish), i.e., to nozzles of CS2 and CS1. However, the longer flow path of the steel along the rear wall of the tundish results in slowing down of the steel flow velocity and, as a result of the presence of stoppers, also in demarcation of the steel flow, in particular along the rear wall. Behind the stopper of CS1 and at the bottom behind the mouth of CS2, a stagnant steel area with a very low flow velocity is visible.
In order to avoid adverse flow phenomena in the M1 configuration, a modification of the impact area, referred to as M2, was proposed. As already noted in the introduction to the description of the calculation conditions, the modification of the impact area configuration involved the extension of the impact area of the pad in a cross-section view toward the front and rear walls of the tundish (and creation of a rectangular bounded impact area) and shifting the shroud tube position so that it is directed toward the centre of impact area (similar to M1). While in the M1 configuration the inlet flow between the front and rear part of the tundish is unevenly distributed following the impact of the melt stream, in the M2 configuration the impacting stream is directed evenly toward both the front and rear tundish walls and then upwards toward the surface. Near the surface, the stream again flows evenly both to the right and to the left of the shroud tube, as indicated by the arrows for M2 in Figure 6. The higher flow velocity at the surface and closer to the rear tundish wall directs the flow from the back of the tundish to the front area. Therefore, the nozzles of CS3 and CS4 are not affected first, as was the case with M1, but rather the nozzles of CS5 and CS4. Immediately after reaching the nozzles of CS5 and CS4 with the steel stream, the stream continues to move to the nozzle of CS3, and at the same time, the steel stream near the rear tundish wall turns to nozzle of CS1. The steel stream arrives at nozzles of CS3, CS1, and CS2 virtually at the same moment.
The assumption of a stagnant area near M1 behind the CS1 and CS2 also confirms the calculation of the temperature change during the steel flow. The constant casting temperature of 1773 K drops during the steel flow through the tundish equipped with an impact pad M1 locally near the free surface of steel melt between the CS1n and CS2 by almost 20 K, as can be seen from Figure 7. In the case of M2 configuration, a temperature field by the tundish walls is relatively homogeneous and the temperature drop does not exceed 10 K.

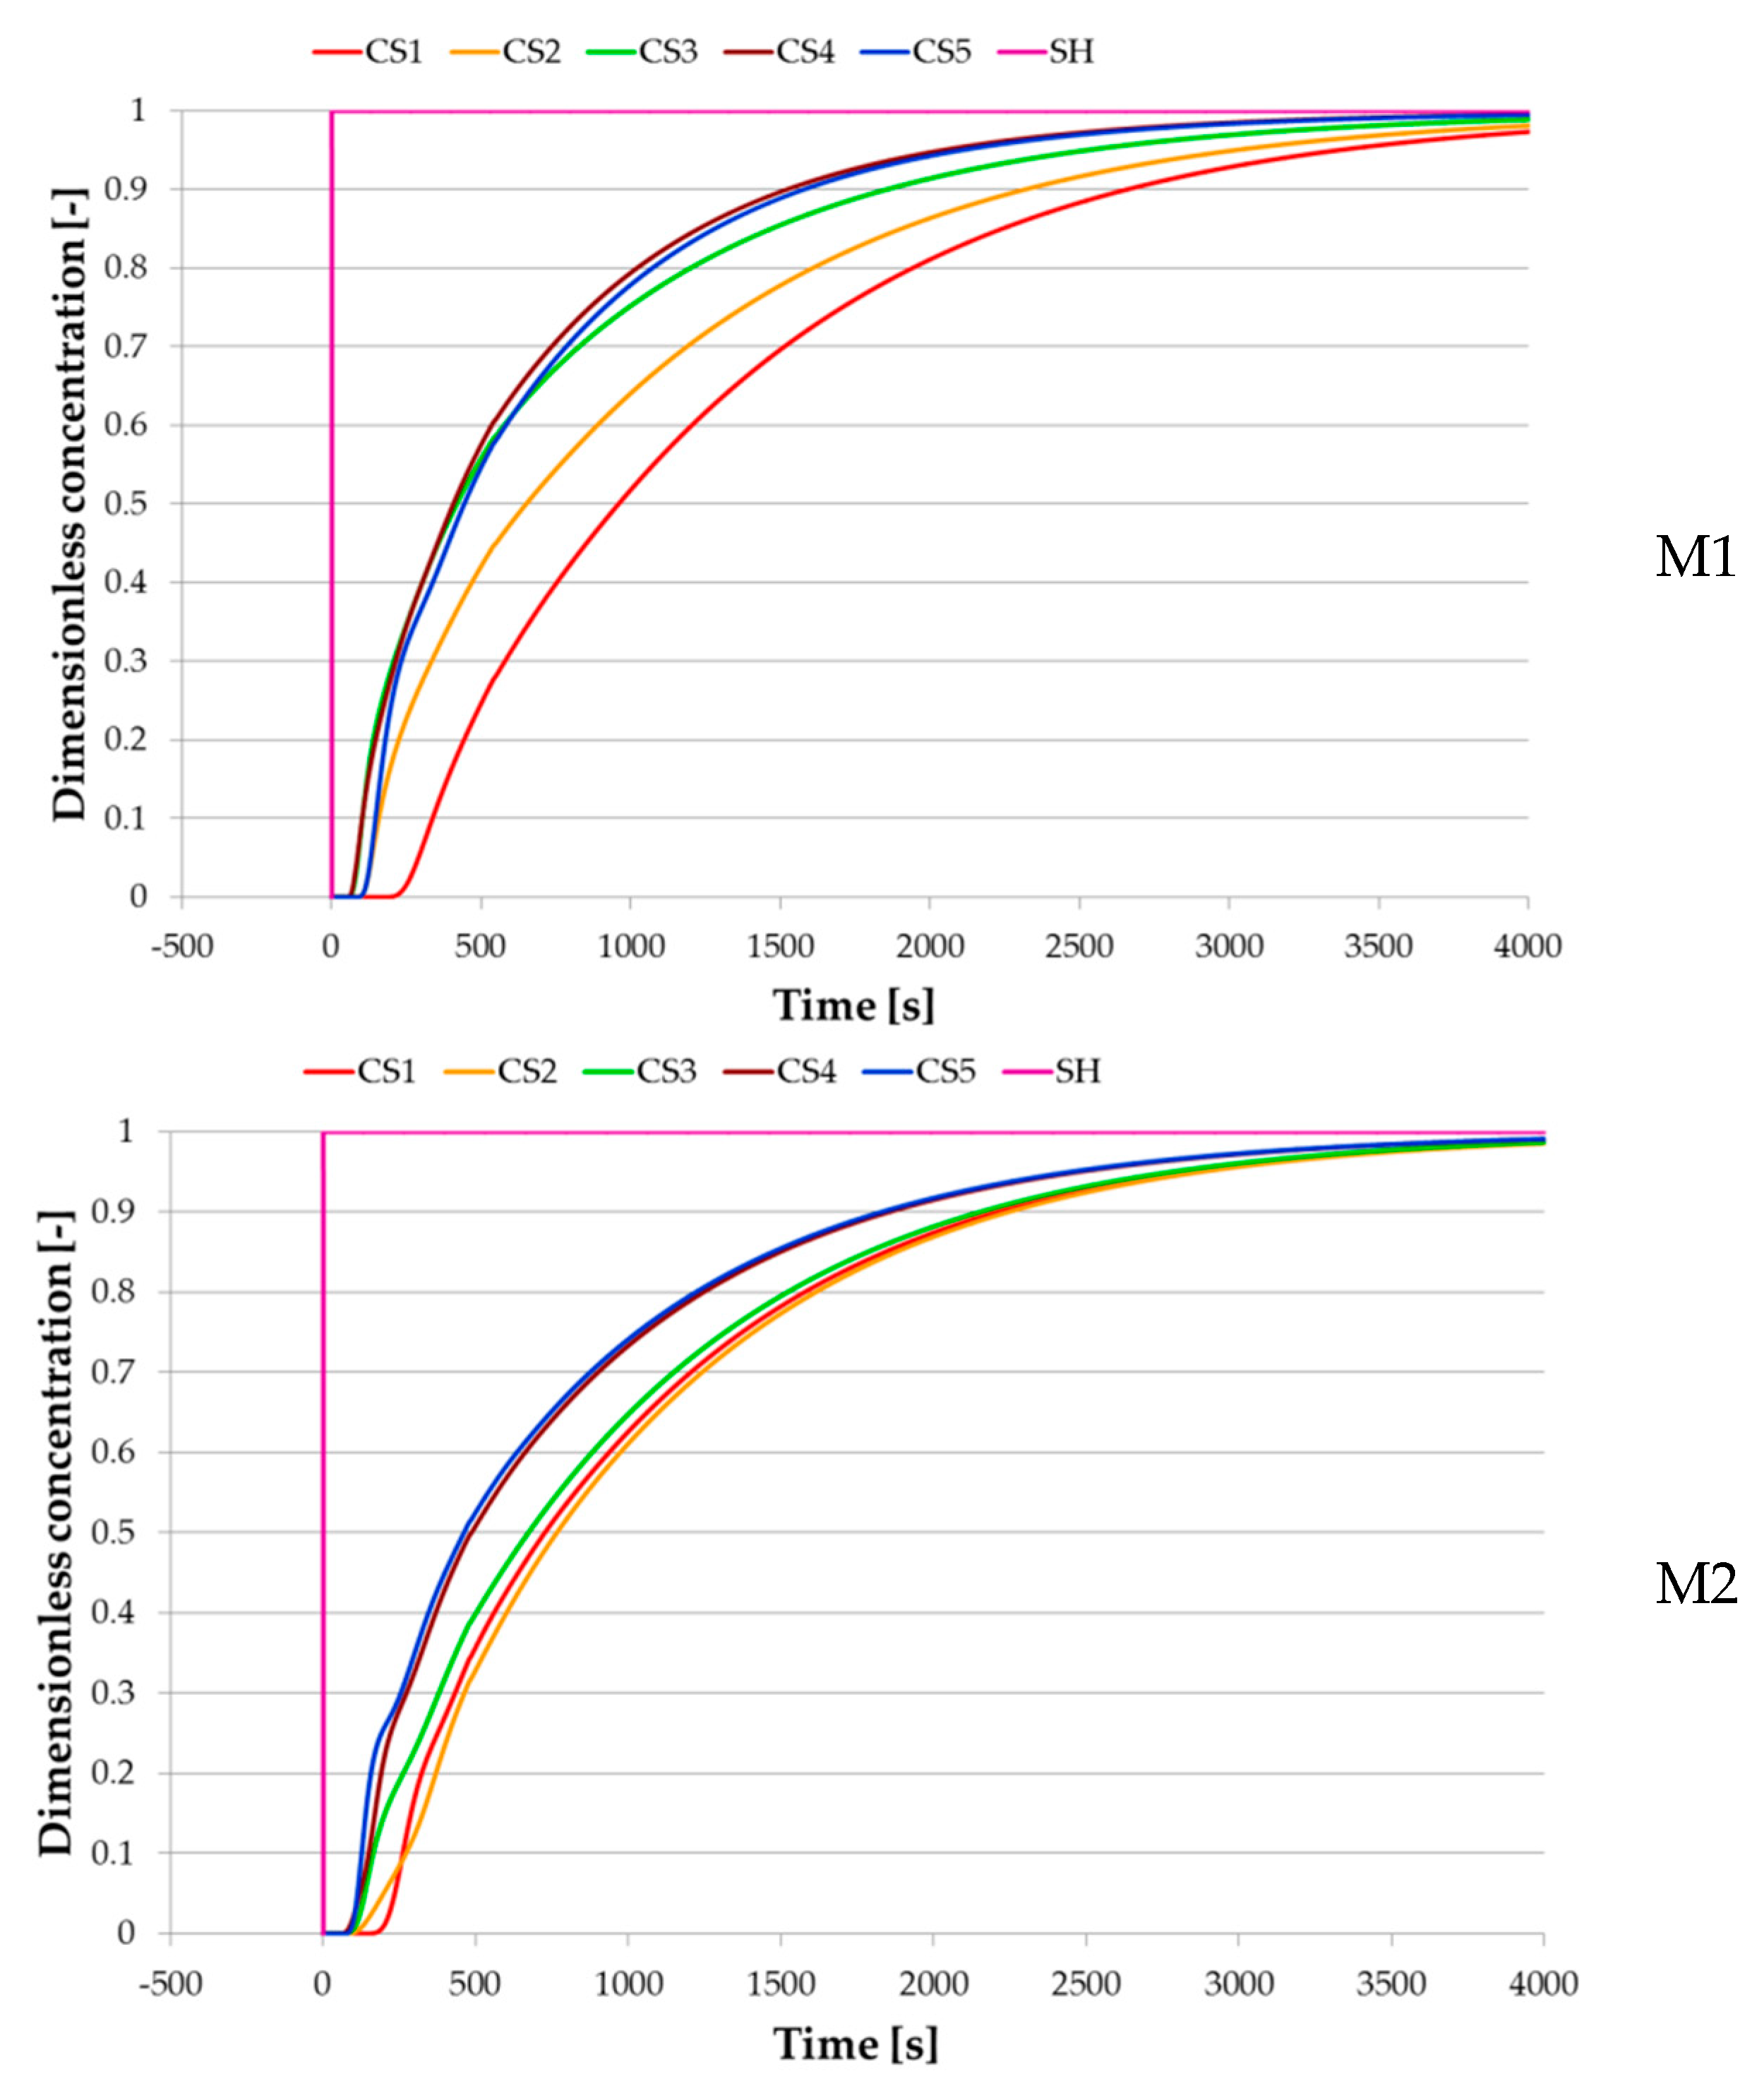
3.3. Residence Time Distribution Curves

The higher proportion of the steel stream close to the surface and the more even distribution of the steel melt in between the individual casting strands in the M2 configuration suggest more favourable conditions for the removal of inclusions.
In order to be able to quantify the character of the flow in the tundish and to evaluate the removal efficiency of inclusions into the slag (or more precisely torn down into the casting strands), it makes sense to determine the so-called residence time of steel in the tundish. The residence times are directly dependent, in particular on the weight (mass) of steel in the tundish, the internal configuration of the tundish, and the casting speed. For a plug flow reactor, the theoretical residence time is defined as [2]:
τ ¯ = V Q
where τ ¯ is theoretical average retention time, V is liquid volume in the reactor, and Q is volumetric liquid flow rate through the reactor. The behaviour of the real reactor is most often assessed on the basis of the result of various experimental methods, which in the essence consists of performing an instantaneous impulse or a permanent change at the input to the reactor, and monitoring the response at the output from the reactor. To perform the impulse or permanent change various marking methods are used, e.g., concentration, temperature, radionuclide, etc. A result that is obtained in the form of graphic dependence of the variable observed over time, is known as an RTD curve (residence time distribution). Through the permanent change of a tracer concentration, F curves can be obtained and represents dependence of the tracer concentration in the flow exiting the reactor on time. Concentration is expressed in relation to the inlet concentration of the tracer. The concentration curve is displayed in dimensionless coordinates.
From the residence time, the type of flow volumes in the tundish can be predicted (and also the length of intermixing/transition zone during the sequence casting). The following main areas are considered: plug flow volume, perfect mixing volume, and dead volume. In addition, for combined models, the following types of the flow are still used: short-circuit flow, recirculation flow and cross flow. The large plug flow volume indicates better possibility of inclusion floatation. In addition, the higher the dead volume, the higher the heat loss and transition tonnage will be. The plug volume is defined as [2]:
V p V = τ m i n τ ¯
where Vp is volume with plug flow, τmin is minimum retention time (time of first appearance of the marker). For the calculation of the dead volume the following relation is used [2]:
V d V = 1 τ ¯ r e a l τ ¯
where τ ¯ real is real average retention time of liquid in the reactor, which can be expressed as [2]:
τ ¯ r e a l =   c · τ · d τ   c · d τ
where c is the dimensionless concentration, τ is the time and is the time increment between individual data records of a concentration change. To calculate the share of a mixed reactor volume, given the complexity of determination, the most commonly used relation is a calculated field to a total volume [2]:
V m V = 1 V p V V d V
The final RTD F curves for both arrangements of the tundish with impact pad M1 and M2 are shown in Figure 8.
As can be seen from the RTD curves in Figure 8, for the M1 configuration it applies that steel flow is primarily confirmed from a shroud tube to the nozzles of CS3 and CS4. The minimum residence time of the tracer was approximately 70 s for both casting strands. This time corresponds to an increase in the dimensionless concentration of the tracer up to 0.01 (and then further sharply to 0.3). The longest minimum residence time of the tracer is predicted as expected for the CS1 and equals to 240 s. In contrast, in the variant with the M2 configuration, minimum retention times of approximately 97 s were detected for CS5 through CS3 and approximately 160 s on average for CS1 and CS2. The flow in the tundish equipped with impact pad M2 is therefore more even.
To ensure sufficient time for removal of inclusions, it is necessary to evaluate not only the residence times, but also the proportions of individual flowing, mixing or stagnant volumes in the tundish. The average theoretical residence time for a tundish, regardless of the type of impact pad, is 812 s. The average real residence time for a tundish with impact pad M1 is approximately 631 s. For a tundish with M2, the actual average retention time increased to 755 s. The average proportion of the plug volume in a tundish equipped with an M1 impact pad is then approximately 6.8% and the proportion of the dead volume is as much as 22.0%. When using the impact pad with M2, the plug volume increased to 8.2%, but the dead volume dropped by as much as 15% to only 7%. The comparison of individual volume ranges is listed in Table 8. Greater use of the working volume and plug flow of steel in the tundish with the M2 configuration should result in not only better inclusion removal conditions, but also in a smaller mixing area in the case of sequential steel casting of continuously cast billets. To obtain a clearer idea about concentration spreading, monitoring of the concentration iso-surface can be predefined and enable one to visually follow the stream of incoming steel melt through the inlet and spreading of steel in the tundish volume (see Figure 9). The iso-surface introduces the moments when the dimensionless concentration reached 0.6. Because of the different minimum residence time between configurations of tundish with M1 a M2, the comparison of concentration change (which also demonstrates the character of the steel flow in the tundish) in the same time moments should be not so illustrative. Therefore, in Figure 9, there are the moments which illustrate the typical differences between the character of steel flow in the tundish.

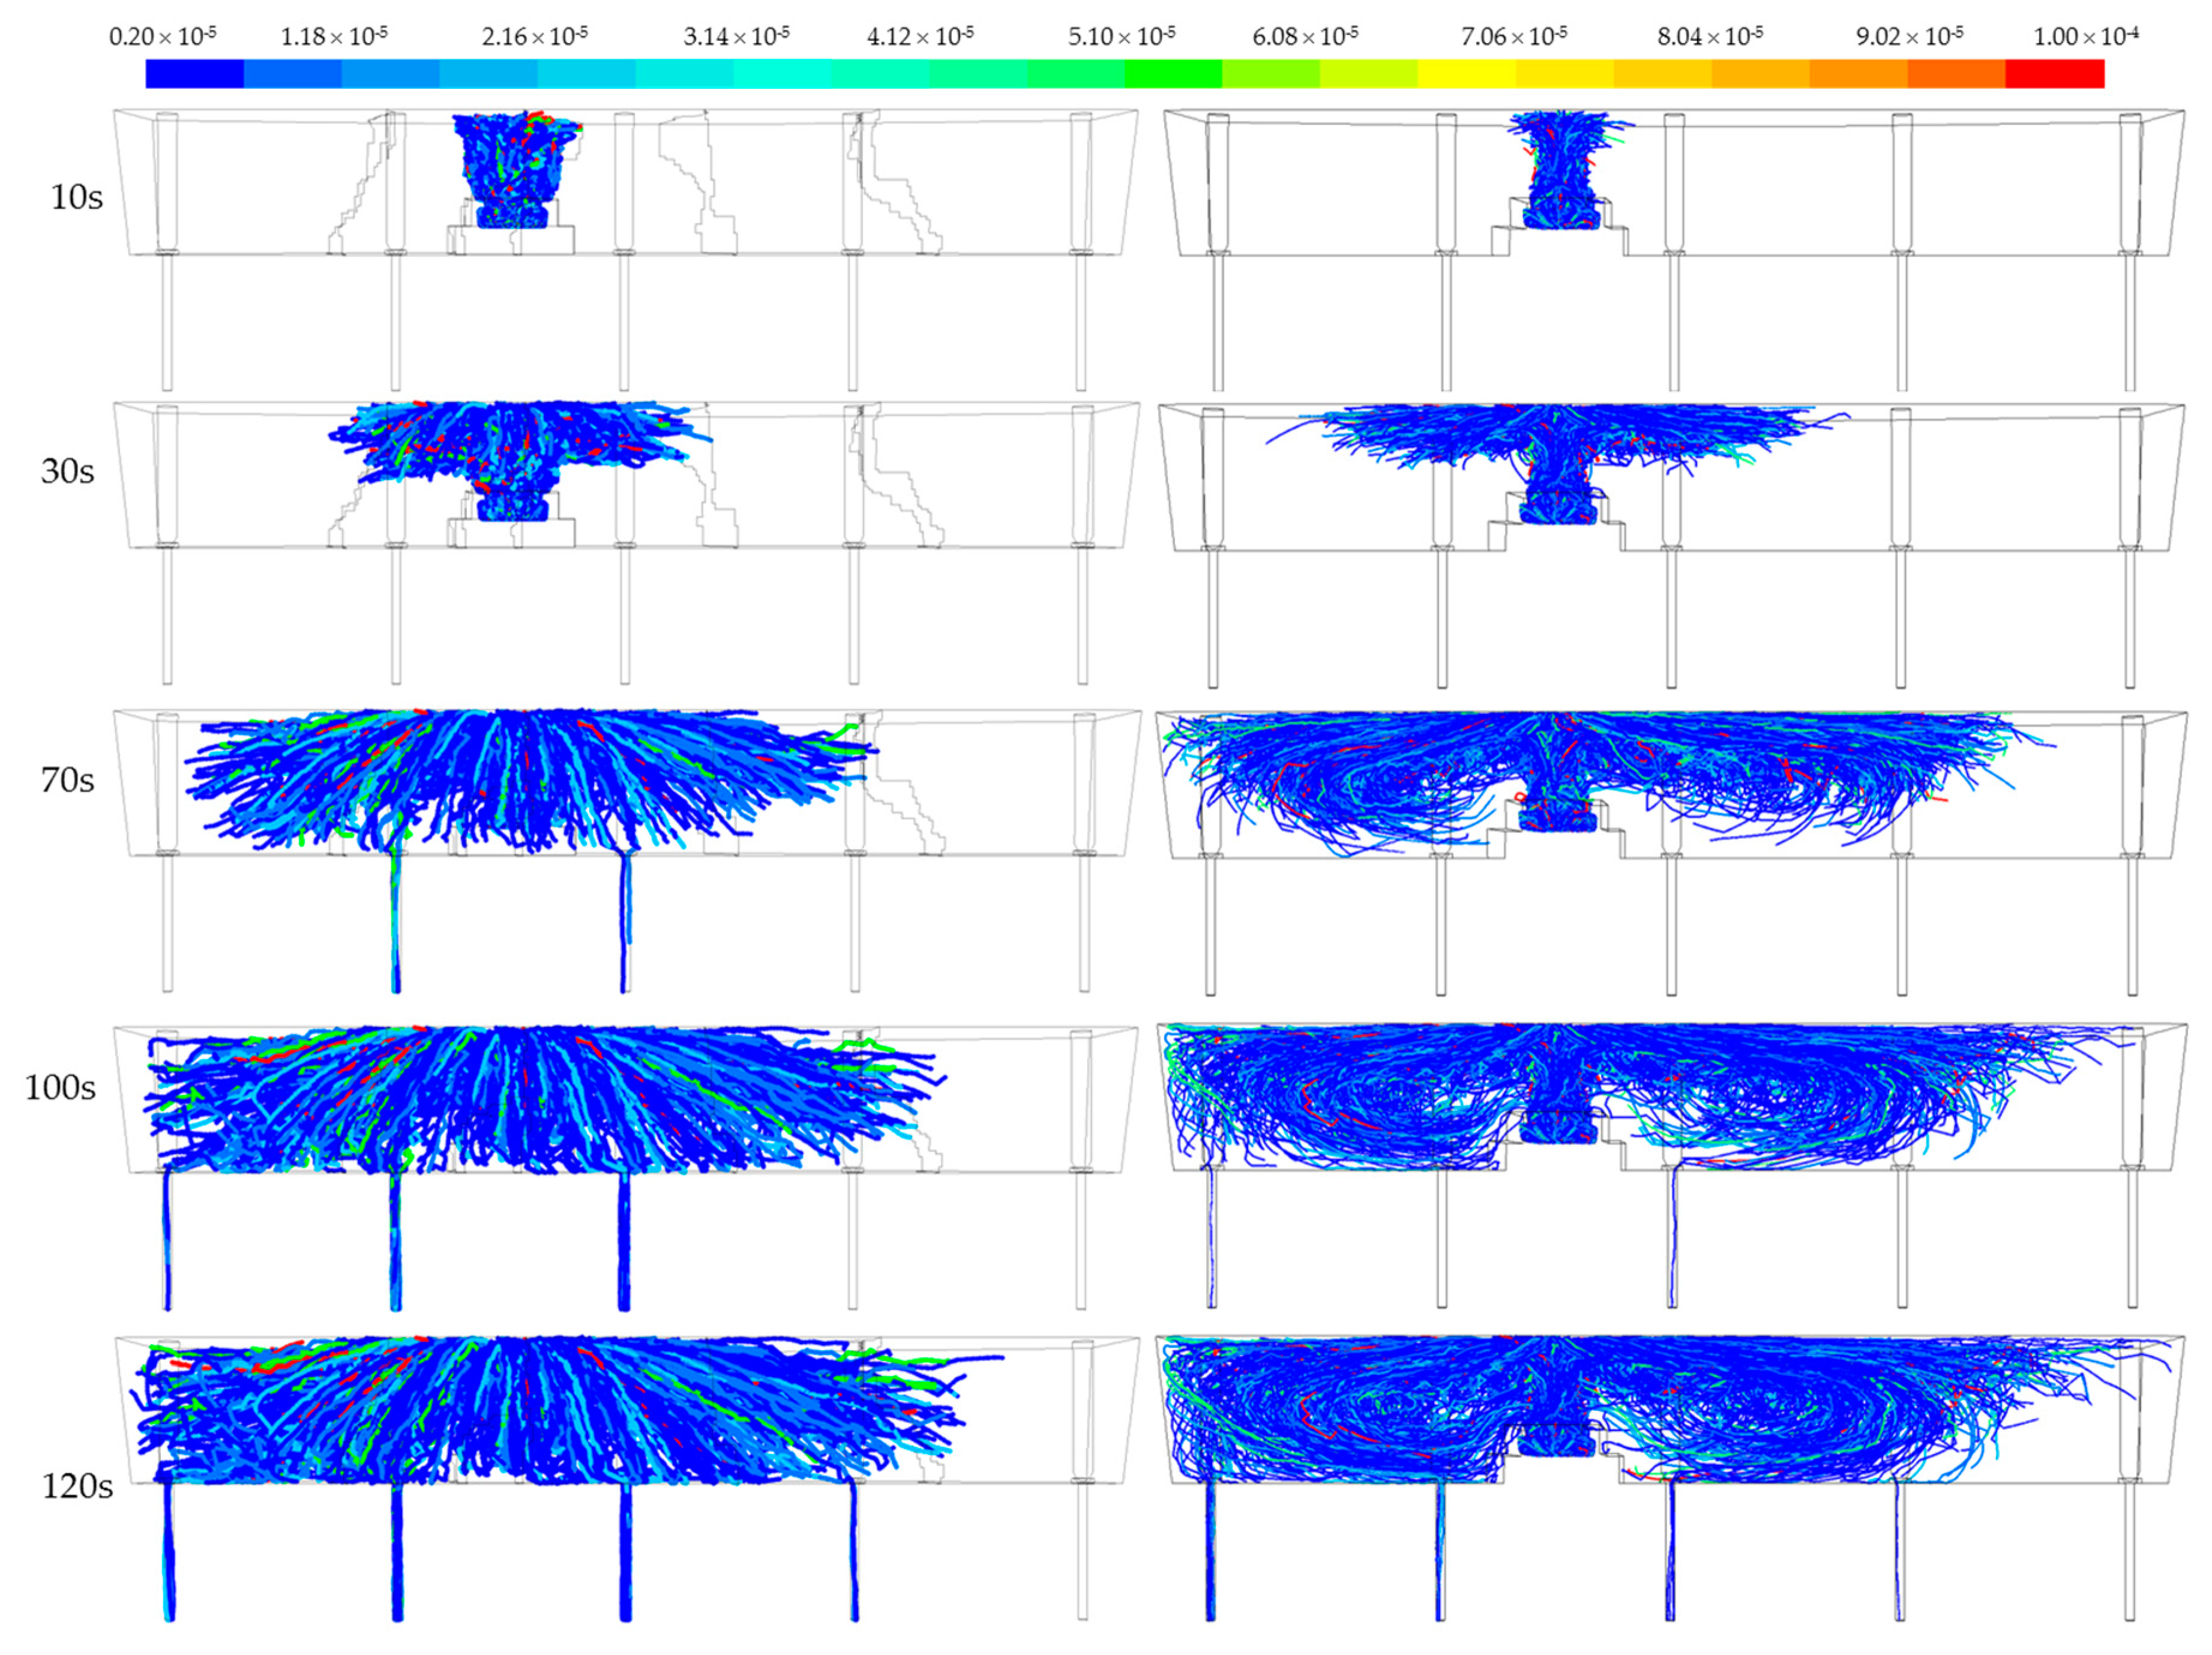
3.4. Distribution and Trajectory of Inclusions

The distribution proportions of inclusions were summarized above in Table 4 and Table 5. When modelling the removal of inclusions, we considered their size to be from 2 to 100 µm and the density from 2500 to 3500 kg·m−3. The inclusions were distributed through a shroud tube. If the inclusion touched the tundish wall during the flow, it was reflected back into the melt volume. However, when the inclusion bounced against the tundish wall, the speed of the inclusion was expected to be attenuated. If the inclusion touched the surface or entered the nozzle area, it was considered to escape the computational domain.
The trajectory of inclusions calculated for all proportions of the considered inclusions according to their size and density is captured for selected time moments in Figure 10. Figure 10 shows that the largest proportion in the modelling of the inclusions separation is represented by particles of 2 to 10 µm in size and a density of 3000 kg·m−3. In the small representation, inclusions of 20 to 100 µm in size are also modelled. The movement trajectory of inclusions corresponds to the flow character of steel melt in the tundish and the monitored change in the tracer concentration. If we compare the flow of inclusions at 100 s, then in the variant with M1 the inclusions are already torn down into the nozzles of CS3 through CS5, while in the variant with M2 the inclusions are only gradually beginning to appear in nozzles of CS5 and CS3. The trajectory of inclusions in M2 also shows a longer flow path of the inclusions near the surface all the way to nozzle of CS1.

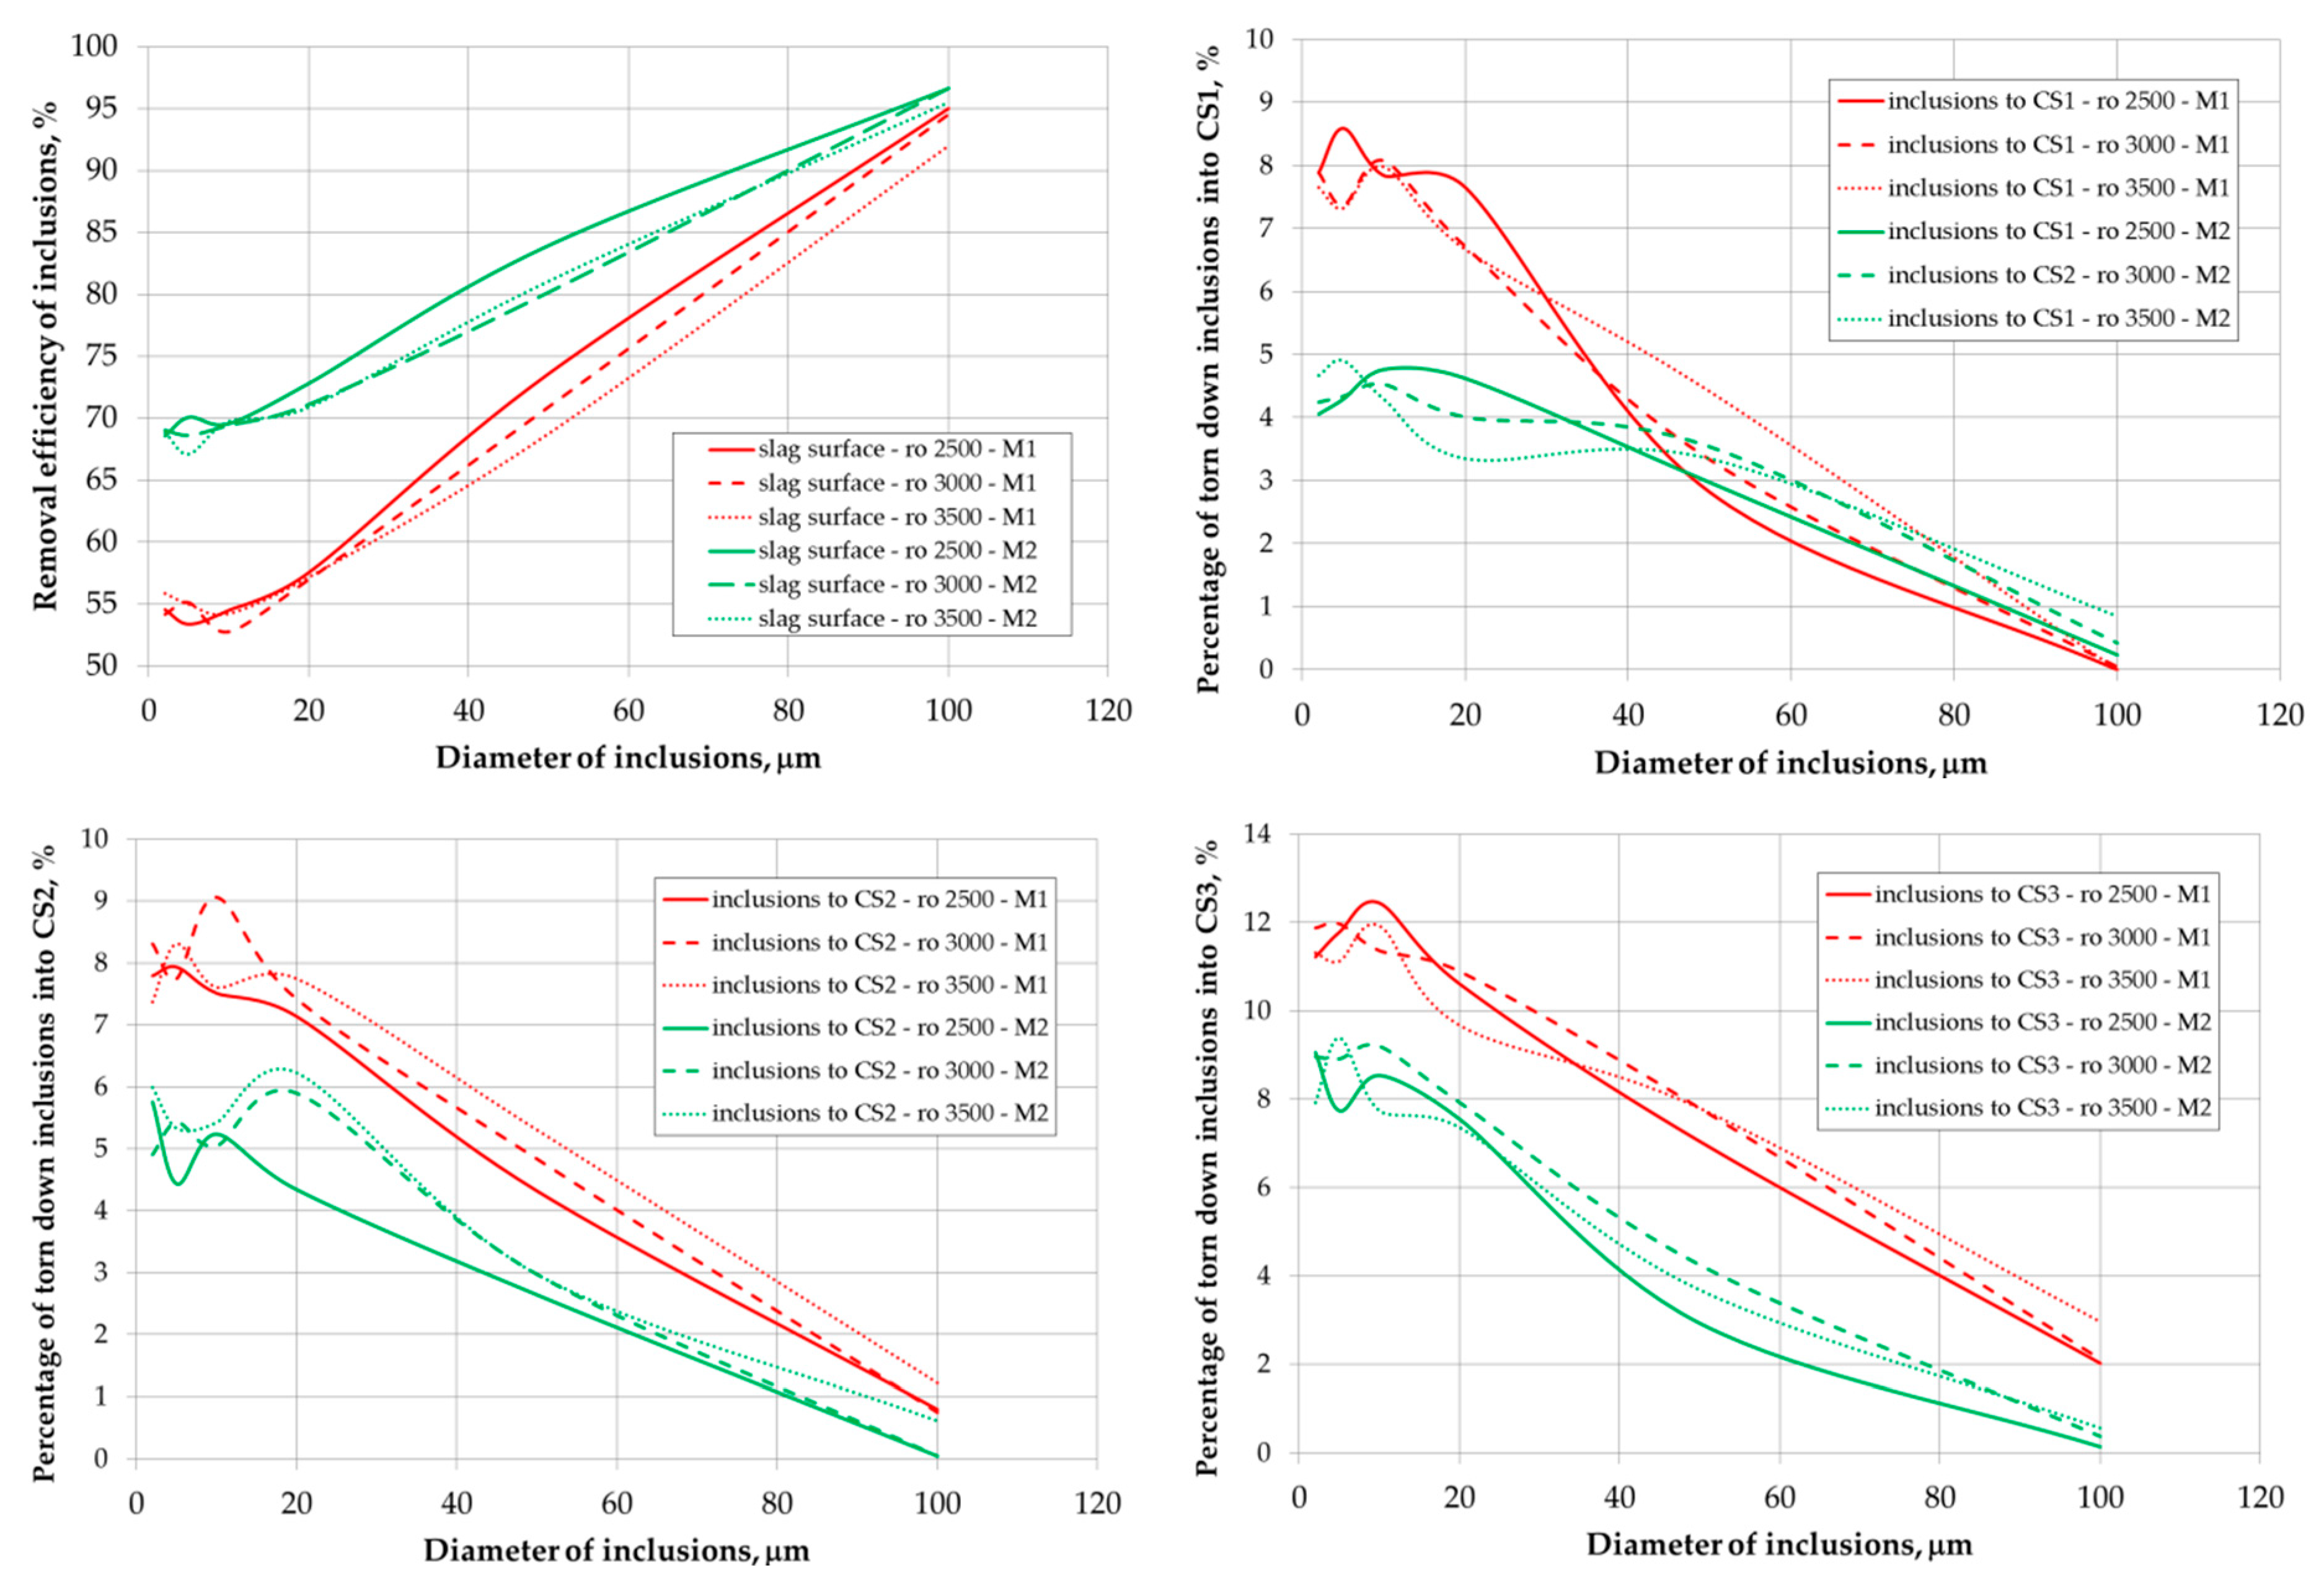
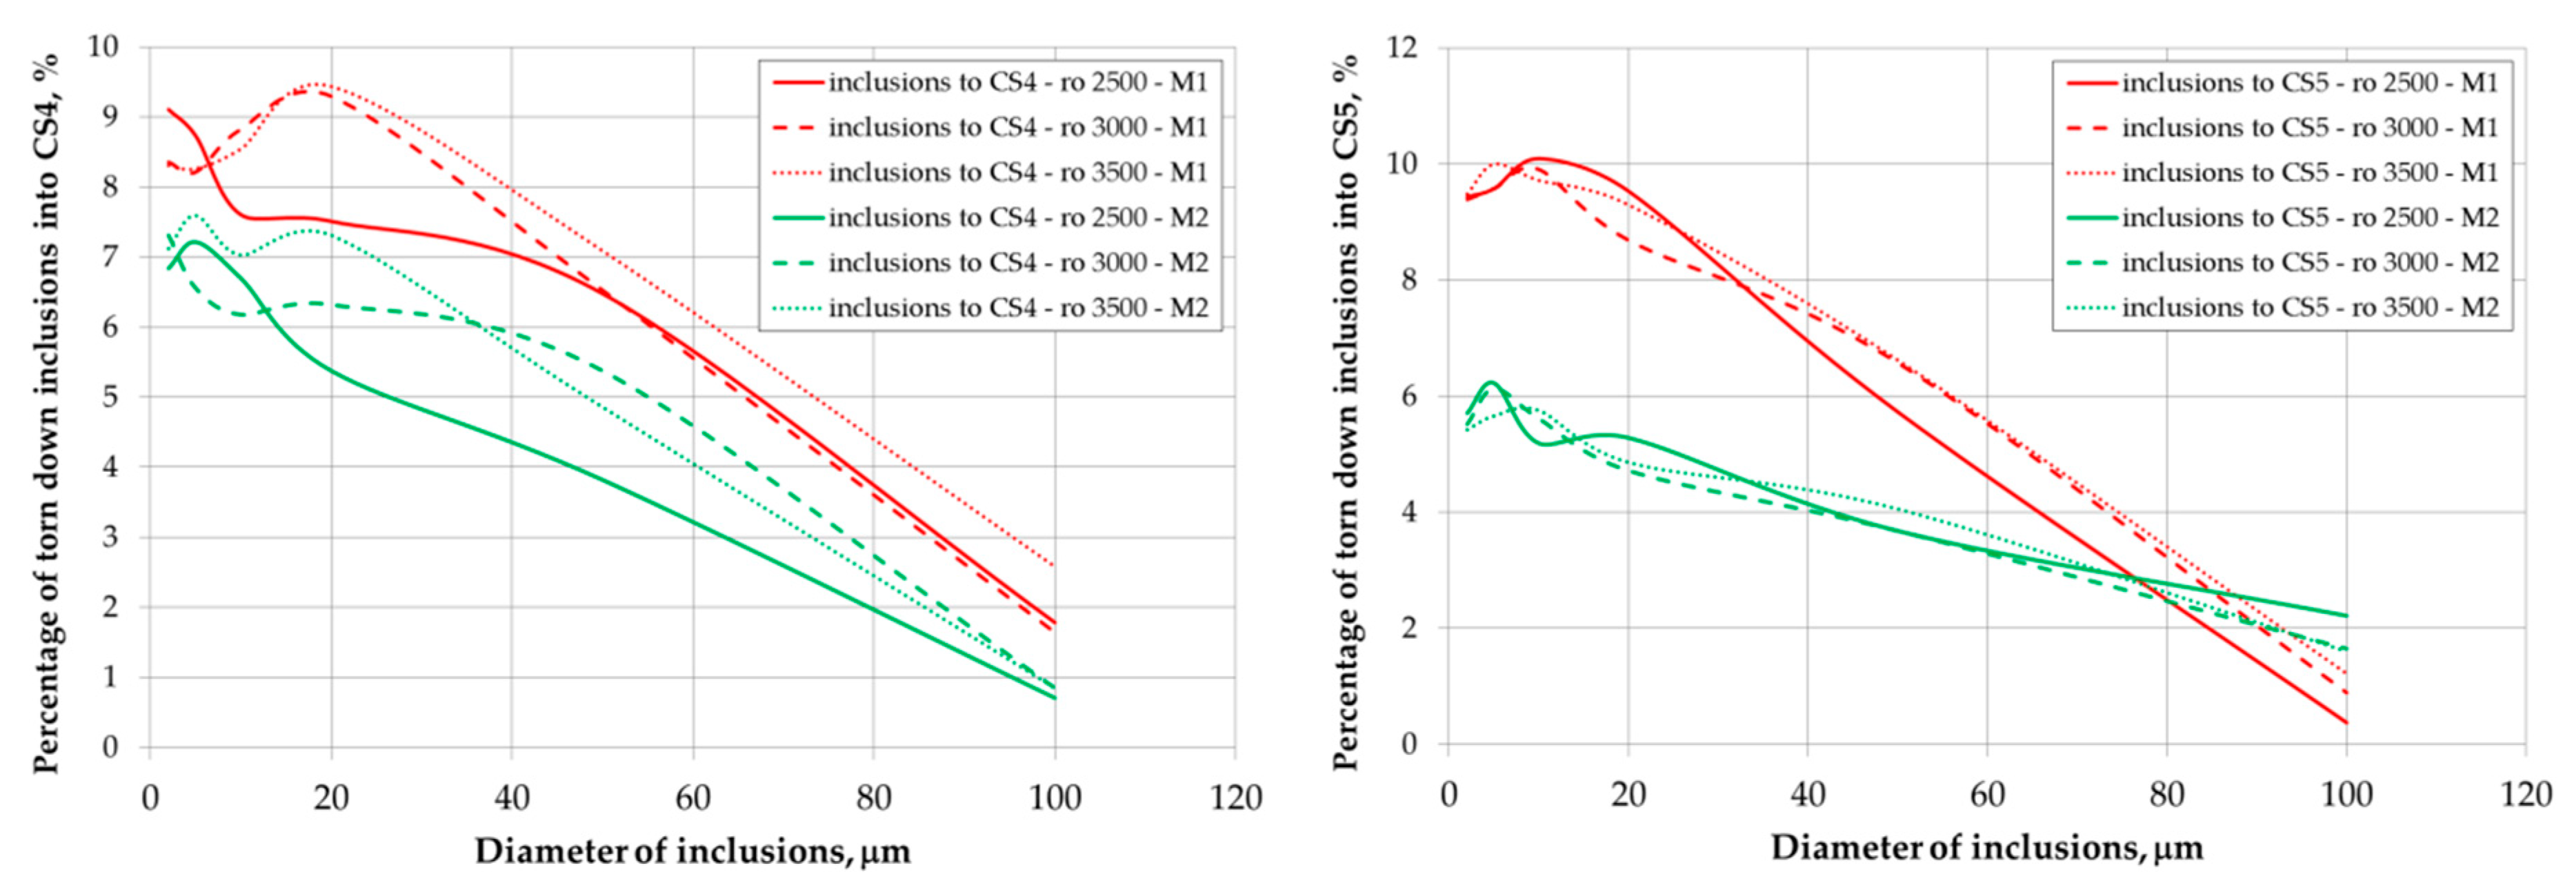
3.5. Residence Time and Removal Efficiency of Inclusions

Primarily, numerical analysis of the removal of inclusions was performed for distribution of inclusions in a stream of one size and density. This means that only a 100% share of one fraction was modelled in the inlet steel stream through a shroud tube. From the results of non-metallic inclusions removal it is possible to predict the percentage amount of inclusions escaped by slag and amount of inclusions torn down into casting strands. The results of numerical modelling were processed to distribution curves, which are captured in Figure 11. The residence times of inclusions removed on the surface “into a slag” and the removal efficiency of inclusions through the surface are shown in Table 8.
Subsequently, numerical analysis of the inclusions removal was performed, where all proportions and densities of inclusions in the steel stream from a shroud tube were considered at once with the percentage distribution according to Table 4 and Table 5. The resulting calculated percentages of inclusions removed through the surface and torn down into individual nozzles for the variants with M1 and M2 are listed in Table 9.
As can be seen from the results in Table 8 and Table 9, in both cases with M1 and M2, the inclusion efficiency removal is really high because of the prerequisites of model setting when we supposed ideally removal inclusions from domain through the slag. In real casting conditions, the escape of inclusions on the interface melt-slag is not so well observed. On the other hand, the simplified model setting can help to compare the differences between the efficiency of inclusion removal during the modification of boundary condition of technology. Therefore, from the results of the calculation of inclusions removal through the surface and being torn down into the nozzles for the modelled versions M1 and M2, it can be inferred that in the variant with M1, the removal efficiency of inclusions up to 20 µm in size through the surface is only around 55%, while in the variant with M2 the efficiency has increased by 15% to approximately 70%. The remaining 45% of inclusions in M1, or 30% of inclusions in M2 are torn down into individual nozzles of casting strands of the tundish. Inclusions with a size of 50 to 100 µm are removed from 80% in average through the surface in all modelled versions. The M1 variant for inclusions with a density of 3000 kg⋅m−3 and a diameter of 10 µm shows a minimum removal efficiency of inclusions through the surface, at only 52%. In the M2 version, approximately 70% of the inclusions are removed through the surface and the distribution of inclusions in nozzles of the casting strands is on average approximately 5%. However, what is taken into account is that the proportion of these large inclusions is only 5% of the total amount of inclusions in the melt volume flowing through the tundish. As the diameter of the inclusions increases, the conditions for capturing the inclusions by the slag improve which is consistent with results of the other authors, e.g., [30] or [34]. This trend is explained by the change of the forces affecting the particles according to their size, where the particles up to 40 μm are carried away by inertial forces, while the flotation principle starts to be applied in larger inclusions. If we compare the achieved results with the results of the authors in more detail [34,38], it should be noted that the efficiency of inclusions removal will be significantly affected by their density and the amount of steel melt in the tundish. This will be the subject of further research.
When all inclusions distributed in the calculation of removal of inclusions at once by the steel stream from a shroud tube are represented, the efficiency of inclusion removal through the surface in the variant with M1 after rounding is 57%, and in the variant with M2, 72%. Therefore, it can be concluded that the modification of an impact pad in the M2 configuration significantly contributed to the directed steel flow in the tundish and to the increase of the removal efficiency of inclusion through the surface.

4. Conclusions

The paper deals with the control of a non-metallic inclusion removal during steel flow in a five-strand asymmetric tundish of a continuous casting machine, while using two types of impact pads referred to as M1 and M2. Numerical modelling was used to study steel flow in the tundish and removal efficiency of inclusions. The following findings were achieved from the research and development of the authors:
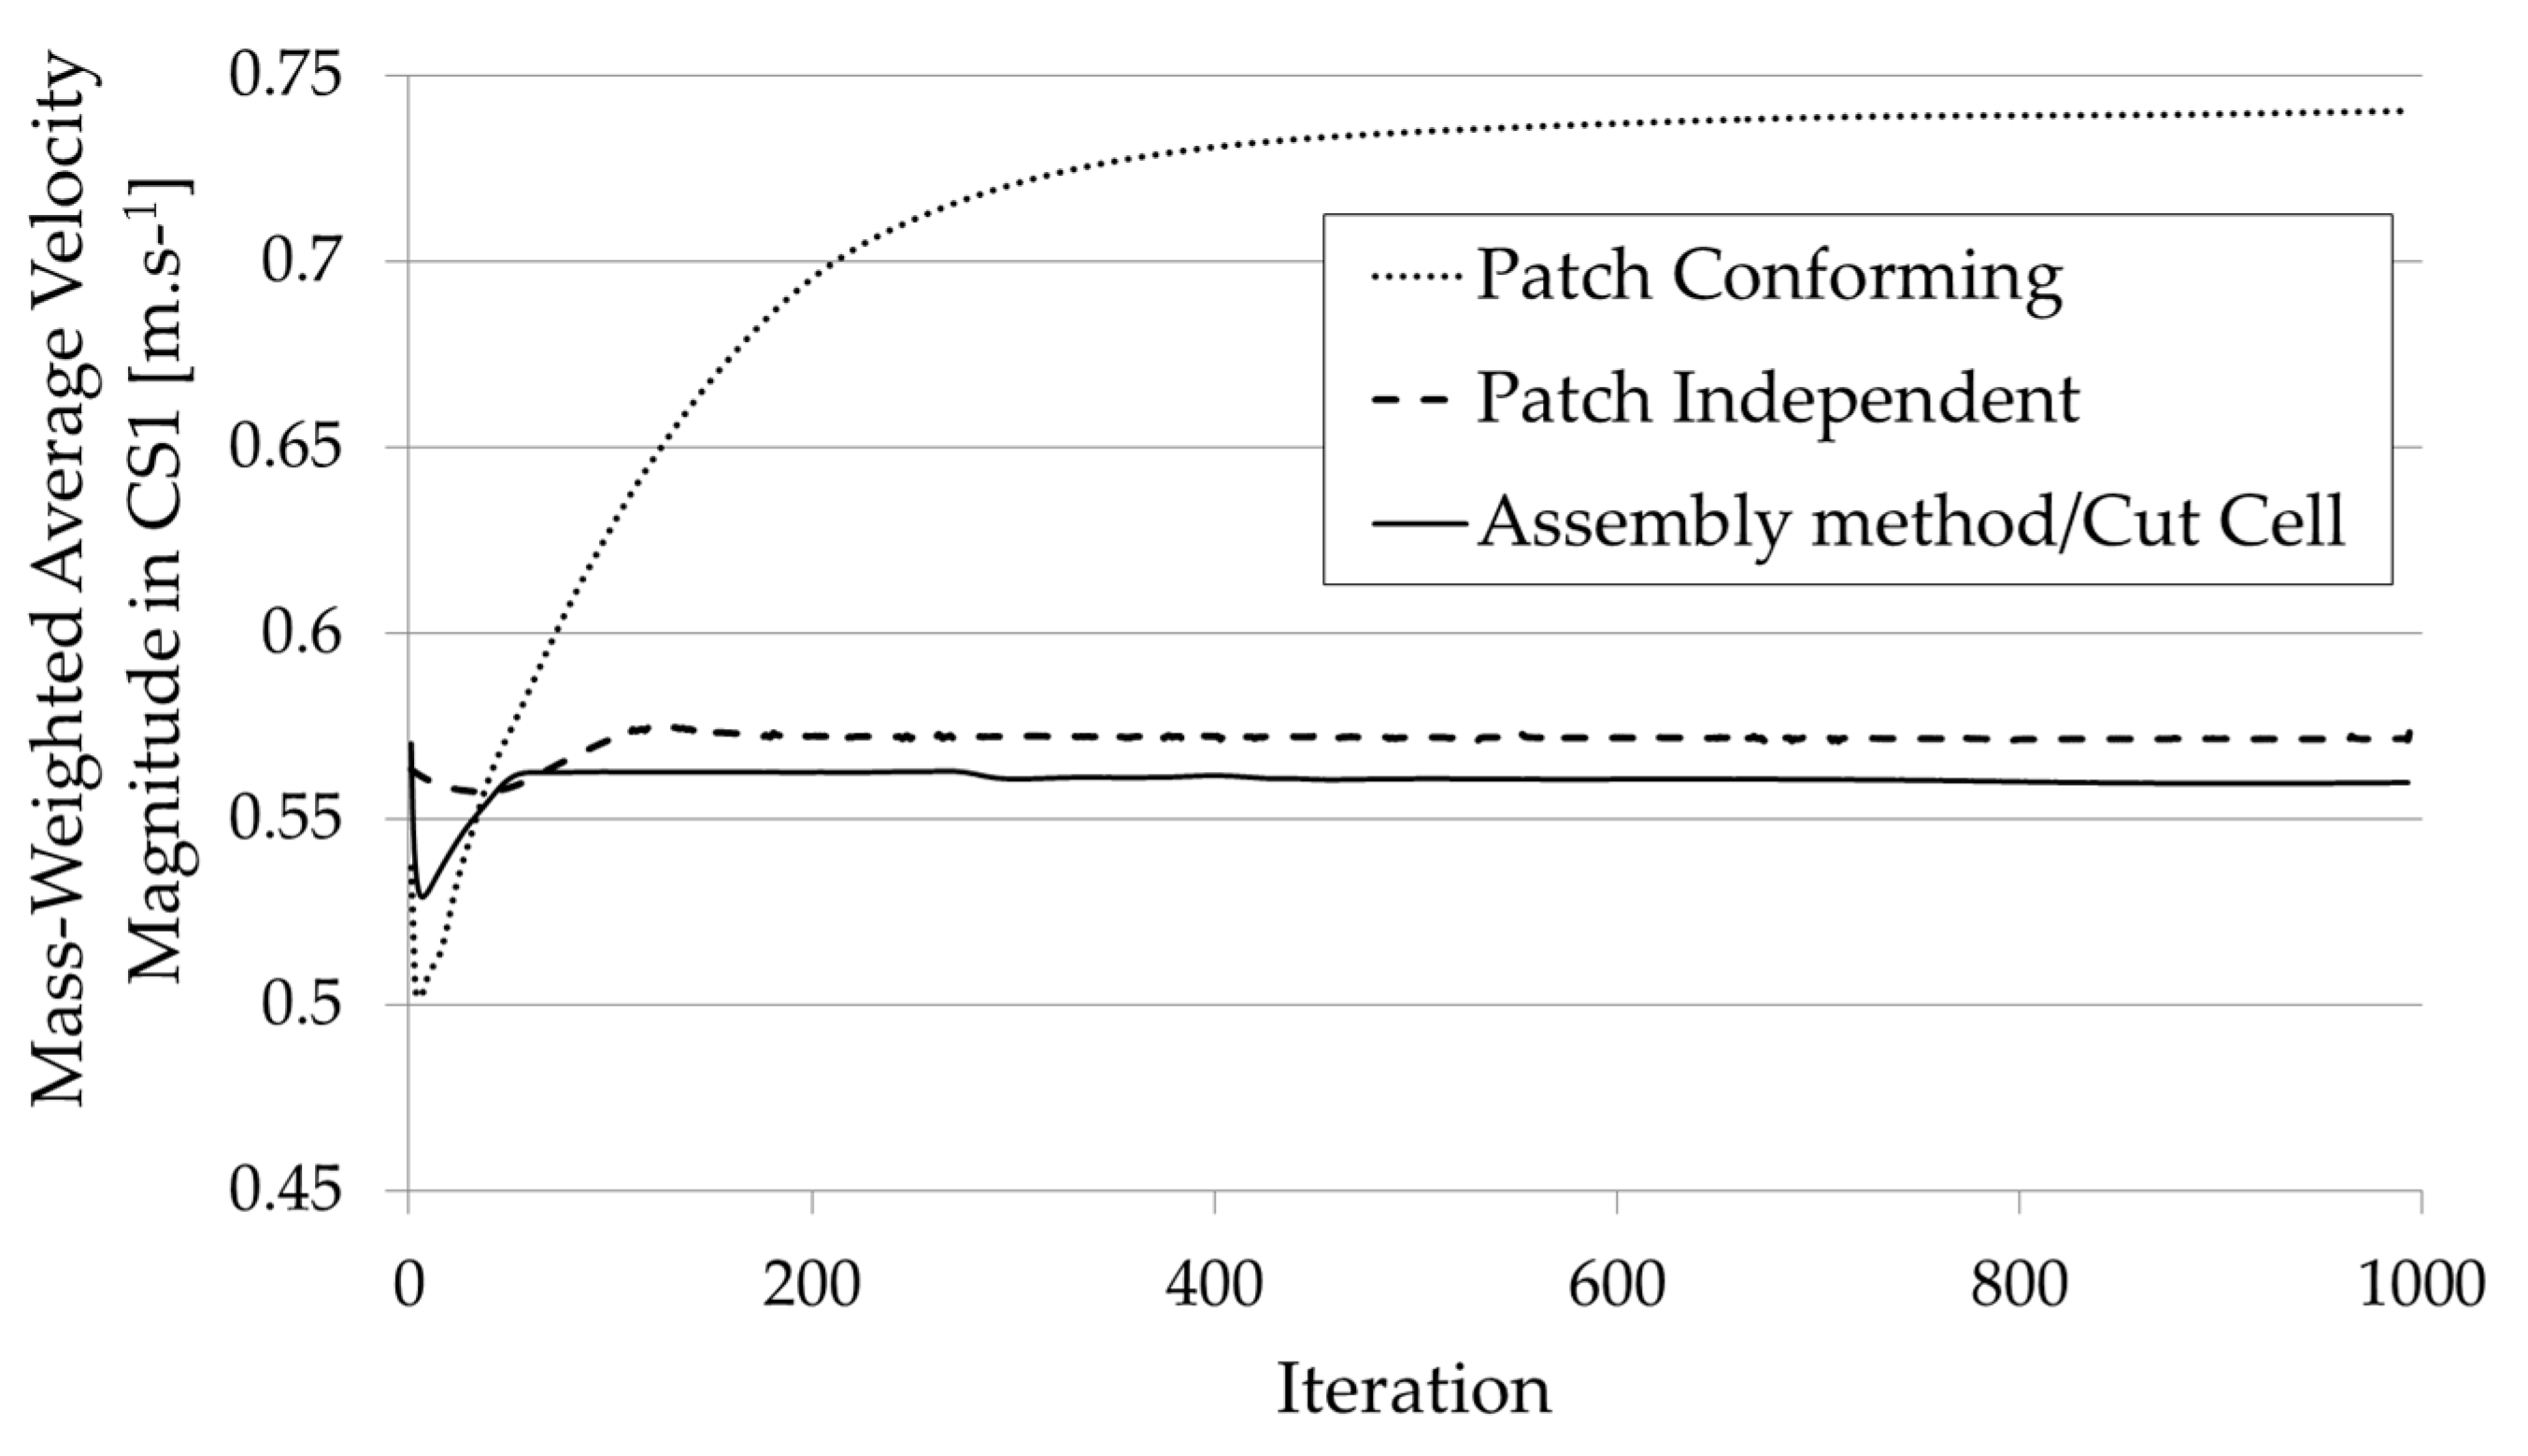
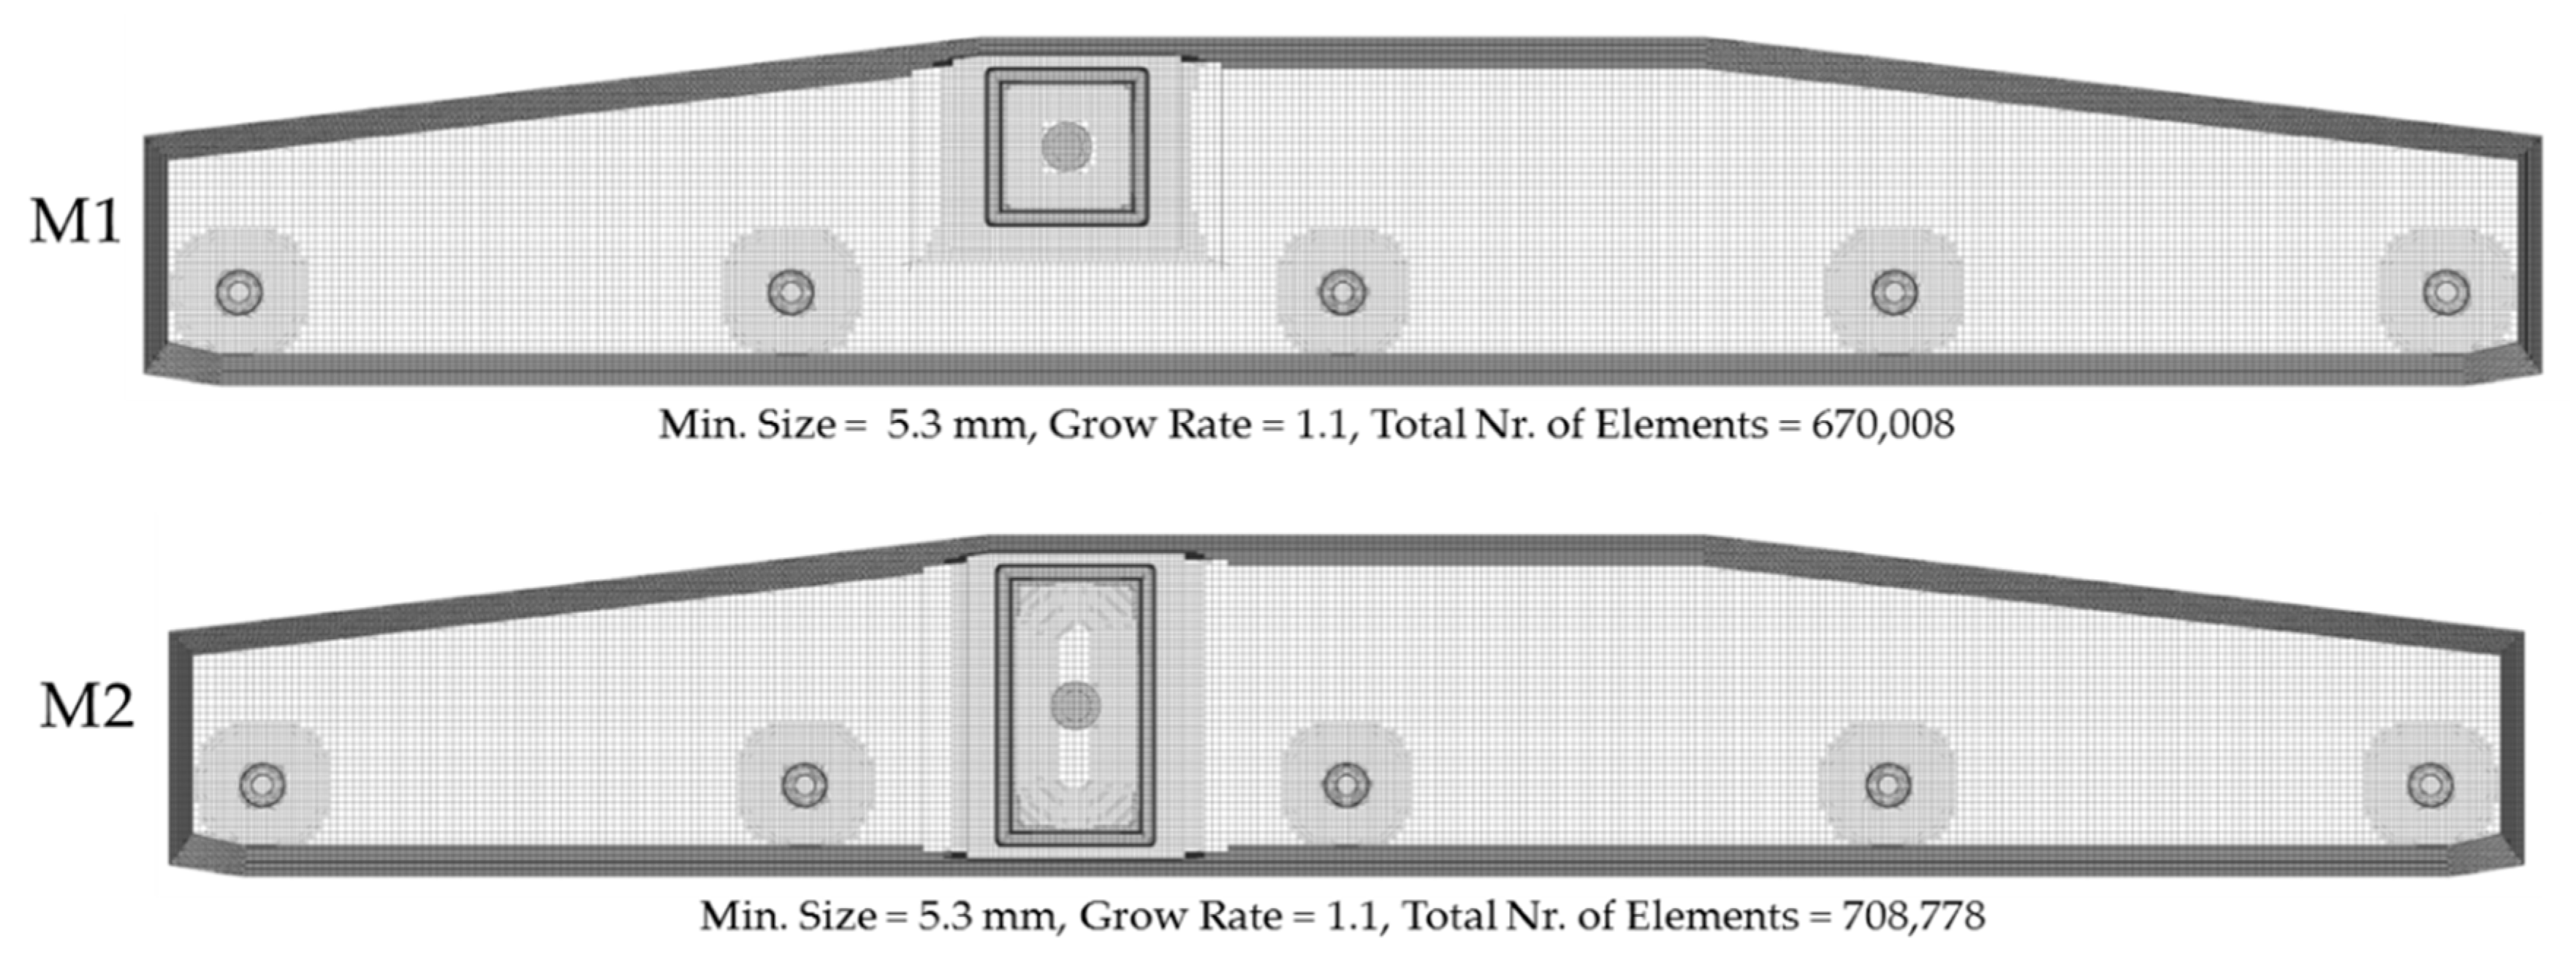
  • The prerequisite for the use of numerical modelling is achieving stability of the calculation and convergence of the task, which is largely dependent on the quality of the computational mesh. The authors of the paper verified several methods of creation of computational mesh, namely patch conforming, patch independent, multizone and assembly method. The assembly method with the prevalence of Hexa elements seemed to be the most suitable, which proved competent thanks to its speed, simplicity, and accuracy, especially in the case of geometry modification of the modelled area.
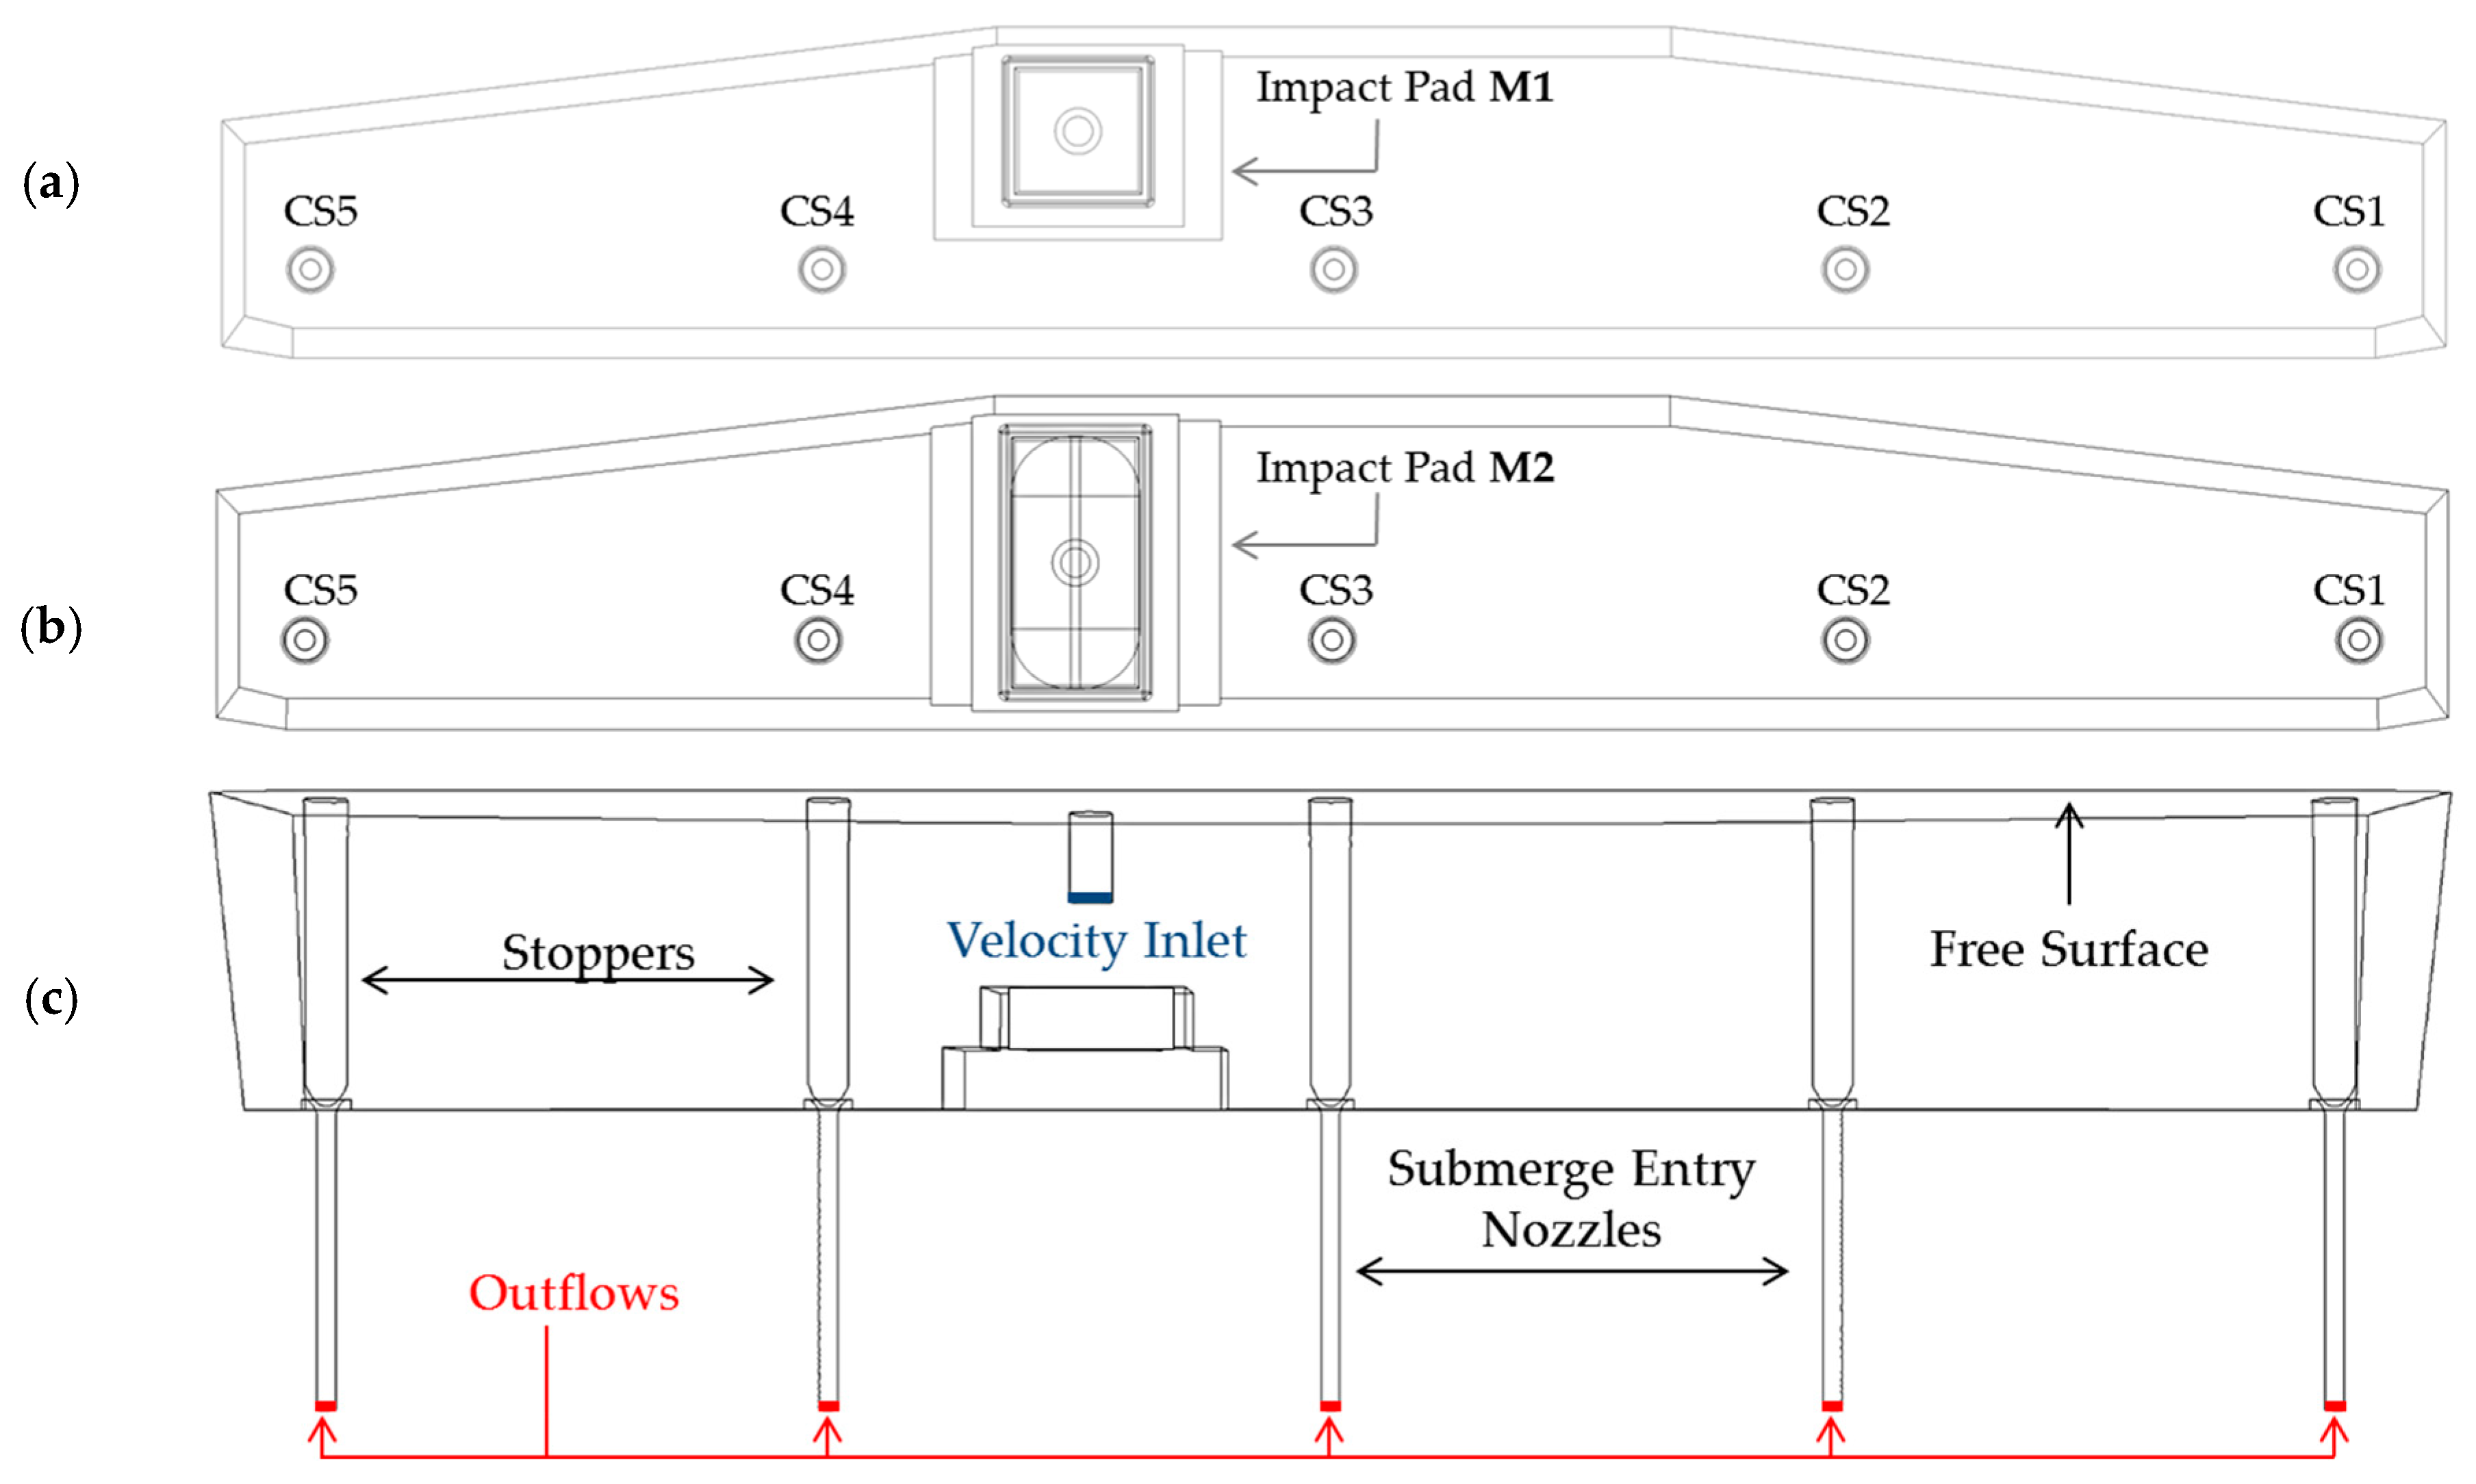
  • The removal efficiency of inclusions was numerically analysed for the two proposed impact area configurations designated M1 and M2. Prior to the analysis of the inclusion removal, the steady steel flow in the tundish, including the heat conduction through the tundish walls and surface, was calculated. The flow character was evaluated using RTD F curves.
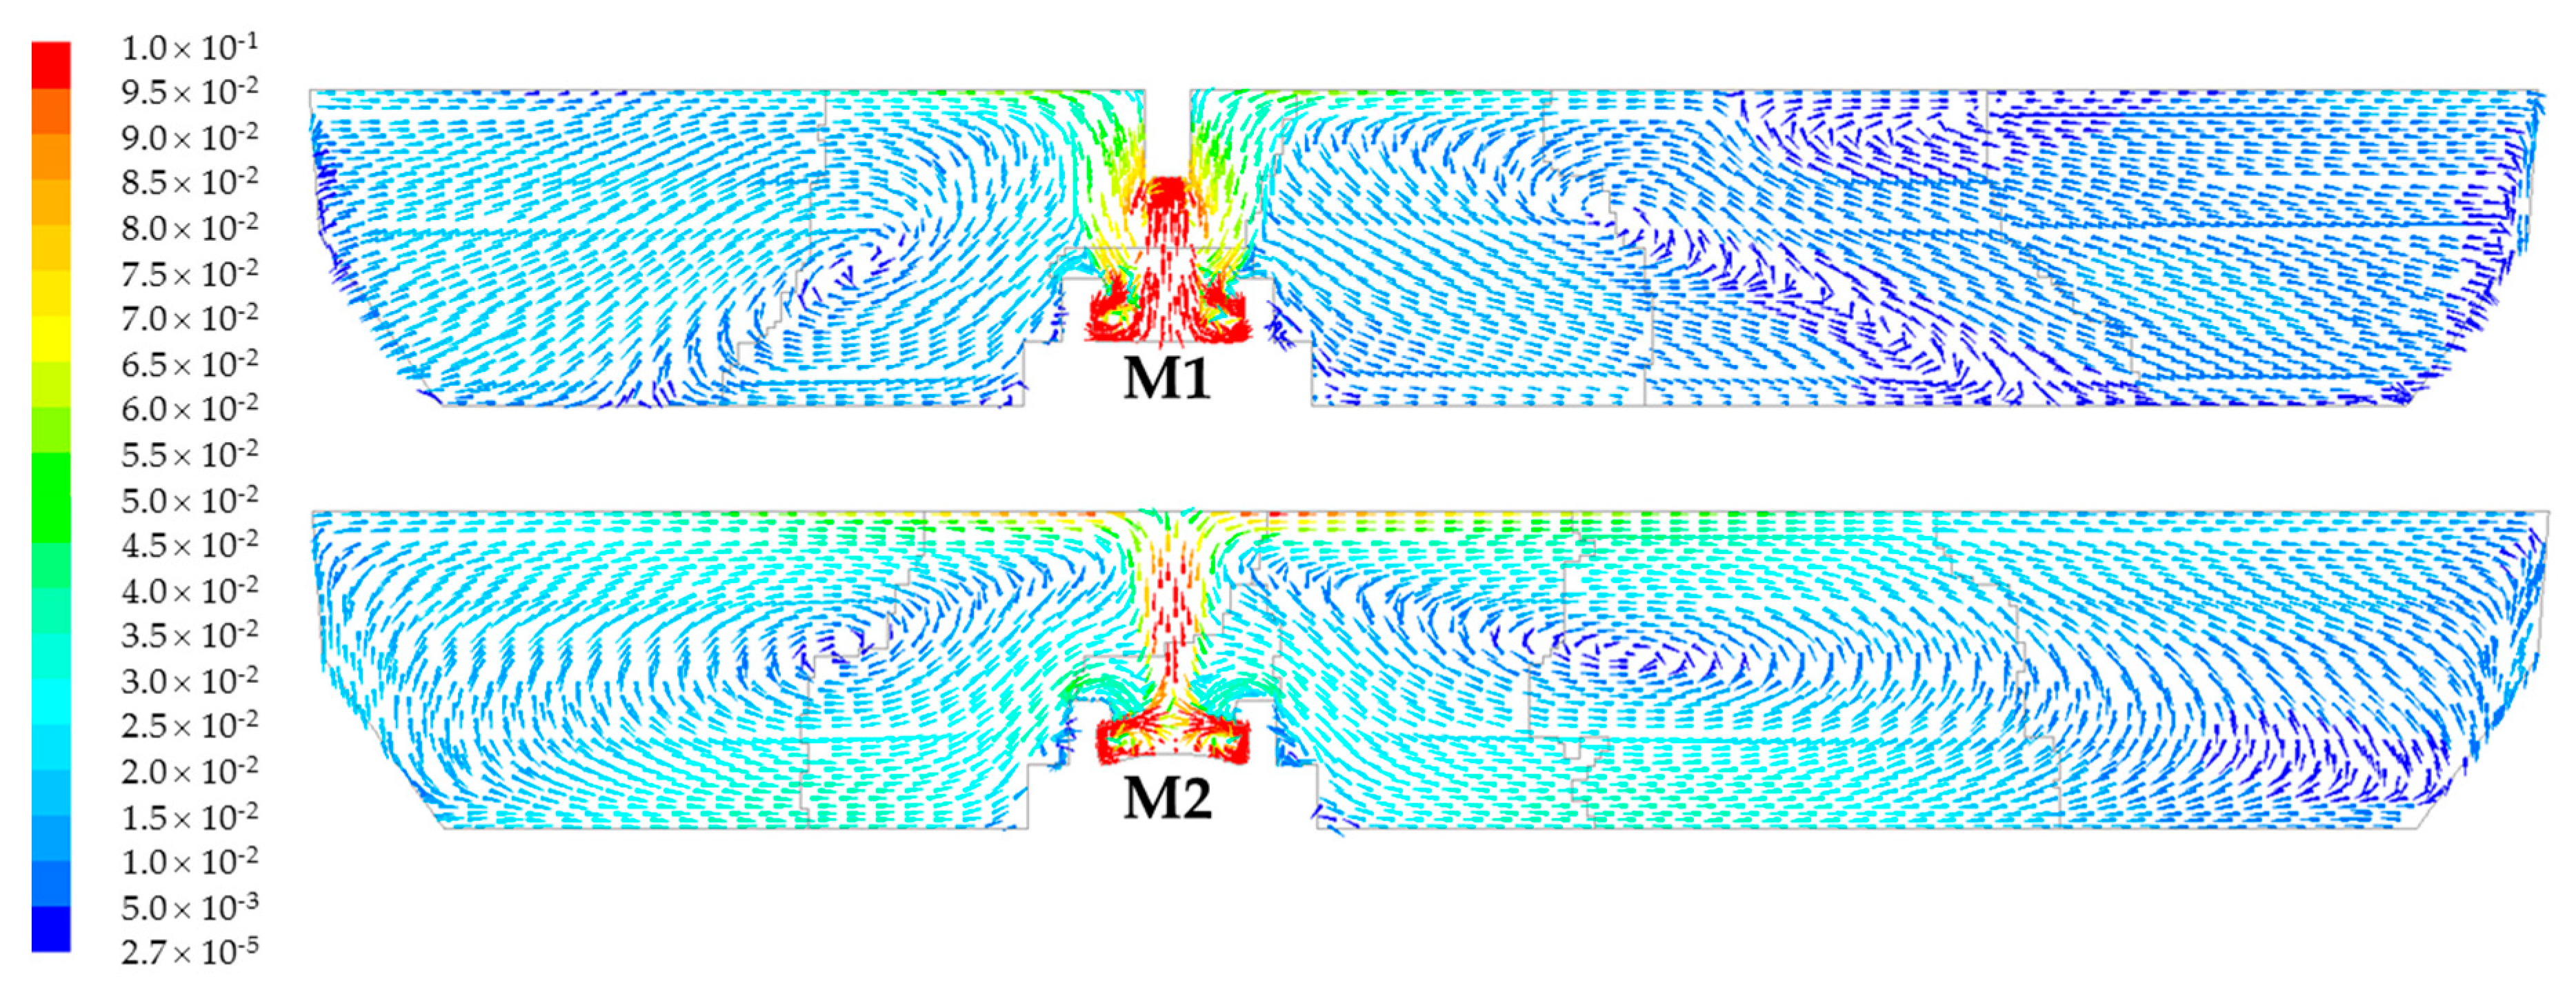
  • The configuration of the tundish equipped with an impact pad designated as M2 resulted in a higher proportion of steel plug flow and better inclusion removal efficiency by as much as 15% compared to the application with an M1 impact pad.

Author Contributions

Methodology, M.T., K.M., and J.W.; data resources, T.H.; numerical modelling, M.T.; writing—original draft, M.T.; writing—review and editing, M.T., K.M., J.W., and T.H. All authors have read and agreed to the published version of the manuscript.

Funding

This paper was created in the project No. CZ.1.05/2.1.00/19.0387 “Development of research and development basis of RMSTC” within the frame of the operation programme Research and Development for Innovations financed by the Structural Funds and from the state budget of the Czech Republic. The article was created thanks to the project No. CZ.02.1.01/0.0/0.0/17_049/0008399 from the EU and CR financial funds provided by the Operational Programme Research, Development and Education, Call 02_17_049 Long-Term Intersectoral Cooperation for ITI, Managing Authority: Czech Republic-Ministry of Education, Youth and Sports. This work was also supported by the Student Grant Competition No. SP2020/64 and SP2020/39.

Conflicts of Interest

The authors declare no conflict of interest. The funders had no role in the design of the study; in the collection, analyses, or interpretation of data; in the writing of the manuscript; or in the decision to publish the results.

References

  1. Worldsteel Association. Steel Statistical Yearbook 2018. Available online: https://www.worldsteel.org/en/dam/jcr:e5a8eda5-4b46-4892-856b-00908b5ab492/SSY_2018.pdf (accessed on 9 September 2019).
  2. Michalek, K. Využití Fyzikálního a Numerického Modelování pro Optimalizaci Metalurgických Procesů, 1. vyd.; VŠB-Technická univerzita Ostrava: Ostrava, Czech Republic, 2001; p. 34. ISBN 80-7078-861-5. (In Czech) [Google Scholar]
  3. Mazumdar, D.; Evans, J.W. Modeling of Steelmaking Processes; CRC Press, Taylor & Francis Group: Boca Raton, FL, USA, 2009; pp. 463–978. [Google Scholar]
  4. Bul’ko, B.; Molnár, M.; Demeter, P.; Baricová, D.; Pribulová, A.; Futáš, P. Study of the Influence of Intermix Conditions on Steel Cleanliness. Metals 2018, 8, 852. [Google Scholar] [CrossRef] [Green Version]
  5. Merder, T. Numerical simulation of liquid flow and mixing steel in multi-strands tundish. J. Achiev. Mater. Manuf. Eng. 2012, 55, 561–566. [Google Scholar]
  6. Michalek, K.; Gryc, K.; Tkadlečková, M.; Bocek, D. Model study of tundish steel intermixing and operational verification. Arch. Metall. Mater. 2012, 57, 291–296. [Google Scholar] [CrossRef] [Green Version]
  7. Warzecha, M. Numerical Modeling of Steel Flow in a Multi-Strand Continuous Casting Tundish. Acta Metall. Slovaca 2014, 20, 140–145. [Google Scholar] [CrossRef] [Green Version]
  8. Siddiqui, I.H.; Kim, M.-H. Two-Phase Numerical Modeling of Grade Intermixing in a Steelmaking Tundish. Metals. 2019, 9, 40. [Google Scholar] [CrossRef] [Green Version]
  9. Sahai, Y.; Emi, T. Melt Flow Characterization in Continuous Casting Tundishes. ISIJ Int. 1996, 36, 667–672. [Google Scholar] [CrossRef]
  10. Alaei, A.R.; Edris, H.; Shirani, E. Upward Molten Flow for Optimization of Fluid Flow in Continuous Casting Tundish. J. Iron Steel Res. Int. 2010, 17, 29–33. [Google Scholar] [CrossRef]
  11. Braun, A.; Warzecha, M.; Pfeifer, H. Numerical and Physical Modeling of Steel Flow in a Two-Strand Tundish for Different Casting Conditions. Metall. Mater. Trans. B 2010, 41, 549–559. [Google Scholar] [CrossRef]
  12. Warzecha, M. Numerical and physical modelling of steel flow in a one-strand continuous casting tundish. Metalurgija 2011, 50, 147–150. [Google Scholar]
  13. Sowa, L. Numerical Modelling of Fluid Flow and Thermal Phenomena in the Tundish of CSC Machine. Arch. Foundry Eng. 2014, 14, 103–106. [Google Scholar] [CrossRef]
  14. Warzecha, M.; Merder, T.; Warzecha, P.; Stradomski, G. Experimental and Numerical Investigations on Non-metallic Inclusions Distribution in Billets Casted at a Multi-strand Continuous Casting Tundish. ISIJ Int. 2013, 53, 1983–1992. [Google Scholar] [CrossRef] [Green Version]
  15. Warzecha, M.; Hutny, A.M.; Warzecha, P.; Merder, T.; Jędrysiak, B. Methodology of inclusions removing from steel flowing through the tundish. Metalurgija 2017, 56, 291–293. [Google Scholar]
  16. Silva, A.C.E. Non-metallic inclusions in steels—Origin and control. J. Mater. Res. Technol. 2018, 7, 283–299. [Google Scholar] [CrossRef]
  17. Morales, R.D.; Barreto, J.D.J.; LoPez-Ramirez, S.; Palafox-Ramos, J.; Zacharias, D. Melt flow control in a multistrand tundish using a turbulence inhibitor. Metall. Mater. Trans. B 2000, 31, 1505–1515. [Google Scholar] [CrossRef]
  18. López-Ramírez, S.; Palafox-Ramos, J.; Morales, R.D.; Barreto, J.D.J.; Zacharias, D. Modeling study of the influence of turbulence inhibitors on the molten steel flow, tracer dispersion, and inclusion trajectories in tundishes. Metall. Mater. Trans. B 2001, 32, 615–627. [Google Scholar] [CrossRef]
  19. Merder, T.; Pieprzyca, J.; Warzecha, M. Numerical modeling of steel flow in the six-strand tundish with different flow control devices. Metalurgija 2009, 48, 143–146. [Google Scholar]
  20. He, Z.; Zhou, K.; Liu, S.; Xiong, W.; Li, B. Numerical Modeling of the Fluid Flow in Continuous Casting Tundish with Different Control Devices. Abstr. Appl. Anal. 2013, 2013, 1–8. [Google Scholar] [CrossRef]
  21. Cwudziński, A. Numerical, Physical, and Industrial Studies of Liquid Steel Chemical Homogenization in One Strand Tundish with Subflux Turbulence Controller. Steel Res. Int. 2014, 86, 972–983. [Google Scholar] [CrossRef]
  22. More, M.V.; Saha, S.K.; Marje, V.; Balachandran, G. Numerical model of liquid metal flow in steel making tundish with flow modifiers. In IOP Conference Series: Materials Science and Engineering, Proceedings of 2nd International Conference on Mining, Material and Metallurgical Engineering, Bangkok, Thailand, 17–18 March 2017; IOP Publishing: Bristol, UK, 2017; Volume 191, p. 12021. [Google Scholar] [CrossRef] [Green Version]
  23. Yan, J.; Dong, X.; Yang, F.; Cheng, C.; Li, Y.; Wang, W. Removal Mechanism of Microscale Non-Metallic Inclusions in a Tundish with Multi-Hole-Double-Baffles. Metals 2018, 8, 611. [Google Scholar] [CrossRef] [Green Version]
  24. Khan, M.F.; Hussain, A.; Usmani, A.Y.; Yadav, R.; Jafri, S. Multiphase Flow Modeling of Molten Steel and Slag Flow for Different Tundish Configurations. Mater. Today Proc. 2018, 5, 24915–24923. [Google Scholar] [CrossRef]
  25. Wang, Q.; Liu, Y.; Huang, A.; Yan, W.; Gu, H.; Li, G. CFD Investigation of Effect of Multi-hole Ceramic Filter on Inclusion Removal in a Two-Strand Tundish. Metall. Mater. Trans. B 2019, 51, 276–292. [Google Scholar] [CrossRef]
  26. Buľko, B.; Priesol, I.; Demeter, P.; Gasparovic, P.; Baricová, D.; Hrubovčáková, M. Geometric Modification of the Tundish Impact Point. Metals 2018, 8, 944. [Google Scholar] [CrossRef] [Green Version]
  27. Chang, S.; Huang, W.; Zou, Z.; Li, B.; Guthrie, R.I. Motion behavior of micro-bubbles in a delta shape tundish using impact pad. Powder Technol. 2020, 367, 296–304. [Google Scholar] [CrossRef]
  28. Bartosiewicz, M.; Cwudziński, A. Intensification of liquid steel active flow volume in one-strand tundish using a modified ladle shourd. Metall. Mater. Eng. 2020, 26, 1–14. [Google Scholar] [CrossRef]
  29. Cwudziński, A. Numerical and Physical Modeling of Liquid Steel Flow Structure for One Strand Tundish with Modern System of Argon Injection. Steel Res. Int. 2017, 88, 1600484. [Google Scholar] [CrossRef]
  30. Ramos-Banderas, A.; Morales, R.D.; Barreto, J.D.J.; Solorio-Diaz, G. Modelling Study of Inclusions Removal by Bubble Flotation in the Tundish. Steel Res. Int. 2006, 77, 325–335. [Google Scholar] [CrossRef]
  31. Devi, S.; Singh, R.K.; Paul, A. Role of Tundish Argon Diffuser in Steelmaking Tundish to Improve Inclusion Flotation with CFD and Water Modelling Studies. Int. J. Eng. Res. Technol. 2015, 4, 213–218. [Google Scholar] [CrossRef]
  32. Ling, H.; Xu, R.; Wang, H.; Chang, L.; Qiu, S. Multiphase Flow Behavior in a Single-Strand Continuous Casting Tundish during Ladle Change. ISIJ Int. 2020, 60, 499–508. [Google Scholar] [CrossRef] [Green Version]
  33. Huang, J.; Yuan, Z.; Shi, S.; Wang, B.; Liu, C. Flow Characteristics for Two-Strand Tundish in Continuous Slab Casting Using PIV. Metals 2019, 9, 239. [Google Scholar] [CrossRef] [Green Version]
  34. García-Hernández, S.; Barreto, J.D.J.; Banderas, J.A.R.; Solorio-Diaz, G. Modeling Study of the Vortex and Short Circuit Flow Effect on Inclusion Removal in a Slab Tundish. Steel Res. Int. 2010, 81, 453–460. [Google Scholar] [CrossRef]
  35. Solorio-Díaz, G.; Davila-Morales, R.; Barreto-Sandoval, J.D.J.; Vergara-Hernández, H.J.; Ramos-Banderas, A.; Galván, S. Numerical Modelling of Dissipation Phenomena in a New Ladle Shroud for Fluidynamic Control and Its Effect on Inclusions Removal in a Slab Tundish. Steel Res. Int. 2013, 85, 863–874. [Google Scholar] [CrossRef]
  36. Gutierrez, E.; Garcia-Hernandez, S.; Barreto, J.D.J. Mathematical Modeling of Inclusions Deposition at the Upper Tundish Nozzle and the Submerged Entry Nozzle. Steel Res. Int. 2016, 87, 1406–1416. [Google Scholar] [CrossRef]
  37. Gutierrez, H.A.; Barreto, J.D.J.; García-Hernández, S.; Ramos-Banderas, A. Mathematical Analysis of Inclusion Removal from Liquid Steel by Gas Bubbling in a Casting Tundish. J. Appl. Math. 2012, 2012, 1–16. [Google Scholar] [CrossRef] [Green Version]
  38. Raghavendra, K.; Sarkar, S.; Ajmani, S.; Denys, M.; Singh, M. Mathematical modelling of single and multi-strand tundish for inclusion analysis. Appl. Math. Model. 2013, 37, 6284–6300. [Google Scholar] [CrossRef]
  39. Agarwal, R.; Singh, M.K.; Kumar, R.B.; Ghosh, B.; Pathak, S. Extensive Analysis of Multi Strand Billet Caster Tundish Using Numerical Technique. World J. Mech. 2019, 9, 29–51. [Google Scholar] [CrossRef] [Green Version]
  40. Rocha, J.R.D.S.; De Souza, E.E.B.; Marcondes, F.; De Castro, J.A. Modeling and computational simulation of fluid flow, heat transfer and inclusions trajectories in a tundish of a steel continuous casting machine. J. Mater. Res. Technol. 2019, 8, 4209–4220. [Google Scholar] [CrossRef]
  41. Pudasaini, S.P. A fully analytical model for virtual mass force in mixture flows. Int. J. Multiph. Flow 2019, 113, 142–152. [Google Scholar] [CrossRef]
  42. ANSYS Help Viewer; ANSYS Fluent: Canonsburg, PA, USA, 2019.
  43. Kozubková, M.; Drábková, S. Modelování Proudění Tekutin Fluent, CFX; VŠB-TU Ostrava: Ostrava, Czech Republic, 2008; 154p, Available online: http://www.338.vsb.cz/studium/skripta/ (accessed on 22 June 2020). (In Czech)
  44. Čarnogurská, M. Základy matematického a fyzikálního modelovania v mechanike tekutin a termodynamike; Technical University of Košice: Košice, Slovakia, 2000; 176p. (In Slovak) [Google Scholar]
  45. Morales, R.D.; Lopez-Ramírez, S.; Palafox-Ramos, J.; Zacharias, D. Numerical of liquid and steel modeling analysis in a tundish with of fluid flow and heat transfer difterent flow control devices. ISIJ Int. 1999, 39, 455–462. [Google Scholar] [CrossRef] [Green Version]
  46. Morales, R.D.; López-Ramírez, S.; Palafox-Ramos, J.; Zacharias, D. Mathematical simulation of effects of flow control devices and buoyancy forces on molten steel flow and evolution of output temperatures in tundish. Ironmak. Steelmak. 2001, 28, 33–43. [Google Scholar] [CrossRef]
  47. Singh, R.K.; Paul, A.; Ray, A.K. Modelling of flow behaviour in continuous casting tundish. Scand. J. Metall. 2003, 32, 137–146. [Google Scholar] [CrossRef]
Figure 1. 3D geometry of the modelled area, where (a) represents the floor plan of the tundish with the impact pad design M1 (b) represents the floor plan of the tundish bottom with the impact pad design M2 (c) front view of the tundish with elevated position of the impact pad, which is identical for both designs (i.e., M1 and M2). CS1–CS5 are Casting Strands.
Metals 10 00849 g001
Figure 2. Graphical comparison of the evolution of calculation of Mass-Weighted Average Velocity Magnitude through the selected nozzle of a 5-strand asymmetric tundish during validation of a computational mesh type.
Metals 10 00849 g002
Figure 3. Final computational meshes prepared by Assembly Method with Cut Cell.
Metals 10 00849 g003
Figure 4. Comparison of velocity vectors (m·s−1) for two tundish configurations in longitudinal sections through the centre of the shroud tube.
Metals 10 00849 g004
Figure 5. Comparison of velocity vectors (m·s−1) and flow profiles for two tundish configurations in cross-sections through the centre of the shroud tube.
Metals 10 00849 g005
Figure 6. Comparison of velocity vectors (m·s−1) for two tundish configurations in cross-sections through the centre of nozzles.
Metals 10 00849 g006
Figure 7. Comparison of a temperature field (in K) on the surface of the modelled area of the tundish for the configuration of the impact area M1 and M2.
Metals 10 00849 g007
Figure 8. Comparison of F curves in monitoring change in tracer concentration during the passage through a tundish during the steady steel flow.
Metals 10 00849 g008
Figure 9. Distribution of the tracer in the volume of a tundish during the steady flow of steel melt in the tundish equipped with impact pad M1 and impact pad M2.
Metals 10 00849 g009
Figure 10. Comparison of inclusion trajectory for tundish configuration with M1 and M2.
Metals 10 00849 g010
Figure 11. Comparison of the proportions of inclusions removed into the slag and torn down into casting strands for the fractions represented in the steel stream through a shroud tube by a 100% share.
Metals 10 00849 g011aMetals 10 00849 g011b
Table 1. Boundary conditions of model setting.
ParameterValueParameterValue
Casting speed-velocity inlet/m·s−11.04Working capacity of tundish/t32.4
Mass flow rate in velocity inlet/t·min−12.4Wall Roughness/m0.005
Casting temperature/K1773Steel level in tundish/mm925
Operating temperature/K1773Turbulent intensity/%10
Operating pressure/Pa101,325Hydraulic Diameter/m0.085
Gravity/m·s−2−9.81Heat flux of free surface/W·m−215,000
Thermo-physical propertiesf = THeat flux of tundish walls/W·m−22500
Table 2. Thermo-physical properties of steel defined as a function of temperature.
Temperature
°C
Density
kg·m−3
Specific Heat
J·kg−1·K−1
Thermal Conductivity
W·m−1·K−1
Viscosity
kg·m−1·s−1
15206970821350.0055
15106978817350.0056
15006985813350.0057
14906993809350.0058
14807001805350.0059
Table 3. Calculation parameters.
Type of CalculationType of ResultsTurbulent ModelThermo-Physical Properties (f = T)Free Surface
SteadyVelocity/TemperatureStandard k-ε/Standard Wall FunctionPiecewise-linearSpecified Shear = 0
TransientRTD/InclusionsStandard k-ε/Standard Wall FunctionPiecewise-linearSpecified Shear = 0
Table 4. Diameters of simulated inclusions and their distribution in the total volume of inclusions.
Diameter of Inclusions/µmDistribution/%
235
525
1020
2010
505
1005
Table 5. Densities of simulated inclusions and their distribution in the total volume of inclusions.
Density of Inclusions/kg·m−3Distribution/%
250020
300060
350020
Table 6. Metrics spectrum for skewness and orthogonal quality of computational mesh [42].
MetricUnacceptableBadAcceptableGoodVery GoodExcellent
Skewness0.98–1.000.95–0.970.80–0.940.50–0.800.25–0.500–0.25
Orthogonality0–0.0010.001–0.140.15–0.200.20–0.690.70–0.950.95–1.00
Table 7. The statistics of used mesh during setting validation of the numerical model.
MethodType of ElementsNo. of ElementsElement Size
mm
CPU (6 Processors)
FL + TH Eq
Skewness
Min./Max.
Orthogonality
Min./Max.
Patch ConformingTetra1,107,8623.46 h0.220.85
Patch IndependentTetra5,739,9121.710 h0.0006/0.610.43/0.99
Assembly methodHexa670,008 (M1)
708,778 (M2)
5.34 h1.3·10–10/0.550.55/1.00
Table 8. Comparison of residence times of inclusions and efficiency of their removal through the melt surface for individual fractions represented in the steel casting strand through a shroud tube by a 100% share.
Inclusion Diameter
(µm)
Inclusion Density
(kg·m−3)
Min. Residence Time (s)Max. Residence Time (s)Avg. Residence Time (s)Inclusion Removal Efficiency (%)
M1M2M1M2M1M2M1M2
225007.66.53220.02874.0233.2217.854.568.6
230007.66.83726.03232.0246.6228.354.269.1
235008.06.82927.02386.0234.2228.455.968.9
525007.66.53012.02723.0223.7237.153.470.1
530007.67.03090.02940.0238.7209.855.168.6
535008.06.92701.01925.0215.3201.054.967.1
1025007.67.12745.04398.0234.2209.654.569.6
1030007.66.43494.02882.0222.7208.852.869.4
1035008.06.53494.02641.0229.3222.454.269.8
2025007.66.43465.02537.0230.5222.257.672.8
2030007.67.43912.02301.0234.5212.456.971.1
2035008.06.74332.02212.0246.8216.357.270.9
5025007.56.42224.01961.0198.1173.173.683.9
5030007.47.12059.02371.0199.3167.970.980.2
5035008.06.62348.02547.0221.9186.368.881.1
10025006.96.61024.01498.078.471.795.096.7
10030007.15.5978.31303.087.883.694.696.7
10035007.06.61423.01458.0102.688.492.095.6
Table 9. Comparison of percentage proportions of inclusions removed through the surface and torn down into individual nozzles of casting strands for the variants with M1 and M2 and considering the distribution of inclusions of all sizes and densities as shown in Table 4 and Table 5.
CS1CS2CS3CS4CS5Removal Efficiency of Inclusions trough the Surface
M17.467.4810.708.359.2056.80
M23.985.117.626.315.3271.66

