Abstract
Molten pool uniformity is a prerequisite for wire and arc additive manufacture to achieve a uniform surface appearance. The thermal boundary is a key indicator to evaluate the thermodynamic state of the molten pool. This paper focuses on thermal analysis through finite element simulation and characterizes the thermal evolution of a molten pool during bottom-up deposition. The peak temperature of the substrate plate increases from 375.7 °C to 623.1 °C when peak current increases from 120 A to 180 A. The temperature gradient decreases from 40 °C/mm to 30 °C/mm. Weld speed increases from 0.15 m/min to 0.25 m/min; the temperature gradient is kept at about 30 °C/mm. Dimensionless thermal conductivity, Ge number, is proposed and defined as the criteria to estimate layer size variation. For Ip = 140 A, the average value of the Ge number is 87.7, and it shows the best numerical stability. Dimensionless thermal conductivity, Ge, is proposed and defined as the criteria to estimate the occurrence of layer size variation. Prolonging heating time and increasing cycle frequency, Ge number shows favorable stability during bottom-up deposition. The experimental results are consistent with analytical conclusions, which proves the validity of the Ge number as an indicator of deposition stability.
1. Introduction
Wire and arc additive manufacturing (WAAM) has attracted attention for its advantages: high-speed deposition rate, low equipment cost, good material utilization and an open-architecture system, which make it convenient to produce large-scale metal components. Like other 3D additive manufacture processes, the basic principle for WAAM to produce the physical part is its “differential–integral” methodology. Compared with laser and electronic beam additive manufacturing, a free electric arc provides a more efficient heat source [1], which is of benefit from an energy consumption perspective, especial for high-reflectance and poor-laser-coupling-efficiency metals, such as aluminum, copper [2] and magnesium [3]. However, high heat efficiency and deposition rate usually cause poor molten pool uniformity and poor finished appearance. That is, temperature, the flow regime and the size of the molten pool vary because of heat accumulation during the layer deposition process, so the finished appearance is different after molten pool solidification [4]. The nature of shape control for the directed energy deposition process is to maintain thermodynamic and kinetic process consistency, but that is in contradiction to the time-varying thermal boundary condition of the molten pool. During weld gun moves back and forth, heat accumulation and heat dissipation codetermine the thermophysical state of the molten pool, which varies with the deposited part “growing tall”. Especially for dozens of bottom layers, the heat sink of the substrate has a strong effect on molten pool heat dissipation, which is difficult to reconcile to achieve consistent weld width and weld height.
One may notice that heat accumulation and dissipation reconciliation has become a consensus for WAAM shape control during the bottom-up deposition process. In the published paper [5], a preheating and interpass temperature control strategy was proposed, experimentally and theoretically, and the strategy was demonstrated to be effective to eliminate or reduce the layer size difference. Heat transfer design and optimization determine the finished part’s appearance when the heat input is constant [6]. Wang et al. demonstrated that the distance between the trailing end and the center of the molten pool increased by 1.95 mm from the first layer to the fifth layer owing to heat accumulation [7]. Lee [8] investigated the transient behavior of a cold metal transfer (CMT) arc and further applied it to the heat source of the numerical model. It can reduce the heat accumulation effect on the molten pool and is beneficial for molten pool size consistency. This shows that complex thermal behavior plays an import role in the geometrical formation of the weld pool, especially for arc-based deposition with high heat input, where the thermal boundaries of the molten pool change more dramatically [9]. Ding [10] proposed a 3D thermoelastic–plastic transient model and a model based on an advanced steady-state thermal analysis was employed. Denlinger [11] pointed out that dwell time has a relation to distortion and residual stress, which implies the temperature distribution pattern is closely related to the dwell time design. Interpass temperature and dwell time design have proven to be effective to maintain the stable thermodynamic characteristics of the molten pool without reducing the heat input or wire feed speed [12].
Considering the efficiency, Li et al. [13,14] designed an in-situ assistance cooling method with a thermoelectric cooling device to help to establish a similar thermal boundary condition at the substrate and expected the thermal boundary could be kept after multilayer deposition. By use of this method, the interpass dwell time was reduced by 60.9%. In any case, temperature control methods, such as prolonged dwell time, in-situ assistance cooling, forced cooling, heat input regulation, etc., are designed to reduce the impact of heat accumulation and poor heat dissipation after multi-layer deposition. The aim of these methods is just to establish similar thermal boundary conditions in the molten pool and obtain uniform molten pool geometry. This codetermines the thermodynamic process consistency for layer deposition, which is a necessary condition for uniform layer appearance.
However, this uniformity is difficult to establish because of the nonlinear heat accumulation and the resulting time-varying thermal boundary conditions. Therefore, the authors propose that shape control of WAAM should be conducted based on the uniform thermal boundary. The travelling temperature profile, along with the molten pool, should not be seen just as a consequence of heat input; the thermodynamic state of the molten pool is the response to the heat input and thermal boundary condition. If the heat input is constant, the thermodynamic state of the molten pool only depends on the thermal boundary. In view of this, thermal analysis is often conducted to present the thermal boundary condition’s evolution by means of simulation [15,16,17,18,19], which could help to realize interpass temperature control and heat input regulation, and, finally, obtain a better finished appearance. However, response variables have not been brought forward so far to quantitative characterize thermal boundary conditions. Process parameter optimization is always in a one-to-many mapping relation, and process specification is unreliable.
One may notice that the above-mentioned control and regulation factors are strongly dependent on the researchers′ experience. That is, the controller and governing equation are insufficient to determine the uniform thermal boundary. The authors think that the thermal boundary of the molten pool is strongly determined by heat input and heat dissipation, and the governing method is just to coordinate their relation. The fusion zone is a physical boundary of the molten pool, from which heat flow to the environment and the time-varied heat dissipation condition will react to the thermodynamic state of the molten pool. Thus, the thermophysical state of the fusion zone reflects the coordination between heat input and dissipation. In this paper, the temperature gradient of the fusion zone is selected to characterize the thermal boundary features, and its evolution is used to illustrate the thermal boundary variation. A non-dimensional heat conductivity coefficient, Ge number, is proposed to quantificationally characterize the thermal boundary condition uniformity, and the spatial derivative of Ge number is proposed as the governing equation to regulate heat input and dissipation, so as to achieve a uniform thermal boundary—that is, a uniform surface appearance.
2. Experiments and Methods
2.1. Experimental Procedure
A GTAW welding machine (EWM, Tetrix 521 Synergic AC/DC, Mündersbach, Germany) was used as the weld power source in all experiments, with a matched wire feeder supplied to fulfill continuous material input. A numerical control machine tool with a four-axis gang control was used as a movement actuator. The GTAW torch was manipulated perpendicular to the substrate surface. The additive manufacturing process was carried out in an ambient atmosphere. The experimental set-up has been elaborated in the published paper [5]. Aluminum alloy wire (1.2 mm, 5A06) was used as the raw material; 5A06 aluminum alloy is widely used in ribbed slab structures for aircraft, rail traffic, sea vessels, automobiles and tank trucks. The chemical composition of the alloy is shown in Table 1. Three-factor and four-level single-factor experiments were designed to illustrate the effect of the main parameters—i.e., peak current, travel speed and wire feed speed—on the thermal boundary evolution of the molten pool. The peak current (Ip) was set to 120 A, 140 A, 160 A and 180 A. A rectangular pulse AC power mode was adopted, and the background current (Ib) was set to Ib = Ip − 50 A; the pulse frequency was 50 Hz and the duty cycle was 0.5. The same welding power settings, except peak current, facilitate the single-variable analysis between heat input and the thermal boundary. The wire feed speeds (vW) were 1.2 m/min, 2.0 m/min, 2.8 m/min and 3.6 m/min, which stand for the material input. The travel speed (vT) was 0.15 m/min, 0.20 m/min, 0.25 m/min and 0.30 m/min, which stands for the space allocation of energy and materials. The variance analysis of weld bead height and width shows heat input and travel speed are more significant to determine the molten pool size. Therefore, it can be speculated that they also have a significant impact on thermal boundary evolution of the molten pool.

Table 1.
Chemical composition of 5A06 aluminum alloy (wt%).
Variable design is shown in Table 2; the total deposited wall length was 300 mm and the height was 100 mm. In experiments 1–4, vw was set as the single variable. This group was designed to investigate the heat consumption for wire melting. In experiments 5–8, vT was set as the single variable. This group was designed to investigate the effect of heat and material allocation per unit length on thermal boundary of molten pool. In experiments 9–12, Ip was set as the single variable. This group was designed to investigate the effect of heat input on thermal boundary evolution. Every pass was deposited with the same direction. Before deposition, five passes of arc preheating were carried out along the deposition path, and the welding power parameters were the same as in the experimental process. In experiment 2, after 10 layers of deposition, the K-type thermocouple was implemented on the single wall, which was 10 mm from the base plate surface. Figure 1 schematically shows the test position. The experimental test was used to verify the simulation. To attach the thermocouple, a small hole with a 1-mm diameter was drilled after 10 layers of deposition, located at the top layer. A 1-mm-outer-diameter alumina ceramic tube was set at the end of thermocouple wire, making sure the wire end was exposed, then inserted into the small hole. During the subsequent layer of deposition, the small hole can be remelted, and the thermocouple wire can be in close contact with the body metal.
Table 2.
Variable design for thermal boundary investigation.
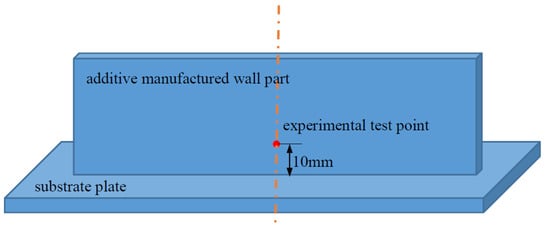
Figure 1.
Schematic drawing of the experimental test position.
2.2. FEM Model
ANSYS software (ANSYS 14.0, ANSYS Inc., Canonsburg, PA, USA) was used to simulate the temperature distribution during the bottom-up deposition process. Since the layer geometry has little effect on transient thermal analysis, the layer geometry was simplified as cuboid. The base plate size was L300 mm × W100 mm × H10 mm, and the deposited part size was L300 mm × W8 mm × H40 mm. Symmetry simplification was adopted to reduce the computing time. The mesh mapping method was used to generate the mesh, and the grid density along the deposition path was higher than at the far end, as shown in Figure 2. The X direction stands for the depositing direction, the Y direction is the thickness direction, and the Z direction is the width direction. A plane heat source was used as the depositing heat source model, the radius of which was 4 mm. The simulation was carried out based on the following assumptions:
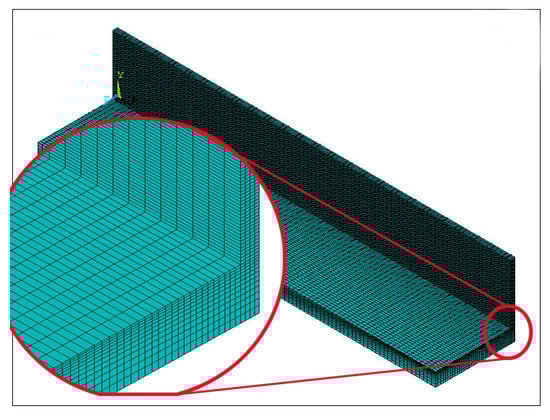
Figure 2.
Finite element mesh generation and local magnification.
- The initial temperature of base plate is 298 K, i.e., room temperature.
- Ignore the latent heat of solidification and heat convection in the molten pool; only consider heat conduction between the molten pool and its ambient environment.
- The arc energy density is subject to a Gaussian distribution.
- Ignore the heat transfer between the substrate and the worktable. Radiation and heat convection are taken into account by increasing the convection heat transfer coefficient.
- Ignore the heat accumulation located far away from the welding gun.
The additive manufacturing process was modeled based on the arc welding simulation method. The compiling procedure with APDL (ANSYS Parametric Design Language) of ANSYS was used to deal with the moving heat source. The heat flux radius of the Gaussian distribution was obtained through high-speed image acquisition, which was elaborated in a previous paper [20]. The bottom-up deposition process was simulated using the birth–death element method; associated with this, the heat transfer evolution was considered through the change in single wall area and the instantaneous heat transfer coefficient. The boundary conditions of molten pool are shown in the schematic map in Figure 3.
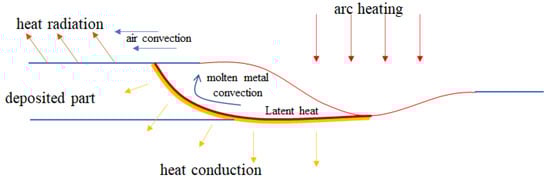
Figure 3.
Schematic illustration of the thermal boundary conditions of the molten pool.
To verify the numerical model, a K-type thermocouple was preplaced during experiment 2, located at the control line 10mm from the substrate surface. In Figure 4, after the welding gun moves away from the test point, the deposited part cools down naturally to the interpass temperature. The FEM peak temperature result is higher than the test result: this is because the FEM results are uniformly selected the mushy zone temperature of molten metal, but the test point is close to the solid–fluid interface and located at the solid side. The test point difference causes the data difference. One may notice that, after 2000 s deposition, the interpass temperature (i.e., basic temperature value in Figure 4) is in good agreement with the experimental test: this is because the temperature gradient becomes much smaller when the molten pool moves further away from the test point, and the temperature difference caused by the test point is not significant. This difference gradually becomes smaller, with the temperature of every part tending towards uniformity. After the welding gun travels away from the test point, the influence of strong arc heat source on the test results becomes smaller, and the FEM results gradually become consistent with experiments.
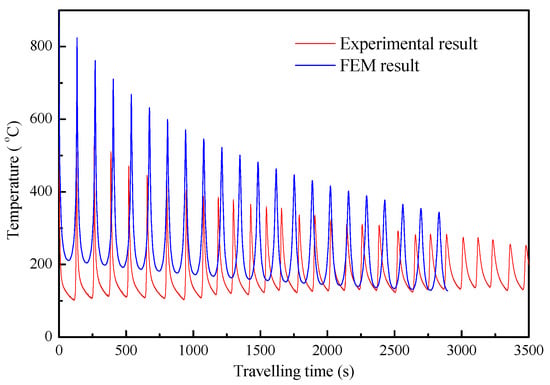
Figure 4.
Comparison of the finite element calculations with the experimental results.
3. Results and Discussion
3.1. Temperature Profile Evolution During First-Layer Deposition
The temperature distribution of the first layer when the weld gun travels to the midpoint is mapped to investigate the temperature evolution with different process parameters. Figure 5 shows the temperature profile variation with peak current, i.e., heat input.
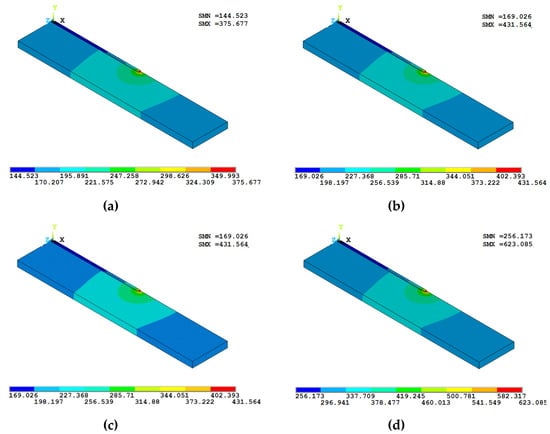
Figure 5.
Temperature distribution when the weld gun passes the midpoint of the first layer deposited at peak currents of (a) Ip = 120 A, (b) Ip = 140 A, (c) Ip = 160 A and (d) Ip = 180 A.
All temperature profile patterns are similar at the midpoint, but the temperature values at the same position are varied. For the substrate plate, the peak temperature increases from 375.7 °C to 623.1 °C, while the peak current increases from 120 A to 180 A. The heat input increase causes a covariant temperature value change, but the heat sink is the same, so it can be speculated that the temperature gradient around the molten pool will increase with increasing peak current during first-layer deposition. Welding speed is another variable to codetermine the heat input. Figure 6 shows the temperature profile variation with the welding speed increase.
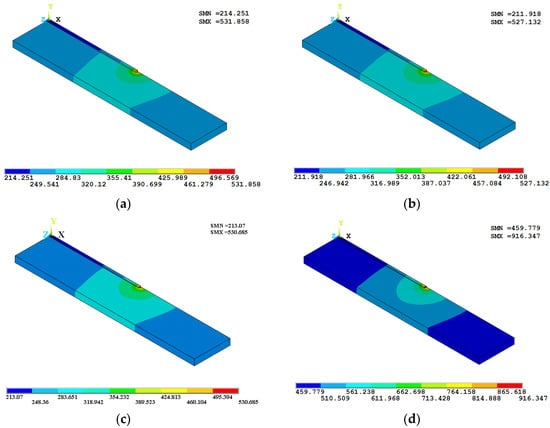
Figure 6.
Temperature distributions when the weld gun travels to the midpoint of the first layer with travel speed (a) vT = 0.15 m/min; (b) vT = 0.20 m/min; (c) vT = 0.25 m/min and (d) vT = 0.30 m/min.
The weld speed increases from 0.15 m/min to 0.25 m/min, the temperature profile patterns are similar when the weld gun travels to the midpoint, and the peak temperature changes slightly. Although the welding speed increases, and the linear weld energy decreases accordingly, the travel speed increase usually shortens the heating cycle. A faster heating frequency will raise the base plate temperature and decrease the heat flux so that that the molten pool flows to the as-deposited part, which can offset the heat input decrease so it presents a similar temperature pattern. The travel speed increases to 0.3 m/min, and high-frequency cyclic heating significantly raises the substrate temperature. This will widen the molten pool, as well as the layer width. Wire melting heat is a very small proportion of the total arc energy. Wire feed speed has a minor effect on the molten pool temperature and the temperature distribution.
The thermal boundaries of the molten pool include two main factors: temperature and its gradient. Based on the former analysis, temperature value may be a characteristic parameter to identify the deposition width: it is an indicator of layer size uniformity. Temperature gradient may be an indicator of the thermal stability of the molten pool, which indicates the heat flux of heat flows from the molten pool to the deposited part and its environment. This implies difficulty maintaining thermal stability. The temperature gradient across the molten zone is drawn from the temperature profile, as shown in Figure 7. The boundary values of the gradient are the solidus (580 °C) and liquidus (650 °C) temperatures of the 5A06 aluminum alloy, so the gradient only depends on the mushy zone width.
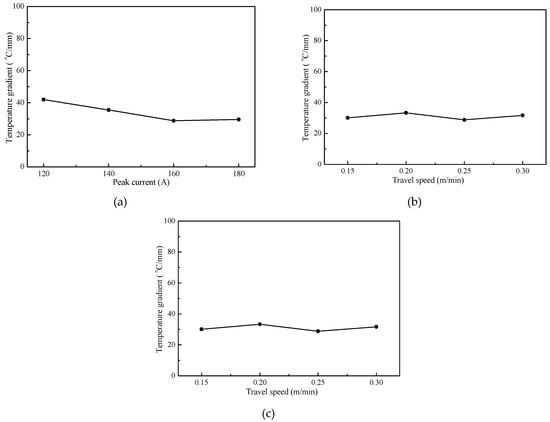
Figure 7.
Temperature gradient across the fusion zone changes with (a) peak current, (b) travel speed and (c) wire feed speed, while the weld gun travels to the first layer midpoint.
After five passes of arc preheating, the temperature gradients are all below 40 °C/mm, and the deposited first layer has a good finished appearance. This conclusion is in good agreement with the proposed analytical model in the published paper [5]. The analytical model shows that with a temperature gradient lower than 50 °C/mm the layer’s appearance will change from undulated to smooth under the given heat sink condition. However, the layer size uniformity becomes poor for a molten metal temperature rise, and its gradient across the fusion zone decreases during subsequent deposition. This means that the thermodynamic state of the molten pool does not achieve a stable state. The stable state is codetermined by heat input and heat dissipation. In Figure 7a, the peak current increases from 120 A to 180 A, the temperature gradient decreases from 40 °C/mm to 30 °C/mm, the thermal resistance around the molten pool increases, and the heat flow from the molten pool to the deposited part decreases. This demonstrates that increased heat input can help to establish a stable thermodynamic state and promote layer size uniformity during bottom-up deposition. In Figure 7b,c, the temperature gradient is kept to about 30 °C/mm and changes slightly. For one or a few layers of deposition, the welding current is a significant variable to determine the thermodynamic state under the same heat sink conditions. The significance of the travel speed increases after more layers of deposition for the high-heat cycle. The following section will be a detailed discussion of the thermal boundary evolution of multi-layer deposition.
3.2. Temperature Profile Evolution During Multi-Layer Deposition
With single-wall deposition, heat dissipation becomes difficult because the heat transfer section decreases, and the heat efficiency becomes lower with arc heating on the top of the wall. The heat efficiency was revised to 0.4 after a temperature comparison between the experimental and FEM results. For arc-based additive manufacturing, arc heat is abundant, and a base plate temperature rise is irreversible. Process parameters just determine the heat history to achieve the final stable thermodynamic state. The final state is mainly determined by the heat input and the initial conditions, such as material, structure, size, and so on.
Figure 8 shows the temperature profile evolution when the weld gun travels to the midpoint during the 10th, 20th, 30th and 40th layers of deposition. With the wall height increase, the large radiant area increases heat dissipation through convection and radiation, so the temperature at the arc striking position becomes lower. For the 20th layer of deposition, the interpass temperatures are notably lower. Interpass temperatures tend to be the same during the following depositions.
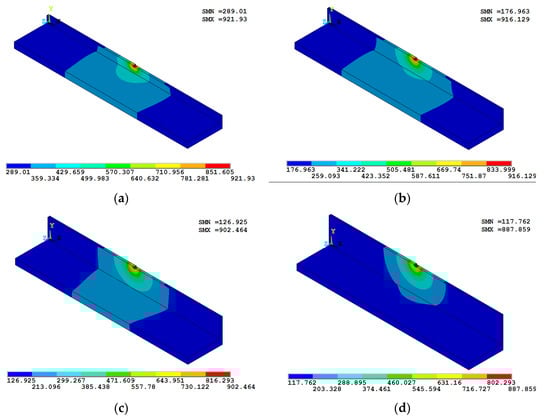
Figure 8.
Temperature profile of (a) 10th layer, (b) 20th layer, (c) 30th layer and (d) 40th layer when the weld gun travels to each layer midpoint.
In Figure 8a,b, the temperatures of the wall part end show tiny differences, and the temperature difference in the molten pool is just 14.6 °C. Local temperature profiles near the molten pool are similar. This indicates that the molten pool gradually establishes a steady state after 20 layers of cyclic heating. In the transitory stage, substrate heat sink has strong effect on molten pool heat transfer, so a higher heat input helps to establish this steady state. The temperature gradient around the molten pool decreases with the wall part growing tall, as shown in Figure 8d, which indicates that the thermal boundaries of the molten pool tend to become stable when the overall temperature gets higher.
The temperature gradient across the fusion zone when the weld gun travels to the midpoint of the 10th, 20th, 30th and 40th layers is shown in Figure 9.
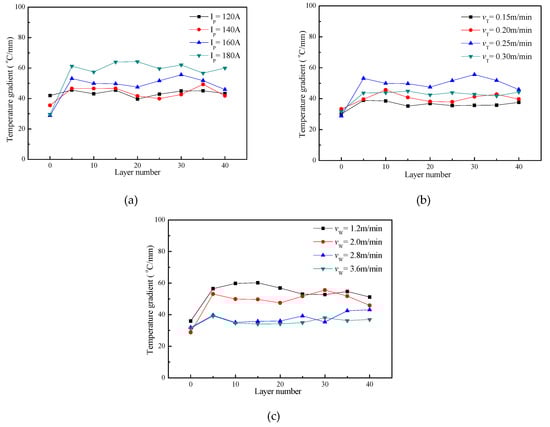
Figure 9.
Temperature gradient variation with layer numbers under different (a) peak currents, (b) travel speeds and (c) wire feed speeds.
Figure 9a shows the gradient variation with peak current, Figure 9b shows the gradient variation with travel speed and Figure 9c shows the gradient variation with wire feed speed.
With arc preheating, the temperature gradient across the fusion zone becomes stable after 10 layers of deposition. This indicates that heat balance is established between heat input and heat dissipation after several deposition cycles. The layer appearance uniformity only depends on whether the gradient can be maintained constant. In Figure 9a, the peak current increases from 120 A to 180 A, and the temperature gradient value increases from 40 °C/mm to 60 °C/mm. Higher values are more sensitive to process parameters, and a higher gradient needs a long heating cycle to achieve final stability. Thus, it is difficult to present a uniform layer appearance during the initial five layers of deposition because of severe changes in the temperature gradient.
After 10 layers, the deposition process becomes stable, but increased travel speed has a contradictory effect on temperature distribution, which is dominated by heat input and the heating cycle. As travel speed increases from 0.15 m/min to 0.30 m/min, temperature gradient increases to 50 °C/mm first, then decreases to 42 °C/mm, as shown in Figure 9b, which shows that a lower gradient usually has minor value fluctuations.
In Figure 9c, increased wire feed speed can reduce the temperature gradient, so it can be used to coordinate heat input and heat dissipation to decrease the molten pool temperature gradient after the deposition process becomes stable.
3.3. Mapping Relation Between Thermal Boundary and Appearance Finish
Temperature profile analysis of the first layer and multiple layers shows that the temperature value and its gradient across the fusion zone can be used as indicators to assess the deposition system stability. The temperature gradient value implies layer size uniformity, and its fluctuation implies the steady state is easy to keep. Therefore, dimensionless thermal conductivity, Ge number, was proposed and defined as the criteria to estimate the occurrence of layer size variation, which is similar to the dimensionless thermal resistance Biot Number.
α is the coefficient of heat transfer from the molten metal to the solid metal; h is heat transfer to the prior layer through the molten zone; λ is the thermal conductivity of the solid metal. Ge is the heat transfer capacity from the molten metal to the deposited part. When the thermal boundary conditions vary, such as heat accumulation, forced cooling, and so on, the heat transfer ability will change accordingly. If effective heat input cannot transfer to the deposited solid part continuously, more heat will be kept in storage. The redundant heat only can be used to elevate the molten pool temperature and melt the solid wall of the molten pool, which will result in the molten pool enlarging, alongside the layer size. Considering the short-range flow in molten pool and arc heating on the molten pool surface, the effect of the surface flow on heat transfer variation can be neglected, so the thermal resistance of the molten metal is approximate to the solid metal at melting point temperature. As a result, the heat transfer ability can be simplified and expressed as the ratio of heat conductivity on both sides of fusion zone.
λ(h) is the heat conductivity of the solid metal at the characteristic length, i.e., layer height. λ(Tm) is the heat conductivity of the molten metal in the molten pool. A laser thermal conductivity testing instrument was used for the heat conductivity test, and the test results are shown in Table 3.
Table 3.
Thermal conductivities of 5A06 aluminum alloy at different temperatures.
When the Ge number equals 100, the thermodynamic state of the molten pool tends to achieve the ideal stable state, and the local temperature of the molten pool reaches the allowed highest value for the given thermal boundary condition. That is, as the Ge value approaches 100, the deposition process becomes much more stable, and so does the uniformity of the layer appearance. However, if the thermal boundary condition varies, the system thermodynamic state will develop into another one, and Ge number will change accordingly. The fluctuation implies whether the state is easily kept. The following shows the Ge number variation with layer number under different process parameters. Figure 10 shows the Ge number variation with layers deposited with different peak currents IP and the as-deposited wall parts’ appearance.
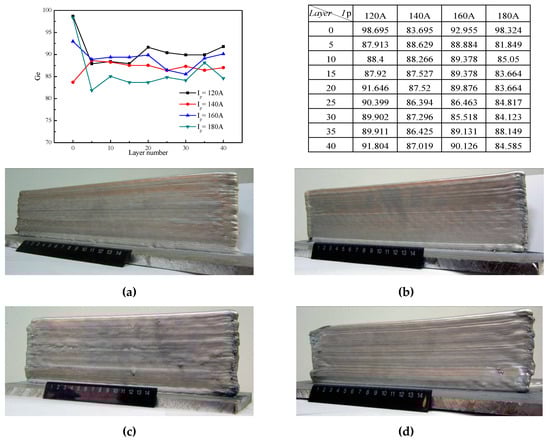
Figure 10.
Ge number variation with layers deposited with different peak currents IP and the as-deposited wall part. (a) Ip = 120 A; (b) Ip = 140 A; (c) Ip = 160 A and (d) Ip = 180 A.
After five layers, the deposition process gradually becomes stable and the Ge number does not show a drastic change. For Ip = 140 A, the average value of the Ge number is 87.7, and it shows the best numerical stability. Figure 10b shows the best wall surface appearance. In deposition with Ip = 160 A, the Ge number had a data mutation in between the 20 and 30 layers of deposition, so uneven wall surfaces are visible in Figure 10c. The experimental results are consistent with analytical conclusions, which proves the validity of the Ge number as the indicator of deposition stability.
The travel speed indicates heat allocation along the deposition path. Under the given heat sink and heat input, rapid heating is in favor of thermal stabilization, as shown in Figure 11a, prolonging heating time and increasing cycle frequency; the Ge number shows favorable stability during bottom-up deposition. These methods are advisable to offset the temperature gradient decrease in the fusion zone and help to achieve stable deposition. Consider the increase in Ge number from the melting wire perspective; higher material input also helps to decrease the temperature gradient. That is, increased substrate temperature (interpass temperature) and decreased molten metal temperature work in favor of achieving stable deposition. Therefore, in Figure 11b, wire feed speed increases to 2.8 m/min and 3.6 m/min and the Ge number presents better data stability. With reduced wire feed speed, the thermal stability of the molten pool becomes much more sensitive to thermal boundary variation. The molten pool in the “cold state” (i.e., lower temperature) is beneficial to maintain stable deposition.
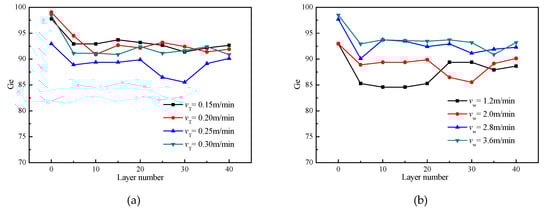
Figure 11.
Ge number variation when deposited with different (a) travel speeds vT and (b) wire feed speeds vw.
4. Conclusions
Undulated appearance is a constant problem for high-speed direct energy deposition. The difficulty is to harmonize the contradiction between the time-varied thermal boundary condition and the demand for the thermal uniformity of the molten pool. Therefore, this paper focuses on thermal analysis through FEM simulation and characterizes the thermal evolution of the molten pool during bottom-up deposition.
For the substrate plate, the peak temperature increases from 375.7 °C to 623.1 °C when the peak current increases from 120 A to 180 A. A heat input increase causes a covariant temperature value change. The temperature gradient decreases from 40 °C/mm to 30 °C/mm. The weld speed increases from 0.15 m/min to 0.25 m/min, and the temperature profile patterns are similar when the weld gun travels to the midpoint and peak temperature changes slightly. The temperature gradient is kept at about 30 °C/mm.
The molten pool temperature and temperature gradient across the fusion zone can be set as identifier variables to identify the thermal state of the molten pool. Dimensionless thermal conductivity, Ge number, was proposed and defined as the criteria to estimate the occurrence of layer size variation. For Ip = 140 A, the average value of the Ge number is 87.7, and it shows the best numerical stability. Prolonging heating time and increasing cycle frequency, Ge number shows favorable stability during bottom-up deposition. The experimental results are consistent with analytical conclusions, which proves the validity of Ge number as an indicator of deposition stability.
Author Contributions
Methodology, H.G. and J.L. (Jinglong Li); software, J.G.; validation, J.L. (Jian Luo); formal analysis, H.G. and X.L.; All authors have read and agreed to the published version of the manuscript.
Funding
This work was supported by the National Natural Science Foundation of China (Grant No. 51805088), the fund of the State Key Laboratory of Solidification Processing in NWPU, (Grant No. SKLSP201914) and Fuzhou University Testing Fund of precious apparatus, (Grant No. 2019T010).
Conflicts of Interest
The authors declare no conflict of interest.
References
- Jackson, M.A.; van Asten, A.; Morrow, J.D.; Min, S.; Pfefferkorn, F.E. A comparison of energy consumption in wire-based and powder-based additive-subtractive manufacturing. Procedia Manuf. 2016, 5, 989–1005. [Google Scholar] [CrossRef]
- Gu, D.D.; Meiners, W.; Wissenbach, K.; Poprawe, R. Laser additive manufacturing of metallic components: Materials, processes and mechanisms. Int. Mater. Rev. 2012, 57, 133–164. [Google Scholar] [CrossRef]
- Guo, J.; Zhou, Y.; Liu, C.; Wu, Q.; Chen, X.; Lu, J. Wire arc additive manufacturing of AZ31 magnesium alloy: Grain refinement by adjusting pulse frequency. Material 2016, 9, 823–836. [Google Scholar] [CrossRef] [PubMed]
- Cunningham, C.R.; Flynn, J.M.; Shokrani, A.; Dhokia, V.; Newman, S.T. Invited review article: Strategies and processes for high quality wire arc additive manufacturing. Addit. Manuf. 2018, 22, 672–686. [Google Scholar] [CrossRef]
- Geng, H.B.; Li, J.L.; Xiong, J.T.; Lin, X. Optimization of interpass temperature and heat input for wire and arc additive manufacturing 5A06 aluminium alloy. Sci. Technol. Weld. Join. 2017, 22, 472–483. [Google Scholar] [CrossRef]
- Yadollahi, A.; Shamsaei, N.; Thompson, S.M.; Seely, D.W. Effects of process time interval and heat treatment on the mechanical and microstructural properties of direct laser deposited 316L stainless steel. Mat. Sci. Eng. A Struct. 2015, 644, 171–183. [Google Scholar] [CrossRef]
- Wang, J.F.; Sun, Q.J.; Wang, H.; Liu, J.P.; Feng, J.C. Effect of location on microstructure and mechanical properties of additive layer manufactured Inconel 625 using gas tungsten arc welding. Mater. Sci. Eng. A 2016, 676, 395–405. [Google Scholar] [CrossRef]
- Lee, S.H. CMT-based wire arc additive manufacturing using 316L stainless steel: Effect of heat accumulation on the multi-layer deposits. Metals 2020, 10, 278. [Google Scholar] [CrossRef]
- Wua, B.T.; Pana, Z.X.; Ding, D.H.; Cuiuria, D.; Li, H.J. Effects of heat accumulation on microstructure and mechanical properties of Ti6Al4V alloy deposited by wire arc additive manufacturing. Addit. Manuf. 2018, 23, 151–160. [Google Scholar] [CrossRef]
- Ding, J.; Colegrove, P.; Mehnen, J.; Ganguly, S.; Almeida, P.M.S.; Ganguly, S.; Almeida, P.M.S.; Wang, F.; Williams, S. Thermomechanical analysis of Wire and Arc Additive Layer Manufacturing process on large multi-layer parts. Comput. Mater. Sci. 2011, 50, 3315–3322. [Google Scholar]
- Denlinger, E.R.; Heigel, J.C.; Michaleris, P.; Palmer, T.A. Effect of inter-layer dwell time on distortion and residual stress in additive manufacturing of titanium and nickel alloys. J. Mater. Process. Technol. 2015, 215, 123–131. [Google Scholar] [CrossRef]
- Wu, B.; Pan, Z.; Ding, D.; Cuiuri, D.; Li, H.; Xu, J.; Norrish, J. A review of the wire arc additive manufacturing of metals: Properties, defects and quality improvement. J. Mater. Process. Technol. 2018, 35, 127–139. [Google Scholar] [CrossRef]
- Li, F.; Chen, S.J.; Shi, J.B.; Zhao, Y.; Tian, H.Y. Thermoelectric cooling-aided bead geometry regulation in wire and arc-based additive manufacturing of thin-walled structures. Appl. Sci. 2018, 8, 207. [Google Scholar]
- Shi, J.; Li, F.; Chen, S.; Zhao, Y.; Tian, H. Effect of in-process active cooling on forming quality and efficiency of tandem GMAW–based additive manufacturing. Int. J. Adv. Manuf. Technol. 2019, 101, 1349–1356. [Google Scholar] [CrossRef]
- Hejripour, F.; Binesh, F.; Hebel, M.; Aidun, D.K. Thermal modeling and characterization of wire arc additive manufactured duplex stainless steel. J. Mater. Process. Tech. 2019, 272, 58–71. [Google Scholar] [CrossRef]
- Lavery, N.P.; Brown, S.; Sienz, J.; Cherry, J.; Belblidia, F. A review of Computational Modelling of Additive Layer Manufacturing-multi-scale and multi-physics. In Proceedings of the International Conference on Sustainable Design and Manufacturing, SDM 2014, Cardiff, Wales, UK, 28–30 April 2014. [Google Scholar] [CrossRef]
- Romano, J.; Ladani, L.; Sadowski, M. Thermal Modeling of Laser Based Additive Manufacturing Processes within Common Materials. Procedia Manuf. 2015, 1, 238–250. [Google Scholar] [CrossRef]
- Kundakcioglu, E.; Lazoglu, I.; Rawal, S. Transient thermal modeling of laser-based additive manufacturing for 3D freeform structures. Int. J. Adv. Manuf. Technol. 2016, 85, 493–501. [Google Scholar] [CrossRef]
- Froend, M.; Ventzke, V.; Kashaev, N.; Klusemann, B.; Enz, J. Thermal analysis of wire-based direct energy deposition of Al-Mg using different laser irradiances. Addit. Manuf. 2019, 29, 100800. [Google Scholar] [CrossRef]
- Geng, H.B.; Li, J.L.; Xiong, J.T.; Lin, X.; Zhang, F. Optimization of wire feed for GTAW based additive manufacturing. J. Mater. Process. Technol. 2017, 243, 40–47. [Google Scholar] [CrossRef]
© 2020 by the authors. Licensee MDPI, Basel, Switzerland. This article is an open access article distributed under the terms and conditions of the Creative Commons Attribution (CC BY) license (http://creativecommons.org/licenses/by/4.0/).