Abstract
Herein, a uniform aluminum alloy foam was fabricated by the addition of TiH2 as a blowing agent to Al-6.4 mass % Si in the semi-solid state and subsequent solidification. This was aimed at propounding the stabilization mechanism of the proposed foaming process. The microscopic images, which were the cross section on the center of the foam etched with Weck’s reagent, showed the primary crystals in the semi-solid state and solidifying segregation surrounding the crystals. Thus, it became evident that the area ratio of primary crystals in the semi-solid state approximately equals to the set solid fraction. According to the percolation theory for the cell wall model, the drainage in the cell walls with primary crystals above the percolation threshold was found to be inhibited. By considering that each cell wall is a flow path of the foam, the percentage of the cell walls with inhibited drainage to all the other cell walls was observed to exceed the percolation threshold of the lattice model (0.33) as per the percolation theory. Therefore, it can be concluded that the primary crystals inhibit drainage in some cell walls, ensuring that the stability of the foam is maintained.
1. Introduction
In recent years, the transportation equipment industry has required lighter and more durable materials to reduce the environmental burden [1]. Metal foam has attracted significant attention in recent years because its lightweight and high shock-absorbing ability render it suitable for the aforementioned requirement. In addition, metal foam has other unique properties such as sound absorption and heat dissipation. These properties are exhibited by the structures of metal foams with closed cells [2].
Fabrication of metal foams via a melt route has commonly been adopted. In this method, gas released from a blowing agent by thermal decomposition forms bubbles in the molten melt. A metal foam is then fabricated by solidifying the foamy molten metal. During the foaming process, the cell walls, which are located between the bubbles, are occasionally thinned down by the force of the drainage of the melt and finally rupture. Thus, in a metal foam, there are irregularly shaped coarse pores that appear to have been formed by the coalescence of several pores. If the pores become coarse by cell wall ruptures, metal foams cannot offer the desired properties.
Until now, a few studies have reported stabilization mechanisms which are necessary to inhibit the rupturing of the cell walls. Several studies had proposed that the oxidation of alloy melts helps the stabilization of cell walls [3,4]. The stabilization mechanisms of nanoporous foam have been studied not only in the metal foam field, but also in the chemical foam field. It has been reported that the stability of cell walls will be improved from the effect of added particles, which are also added in most of the metal foams, caused by the capillary pressure of small pores [5]. In addition, inhibiting the drainage is equally important for the stabilization of cell walls. The drainage is a phenomenon in which the alloy melts in the cell walls flow down by gravity. It is well-known that the thickening of alloy melts with particles is effective in order to inhibit the drainage [6].
Calcium or magnesium is generally added to the melt heretofore as a thickener to inhibit drainage and enhance the melt viscosity [7,8]. According to a previous study, to stabilize the cell walls, the particle size of the thickener should preferably be in the range of 1 to 20 μm; this is because the larger-sized particles settings are too severe [9]. The volume fraction of the particles in metal foams should be in the range of 5–15% [9]. As long as a thickener satisfies these conditions, metal foams will be fabricated stably. However, the problem is that the thickeners do not contain desirable alloying elements.
The semi-solid route, which was suggested by Hanahusa, can solve this problem. In this method, primary crystals are used as the thickener. Because these crystals have the same elements as the alloy, they do not become impurities [10]. In addition, the metal foams fabricated by the semi-solid route have a higher shock-absorbing efficiency [11].
Moreover, in situ X-ray observation of the foaming process revealed that the semi-solid route can maintain bubbles for a long time compared to that observed for the melt route [12]. Therefore, the semi-solid route, which uses the primary crystals that are approximately 200 μm in size, is a more stable method than the melt route; however, a previous study has reported that the sizes of the primary crystals are larger than the preferred range [13]. The effect on the cell wall may change because the size of the thickener is different. Hence, the semi-solid route can have its own stabilization mechanisms that are slightly different than those observed in the melt route.
Our group has previously investigated the stabilization mechanisms that occur in a single cell wall during the semi-solid route using a single-metal film demonstration. The primary crystals were observed to have clogged at the lower part of the cell wall and thus appeared to be inhibiting the drainage in the demonstration [14]. This clogging effect in one cell wall is the key to the stabilization mechanism of the semi-solid route; however, the mode of operation of the clogging effect on all the cell walls in actual metal foams has not been considered thus far.
If the clogging effect does occur in actual metal foams, the effect does not always work on all cell walls. The key question here is why a cell wall without primary crystals exhibits stability. Furthermore, the necessary fraction of primary crystals has not been indicated even if the clogging effect works properly on one cell wall. In addition, the quantity of “clogged cell walls” needed for stabilization of metal foams is not known. Meanwhile, it is known that the flow is inhibited even if it is not completely blocked by obstacles. This can be explained by the percolation theory, which enables us to investigate the effect of primary crystals on the metal foams.
This paper thus aims to suggest the stabilization mechanism of aluminum alloy foam in the semi-solid route that employs primary crystals. To accomplish this, an aluminum alloy foam was fabricated with the semi-solid route; subsequently, the primary crystals inside the metal foam were observed. In addition, the length ratio of the primary crystals was measured along the lines of the percolation theory.
2. Materials and Methods
2.1. Materials
Figure 1 shows a schematic illustration of the casting process of a master alloy. High-purity aluminum ingots and Al-25.3 wt. % Si ingots (Table 1) were weighed and set together in a crucible so that the silicon content was 6.4 wt. %. The ingots were heated in an electronic furnace in air at 800 °C. The melt was stirred by rotating an impeller at 8.3 s−1 for 160 s. After stirring, the melt was left to stand for 480 s and was sand-cast in a mold (ϕ 30 mm × 315 mm in length). The cast material was used as the master alloy.
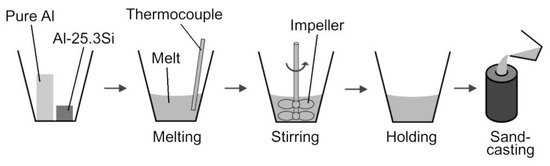
Figure 1.
Scheme of the casting process for the master alloy.

Table 1.
Chemical composition of raw materials (wt.%).
2.2. Foaming Process
Figure 2 shows a schematic illustration of the fabrication process of an aluminum alloy foam with the semi-solid route. First, 70 g of the master aluminum alloy was weighed out and put into a stainless steel crucible coated with Al2O3 and boron nitride. The master aluminum alloy was heated up to the temperature of 800 °C, measured with a type-K thermocouple, and completely melted in the electronic furnace in air. A type-K thermocouple in a protective alumina tube measured the temperature of the melt with a measurement error of several degrees. The power output of a heater was controlled with a proportional–integral–derivative (PID) controller, which used the feedback of the furnace temperature measured by another type-K thermocouple. To solidify the primary crystals, the melt was slowly cooled until the semi-solid slurry temperature became 615 °C to set the solid fraction at 12%, in accordance with the Al-Si binary phase diagram [15]. After the temperature became stable at 615 °C, TiH2 wrapped in an aluminum foil (100 × 100 mm2) was added into the semi-solid slurry so that the content of TiH2 became 1 mass % of the alloy. TiH2 was dry-treated at 150 °C for 24 h previously. To disperse the TiH2 and grain the primary crystals, the semi-solid slurry was stirred with a rotating impeller at a speed of 15 s−1 for 100 s after removing the thermocouple from the slurry. The impeller was drawn up immediately after stirring. The slurry was kept at the set temperature for 200 s for sufficient foaming. Finally, the aluminum alloy foam was cooled down with water and solidified.
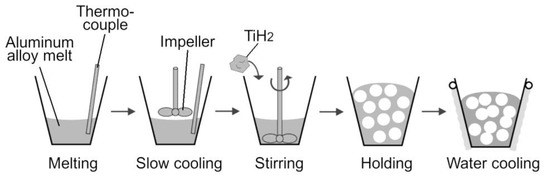
Figure 2.
Scheme of the foaming process.
2.3. Evaluation of Pore Structure
The densities of the as-cast (non-porous) Al-6.4 mass % Si ρnp and the aluminum alloy foam ρp were measured by Archimedes’ principle. The porosity P and pore distribution were evaluated quantitatively. The P of the aluminum alloy foam was evaluated using Equation (1):
After measuring P, the aluminum alloy foam was cut in half through the center. The only half specimen was cut into six specimens. The cross section was observed and divided into measurement windows that were 0.5 mm in height. In addition, the parts where the pore areas spread out of the specimen were eliminated from the measurement window. The sum of the areas of these parts was regarded as the area of the metallic part Am in a measurement window. To evaluate the pore structures, the binarized cross-sectional images of the measurement windows were constructed by setting an appropriate threshold to separate the pores from the other parts. In each measurement window, the area of each pore Ap, the area of the measurement window A, and each pore perimeter Lp were measured using the image analysis software WinROOFTM 6.4.0 (Mitani Corp., Fukui, Japan). In addition, the pore area ratio in each measurement window was calculated by dividing the sum of all the pore areas (ΣAp) by the parameter A as shown in Figure 3.
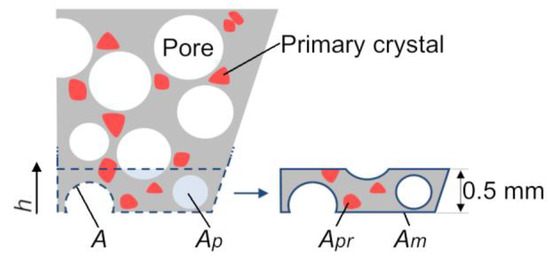
Figure 3.
Schematic illustration showing measurement of parameters for pores and primary crystals. A is the area of the measurement window. Ap is the area of the pores. Apr is the area of the primary crystals. Am is the area of the metallic parts.
Each equivalent pore diameter dp was calculated with Equation (2), and the average equivalent pore diameter was calculated by dividing the sum of all the dp’s by the total number of pores in the measurement window.
The average pore circularity e was calculated with
where N is the total number of pores in the window, and i is the serial number of a pore. The distributions of these pore parameters, ΣAp/A, , and e, were plotted on graphs.
Furthermore, the cell walls were evaluated by Voronoi polyhedra analysis using the image analysis software ImageJ 1.53a (National Institutes of Health, Bethesda, MD, USA) to apply percolation theory. In this analysis, each pore was replaced with a Voronoi polyhedron.
2.4. Microstructural Observation
Each specimen from six cut parts mounted in resin was ground by waterproof abrasive papers, a diamond suspension with a satin polishing cloth, and colloidal silica with a suitable polishing cloth using a polishing machine (MECATECH 334, Presi, Tokyo, Japan). The colloidal silica included an etching agent. The polished surface was observed with an optical microscope (VHX-5000, Keyence, Miyagi, Japan). From the microscopic images, the grained crystals, which are approximately 200 μm in size, were defined as primary crystals and filled with red color. The area of each primary crystal Apr and the area of the metallic part Am were measured with WinROOFTM using the same process shown in the previous section. The area ratio of the primary crystals was calculated by dividing the sum of the area of the primary crystals ΣApr in the measurement window by the area of the master alloy Am, as shown in Figure 3. Each equivalent diameter of the primary crystal dpr was calculated by Equation (2), with the parameter Ap replaced by Apr. Furthermore, the length ratio of the primary crystals to the width of each cell wall, Pcw, was calculated by dividing the width of the cell wall L by the total length of the primary crystals Lpr as shown in Figure 4. The distributions of ΣApr/Am were plotted on a graph.
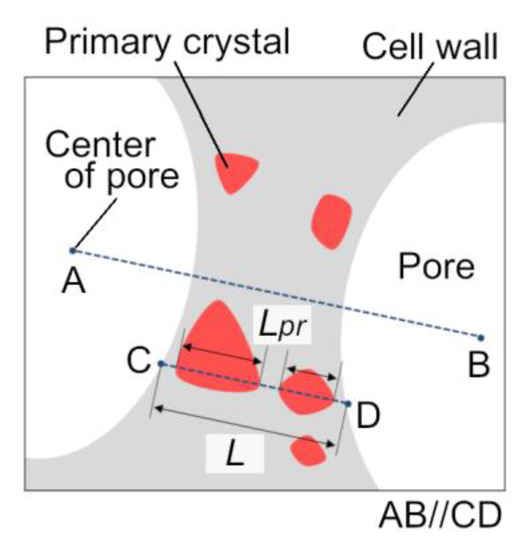
Figure 4.
Definitions of each measurement parameter. L is the width of the cell wall. Lpr is the length of the primary crystals.
The cross sections were also etched by Weck’s reagent by immersion for 48 s at room temperature [16]. Weck’s reagent was prepared by mixing 4 g KMnO4, 1 g NaOH, and 100 g distilled water. After the etching, the microstructures on the cross sections were observed with an optical microscope. Because it is difficult to observe all of the solidifying segregation in its entirety, only the sufficiently etched parts were observed. Here, the parts in the semi-solid state before growing are referred to as the original parts. The original area of each primary crystal in the semi-solid state Apr* was evaluated with WinROOFTM. The original equivalent diameter of each primary crystal, dpr*, was calculated using Equation (2) with the parameter Ap replaced by the parameter Apr*. The “grown” radius of each primary crystal, Δr, was calculated using Equation (4):
3. Results
3.1. Pore Distributions
The porosity P of the fabricated aluminum alloy foam was calculated to be 30.2% with a measured ρnp of 2.67 × 10³ kg/m3. Figure 5 shows the cross section of the aluminum alloy foam. Figure 6 shows the distribution of the pore area ratio ΣAp/A, average equivalent pore diameter , and average pore circularity e in the height direction for every 0.5 mm. The aluminum alloy foam was fabricated with a near-uniform pore structure through the semi-solid route.
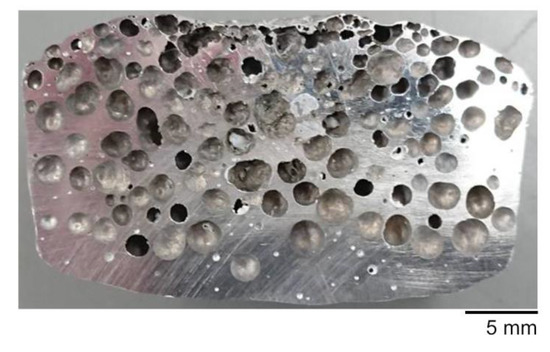
Figure 5.
Cross section of the center of the aluminum alloy foam.
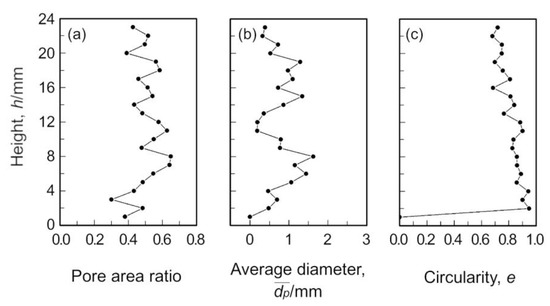
Figure 6.
Distributions of the pore properties. (a) Distribution of the pore area ratio ΣAp/A, (b) distribution of the average pore diameter , (c) distribution of the pore circularity e.
3.2. Microscopic Observation for the Primary Crystals
Figure 7a shows the microscopic image on the cross section of the aluminum alloy foam. It was confirmed that some primary crystals were present inside not only the plateau border, which is the connection point of the cell walls, but also the cell walls. Moreover, four types of crystal shapes were observed, as indicated in Figure 8a. One type was completely grained primary crystals, indicated by the first arrow. These crystals were filled with red in Figure 7b. The second type was conjoined grained crystals, indicated by the second arrow. The other two types were dendrite crystals, indicated by the third and the fourth arrows. The third arrow indicates the dendrite crystals grown from grained crystals. The fourth arrow indicates the dendrite crystals that are not conjoined to grained crystals. Figure 9 shows the area ratio of the primary crystals in the height direction for every 0.5 mm. The average area fraction of the primary crystals was 27%. This value, including some primary crystals grown during the water cooling process, is two times higher than the set solid fraction of 12% at 615 °C [15].
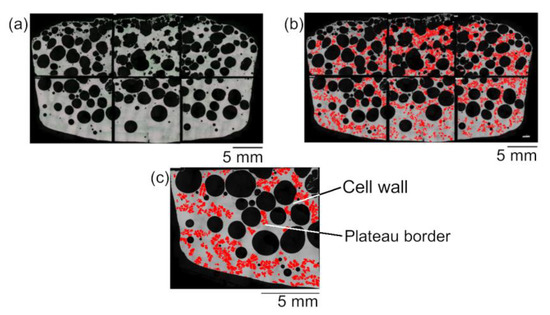
Figure 7.
Microscopic images of cross section of the aluminum alloy foam. (a) Original images of six specimens, (b) processed image after filling primary crystals with red, and (c) the magnified view of the lower-left part in (b).
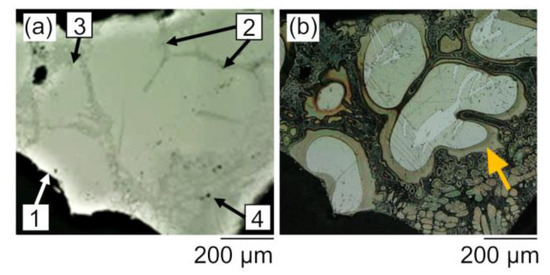
Figure 8.
Close-up microscopic image of a cell wall. (a) Four types of primary crystals are indicated by the arrows. The first arrow indicates a grained primary crystal. The second arrow indicates a conjoined grain primary crystal. The third arrow indicates a dendrite crystal grown from a grained primary crystal. The fourth arrow indicates dendrite crystals existing alone. (b) Microstructure after etching by Weck’s reagent. The yellow arrow indicates the segregation part during water cooling process.
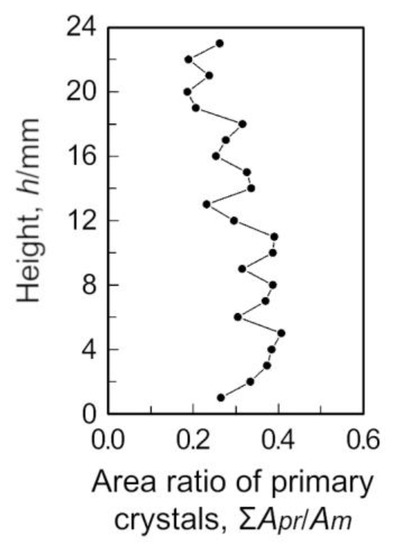
Figure 9.
Distribution of the area ratio of the primary crystals, ΣApr/Am.
4. Discussion
4.1. The Original Size of the Primary Crystals in Semi-Solid State
Stirring the semi-solid slurry converted the primary crystals to grained crystals. However, some of the observed crystals had dendrites. Therefore, the primary crystals must have grown during the water cooling process. As our focus is on the stabilization mechanism during the foaming process, the original size of the primary crystals in the semi-solid state has to be measured to discuss this mechanism quantitatively.
Figure 8b shows the microscopic image after etching by Weck’s reagent. A yellow arrow indicates the segregated part in solidifying surrounding white-grained crystals, which are determined to be the original primary crystals. The structure that appeared as one crystal before etching had two crystals surrounded by the segregated part after etching. Hence, it is clear that growth of primary crystals did in fact occur.
To discuss the stabilization mechanism during the foaming process, the original size of the primary crystals has to be calculated. The grown radius of each primary crystal Δr was plotted in Figure 10. It is evident that the Δr values were approximately equal irrespective of the size of the primary crystals before growth. This is why the growth rate slows down with increasing radius of the primary crystals. The average grown length was calculated by dividing the sum of all Δr’s by the number of primary crystals, and its value was approximately 31 μm. From the above, the original diameter of all the primary crystals on cross section dpr′ was calculated by subtracting 31 from each dpr. Furthermore, the average of the original diameter was calculated as 192 μm, which is still larger than the preferred range described in Introduction [9]. The original area of all the primary crystals Apr′ was calculated using Equation (5). The original area fraction of the primary crystals was calculated as 17% by dividing ΣApr′ by the parameter Am. This value approximately equals the set solid fraction of 12%. The subsequent discussions will be based on the original size of the primary crystals in the semi-solid state, that is, the solid fraction during the foaming process is considered to be 12%.
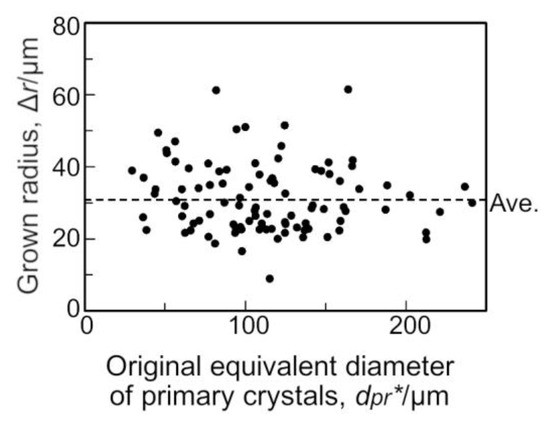
Figure 10.
“Grown radius” Δr, which is the increment of radius during cooling, for each original equivalent diameter of primary crystal, dpr*. The dotted horizontal line indicates the average grown length
4.2. Percolation Theory on Stabilization Mechanism
As mentioned in Introduction, percolation theory explains the phenomenon of flow inhibition despite the absence of complete blockage with obstacles. In this theory, the percolation probability is defined as the percentage of obstacles in a system. When the percolation probability exceeds the percolation threshold P′, the flow of the system is inhibited by the obstacles. The percolation threshold will change depending on the structure and dimensions of the system. Therefore, the required amount of obstacles required to inhibit the flow will also change.
We applied this theory to the stabilization mechanism of the aluminum alloy foam, which was regarded as a lattice structure consisting of cell walls as paths for the melt. First, the primary crystals were regarded as obstacles in each cell wall. Second, cell walls with a sufficient amount of primary crystals to exceed the percolation threshold were considered to have been clogged, and inhibited flows inside them. Third, those cell walls are regarded as obstacles in the lattice structure. Finally, if the percolation probability exceeds the percolation threshold, the flow of the lattice structure is inhibited. This means that drainage of the aluminum alloy foam is prevented by the primary crystals. In addition, the stabilization mechanism in three-dimensional aluminum alloy foam is discussed in the last section.
4.2.1. Percolation Theory for Cell Walls
First, the following discussion about percolation theory applied to cell walls is summarized in Figure 11. From microscopic observation, the cell walls can be grouped into three categories: those crossed by primary crystals, those having a narrow path through primary crystals, and those without any primary crystals. The cell walls in the first category are apparently clogged by crossed primary crystals according to percolation theory. However, it is not clear if the cell walls in the second and the third category are clogged by the primary crystals. Therefore, the percolation model for a flow was applied to the cell walls [17]. In this model, the percolation probability of the cell wall model is Pcw, as indicated in Section 2.4. The percolation threshold of this model, Pcw′, is approximately 0.581. Kuwahara et al. reported that the critical solid fraction fs_cr, which is the area fraction of the primary crystals required for inhibiting the drainage, is in the range 20–45%, and the expression was established [14]. The values of Pcw at all cell walls were compared with Pcw′, and cell walls with Pcw larger than Pcw′ (Pcw > Pcw′) were recognized as the aggregated parts. On the other hand, cell walls with Pcw smaller than Pcw′ were recognized as the non-aggregated parts. According to percolation theory, the aggregated parts are kept stable owing to the inhabitation of drainage by the clogging effect of the primary crystals.
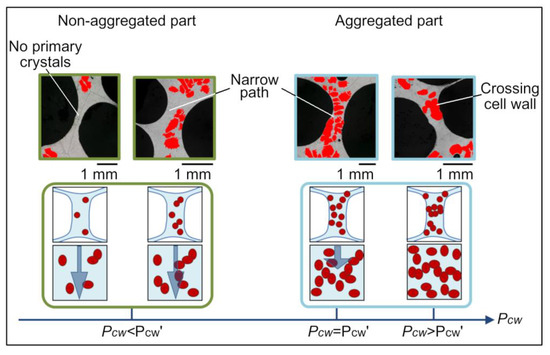
Figure 11.
Scheme showing percolation theory of stable cell walls. In the upper microscopic images, the primary crystals were filled with red color. Pcw is the percolation probability for the cell walls. Pcw′ is the percolation threshold of the cell wall model.
4.2.2. Percolation Theory for the Structure of the Foam
Figure 12 is a schematic depiction of the following discussion on percolation theory for the structure of the foam. In the previous section, it was revealed that the aggregated parts were kept stable by the primary crystals. However, the non-aggregated parts also remained stable, even if they did not have enough primary crystals inside. To clarify this point, percolation theory for a lattice structure was applied to the aluminum alloy foam.
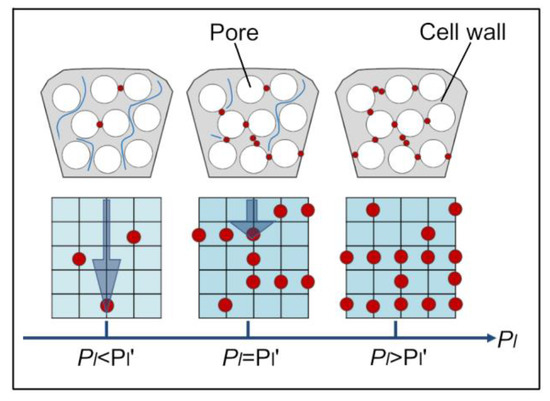
Figure 12.
Schematic illustration showing percolation theory of the lattice structure. Pl is the percolation probability for the lattice structure. Pl′ is the percolation threshold of the lattice structure. The red circles indicate the aggregated parts.
The aluminum alloy foam can be regarded as a simple lattice structure model consisting of cell walls. Each side of the lattice structure acts as a path. According to percolation theory for a lattice structure model, flow through the whole structure will be inhibited when enough sides of the lattice are clogged with obstacles. Here, the primary crystals can be regarded as the obstacles, and the cell walls can be regarded as the sides of the lattice. Therefore, calculation of the percentage of the aggregated parts will reveal why non-aggregated parts are retained. The percolation probability for this lattice model, Pl, can be calculated with
where Nc is the number of cell walls, and the n is the number of aggregated parts. The percolation threshold for the simple lattice structure model is calculated with
where z is the number of sides coming out from one vertex of the lattice. Because the cell walls correspond to the sides and the plateau border corresponds the vertex, the z is three. Therefore, the Pl′ is approximately 0.33 [18]. In this study, Pl was approximately estimated as 0.34 and larger than Pl′. In other words, non-aggregated parts remain stable because their drainage is inhibited by the existence of aggregated parts that exceed the percolation threshold. In sum, the aluminum alloy foam can be kept stable by the clogging effect of the primary crystals.
The points established thus far are shown in graphs. In Figure 13a, the number of cell walls with each percolation probability Pcw is shown. A dotted vertical line indicates the percolation threshold of the cell wall model Pcw′. Figure 13b shows the increasing cumulative percentage of cell walls with each value Pcw. The dotted horizontal line indicates the percolation threshold of the lattice structure Pl′. The percentage of cell walls with range 0.581 to 1.0 in Pcw is the percolation probability of the lattice structure Pl. From Figure 13b, it is clear that the point of Pl is located above the line of Pl′. Therefore, the aggregated parts help keep the aluminum alloy foam stable with the clogging effect at some cell walls.
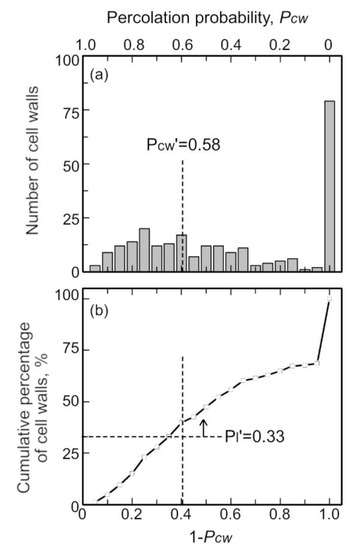
Figure 13.
Distribution of cell walls. (a) Number of cell walls, and (b) cumulative percentage of cell walls plotted against the percolation probability Pcw.
4.2.3. Discussion of Percolation Theory in Three Dimension
We have thus far discussed the stabilization mechanism based on only two-dimensional information. However, as the primary crystals and cell walls are in fact arranged in three dimensions, a three-dimensional perspective is needed. In addition, the percolation threshold for the lattice model varies with the number of dimensions. Therefore, a three-dimensional assessment and exact model for percolation theory are required. In this section, we examine whether the stabilization mechanism in the previous discussion is valid for three-dimensional models.
From quantitative microscopic analyses, the spherical diameter of the crystals can be calculated by easy estimation from the diameter of a circle. Hensler suggested that the spherical diameter of the crystals spr can be calculated using the following equation [19]:
The values spr for all primary crystals were calculated. The cross-sectional area of the cell wall viewed in the flow direction Acw′′ was calculated as follows: half of L was squared and multiplied by π. In addition, the cross-sectional area of the primary crystal Apr′′ was calculated using the same procedure. The values Pcw were recalculated by dividing Apr′′ by Acw′′. Cell walls with Pcw larger than Pcw′ can be redefined as the aggregated parts.
The percolation probability Pl was also recalculated as approximately 0.46. In the next step, Pl will be compared with the percolation threshold. However, the structure of the aluminum alloy foam is also three-dimensional. Therefore, the percolation threshold for a three-dimensional model is required. The lattice shape of the aluminum alloy foam is similar to a hexagonal column, and is called the honeycomb stack structure. Van der Marck clarified the percolation threshold for the honeycomb stack to be approximately 0.37 [20]. A comparison of Pl with this threshold showed that the stabilization mechanism by primary crystals is also valid in three-dimensional models. To summarize, primary crystals are considered to be one of the factors that help keep the foam stable.
5. Conclusions
The stabilization mechanism of the aluminum alloy foam was discussed by observing the primary crystals with regard to the percolation theory. The results can be summarized as follows:
- Some primary crystals were aggregated in the stable cell walls. Additionally, its percolation probability exceeded the reference percolation threshold (0.581) in some stable cell walls (aggregated cell walls). It is considered that the aggregated cell wall can retain its shape for a long time due to the presence of the primary crystals.
- Cell walls with insufficient primary crystals also remained stable. Therefore, the fact that the aggregated cell walls inhibit the drainage of non-aggregated cell walls is considered to be one of the factors that maintain the stability of the foam.
Author Contributions
Conceptualization, S.T. and S.S.; methodology, S.T. and S.S.; validation, S.T., T.K., R.K. and S.S.; formal analysis, S.T.; investigation, S.T., T.K. and S.S.; data curation, S.T. and S.S.; writing—original draft preparation, S.T.; writing—review and editing, S.T., T.K. and S.S.; visualization, S.T.; supervision, S.S.; project administration, S.S.; and funding acquisition, S.T. and S.S. All authors have read and agreed to the published version of the manuscript.
Funding
This research was funded by the Grant-in-Aid from The Light Metal Educational Foundation.
Acknowledgments
The authors would like to thank The Light Metal Educational Foundation for funding support and for supplying the high-purity aluminum ingots used in this study. Finally, this work was supported by LMEF Research Scholarship for Young Scientists for the first author Satomi Takamatsu by The Light Metal Educational Foundation.
Conflicts of Interest
The authors declare no conflict of interest.
References
- Banhart, J. Manufacture, characterization and application of cellular metals and metal foams. Prog. Mater. Sci. 2001, 46, 559–632. [Google Scholar] [CrossRef]
- García-Moreno, F. Commercial applications of metal foams: Their properties and production. Materials 2016, 9, 85. [Google Scholar] [CrossRef] [PubMed]
- Heim, K.; Vinod-Kumar, G.S.; García-Moreno, F.; Banhart, J. Stability of various particle-stabilised aluminum alloys foams made by gas injection. J. Mater. Sci. 2017, 52, 6401–6414. [Google Scholar] [CrossRef]
- Dang, F.; Liu, Y.; Lu, X.; Fan, J. Improved Stability of Aluminum Foam Through Heat Treatment of Foamable Precursor. Met. Mater. Int. 2019. only online available. [Google Scholar] [CrossRef]
- Yekeen, N.; Manan, M.A.; Idris, A.K.; Samin, A.M.; Risal, A.R. Influence of Silicon Oxide and Aluminum Oxide Nanoparticles on Air and CO2 Foams Stability in Presence and Absence of Oil. Chem. Eng. Trans. 2017, 56, 1243–1248. [Google Scholar]
- Ashby, M.F.; Evans, A.G.; Fleck, N.A.; Gibson, L.J.; Hutchinson, J.W.; Wadley, H.N.G. Metal Foams: A Design Guide, 1st ed.; Butterworth-Heinemann: Woburn, MA, USA, 2000; pp. 8–11. [Google Scholar]
- Miyoshi, T.; Itoh, M.; Akiyama, S.; Kitahara, A. ALPORAS aluminum foam: Production process, properties, and applications. Adv. Eng. Mater. 2000, 2, 179–183. [Google Scholar] [CrossRef]
- Suzuki, S.; Murakami, H.; Kadoi, K.; Saiwai, T.; Nakae, H.; Babcán, N. Aluminum foam fabrication through the melt route by adding Mg and Bi. In Proceedings of the 7th International Conference on Porous Metals and Metallic Foams, Busan, Korea, 18–21 September 2012. [Google Scholar]
- Jin, I.; Kenny, J.D.; Sang, H. Method of Producting Lightweight Foamed Metal. U.S. Patent 4,973,358, 27 November 1990. [Google Scholar]
- Hanafusa, T.; Ohishi, K. Making of Porous Metallic Material by the Semi-Solid Aluminum Alloy. Available online: https://www.pref.hiroshima.lg.jp/uploaded/life/206737_384148_misc.pdf (accessed on 3 June 2020).
- Kuwahara, T.; Osaka, T.; Saito, M.; Suzuki, S. Compressive properties of A2024 alloy foam fabricated through a melt route and a semi-solid route. Metals 2019, 9, 153. [Google Scholar] [CrossRef]
- Saito, M.; Suzuki, S.; Kamm, P.H.; García-Moreno, F.; Banhart, J. In-situ observation of foam evolution of liquid and semi-solid A2024 alloy through X-ray radioscopy. In Proceedings of the 9th International Conference on Porous Metals and Metallic Foams, Barcelona, Spain, 31 August–2 September 2015. (submitted). [Google Scholar]
- Heim, K.; García-Moreno, F.; Banhart, J. Particle size and fraction required to stabilise aluminium alloy foams created by gas injection. Scr. Mater. 2018, 153, 54–58. [Google Scholar] [CrossRef]
- Kuwahara, T.; Kaya, A.; Osaka, T.; Takamatsu, S.; Suzuki, S. Stabilization mechanism of semi-solid film simulating the cell walls during fabrication of aluminum foam. Metals 2020, 10, 333. [Google Scholar] [CrossRef]
- Murray, J.L.; McAlister, A.J. The Al-Si (Aluminum-Silicon) system. Bull. Alloy Phase Diagrams 1984, 5, 74–84. [Google Scholar] [CrossRef]
- Gao, L.; Harada, Y.; Kumai, S. Analysis of microstructure evolution and precise solid fraction evaluation of A356 aluminum alloy during partial re-melting by a color etching method. J. Mater. Sci. 2012, 47, 6553–6564. [Google Scholar] [CrossRef]
- Smith, L.N.; Lobb, C.J. Percolation in two-dimensional conductor-insulator networks with controllable anisotropy. Phys. Rev. B 1979, 20, 3653–3658. [Google Scholar] [CrossRef]
- Stauffer, D.; Aharony, A. Cluster Numbers. Introduction to percolation theory, 2nd. Ed.; Taylor & Francis: London, UK, 1994; pp. 26–34. [Google Scholar]
- Hensler, J.H. The Relation between Grain Section and Grain Size. J. Inst. Metals 1968, 96, 190–192. [Google Scholar]
- Van der Marck, S.C. Percolation thresholds and universal formulas. Phys. Rev. E 1997, 55, 1514–1517. [Google Scholar] [CrossRef]


© 2020 by the authors. Licensee MDPI, Basel, Switzerland. This article is an open access article distributed under the terms and conditions of the Creative Commons Attribution (CC BY) license (http://creativecommons.org/licenses/by/4.0/).