Article

Experimental and Numerical Analysis of the Influence of Burst Pressure Distribution on Rapid Free Sheet Forming by Vaporizing Foil Actuators

Institute of Forming Technology and Lightweight Components (IUL), TU Dortmund University, Baroper Str. 303, 44227 Dortmund, Germany
*
Author to whom correspondence should be addressed.
Metals 2020, 10(6), 845; https://doi.org/10.3390/met10060845
Submission received: 31 May 2020 / Revised: 22 June 2020 / Accepted: 22 June 2020 / Published: 26 June 2020

Abstract

:
Vaporizing Foil Actuators (VFA) can be employed as an innovative, extremely fast sheet metal forming method. An ultimate goal in forming technologies is generally to be flexible and rely on as few part-specific tools as possible. Therefore, various realizable VFA pressure distributions were investigated with a focus on the free forming result. Fundamental experiments including laser-based dynamic velocity measurements were conducted to discuss some key forming characteristics of the process. To compare more complex pressure distributions in a well-defined way, a numerical model was built. The strain rate dependency of the blank material was identified experimentally and incorporated in the model. It is shown that there are some VFA free forming capabilities in terms of creating certain part shapes, but only to a limited degree because relevant inertial forces can be present in regions where displacements would actually be either undesirable or wanted. Potential solutions to this are given at the end.

1. Introduction

Aside from other manufacturing applications (e.g., see Vivek et al. [1] for a comprehensive overview), electrically exploding thin metal conductors can be used to flexibly form sheet metal blanks into a die cavity. The violently expanding vapor pressure acts as forming pressure in this impulse-based process, which is called Vaporizing Foil Actuator Forming (VFAF, Figure 1). Since sheet forming is a relatively new application for such actuators, not so much research has been conducted so far, the only known concrete product example being a titanium cell phone case by Vivek et al. [2]. The vast majority of related literature focuses on impact welding (VFAW), where the displacements or forming heights are ideally very small and local [3,4,5]. This is different in VFAF. A relatively thin reusable elastomer plate is typically used between the blank and the foil actuator as protective pressure transfer medium. The actuator serves as a cheap one-way tool, avoiding the need for part geometry-dependent solid punches, as required in conventional sheet metal forming processes (e.g., deep drawing). The same pulse generators used for electromagnetic forming provide the resistive input energy to the VFAF process. With the concept of series and parallel circuits, customized pressure distributions can be applied, as shown by Cai [6] through subsequently placing two cut vaporizing regions along a foil with a fixture in between, and by Wu et al. [7] through producing four parallel vaporizing regions using vacuum magnetron sputtering (on a much lower scale, though). Moreover, one can make use of the pressure on both sides of the foil to form two sheets at the same time [8]. Grigoriev and Pavlenko [9] experimentally found the relatively universal Equation (1) to relate the specific electrical energy deposition w (MJ/kg) into the foil until the burst to the burst pressure amplitude pb (hb is the latent heat of vaporization of a metal (MJ/kg)) after which a very fast quasi-exponential decay can be observed due to the rapid volume expansion of the actuator. Equation (1) clearly shows that the specific achievable resistive energy deposition determines the burst pressure pb, as hb is a material constant.
p b [ GPa ] 1.4053 w h b 0.4836 ,   with   p b 0
Besides experimental research, modeling is key as well to a proper process development or design. There is no known standard procedure for the simulation of the multi-physical VFAF process. A practical approach has recently been proposed by Hahn et al. [10]. It consists of two subsequent numerical simulations: the electrical energy deposition without any workpiece displacement calculation, and the actual mechanical sheet forming through the foil expansion from the burst point tb on. The significant volume expansion of the actuator is the reason why meshless methods are favorable for its modeling in the second simulation. This is ongoing research, though. Both models may be coupled by Equation (1) so that the result of the first modeling stage (energy distribution) serves as initial value for the second one (burst pressure distribution). A simplified analytical approach for the electrical model part was also introduced [11].
The aforementioned advantages of VFAF eventually lead to the vision or question whether a geometry-dependent die could be saved as well if an actuator with a customized pressure distribution is applied to the blank. Consequently, the influence of such distributions on the free forming result is investigated in the present work.

2. Materials and Methods

As a non-homogeneous forming evolution can be expected when the driving pressure is varied spatially, basic single-foil preliminary experiments were carried out in a first step to discuss certain characteristics with regard to the forming behavior. The experimental setup and configuration is detailed in Hahn et al. [10], and without further anticipation, a sketch and a formed specimen are included in Figure 3 in Section 3.1. First, 1-mm-thick circular cold-rolled mild steel blanks (DC01 type, see Table 1) having an initial diameter of 220 mm were bulged into a round open die by a waterjet-cut vaporizing aluminum foil region of the rectangular dimensions 62 mm × 18 mm × 0.08 mm. In addition, a Photon Doppler Velocimetry (PDV) system was installed to record the velocity history at two distinct material points. The functioning and setup of this PDV system is described elsewhere [12]; two focusing probes were used here, which were positioned and held by a frame. Current and voltage measurements were used to determine the energy (density) deposited until the burst point by integrating the electrical power w ˙ = i ( t ) φ ( t ) .
Then, to further analyze various possible pressure distributions with a well-defined impulse loading in a comparative manner, a reduced dynamic mechanical finite element model was built in Abaqus/Explicit (preprocessing not displayed, compare Section 3.2 for visual postprocessing). The model is reduced in the sense that no expanding actuator and no elastomer layer was modeled. It was found that the sheet blank can appropriately be represented by three C3D8R elements over the blank thickness, while the blankholder (clamping force of 1.5 kN) and the die (fixed in space) were rigid bodies. Coulomb friction between the blank and rigid bodies was set to μ = 0.15, which is a common average value for dry steel sliding friction [13]. Yet, the frictional energy part was very low in all simulations, meaning that the choice of μ had no noticeable influence on the current free forming process. To address more general impulse combinations, the die had a rectangular 150 mm × 100 mm opening (≠ preliminary experiments), and a die corner radius of 5 mm. The energy balance was always checked for consistency, the stabile time increment was ca. 4 × 10⁻⁸ s. The total process time is not known a priori, so the process was considered finished once the plastic energy dissipation of the clamped workpiece did not change anymore.
For the characterization of the workpiece material (1 mm thick DC01 sheet) at room temperature, quasi-static standard tests were performed at the IUL (uniaxial tensile and in-plane torsion tests at strain rates ε ˙ ~ 0.002 1/s). For dynamic testing, which is not further detailed here, the company Nordmetall GmbH, Germany, was commissioned (rotational wheel impact tests at ε ˙ ~ 100 1/s, drop weight impact tests at ε ˙ ~ 700 1/s, and Split-Hopkinson pressure bar tests at ε ˙ ~ 19,000 1/s). The bcc-version of the Zerilli-Armstrong (ZA) flow curve approach as implemented in several commercial explicit finite element codes is known to be
σ f = Y 0 + C 1 exp ( C 3 T + log { ε ˙ ε ˙ ref } C 4 T ) + C 5 ε n
where the material constants Y0, C5 and n basically define the quasi-static hardening behavior like in a Ludwik flow stress description. C1 is a stress weighting the overall influence of the temperature and normalized equivalent strain rate on the flow stress σf, with two more constants C3 and C4. However, since both the characterization tests as well as the vaporizing actuator-free forming experiments were performed at room temperature, mainly the strain rate influence matters here. Adiabatically calculated temperature increases due to plastic deformation only amounted to less than 450 K at maximum. The parameter identification for Equation (2) was done using a least-square optimization (LS Fit) giving the results of Figure 2 and Table 2, respectively. Other plastic flow curve equations that introduce the rate dependency multiplicatively instead of additively, such as after Johnson-Cook or Cowper-Symonds, did not fit well over the large strain rate range of the characterization experiments. The ZA-choice for the numerical simulation model is further supported by Lee and Liu [14] who also found the ZA model to be suitable for a steel alloy similar to the one used in the present work at both low and high rates.
If the burst time is defined as zero for the mechanical modeling, the expansive vapor pressure p*, which serves as transient input load in z-direction over distinct sheet areas in the simulations, may be approximated by p*(t) = pb∙exp(−t/td) with regard to Equation (1). The below relation can then be deduced from integrating Newton’s second law, considering that plastic deformation acts against the workpiece loading (hence the unequal sign). Please note that mass scaling should not be used here to correctly compute inertial effects.
ρ s s z v z , max < 0 t { v z , max } p * d t ρ s s z v z , max p b < t d
where vz,max, ρs and sz are the maximum z-velocity, density, and (initial) sheet thickness. Taking measured velocities of different setups (e.g., this work and the results of Vivek et al. [15]) and Equation (1), it is found from Equation (3) that td 0.6 μs may consistently be employed as a lower bound for the decay time in the load definition of the simulations.

3. Results

In the following, the main outcomes of the basic experiments are analyzed first, providing important foreknowledge for an ensuing broadened numerical investigation.

3.1. Preliminary Experiments

Figure 3 shows selected measured velocity–time curves for different charging energies and thus energy deposition densities. It can be seen that the maximum or peak velocity at the pressure center (v1) roughly doubles when the energy deposition density is increased by just ca. 1/3. In total, this led to bulging heights of approximately 33 mm (Figure 3a) and 17 mm (Figure 3b). What is more, while the center region accelerates almost instantaneously after just a few microseconds, upon burst, a sheet point 30 mm away from the center starts to accelerate notably not before t = 100 µs in both cases (v2). This indicates a rather direct pressure transfer through the polyurethane layer, as the deformation region largely corresponds to the pressure application area in the early process stage, whereas compensating effects smooth it out later. The main driving force behind this, yielding a complicated overall forming evolution, is inertia.
In this context, especially strain rate-induced hardening counteracts inertial forces, increasing the resistance against a rise to otherwise higher peak velocities. Disregarding friction and assuming that the total peak velocity vmax of a considered material point occurs when the impulse pressure is already negligible, only kinetic and plastic energy terms change during the free deceleration phase until the sheet stands still (reaching the equivalent plastic strain εend at v = 0). These two energies balance each other out then, since their sum must remain constant. Only taking first-order increments into account, one can then establish
ρ s 2 v max 2 < σ fAv ε end = e pl
where σfAv is an average local flow stress over the whole process. This is a useful relation as it shows that a lower bound estimate epl,min for the volumetric plastic energy epl of the VFAF process can be determined from the local maximum kinetic energy. Together with the energy deposition density available for loading, a forming efficiency could be determined. Depending on the perspective though, a maximum so-defined efficiency should not necessarily always be the primary goal because more plastic energy is required to reach the same strain or forming result if rate-dependent hardening becomes more dominant as a consequence of higher burst pressures. This is why an equivalent one-dimensional reference measure is introduced to judge the quality of burst pressure utilization, independent of the actual boundary conditions. For a fictitious sheet increment having a constant thickness sz, to reach an identical characteristic displacement D as in the actual experiment with the same amount of energy from Equation (4) but simply in terms of volumetric force times displacement, a constant reference pressure is defined as pref = szepl,min/D. Now, one can interpret that the lower pref the less energy was consumed to accomplish D. At the same time, mainly for economic reasons, the burst pressure pb should be as low as possible as well. Consequently, a rather low value of the combined abstract pressure P = (pbpref)0.5 tendentially expresses a good pressure utilization with respect to an efficient manufacture, especially if different energy inputs (indices A and B) are to be compared for the same experimental setup, so that the relative pressure utilization PA/PB is in a quantitatively handy range. The energy depositions achieved in the experiments, 13.5 and 18 MJ/kg, correspond to pressure amplitudes of 1.32 and 1.93 GPa according to Equation (1). With the measured data, i.e., the pole displacements of 33 and 17 mm and peak velocities of 190 and 80 m/s, PA/PB = 2.06 is obtained (A for Figure 3a, etc.), meaning the experiment with the lower energy input offers a better pressure utilization due to less rate-induced hardening influence at lower velocities.

3.2. Numerical Analysis of Various Pressure Distributions

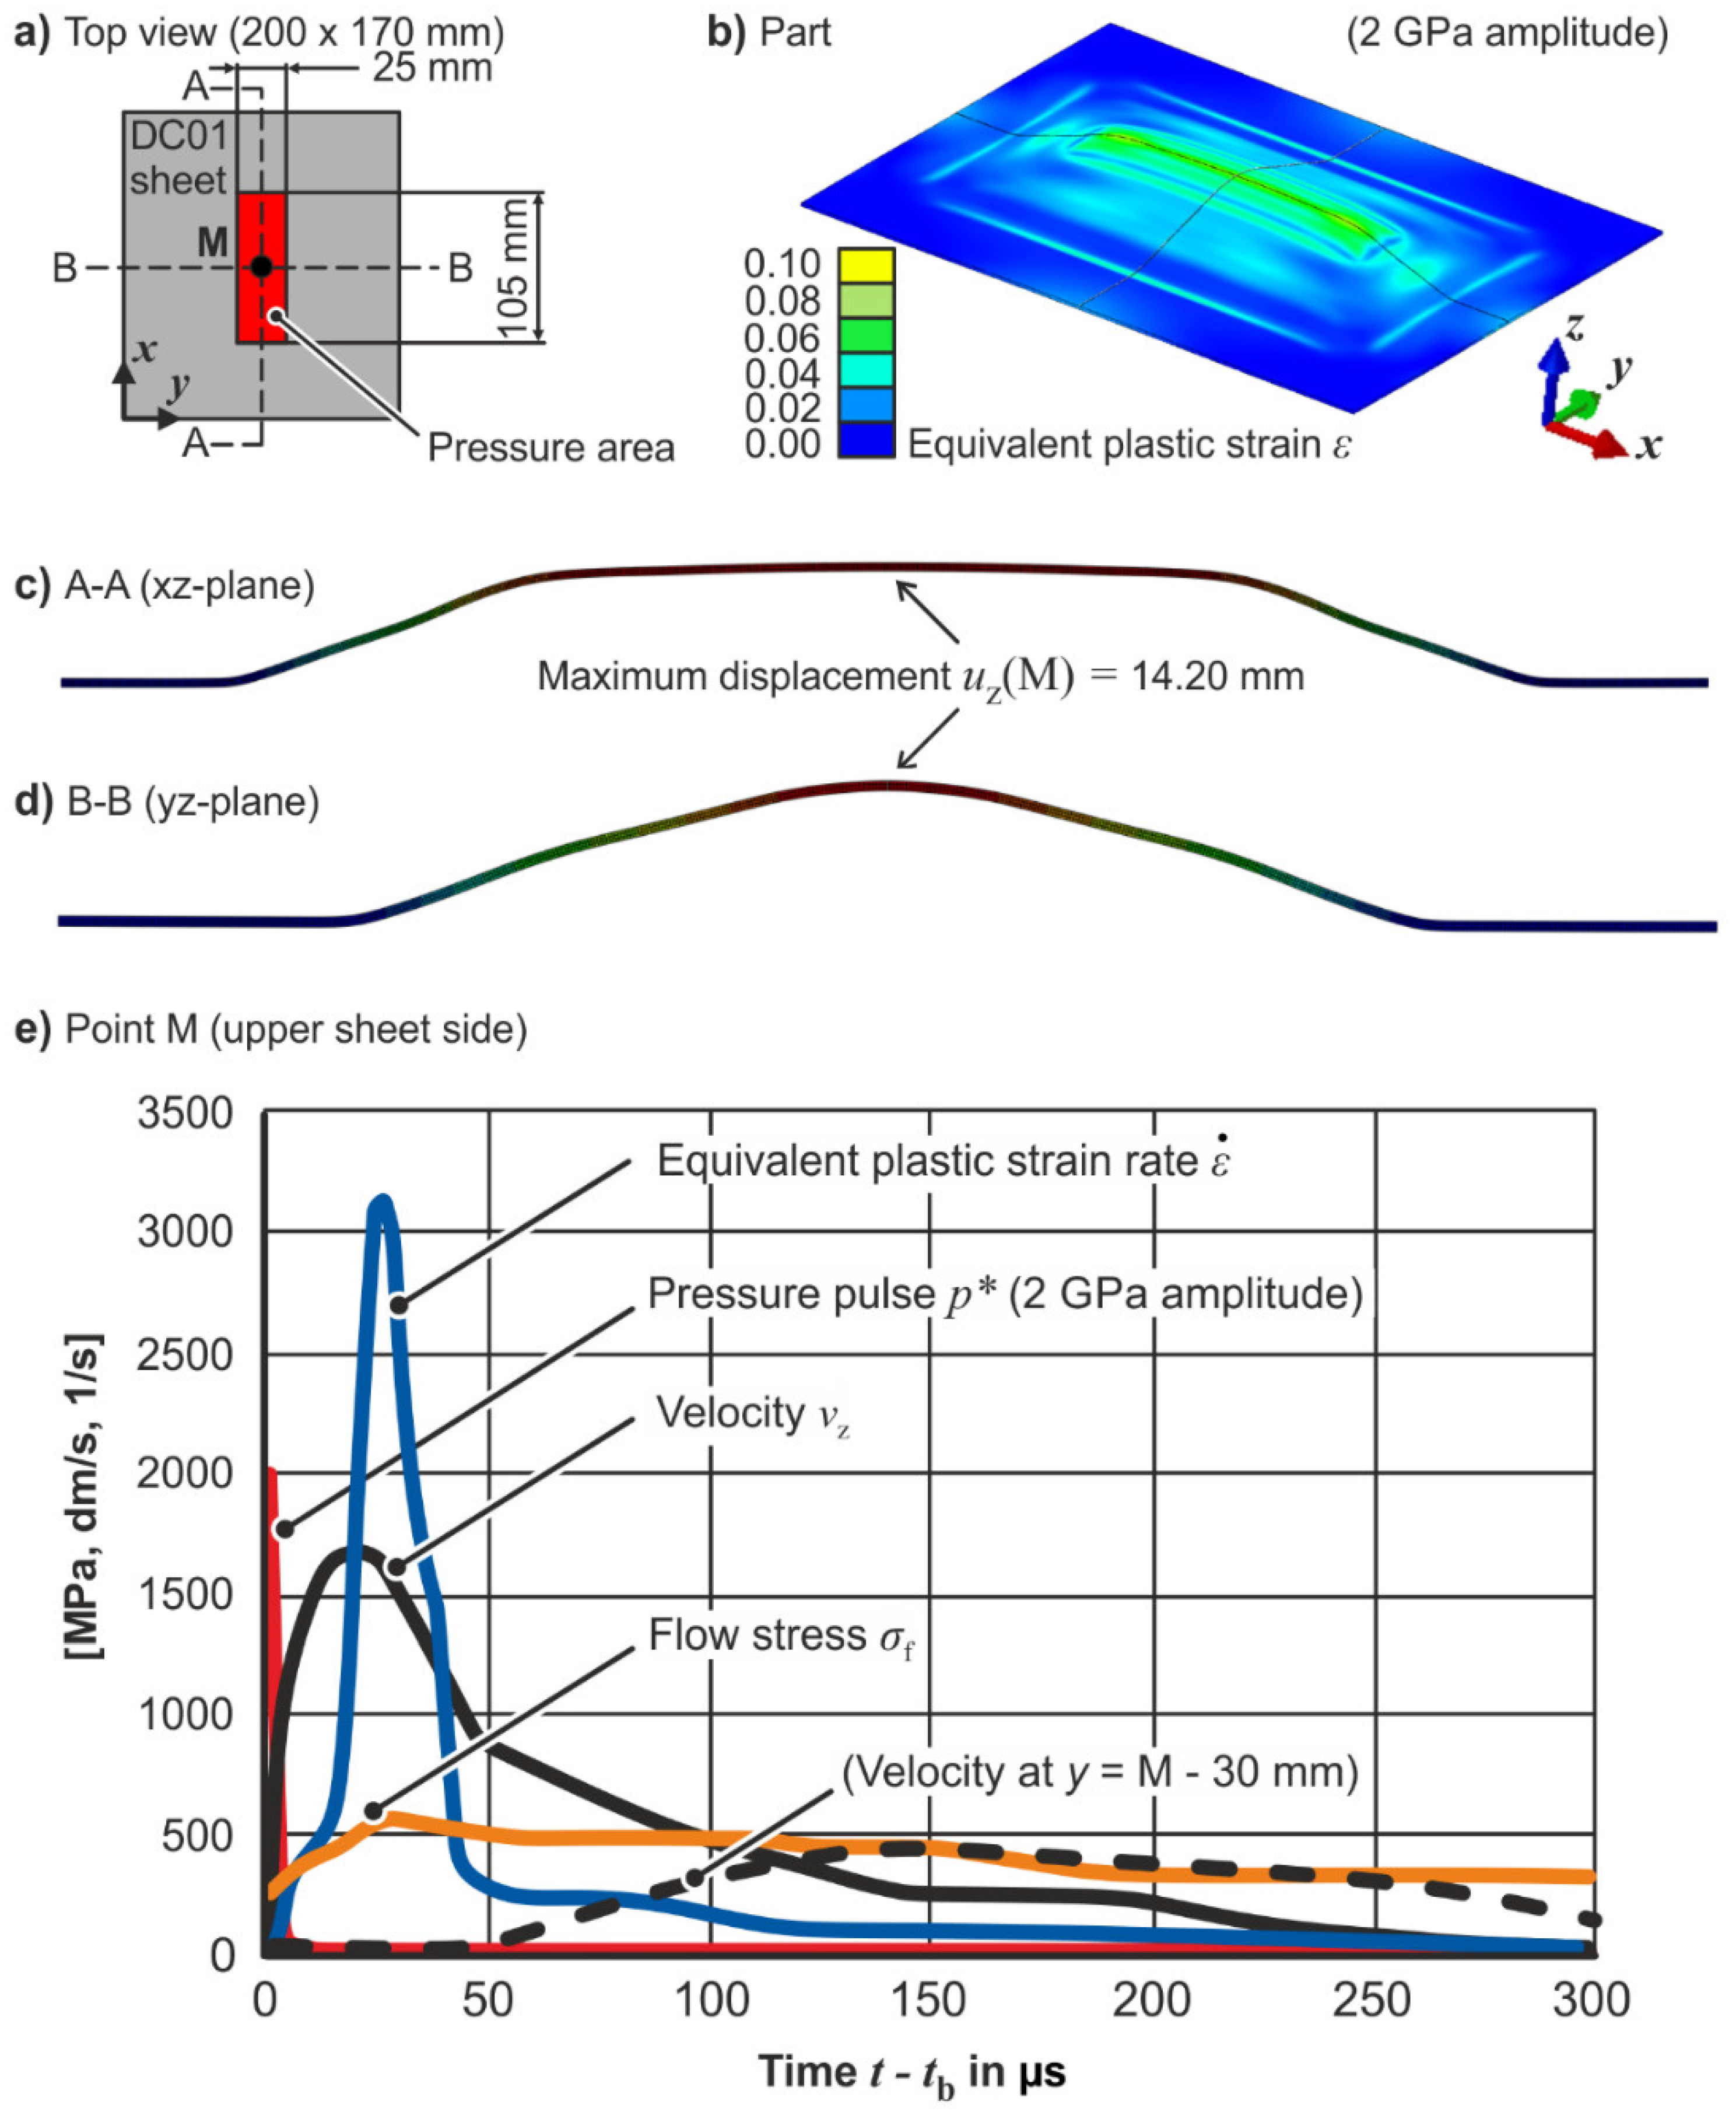
First, the most simple pressure distribution (subsequently named PD1), which was also applied in the preliminary experiments, is considered in Figure 4. Despite different boundary conditions (rectangular blank and die opening), it is noticeable that the two velocity curves in Figure 4 qualitatively resemble the experimental curves of Figure 3, so the simulated curves can be adduced for a proper analysis. It is also stressed that a unified lower bound value was applied for the decay behavior of the input impulse load in all simulations (Equation (3)), presumably leading to an underestimation of the forming height. However, precisely replicating experiments is not the focus of this numerical study.
In case of PD1 (Figure 4a), the final strain (Figure 4b) and displacement (Figure 4c,d) distribution is indicative of the pressure distribution to some extent, which is beneficial with regard to designing the process based on the desired part geometry. Because of the temporarily high strain rate of more than 3000 1/s around the peak velocity the flow stress also peaks there, with ca. a tripling of the initial flow stress (Figure 4e). The flow stress then decreases slightly, meaning that the strain-induced hardening almost compensates for the decreasing strain rate influence later in the process.
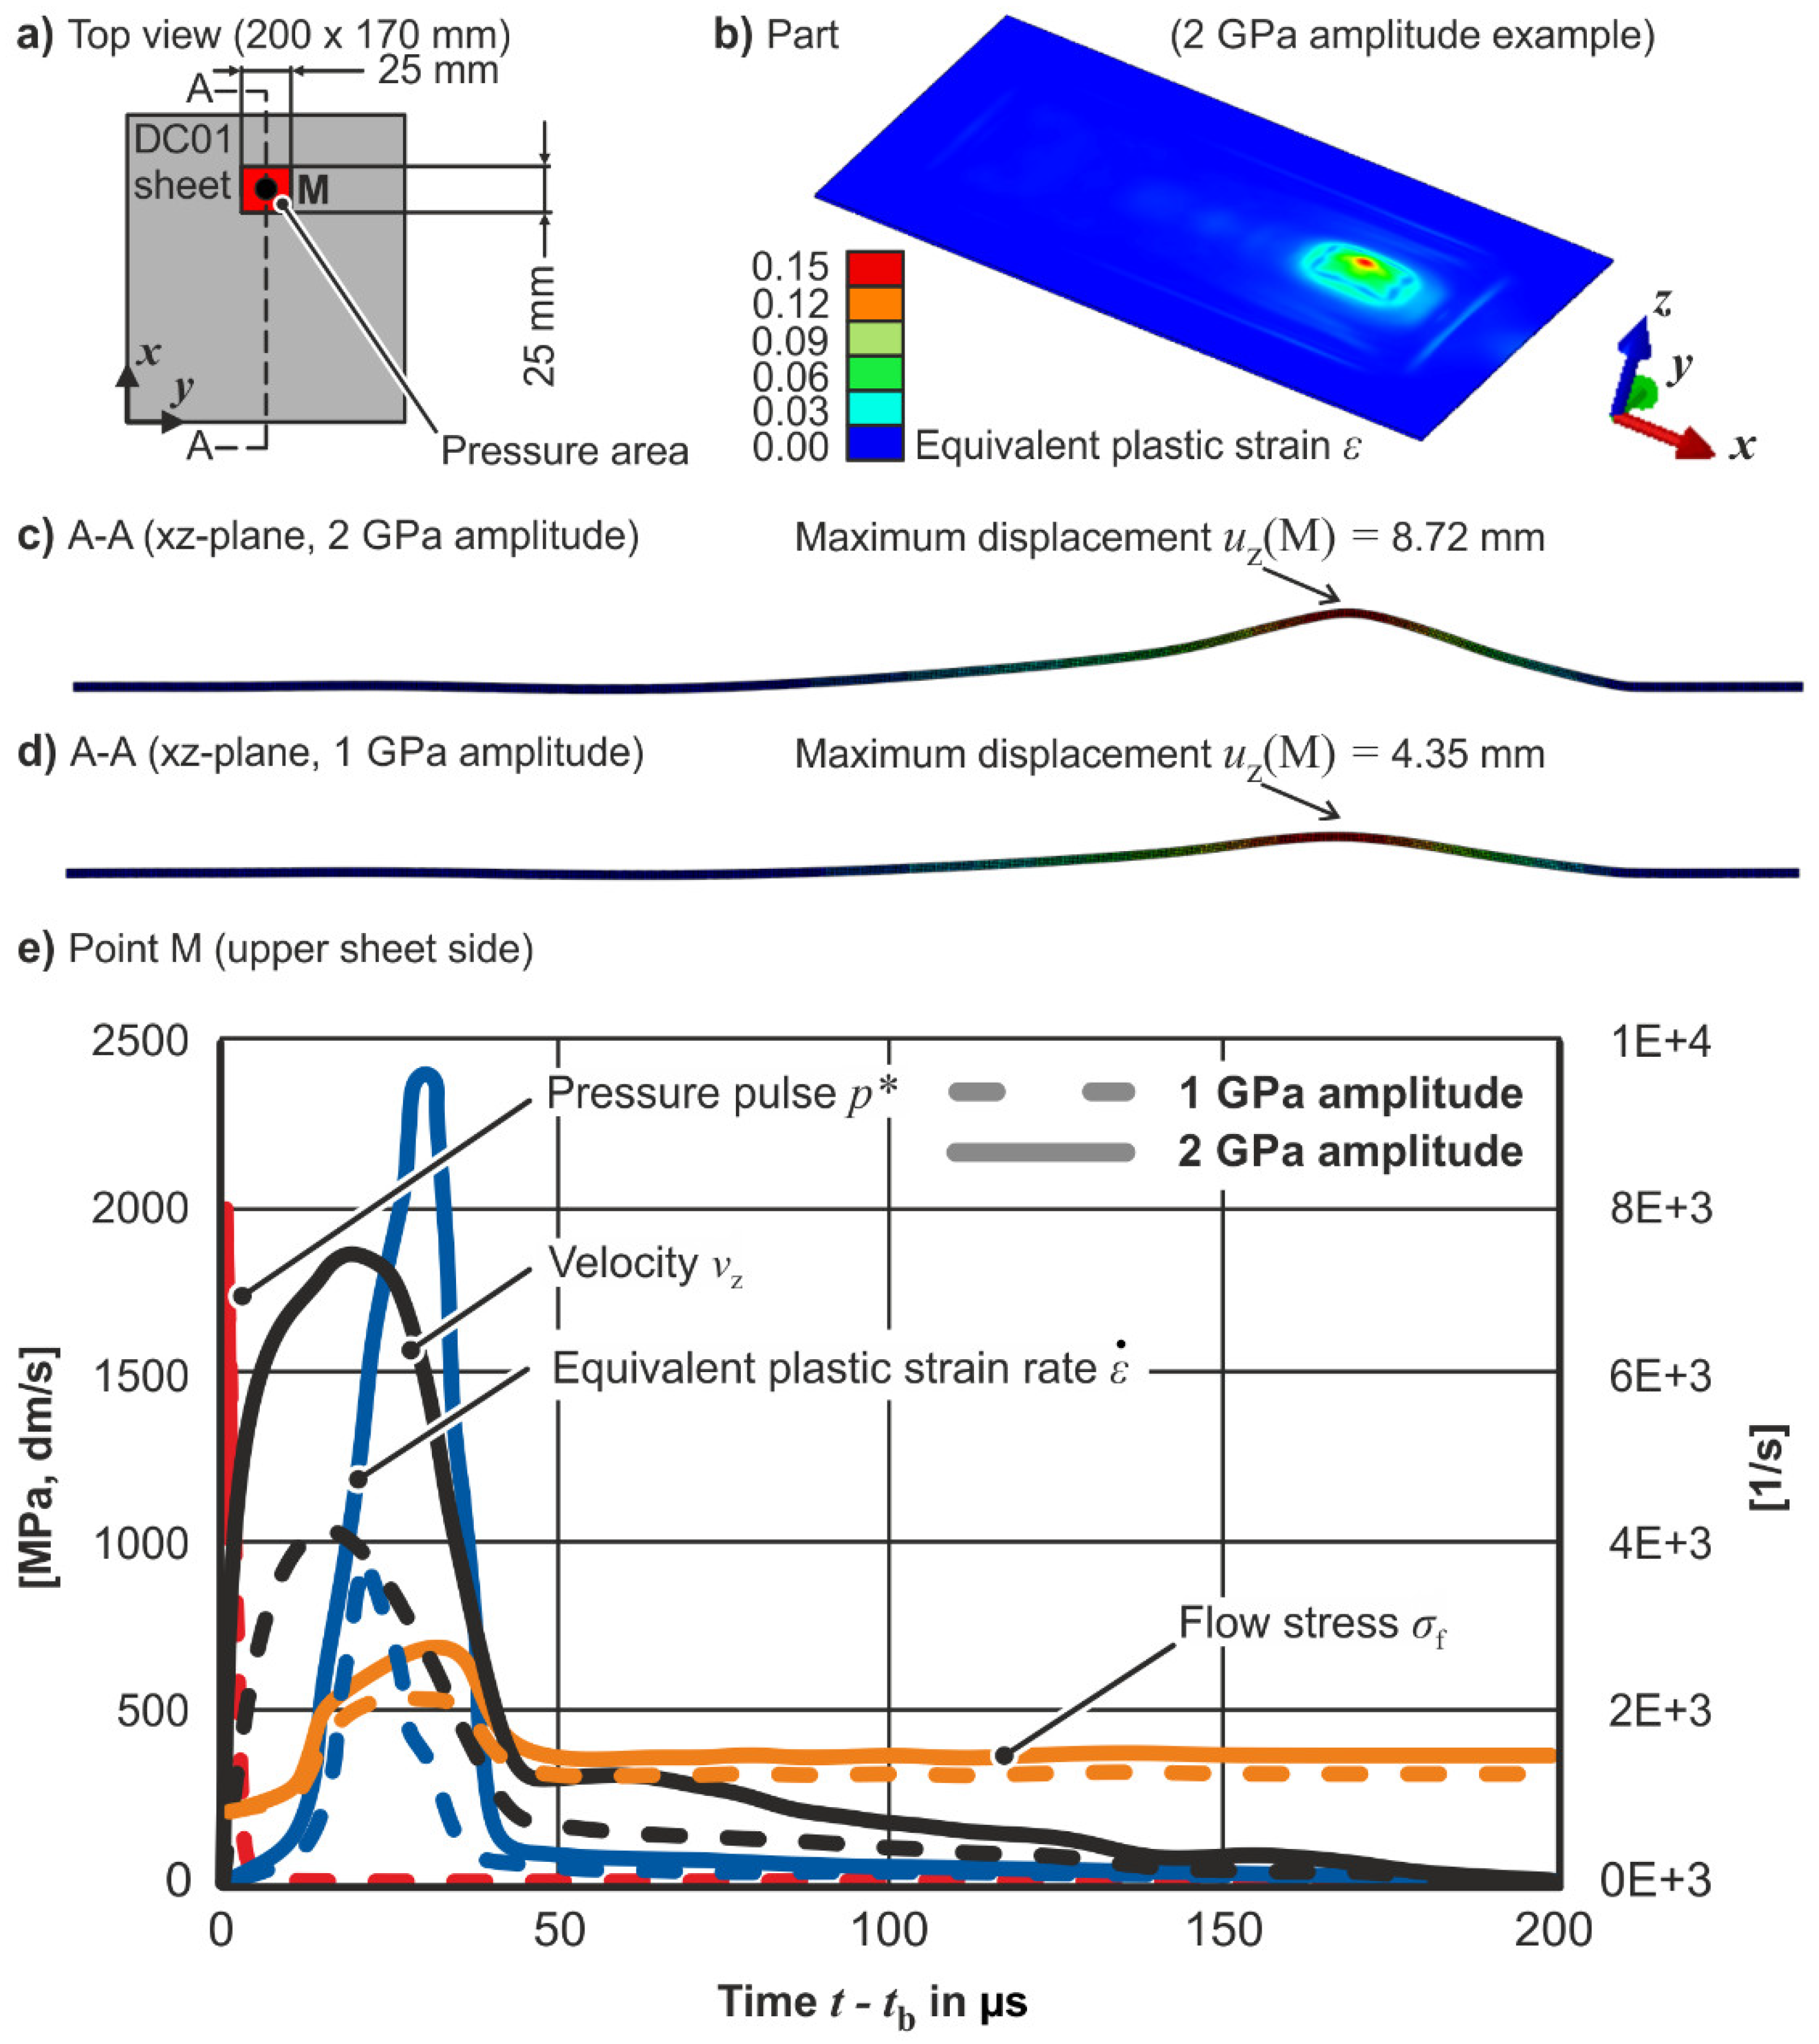
The effects of a small shifted pressure spot (PD2) are addressed in Figure 5. For PD2, the pressure distribution (Figure 5a) can qualitatively be derived from the forming result (Figure 5b–d) as well. The courses of velocity, strain rate, and flow stress at the pressure center are compared for two amplitudes, 1 and 2 GPa (Figure 5e). The numerical peak velocity in Figure 5 roughly doubles from 100 m/s to ca. 200 m/s when doubling the pressure amplitude from 1 to 2 GPa, while the strain rate increases more significantly to almost 10,000 1/s. Due to the mathematical nature of the Zerilli-Armstrong flow curve, this strain rate increase only leads to a comparatively minor flow stress enhancement, which also explains the doubling of the final maximum displacement or forming height from 4.35 to 8.72 mm. Comparing Figure 4 and Figure 5 at an amplitude of 2 GPa, it is observed that, despite similar peak velocities, the smaller pressure area (PD2) yields higher strain rates and therefore higher strains than in the pressure center of PD1. This could be clarified by the fact that the smaller pressure area locally gives a smaller formed radius r. With the simplified help of a pure bending strain formula, εB = ln(0.5sz/r), this becomes directly evident. This, in turn, also implies a higher plastic resistance in case of the smaller radius. For identical pressure loads, rather small pressure areas consequently lead to higher local strains but, at the same time, to lower displacements.
In Figure 6, a more symmetric pressure distribution (PD3, Figure 6a) is treated again, involving two actuating areas with differing gaps. The reconstruction of the pressure field cannot be done solely on the basis of the formed part (Figure 6b), even though PD3 is still of quite simple nature. In the early process stage (Figure 6c), the cross section still makes it possible to estimate where the pressure application areas are. Then, the center region of the blank, which is not covered by a pressure area, accelerates due to the remaining velocity field present at that point in time or, in other words, by means of inertial forces. This way, the subsequent deformation of the center region smoothens out the recognizability of the actual pressure distribution, yielding a more hemispherical dome geometry (Figure 6d). It can hence be concluded that a part geometry consisting of two nearby domes (or similar), with no displacements wanted in between, cannot satisfyingly be manufactured by VFA free forming. Furthermore, the inertial effect is found to be not very sensitive to the gap size between the two pressure areas of PD3, since more than doubling the gap from 10 to 35 mm changes the final center forming height only very little, from 11.75 to 10.70 mm (Figure 6e,d). The temporal evolutions of plastic strain and displacement are plotted for the pressureless center S and the pressure point M of the blank (Figure 6f). In the case of point M, a unique correlation between vertical displacement and equivalent plastic strain could be drawn, at least until the maximum displacement is reached. Afterwards, a small plastic bounce back occurs, increasing the equivalent strain a bit further. However, a unique correlation cannot be established for point S. Although initially still at rest, some straining is already taking place due to lateral pulling from the neighboring pressurized material regions. The actual displacement then starts when inertial forces become high enough to noticeably accelerate the center region. The main displacement phase of point S also involves some rigid body motion as the strain stagnates (t = 100–200 µs), followed by a phase qualitatively comparable to that of point M at the beginning. Overall, this leads to a slightly higher final strain at the pressurized point M compared to the ‘free’ point S, while the opposite applies for the final displacements.
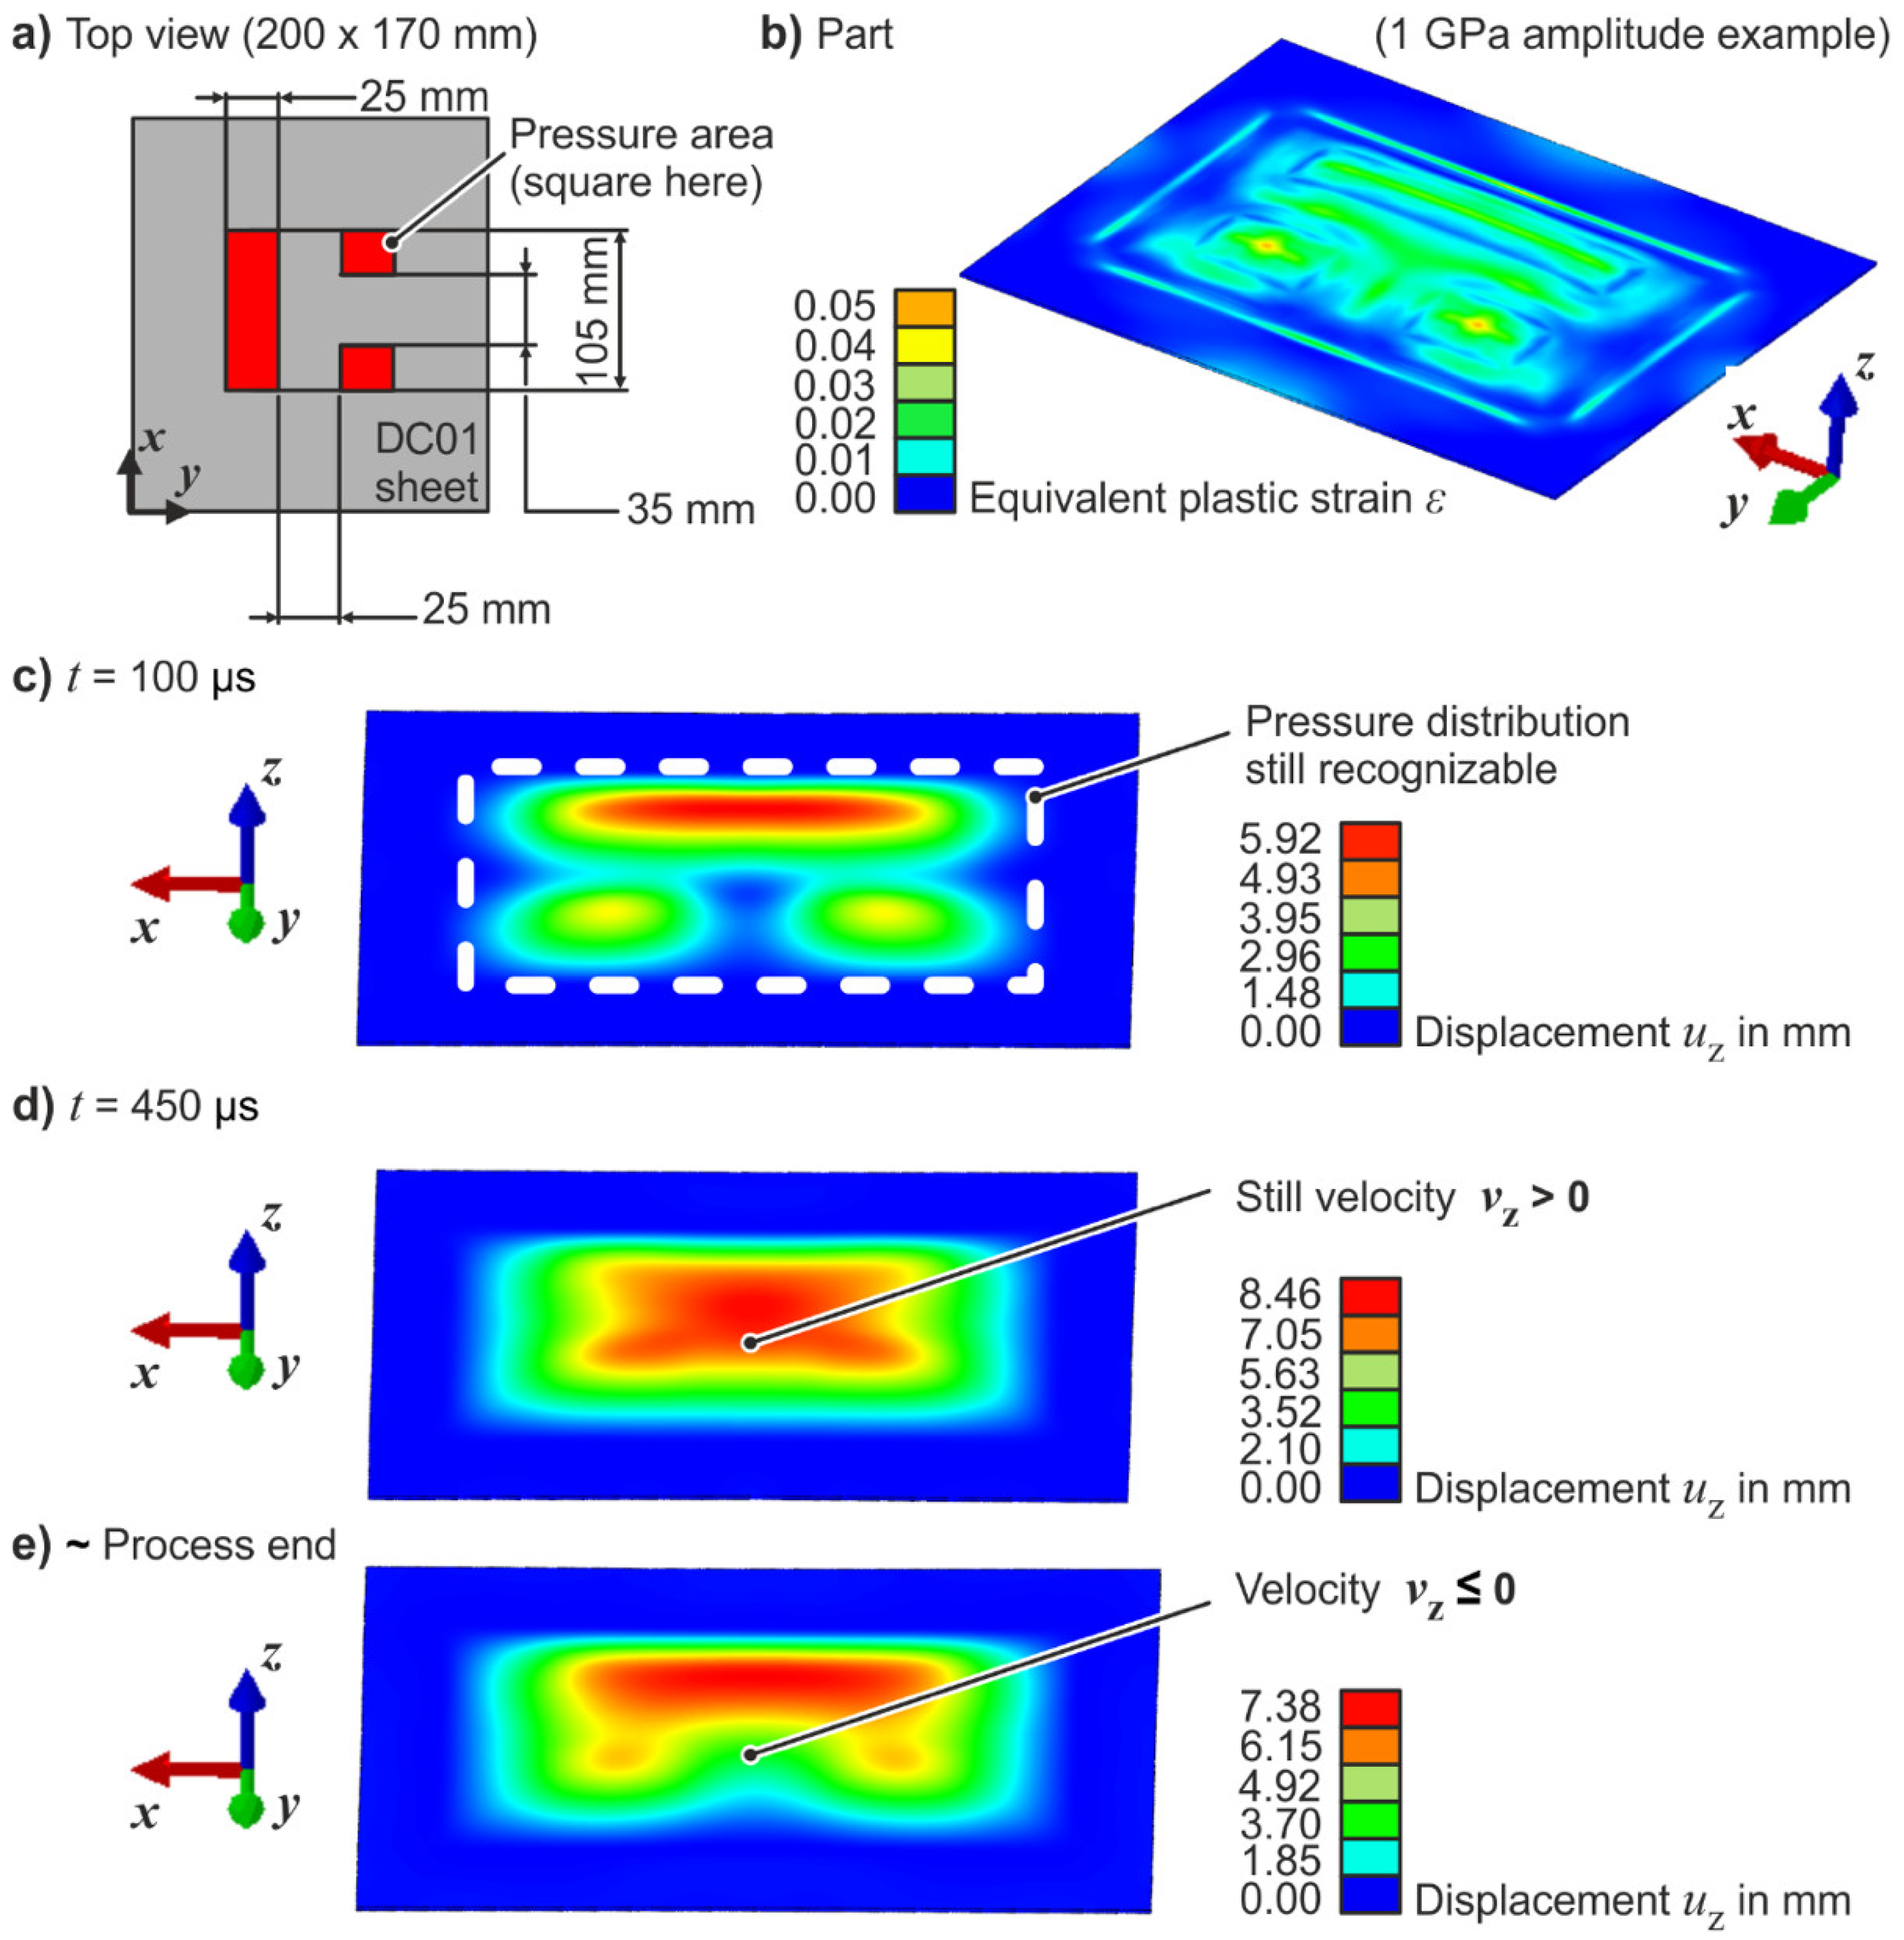
In Figure 7, a little more complex, partly asymmetric pressure distribution (PD4, Figure 7a), which can only very vaguely be derived from the forming result (Figure 7b,e), is considered. As with PD3, the pressurized regions are recognizable in the early process stage (Figure 7c). Then, inertia pushes up blank regions not subjected to a pressure impulse so that the displacement field shortly becomes more or less uniform, viz., the pressure distribution appearance vanishes in the meantime (Figure 7d). What is different now is that some pressure less regions markedly bounce back plastically towards the process end, with the result that the pressure distribution could again at least vaguely be guessed from the final displacement field, although in a clearly less defined form (Figure 7e). A potential explanation for this dynamic behavior is as follows. From PD4, asymmetric boundary conditions (with regard to the x-axis) evolve for the pressureless regions during the forming of the pressurized spots, also introducing a global moment about the x-axis. The moment’s direction complies with the bounce back direction and may thus contribute to the velocity sign change towards the end (Figure 7d,e).

4. Discussion

Different VFAF pressure distributions were analyzed experimentally as well as numerically. The results reveal that the free forming capabilities of customized pressure distributions in terms of creating defined part shapes are somehow limited, since inertia can also act as a relevant force in part regions where displacements could potentially be unwanted (referring to Figure 3, Figure 4, Figure 5 and Figure 6). On the other hand, depending on the degree of simplicity of the geometry to be formed, one could also make use of inertia and only employ comparably small pressure areas, reducing the required amount of foil material for the actuator(s). Provided that the chosen geometry is appropriate for a specific application, introducing an asymmetric pressure distribution (referring to Figure 7)—after different process phases—ultimately shows that even some fairly complicated part geometries could be impulsively formed without any solid tool. Yet overall, it can be anticipated that using a closed die might often not be avoidable for a large number of part geometries, some may even hardly be manufacturable by VFAF.
It was further derived and observed that the increased plastic resistance due to hardening of very strain rate-sensitive material (DC01 here) tends to give a more efficient relative burst pressure utilization in experiments with a rather low energy input or velocity, respectively.
Current work, besides the meshless modeling of the actual foil expansion for an unreduced simulation, includes the development and experimental testing of an optimization strategy to determine the pressure distribution actually needed for a proper filling of a given die geometry.
In this light, although with another high-speed forming method, Pegel et al. [16] demonstrated that dies having a certain compliance can be useful. Such tool materials (e.g., printed plastics) can minimize or maybe even avoid unintentional bounce-back effects which may occur when the workpiece hits a quasi-rigid die.
Another idea to potentially overcome the abovementioned part geometry limitations while still adhering to the initially formulated vision of a toolless sheet forming is to also distinctly apply pressures on the back side of the sheet instead of placing a closed die. This is; however, technologically challenging and of interest for future work.

Author Contributions

Conceptualization, M.H. and A.E.T.; methodology, M.H. and A.E.T.; validation, M.H.; formal analysis, M.H.; investigation, M.H.; writing—original draft preparation, M.H.; writing—review and editing, M.H. and A.E.T.; visualization, M.H.; supervision, A.E.T.; project administration, M.H. and A.E.T.; funding acquisition, M.H. and A.E.T. All authors have read and agreed to the published version of the manuscript.

Funding

Funded by the Deutsche Forschungsgemeinschaft DFG (German Research Foundation) in the frame of the project no. 391967465.

Acknowledgments

We acknowledge financial support by Deutsche Forschungsgemeinschaft and Technische Universität Dortmund/TU Dortmund Technical University within the funding programme Open Access Publishing. The help of Angshuman Kapil from The Ohio State University (USA) with conducting experiments, and of Veerendra Kumar, student assistant at IUL, with conducting the numerical study is also greatly acknowledged.

Conflicts of Interest

The authors declare no conflict of interest.

References

  1. Vivek, A.; Taber, G.A.; Johnson, J.R.; Woodward, S.T.; Daehn, G.S. Electrically driven plasma via vaporization of metallic conductors: A tool for impulse metal working. J. Mater. Process. Technol. 2013, 213, 1311–1326. [Google Scholar] [CrossRef]
  2. Vivek, A.; Brune, R.C.; Hansen, S.R.; Daehn, G.S. Vaporizing foil actuator used for impulse forming and embossing of titanium and aluminum alloys. J. Mater. Process. Technol. 2014, 214, 865–875. [Google Scholar] [CrossRef]
  3. Vivek, A.; Hansen, S.R.; Liu, B.; Daehn, G.S. Vaporizing foil actuator: A tool for collision welding. J. Mater. Process. Technol. 2013, 213, 2304–2311. [Google Scholar] [CrossRef]
  4. Vivek, A.; Presley, M.; Flores, K.M.; Hutchinson, N.H.; Daehn, G.S. Solid state impact welding of BMG and copper by vaporizing foil actuator welding. Mater. Sci. Eng. 2015, 634, 14–19. [Google Scholar] [CrossRef] [Green Version]
  5. Hahn, M.; Weddeling, C.; Taber, G.; Vivek, A.; Daehn, G.S.; Tekkaya, A.E. Vaporizing foil actuator welding as a competing technology to magnetic pulse welding. J. Mater. Process. Technol. 2016, 230, 8–20. [Google Scholar] [CrossRef] [Green Version]
  6. Cai, S. Tailored pressure distributions generated by vaporizing tailored metal foils. Int. J. Adv. Manuf. Technol. 2018, 94, 2791–2801. [Google Scholar] [CrossRef]
  7. Wu, J.; Wang, L.; Li, Y.; Yang, L.; Sultan, M.; Chen, L. Characteristics of a plasma flow field produced by a metal array bridge foil explosion. Plasma Sci. Technol. 2018, 20, 075501. [Google Scholar] [CrossRef] [Green Version]
  8. Cai, S. Double-direction pressure distributions generated by vaporizing metal foils. J. Manuf. Sci. Eng. 2017, 139, 031006. [Google Scholar] [CrossRef]
  9. Grigoriev, A.N.; Pavlenko, A.V. Pressure generated by the electric explosion of metal foils. Tech. Phys. Lett. 2009, 35, 865–868. [Google Scholar] [CrossRef]
  10. Hahn, M.; Goyal, S.; Gies, S.; Tekkaya, A.E. Numerical modelling of energy deposition for vaporizing foil actuator forming. In Proceedings of the 13th International Conference on Numerical Methods in Industrial Forming Processes-NUMIFORM, Portsmouth, NH, USA, 23–27 June 2019. [Google Scholar]
  11. Hahn, M.; Hansen, S.R.; Gies, S.; Vivek, A.; Daehn, G.S.; Tekkaya, A.E. Prediction of achievable energy deposition for vaporizing foil actuators. In Proceedings of the 8th International Conference on High Speed Forming–CHSF, Columbus, OH, USA, 14–16 May 2018. [Google Scholar]
  12. Johnson, J.R.; Taber, G.; Vivek, A.; Zhang, Y.; Golowin, S.; Banik, K.; Fenton, G.; Daehn, G.S. Coupling experiment and simulation in electromagnetic forming using Photon Doppler Velocimetry. Steel Res. Int. 2009, 5, 359–365. [Google Scholar]
  13. Trzepiecinski, T. A study of the coefficient of friction in steel sheets forming. Metals 2019, 9, 988. [Google Scholar] [CrossRef] [Green Version]
  14. Lee, W.-S.; Liu, C.-Y. Dynamic compressive deformation behavior of S50C medium carbon steel. Mater. Sci. Technol. 2004, 20, 919–924. [Google Scholar] [CrossRef]
  15. Vivek, A.; Hansen, S.R.; Daehn, G.S. High strain rate metalworking with vaporizing foil actuator: Control of flyer velocity by varying input energy and foil thickness. Aip Rev. Sci. Instrum. 2014, 85, 075101. [Google Scholar] [CrossRef] [PubMed]
  16. Pegel, H.; Langstädtler, L.; Herrmann, M.; Schenk, C.; Kuhfuß, B. Electrohydraulic sheet metal forming with flexible tools. In Proceedings of the 5th International Conference on New Forming Technology–ICNFT, Bremen, Germany, 18–21 September 2018. [Google Scholar]
Figure 1. Cross-sectional sketch of VFAF principle.
Metals 10 00845 g001
Figure 2. DC01 sheet characterization results at room temperature TRT (1 mm thickness).
Metals 10 00845 g002
Figure 3. Selected experimental free forming results: (a) 10 kJ charging energy (giving an energy density of 18 MJ/kg in the burst region), (b) 6 kJ charging energy (13.5 MJ/kg).
Metals 10 00845 g003
Figure 4. Numerical results for pressure distribution PD1: (a) sketch, (b) formed part, (cd) sectional views at process end, (e) selected node-/integration point treatment.
Metals 10 00845 g004
Figure 5. Numerical results for pressure distribution PD2: (a) sketch, (b) formed part, (cd) sectional views at process end, (e) selected node-/integration point treatment.
Metals 10 00845 g005
Figure 6. Numerical results for pressure distribution PD3: (a) sketch, (b) formed part, (ce) selected sectional views, (f) selected node-/integration point treatment.
Metals 10 00845 g006
Figure 7. Numerical results for pressure distribution PD4: (a) sketch, (b) formed part, (ce) selected displacement distributions.
Metals 10 00845 g007
Table 1. Chemical composition of the DC01 steel according to manufacturer data in percent by weight.
Carbon (C)Phosphorus (P)Sulphur (S)Manganese (Mn)
max. 0.12max. 0.045max. 0.045max. 0.6
Table 2. ZA-parameters used for generating large tabular input for the numerical model.
Y0
[MPa]
C1
[MPa]
C3
[1/K]
C4
[1/K]
C5
[MPa]
n
[-]
ε ˙ ref [ 1 / s ]
165656.480.01140.0006359.110.30.002