Article

Effect of Ti Content on the Behavior of Primary Carbides in H13 Ingots

1
State Key Laboratory of Advanced Metallurgy, University of Science and Technology Beijing, Xueyuan Road NO.30, Beijing 100083, China
2
Tianjin College, University of Science and Technology Beijing, Zhujiang North Ring East Road NO.1, Baodi District, Tianjin 301830, China
*
Author to whom correspondence should be addressed.
Metals 2020, 10(6), 837; https://doi.org/10.3390/met10060837
Submission received: 27 May 2020 / Revised: 19 June 2020 / Accepted: 22 June 2020 / Published: 24 June 2020
(This article belongs to the Special Issue Inclusion/Precipitate Engineering in Steels)

Abstract

:
The Ti element plays a role in pinning grain boundaries but also has a good binding ability to C and N, forming large primary carbides. Therefore, the effect of Ti content on primary carbides’ behavior in H13 ingots was comprehensively studied. A non-aqueous electrolysis method was used to determine the three-dimensional (3D) characteristics of primary carbides. We found a great difference between the two-dimensional (2D) and the three-dimensional characteristics of primary carbides. When performing 2D analyses, the density of the primary carbides appeared high, while their size was small. The actual characteristics of primary carbides can be obtained only by 3D observation. The primary carbide showed a typical dendritic structure, whose center consisted of Ti–V-rich carbide wrapped by V-rich carbide. As the Ti content increased, the size of the primary carbide increased from 24.9 μm to 41.3 μm, and the number density increases from 25.6 per/mm2 to 43.9 per/mm2. The Ti4C2S2 phase precipitated first, then changed into Ti–V-rich carbide, and finally further partly transformed into V-rich carbide. The addition of elemental Ti promoted the precipitation and transformation of primary carbides, resulting in an increase of the number density and size.

1. Introduction

The microalloying element Ti has been widely applied to improve the properties of steel, especially for the heat-affected zone (HAZ) [1,2]. The addition of elemental Ti can form fine dispersion of TiN or TiC particles that can pin the prior austenite grain boundaries, preventing excessive grain growth because of their stability at high temperatures [3,4]. Maity found that the tensile and yield strength of 0.07 wt.% titanium low-alloy steel increases sharply compared to those of un-inoculated steel, 0.2 wt.% titanium, and 0.4 wt.% titanium steels, because finer Ti(C, N) particles are precipitated [5]. In Mg-deoxidized steel, the number of TiN+MgO and TiN particles is about two times larger than that without Mg deoxidation, thus leading to a smaller austenite grain size [6]. Moreover, the TiN particles effectively promote intragranular ferrite nucleation in low-carbon steel. The acicular ferrite provides a desirable combination of high strength and good toughness because of its small plate thickness and interlocking microstructure [7,8]. The TiN and TiN+oxide particles can also act as the nucleation core of δ-phase during solidification, refining the solidification structure of ferritic stainless steel, especially increasing the fraction of equiaxed grains [9]. Wang found that yield strength and ultimate tensile strength increase gradually with the increase of Ti content in 20Cr–8Ni stainless casting [10]. Therefore, the appropriate addition of Ti can significantly improve the properties of materials.
However, if the Ti content in steel is not properly controlled, it will damage the performance of the steel and the smelting process. The presence of titanium in Al-killed molten steel generally causes more severe clogging in submerged entry nozzles than that observed with Ti-free steel, and the titanium oxide inclusions have been suggested as a possible cause [11,12]. In titanium-stabilized steels, the frequency of clogging can increase, and titanium nitride can be found as a solid deposit within the nozzle. Moreover, coarse TiN formed during solidification plays no role in pinning prior austenite grain boundaries during reheating but impairs fracture toughness [13,14]. Yan found that the formation of coarse TiN can significantly reduce the impact toughness of low-carbon microalloyed steel. The Ti/N ratio and the total Ti and N contents play an important role in TiN formation and growth [15]. Therefore, the Ti content in steel is very important for obtaining the required Ti-containing inclusions.
AISI H13 hot die steel is widely used in hot rolling, hot extrusion, and hot forging because of its remarkable fatigue resistance, notable hot strength, and impact toughness. About 8 wt.% carbide-forming elements, including Cr, Mo, and V, are contained in H13 steel to prevent the coarsening of austenite or strengthen the steel through secondary hardening. Therefore, the presence of Ti element is inevitable in molten steel during the actual smelting process because of the introduction of the alloying elements. Researchers have found large Ti-containing primary carbides in both as-cast H13 steel and H13 bars after heat treatment [16,17,18,19,20]. Large primary carbides as well as large Ti-containing carbonitride particles will act as a crack source, thus reducing the service life of H13 steel [21]. Therefore, reducing the size of Ti-containing primary carbides is of great significance for improving the service life of H13 steel.
Xie et al. have studied the precipitation behavior of Ti-containing primary carbides in Ti-microalloyed H13 tool steel and found that a Ti–N-rich carbide precipitates first, followed by a Ti–V-rich carbide [22]. However, the effect of different Ti contents on primary carbides’ behavior was not studied by Xie. Moreover, most researchers have ediscussed the characteristics of primary carbides from a two-dimensional perspective [16,17,18,19,20]. Few researchers have systematically studied the characteristics of the primary carbides in H13 steel from the three-dimensional perspective. Therefore, we studied the effect of Ti content on primary carbides’ behavior in H13 steel by comparing the two-dimensional and three-dimensional characteristics of the primary carbides, especially with respect to primary carbides’ size in H13 steel. It is hoped that this research work can provide a guide for the effective control of Ti content in H13 steel.

2. Materials and Methods

Experimental H13 ingots with a weight of about 2 kg were manufactured in a vacuum induction furnace (Jinzhou Santai Electric Furnace Factory, Jinzhou, China). Pure iron (99.99%), Si (99.5%), Mn (99.25%), Cr (99.69%), Mo (99.99%), V–Fe (51.84% V and 46.56% Fe), and Ti (99.5%) were added into an MgO crucible. When the vacuum reached 10 Pa, heating of the alloy began. After the alloy was melted, the temperature of the molten steel was kept at 1600 °C for 5 min to homogenize its composition. The molten steel was cast into a cast-iron model. The obtained H13 ingot was stripped and air-cooled to room temperature after 10 min. The experimental composition of all H13 ingots as the same, except for their Ti content. The chemical composition of the H13 ingots is shown in Table 1. The chemical composition was determined at the National Analysis Center for Iron and Steel (NCS Testing Technology Co., Ltd., Beijing, China). The chemical composition of all samples was basically the same, except for the Ti content. The Ti content in the samples varied from 0.011 to 0.036 wt.%. Two samples for each H13 ingot with a size of 10 mm × 10 mm × 10 mm were taken along the centerline of the H13 steel ingots to observe the morphology of the last-to-solidify region and obtain the three-dimensional (3D) characteristics of the primary carbide.
An optical microscope (DM4M, Leica Co., Wetzlar, Germany) was used to investigate the matrix structure of the samples after being etched for approximately 1 min at 70–80 °C with an alcohol solution containing 4% nitric acid (volume fraction). ImageJ software was used to measure the last-to-solidify region size with a mean linear intercept method. The morphology and type of the inclusions in the samples were analyzed through a scanning electron microscope (SEM) (FEI Quanta-250; Hillsboro, OR, USA) equipped with an energy dispersive spectroscope (EDS) (XFlash 5030; Bruker, Germany). Moreover, an automatic inclusion analysis system (EVO18-INCA steel, Oberkochen, Germany) was used to analyze the two-dimensional (2D) characteristics of the inclusions, including their size, composition, shape, and number density, in the samples. The statistical area was 4 mm × 4 mm. The minimum size of the inclusions was 1 μm. A non-aqueous electrolysis method was used to investigate the 3D morphology of the primary carbides and determine the comprehensive characteristics of the primary carbides in the samples. the primary carbides were partially extracted from the sample matrix, and the extracted area was 10 mm × 10 mm. The electrolyte was composed of 1% tetramethylammonium chloride, 10% acetylacetone, and 89% methanol (value fraction). The electrolysis voltage was 20 V, and the electrolysis time was 300 s. At least 100 primary carbides were observed in each sample by 3D observation with SEM and EDS to determine their number density and size. Finally, the Thermo-Calc 2017b software (Foundation of Computational Thermodynamics (STT), Stockholm, Sweden) was used to understand the precipitation mechanism of the primary carbides and the mechanism by which the Ti content influenced the primary carbides’ behavior.

3. Results

3.1. Matrix Structure

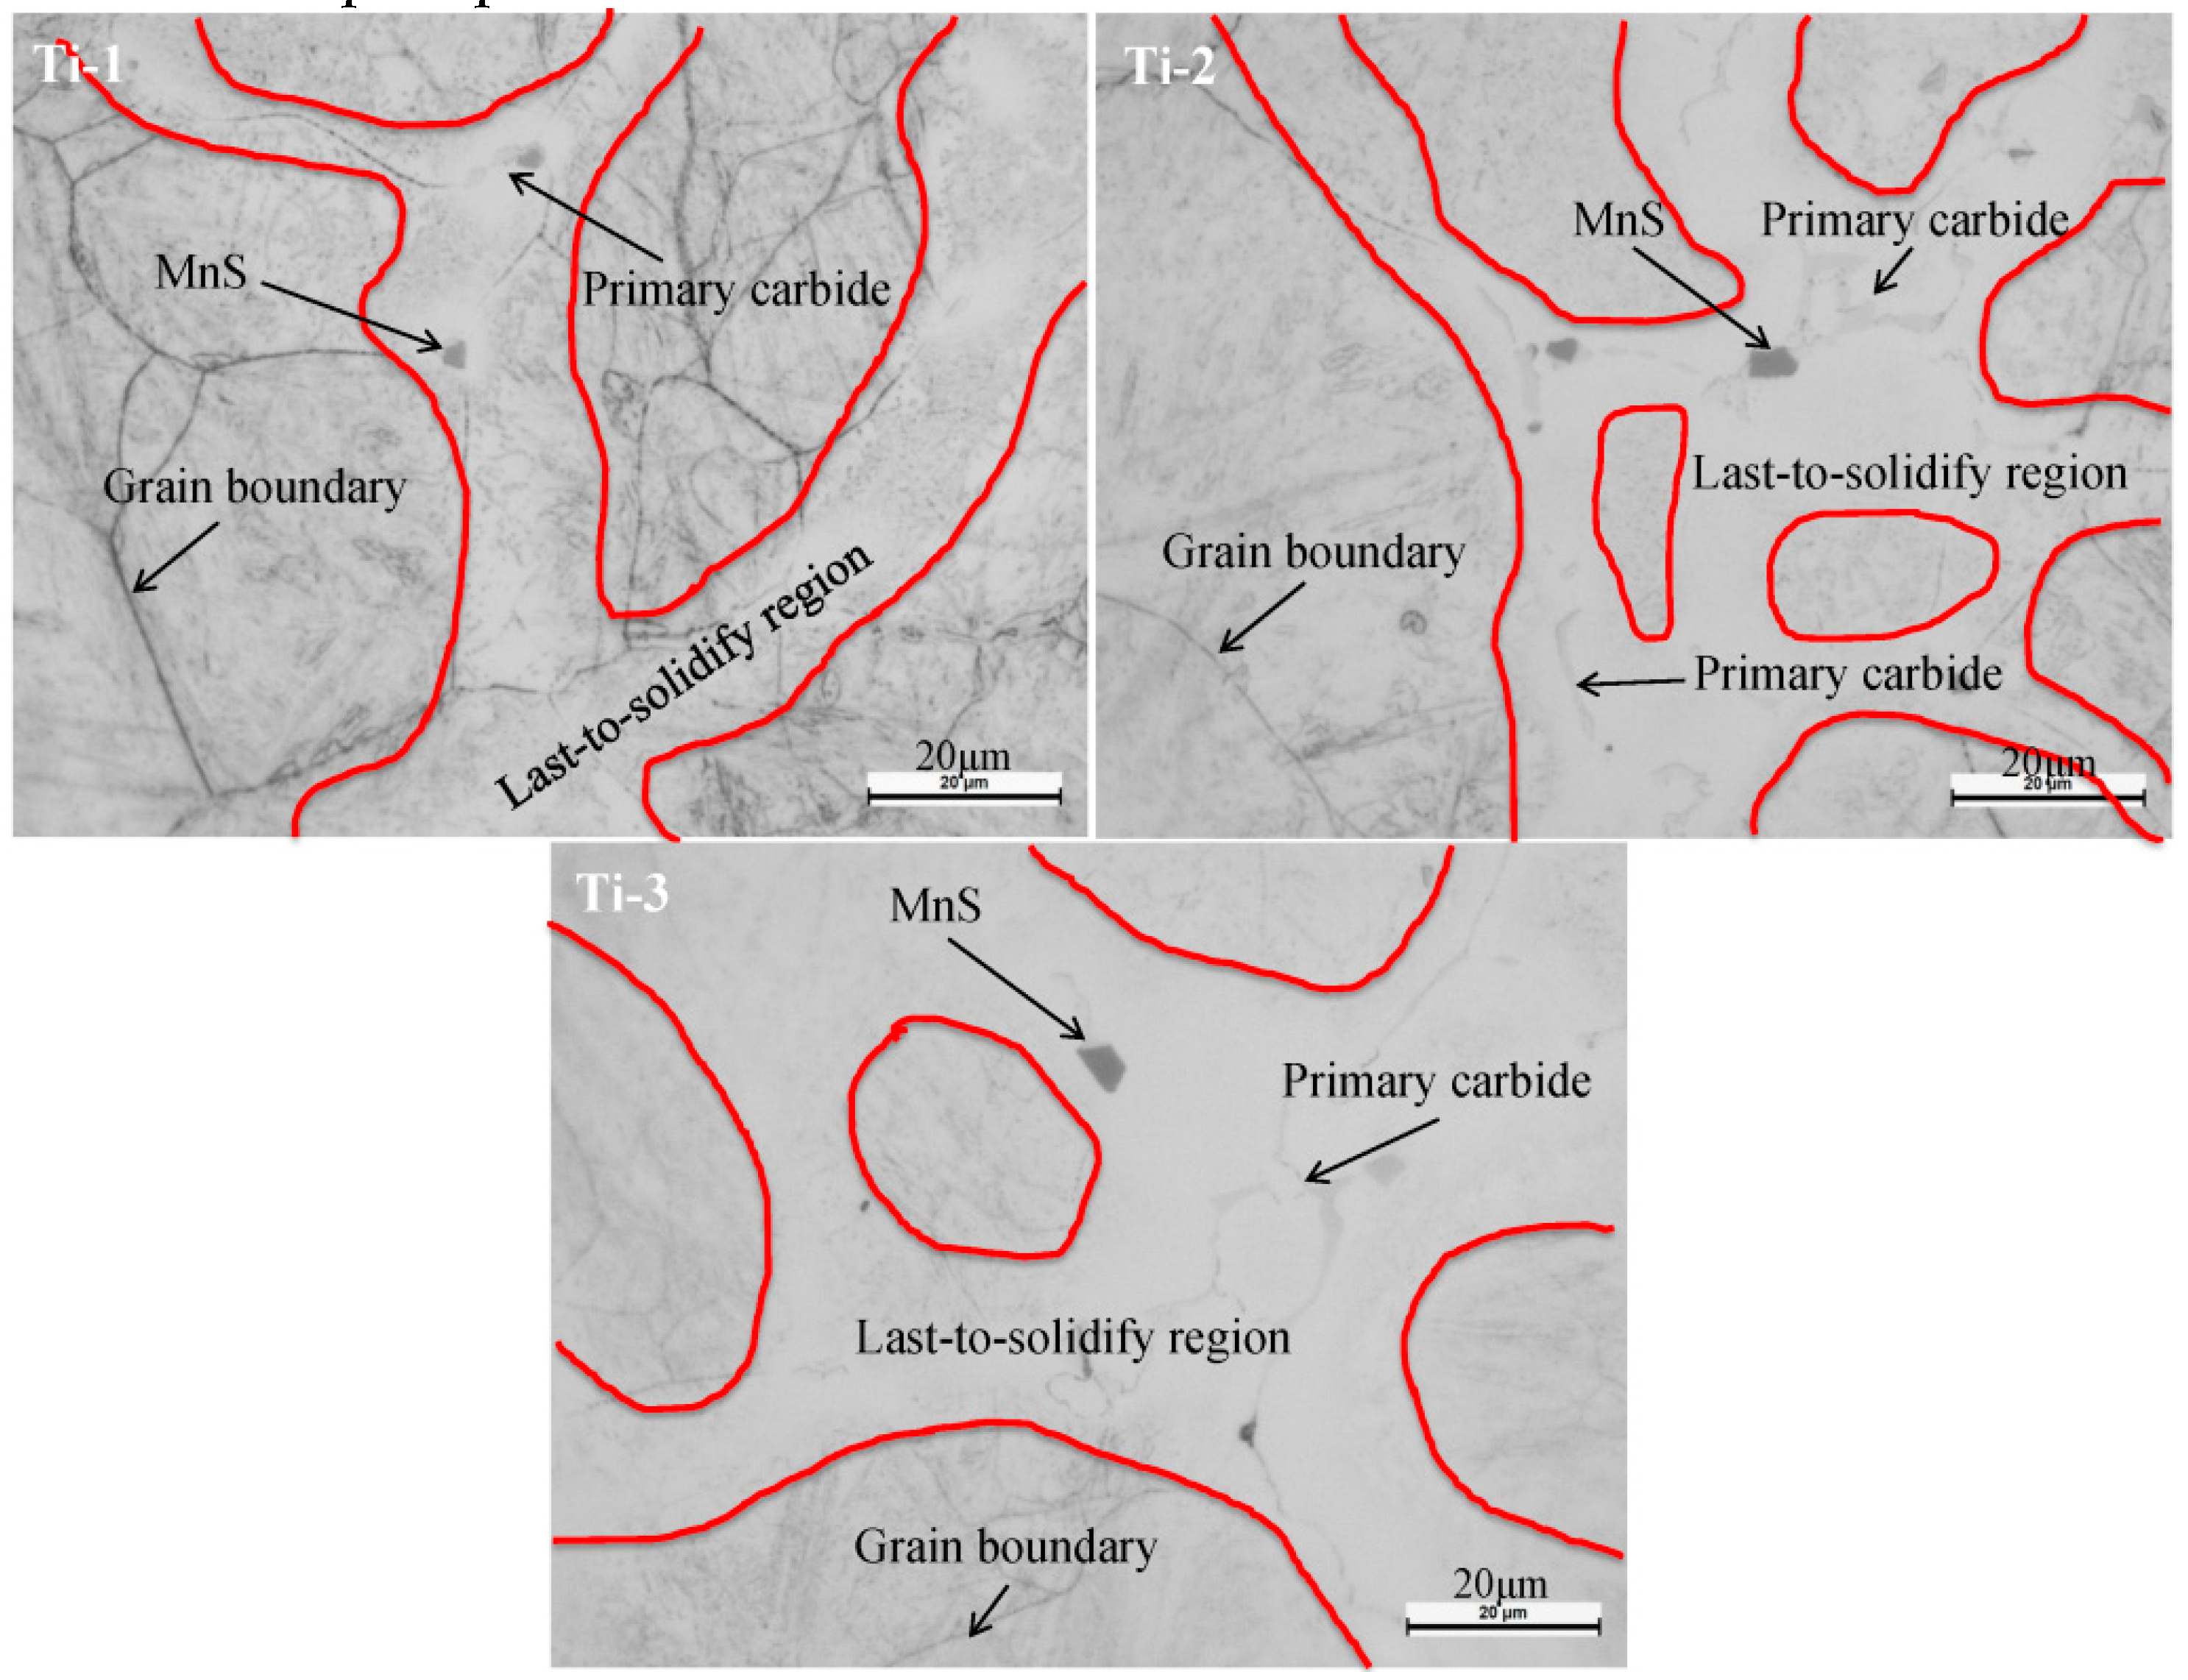
Figure 1 shows the matrix structure of the samples with different Ti content. The reticulated bright white area is the last-to-solidify region, and the gray area is the austenite. The matrix structure was the same for all samples. Elemental Cr, Mo, V, and C were rejected from the liquid and could be present in relatively high content in the final solid that formed along the solidification boundaries because of the different solubility of the alloy elements in the solid and liquid phases coexisting in the mushy region [23,24]. Since the alloying content in the last-to-solidify region was larger than in the matrix, leading to a higher resistant corrosion ability, the last-to-solidify region network appeared bright white under an optical microscope.
Figure 2 shows the locations of the precipitated inclusions in the samples observed by an optical microscope at 1000 magnification. Large amounts of MnS inclusions (black area) and primary carbides (gray area) were found in the last-to-solidify region. The last-to-solidify region coincided with the grain boundaries. Therefore, the segregation of the alloy elements in the last-to-solidify region during solidification resulted in the precipitation of MnS inclusions and primary carbides. We previous found that the enrichment of elemental Cr, Mo, V, and C in the last-to-solidify region is the main reason for the precipitation of primary carbides in H13 ingots, which is consistent with the above theoretical analysis [25]. Moreover, the Ti content has little influence on the matrix structure and the location of the precipitated inclusions.
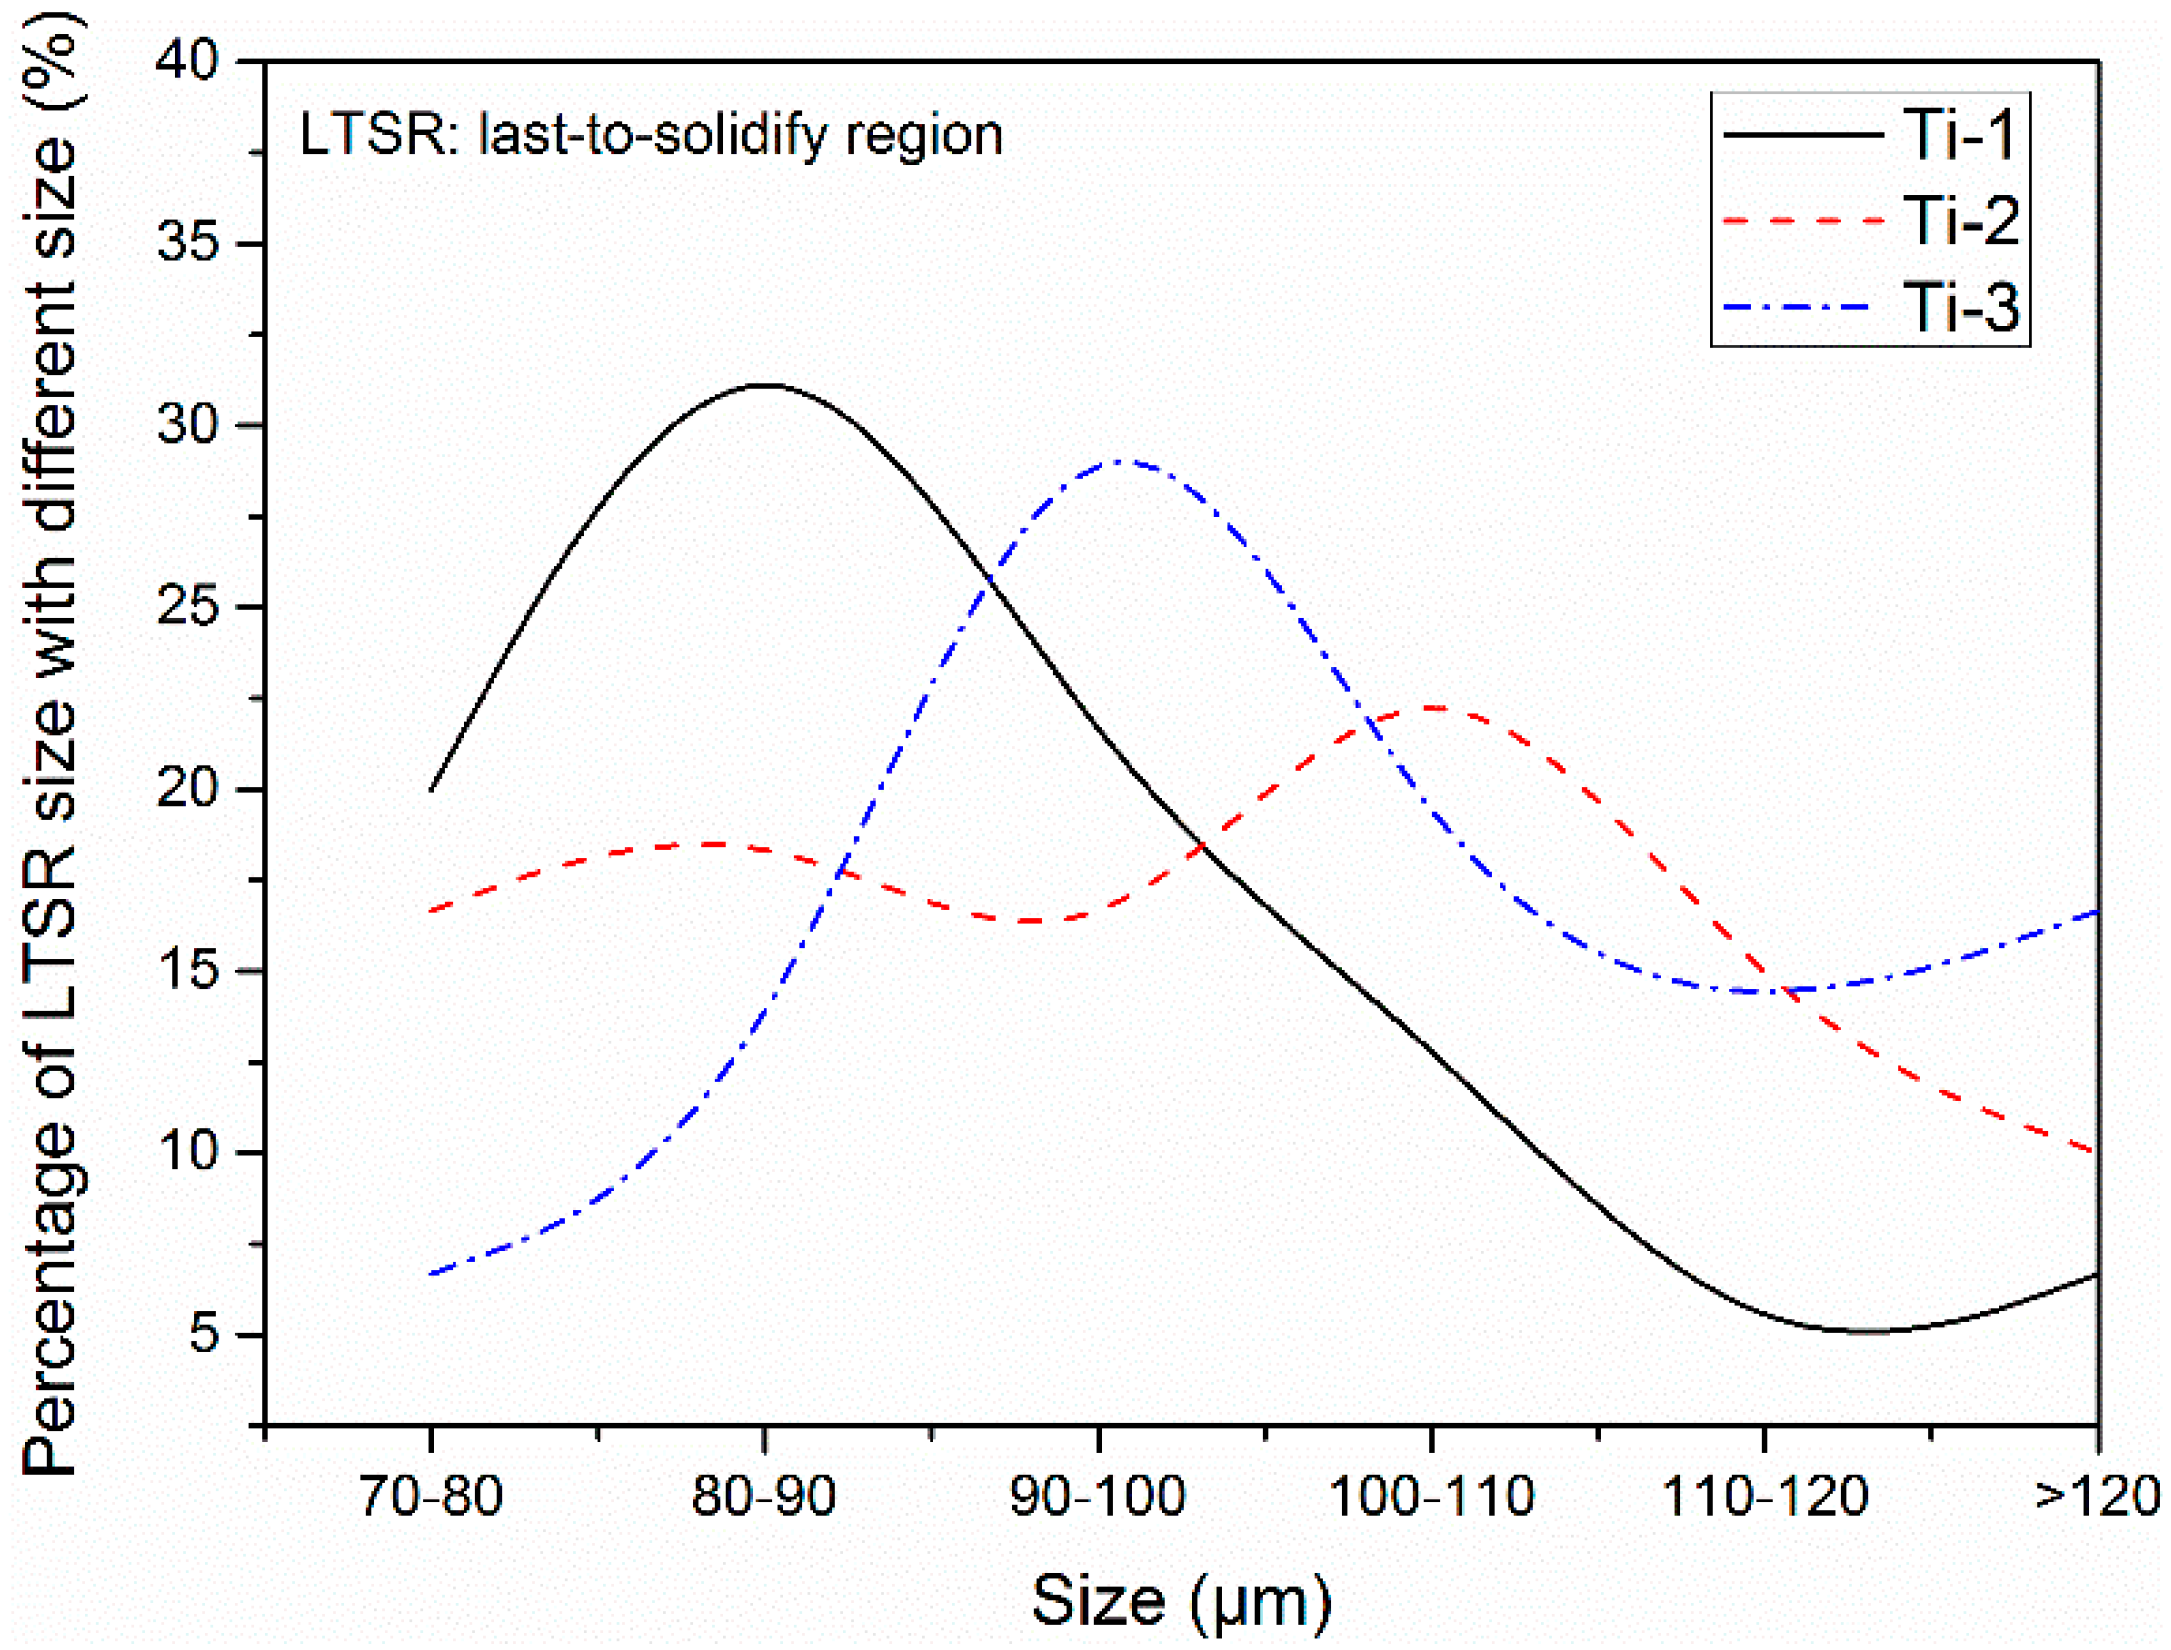
Figure 3 shows the variation of Ti content with the last-to-solidify region size. The size of the last-to-solidify region in the Ti-1 sample was mainly 80–90 μm. The size of the last-to-solidify region in the Ti-3 sample was mainly 90–100 μm. As the Ti content increased, the size of the last-to-solidify region gradually increased, especially the area with a size larger than 120 μm. According to the principles of nucleation and growth of new crystals during solidification, the size of the last-to-solidify region is that of the original austenite grain. The mechanism by which the Ti content influences the original austenite grain size needs to be further analyzed.

3.2. Two-Dimensional Characteristics of the Inclusions in the Samples

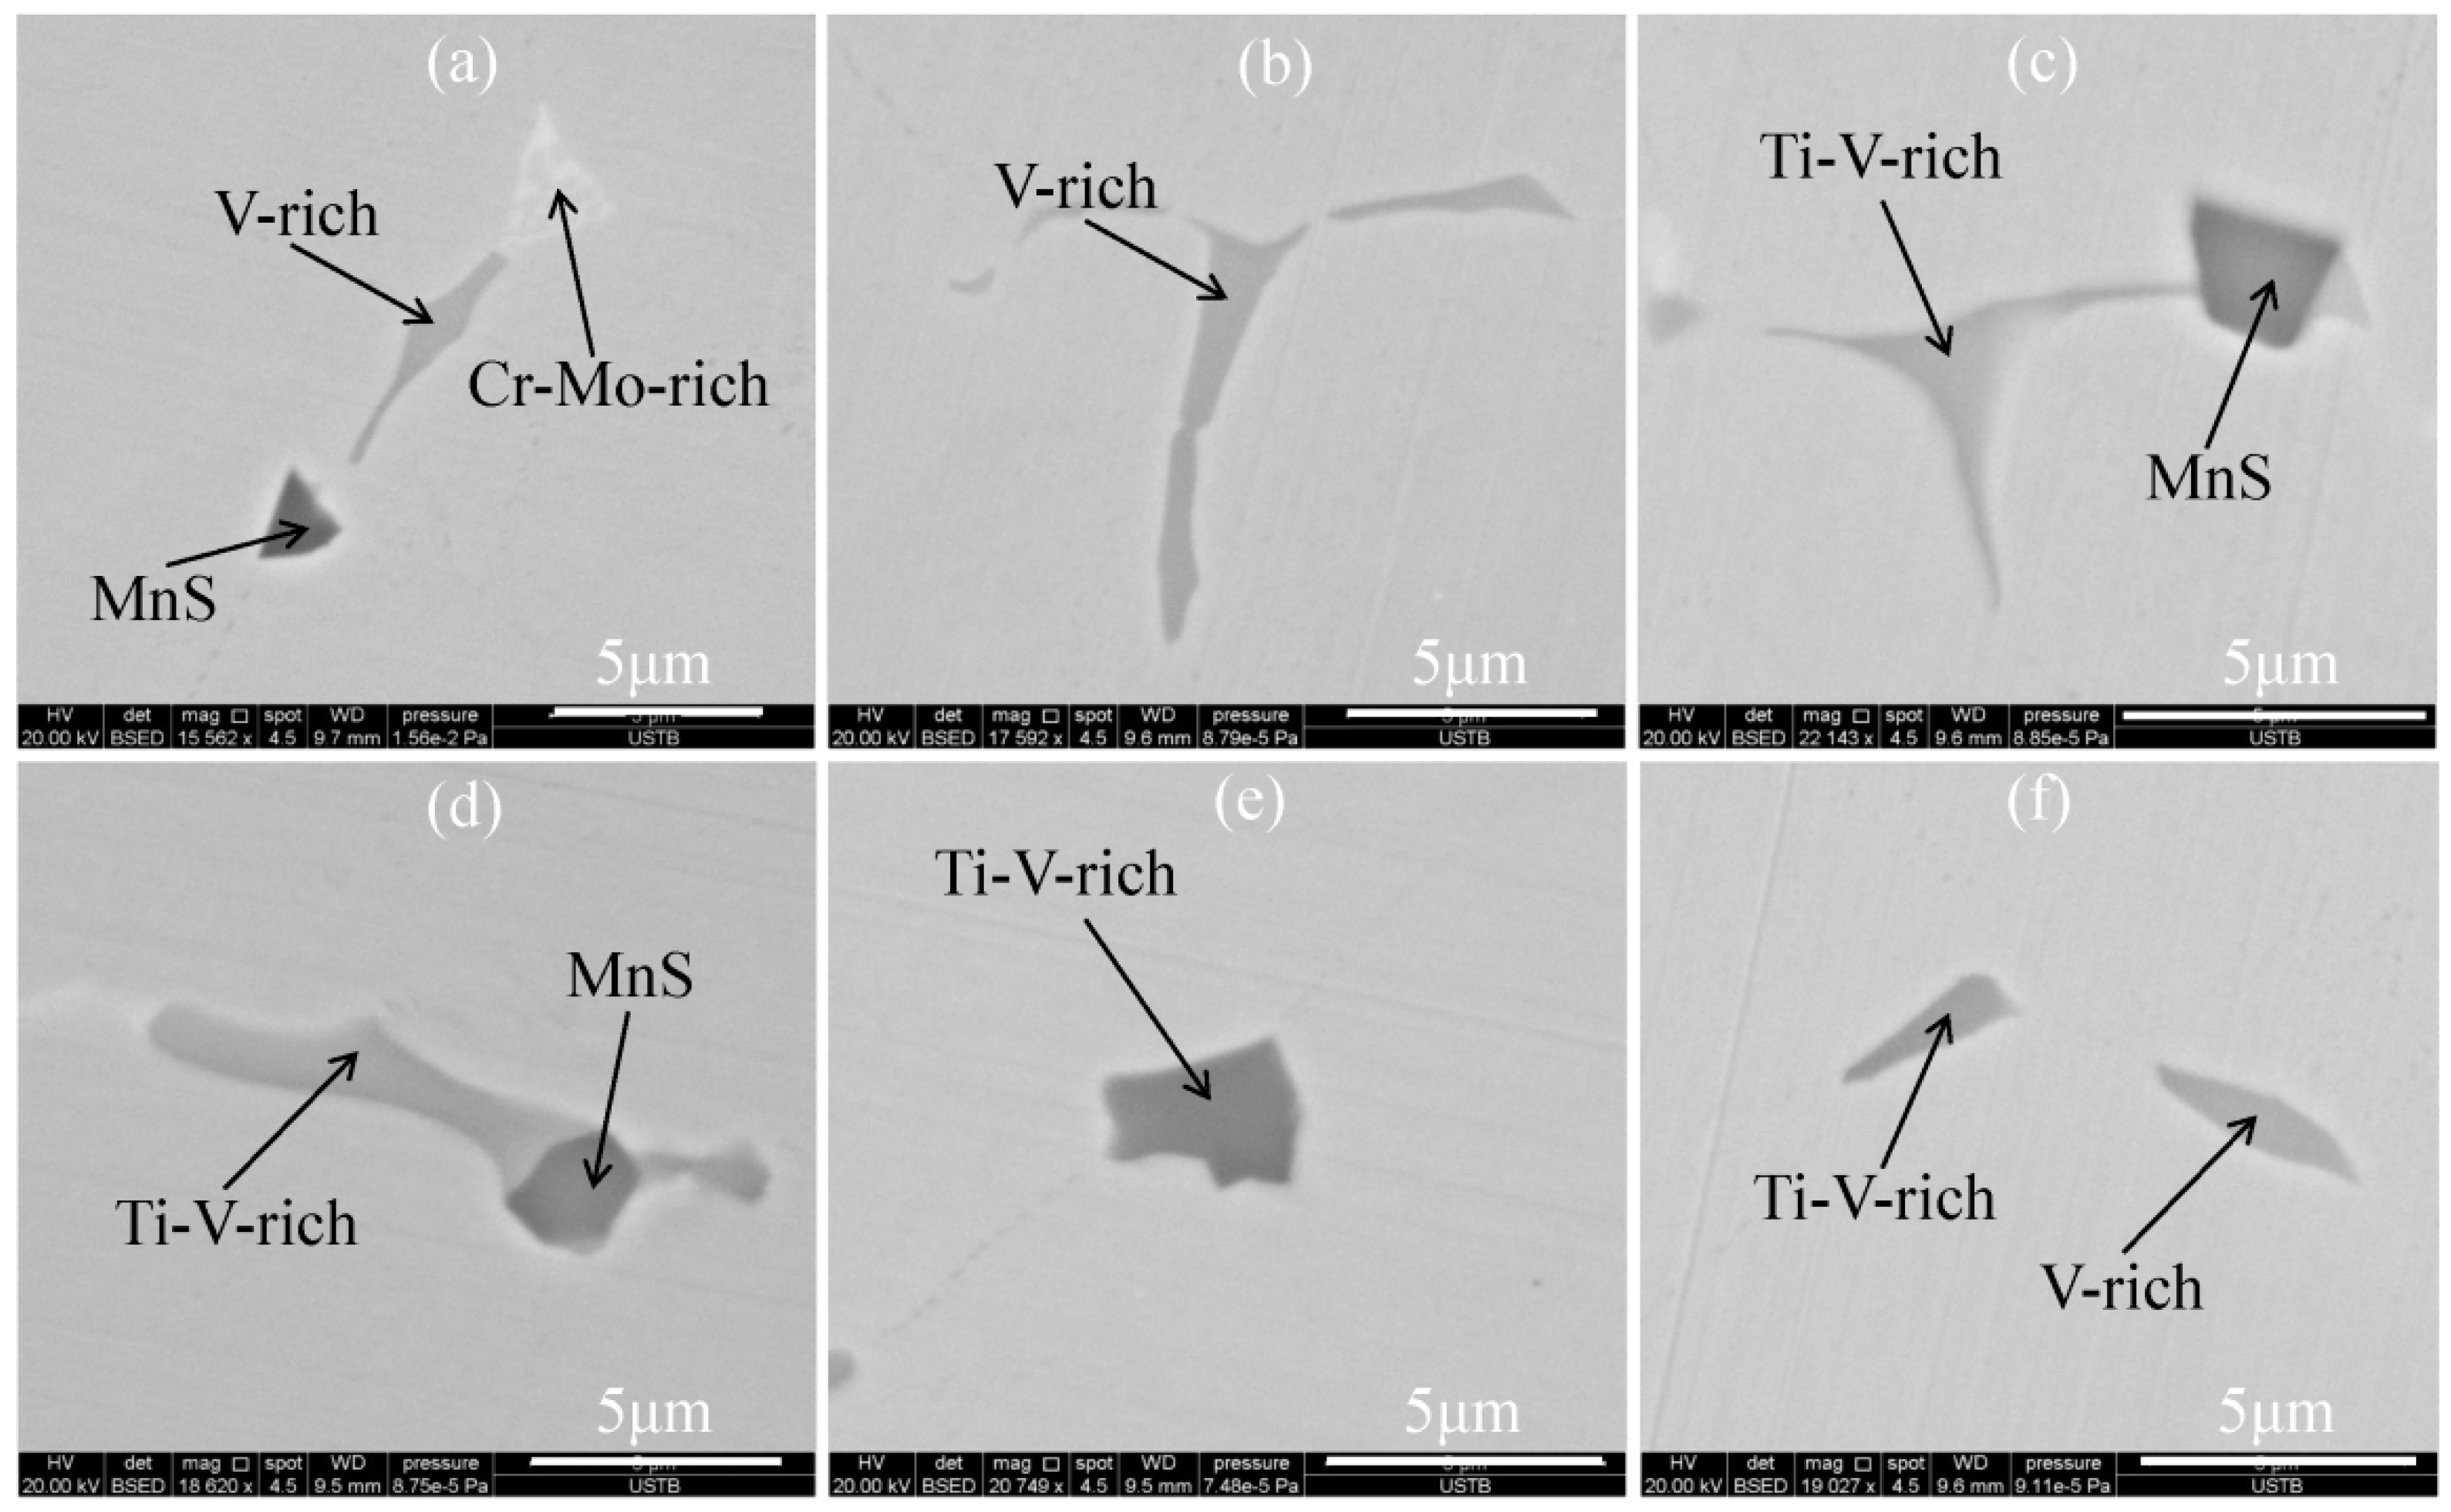
The samples contained the same types of inclusion, whose specific morphology and composition are shown in Figure 4. The typical inclusions were classified into four types: 1, V-rich carbide, shown by the gray area in Figure 4a,b,f; 2, Ti–V-rich carbide, shown in Figure 4c–f; 3, Cr–Mo-rich carbide, shown by the white area in Figure 4a; 4, MnS inclusion, shown by the black area in Figure 4a,c,d. The primary carbides, including the V-rich and the Ti–V-rich ones, appeared as strips, and their size was approximately 10 μm. The primary carbides were present either alone or in combination with MnS. After MnS, Ti–V-rich carbide, and V-rich carbide formed at the front of the solid–liquid interface, MnS and the primary carbides were pushed to the last-to-solidify region, as the crystal continued to grow, possibly causing the aggregation of MnS and primary carbides. Therefore, the primary carbides were present either alone or in combination with MnS.
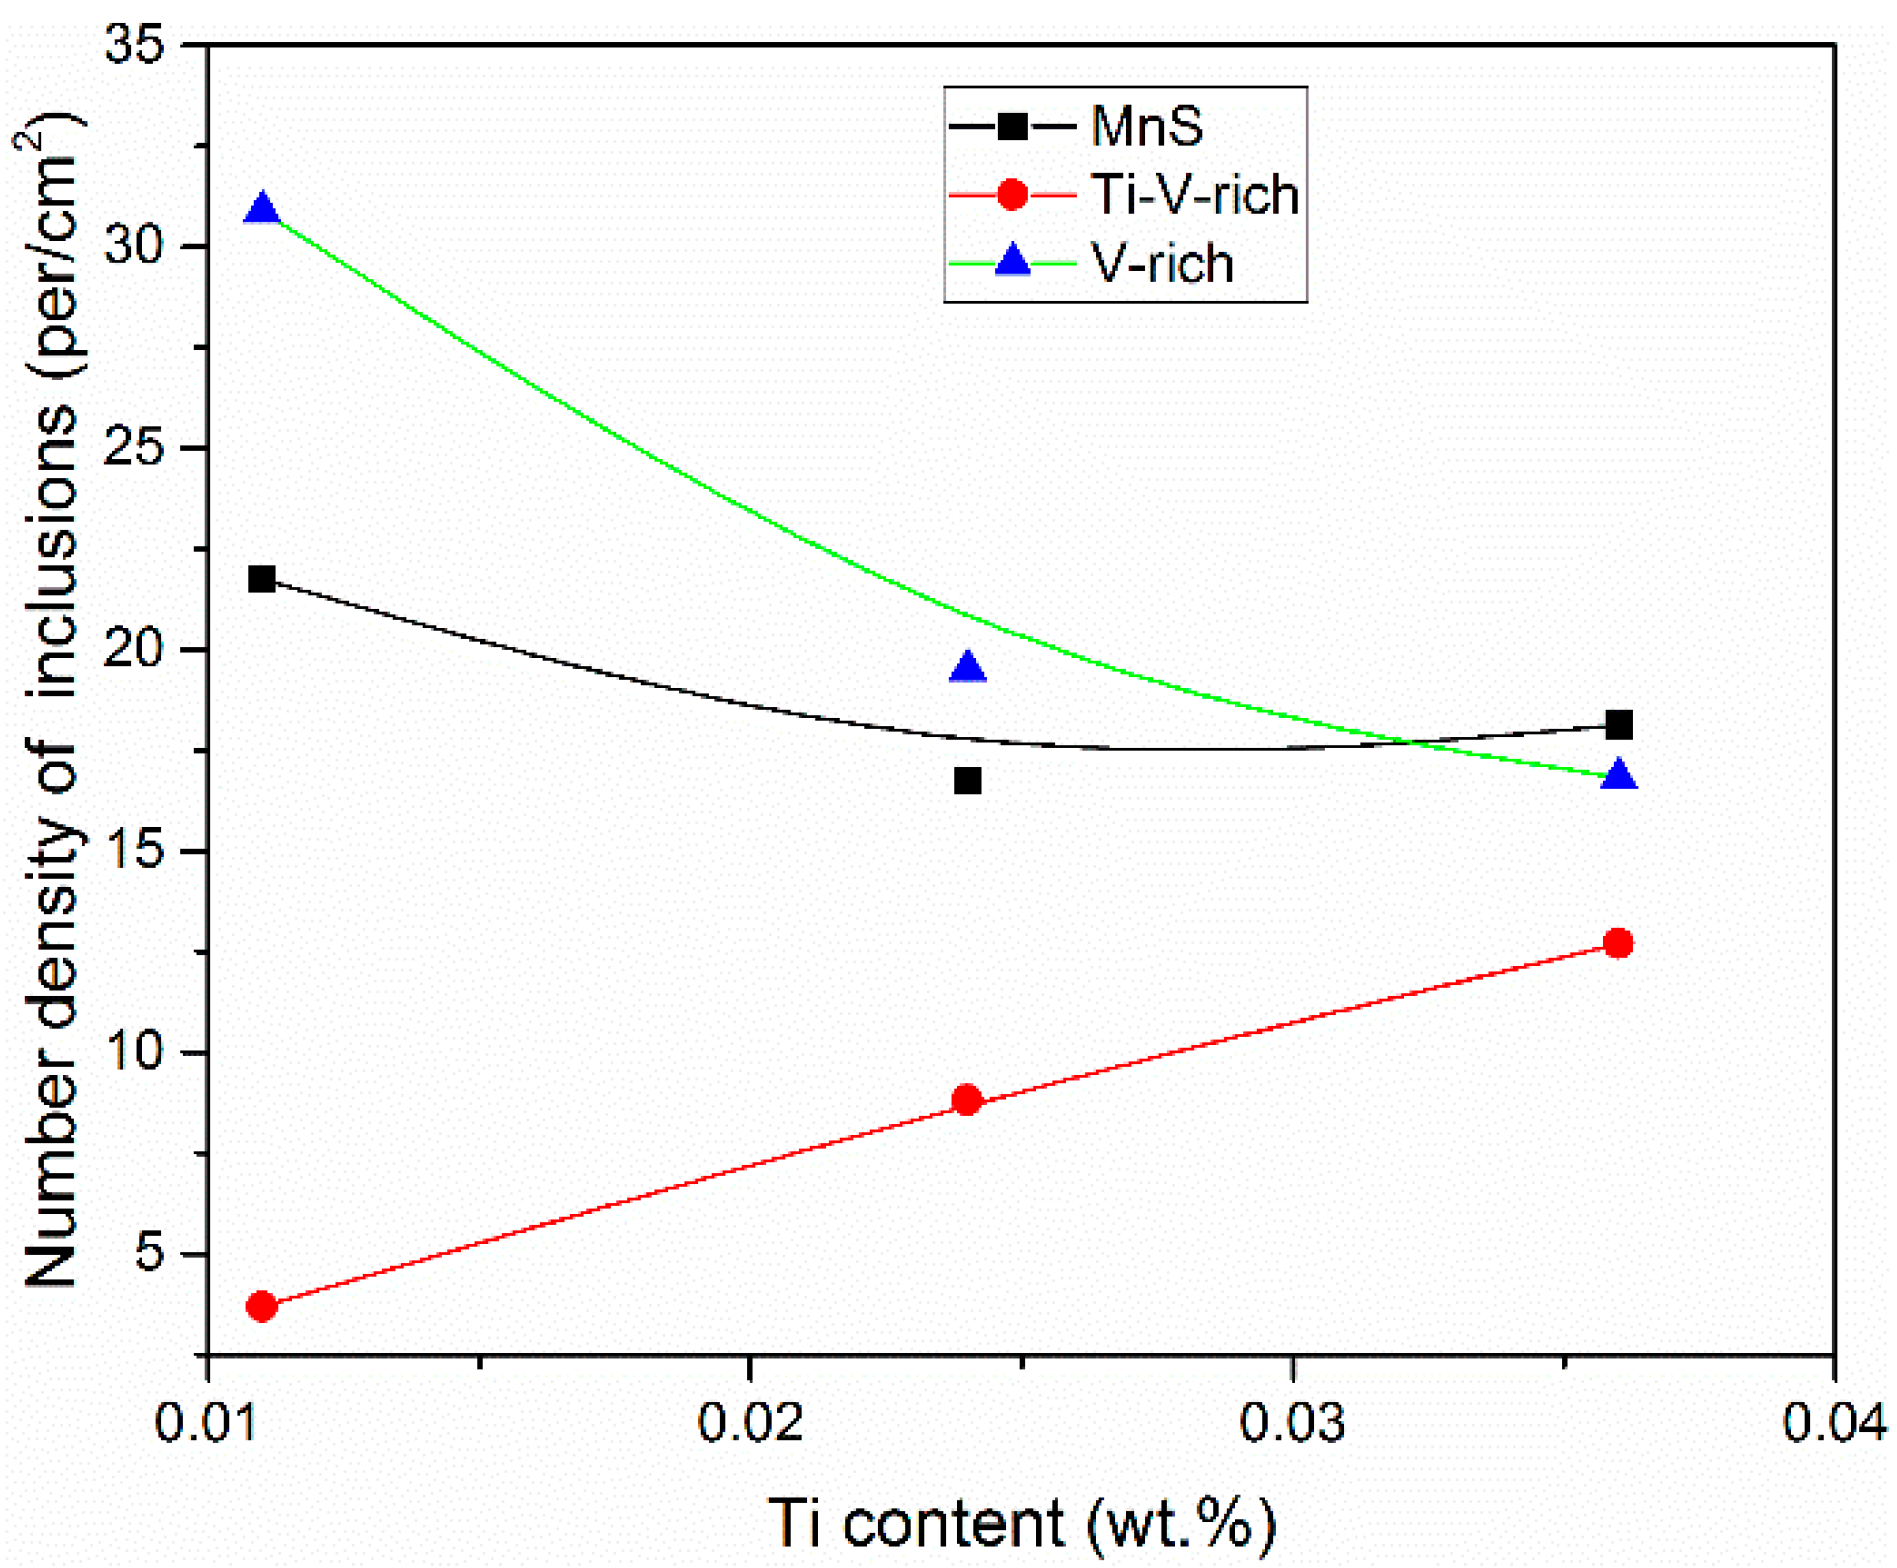
An automatic inclusion analysis system was used to obtain the 2D characteristics of the inclusions in the samples. Figure 5 shows the variation of Ti content with the number density of the inclusions in the samples. As the Ti content increased, the number density of the V-rich carbide decreased rapidly from 30.9 per/cm2 to 16.8 per/cm2; in contrast, the number density of the TiV-rich carbide increased from 3.7 per/cm2 to 12.7 per/cm2, and the number density of MnS decreased slightly. The main type of the inclusion gradually changed passing from the V-rich to the Ti-V-rich carbides with the increase of Ti content.
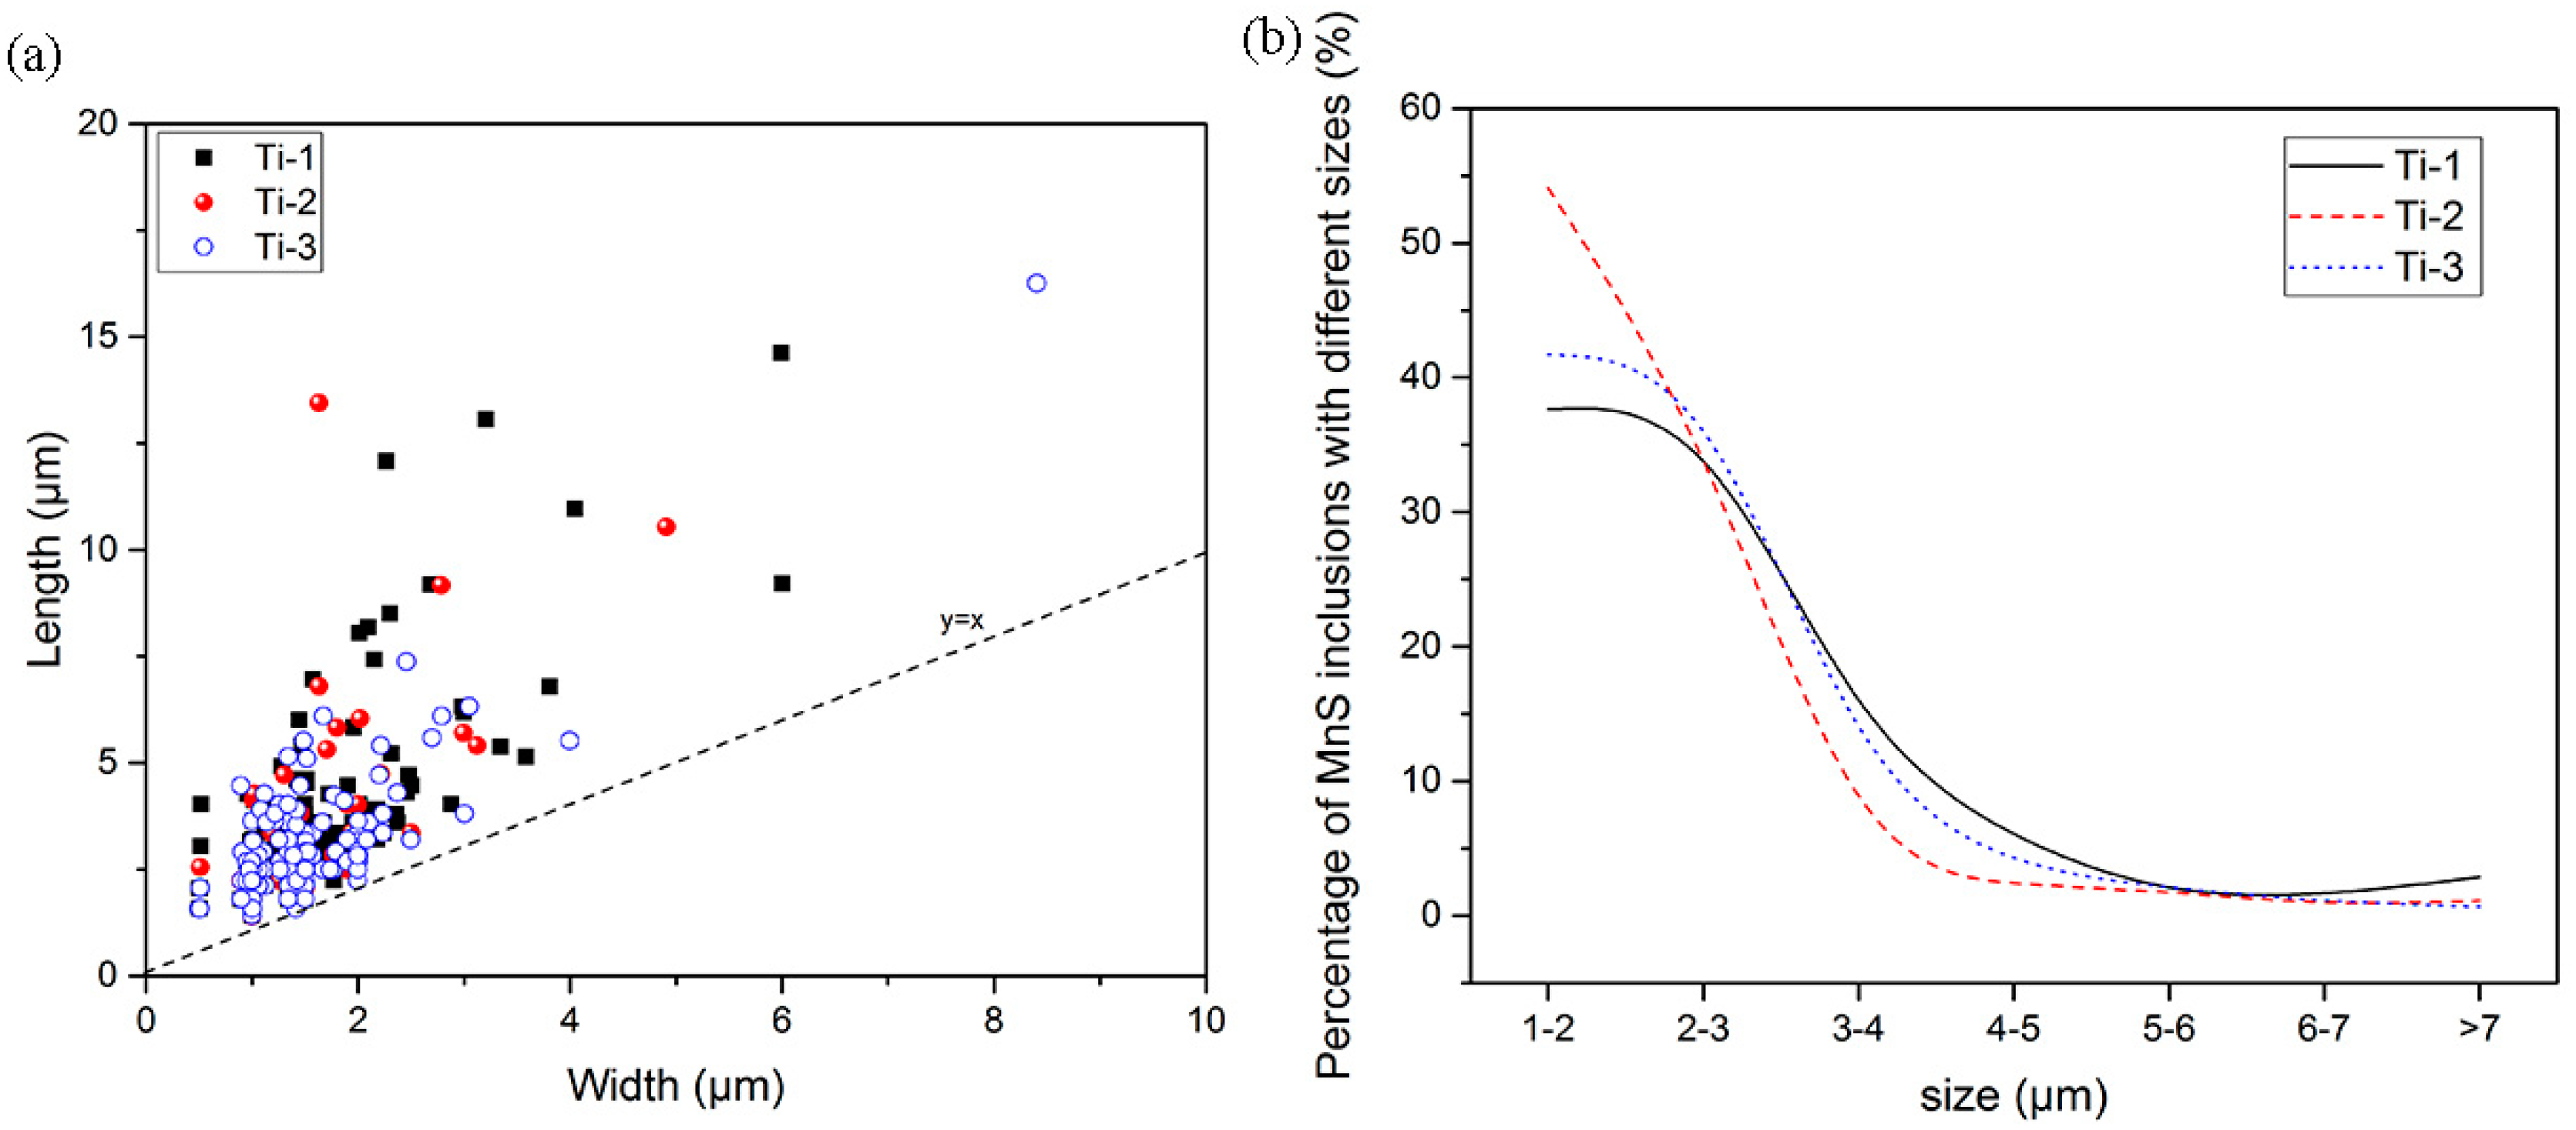
The aspect ratios and size of the MnS inclusions in the samples are shown in Figure 6. According to the results in Figure 6a, the Ti content had a little influence on the aspect ratio of the MnS inclusions. The aspect ratios in the samples were all larger than 1, which means the shape of the MnS inclusions was oblong. It can be seen from Figure 6b that the size of the MnS inclusions was smaller than 5 μm in all samples, and inclusions with a size of 1–2 μm were the most abundant. The Ti content had a little effect on the size distribution of the MnS inclusions.
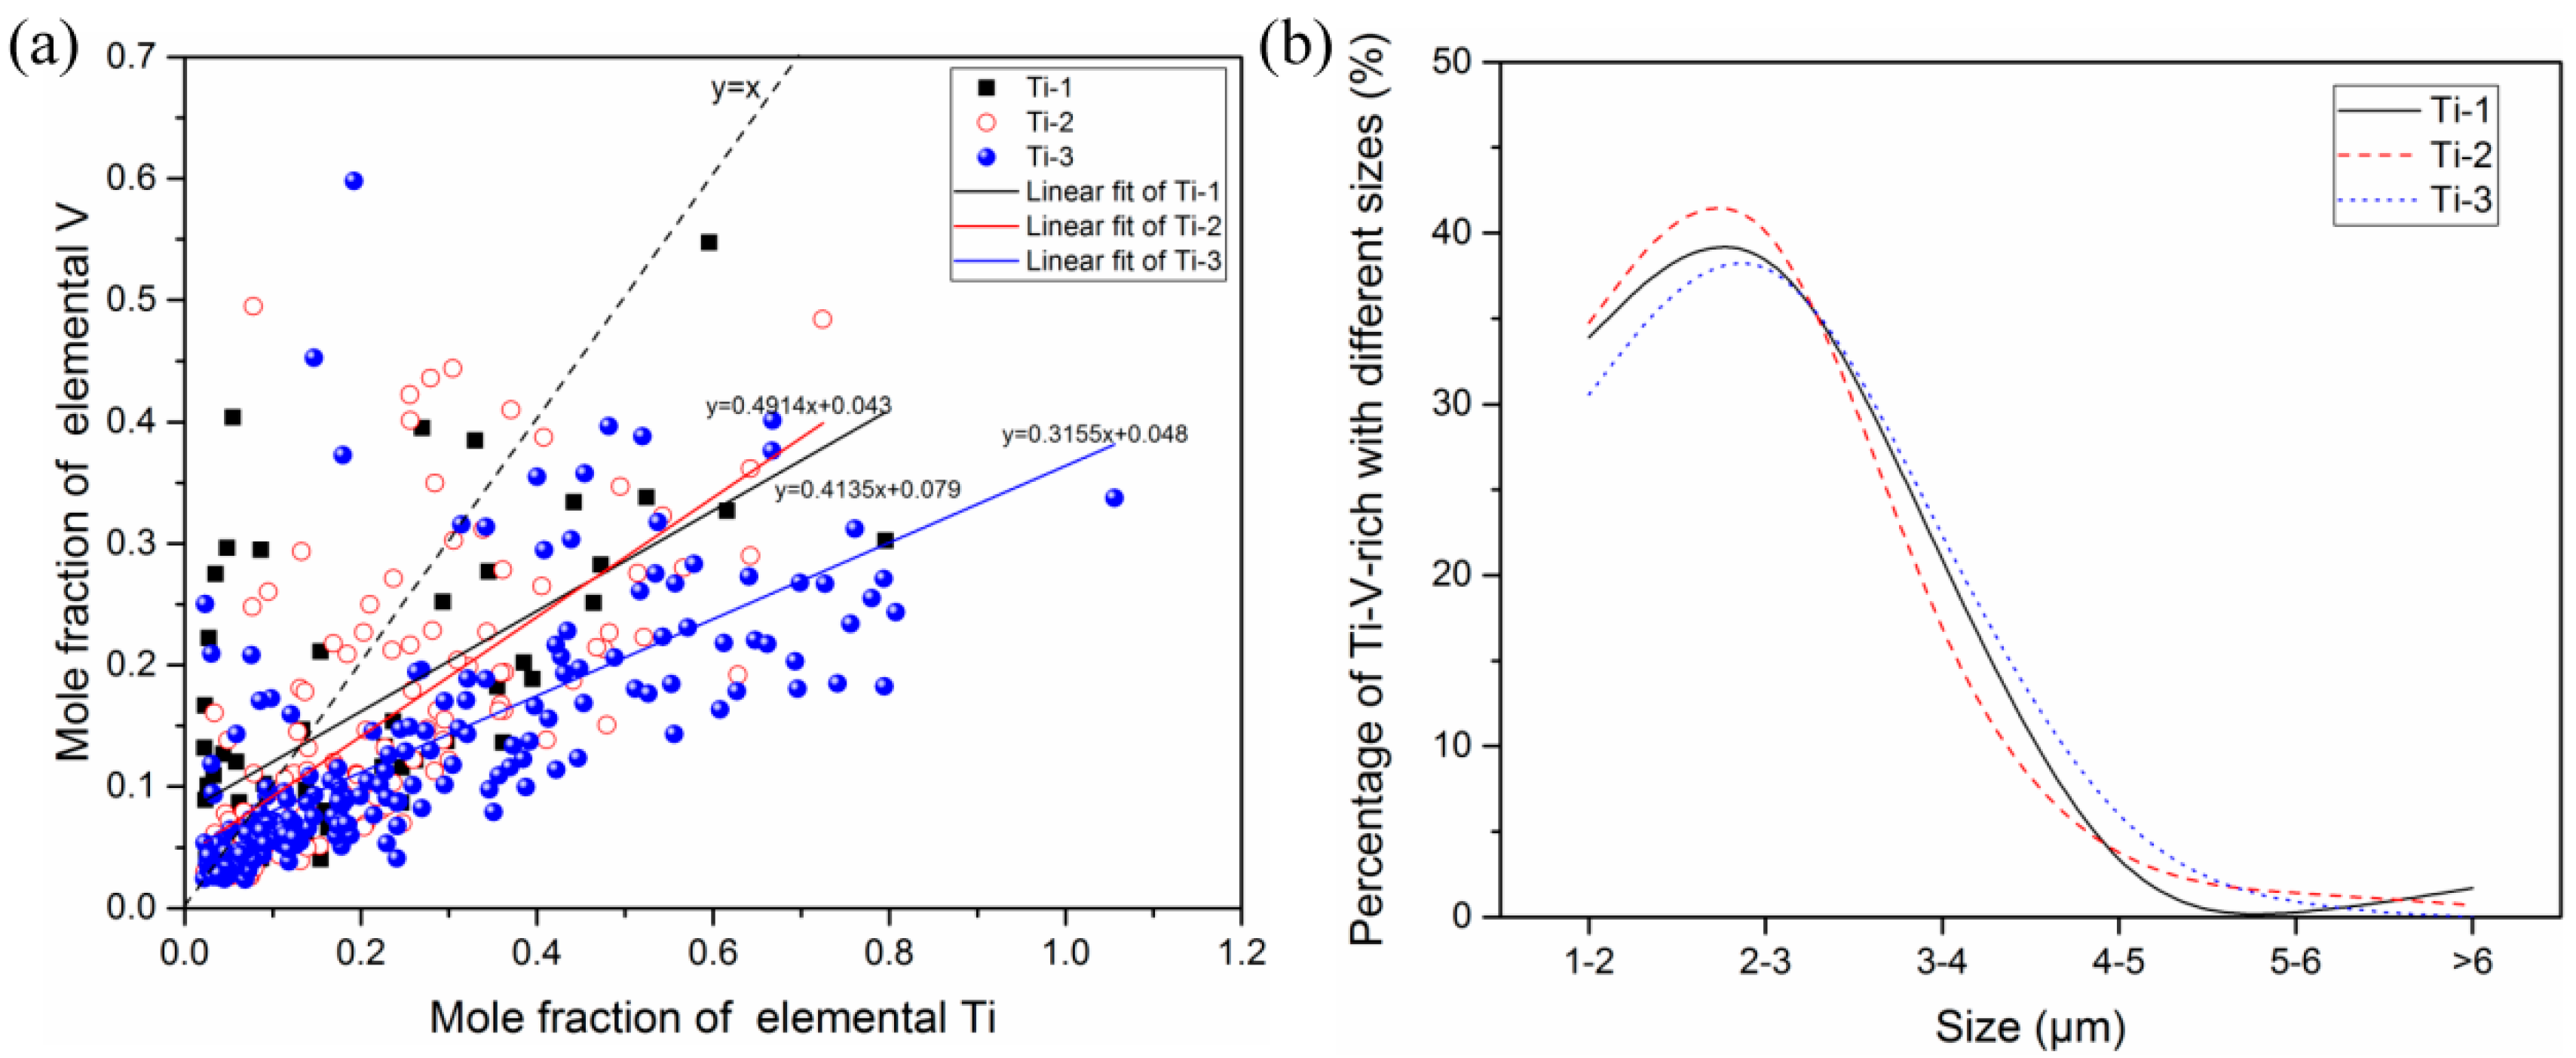
We obtained the composition of the Ti–V-rich carbide, especially for the Ti and V elements, and the results are shown in Figure 7a. The composition of the Ti–V-carbide carbide varied in different areas, so we performed a linear fit of the composition in different points. The slope of the Ti-1 and Ti-2 samples was not much different, while the slope of the Ti-3 sample was significantly lower than that of the Ti-1 and Ti-2 samples. Therefore, the mole fraction of elemental Ti in the Ti–V-rich carbide present in the Ti-3 sample was the highest. The reason for the varied composition in different points will be expounded in part 3.3. The size of the Ti–V-rich carbide inclusions in the samples as also mainly small (2–3 μm), and some coarse Ti–V-rich inclusions with a size larger than 6 μm were found. Changes in Ti content had a little effect on the size distribution of Ti–V-rich inclusions.
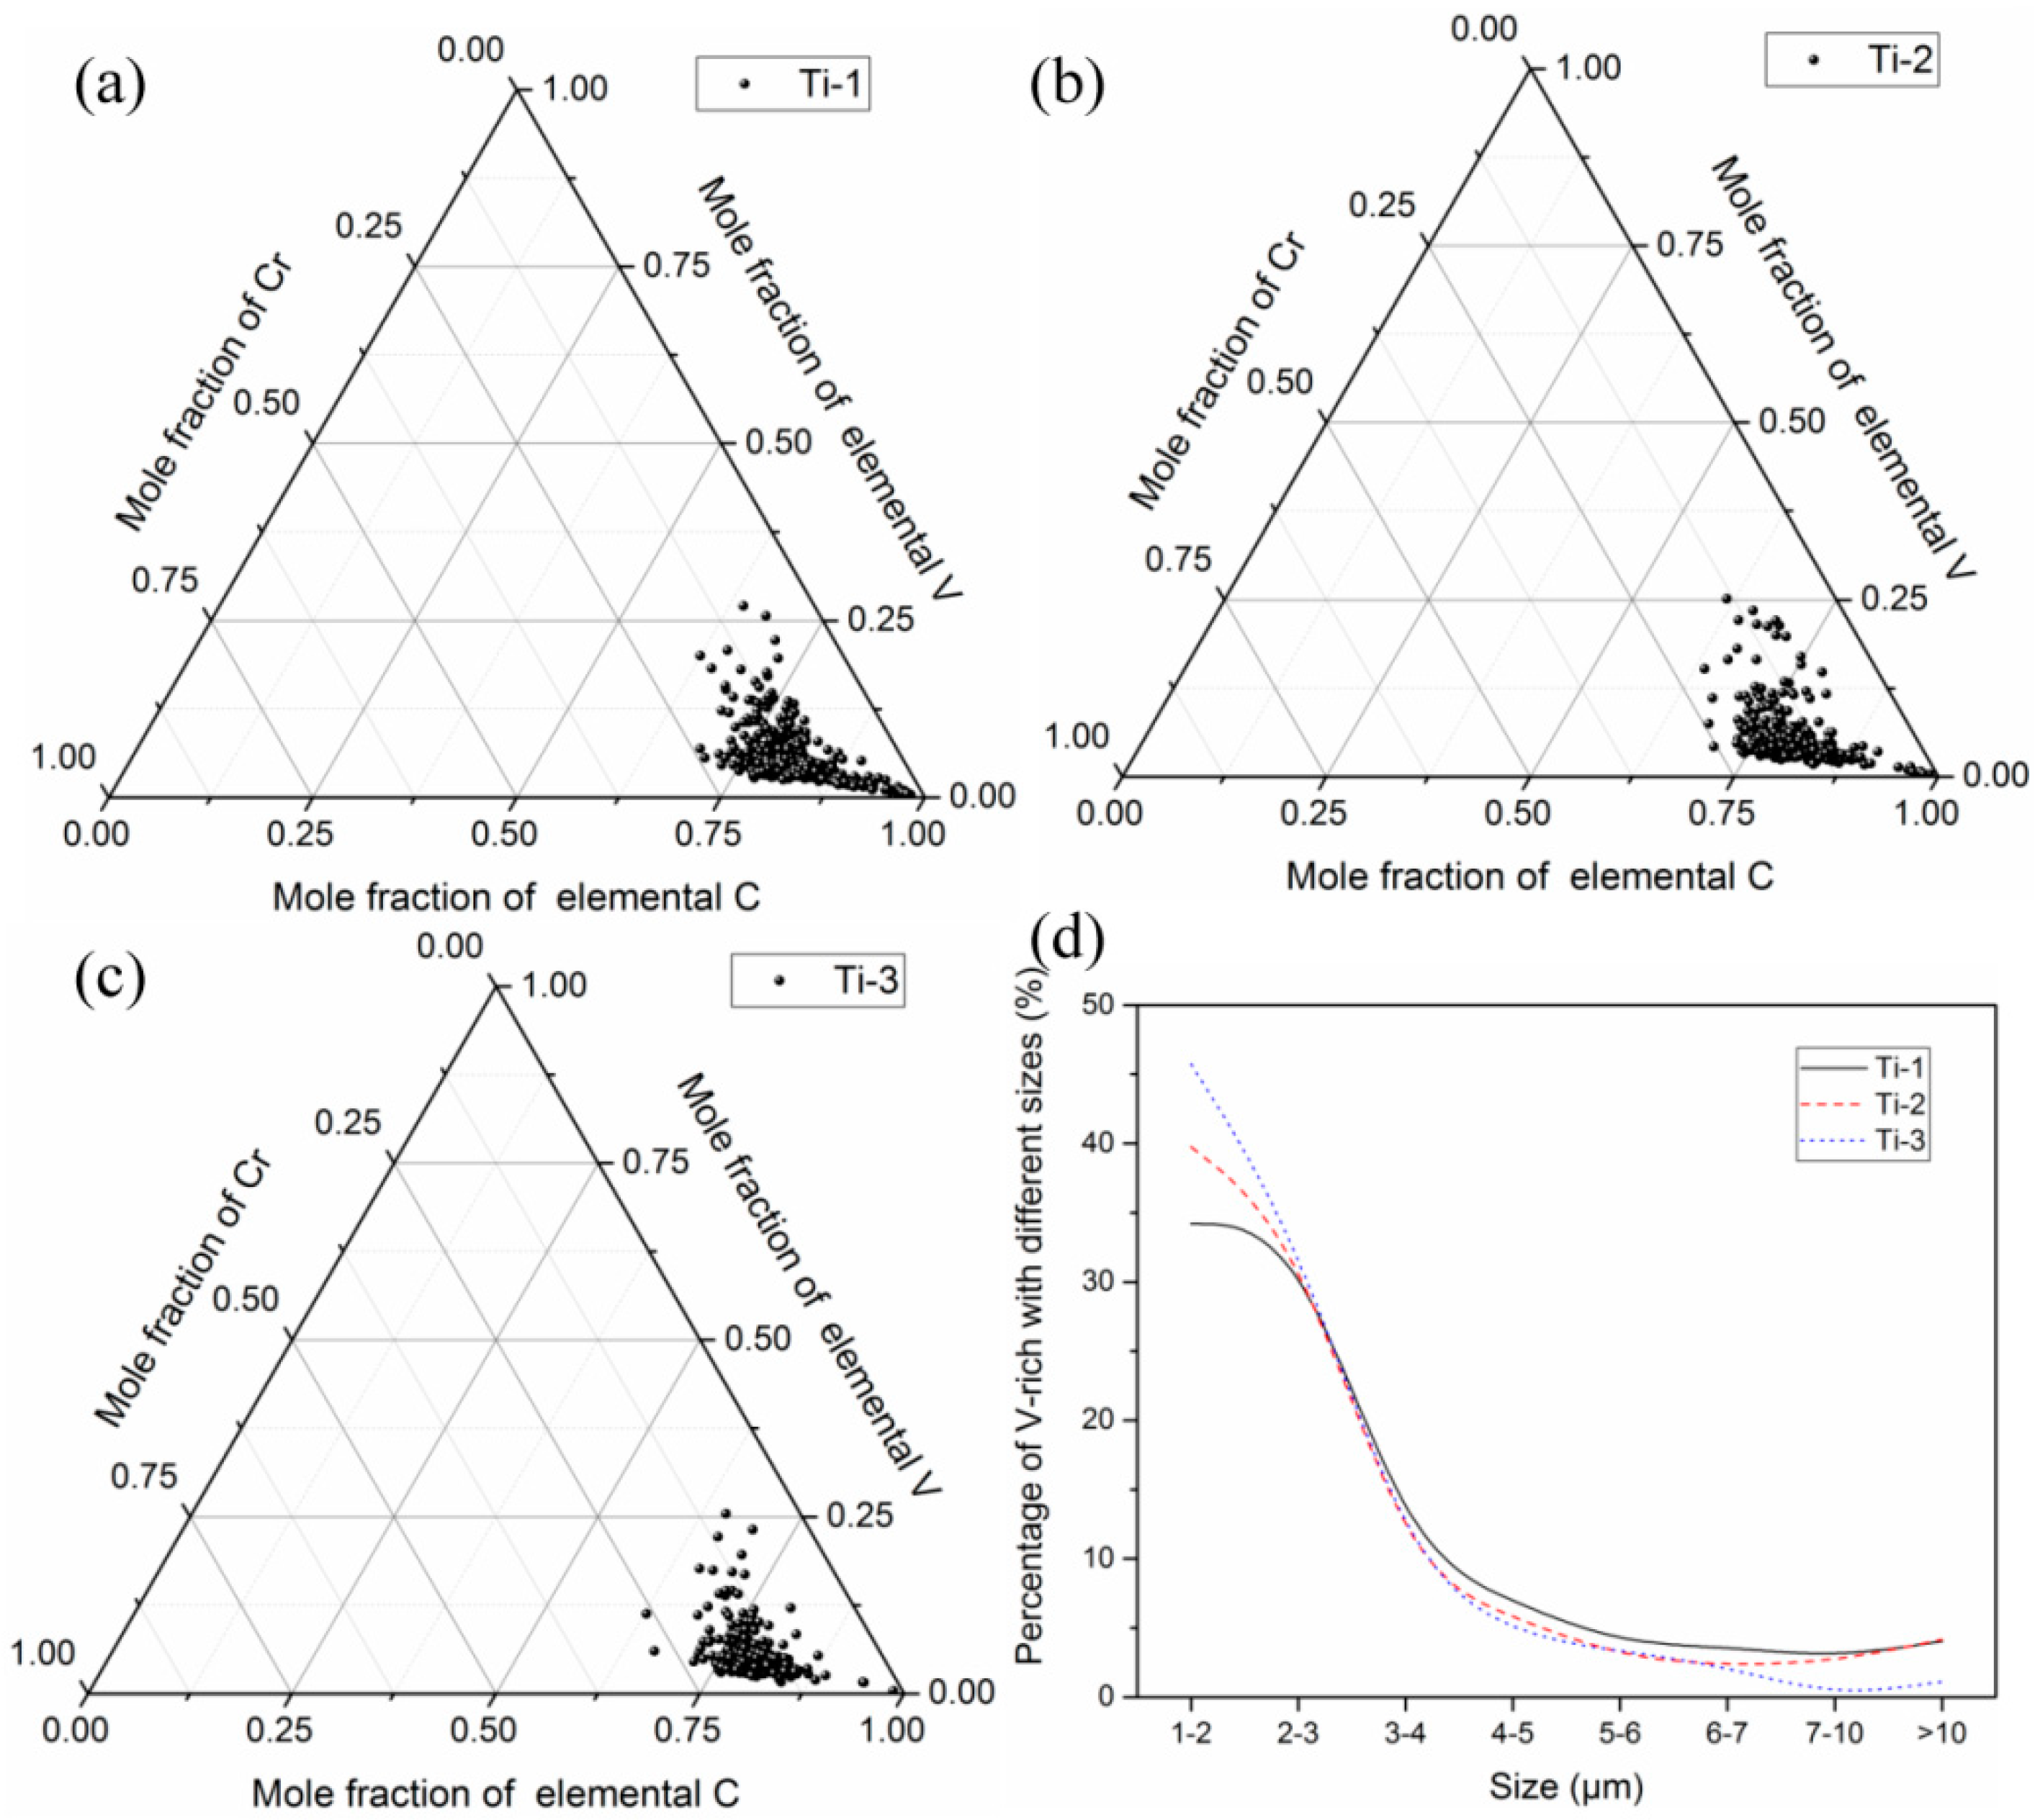
The composition and size of the V-rich carbide inclusions are shown in Figure 8. The composition of V-rich carbides in the samples was relatively homogeneous, and the Ti content had little influence on the composition of V-rich carbides. The size of the V-rich carbide inclusions in the samples was also mainly small, and the Ti content had little influence on the size distribution of V-rich carbide inclusions.

3.3. Three-Dimensional Characteristics of the Primary Carbides in the Samples

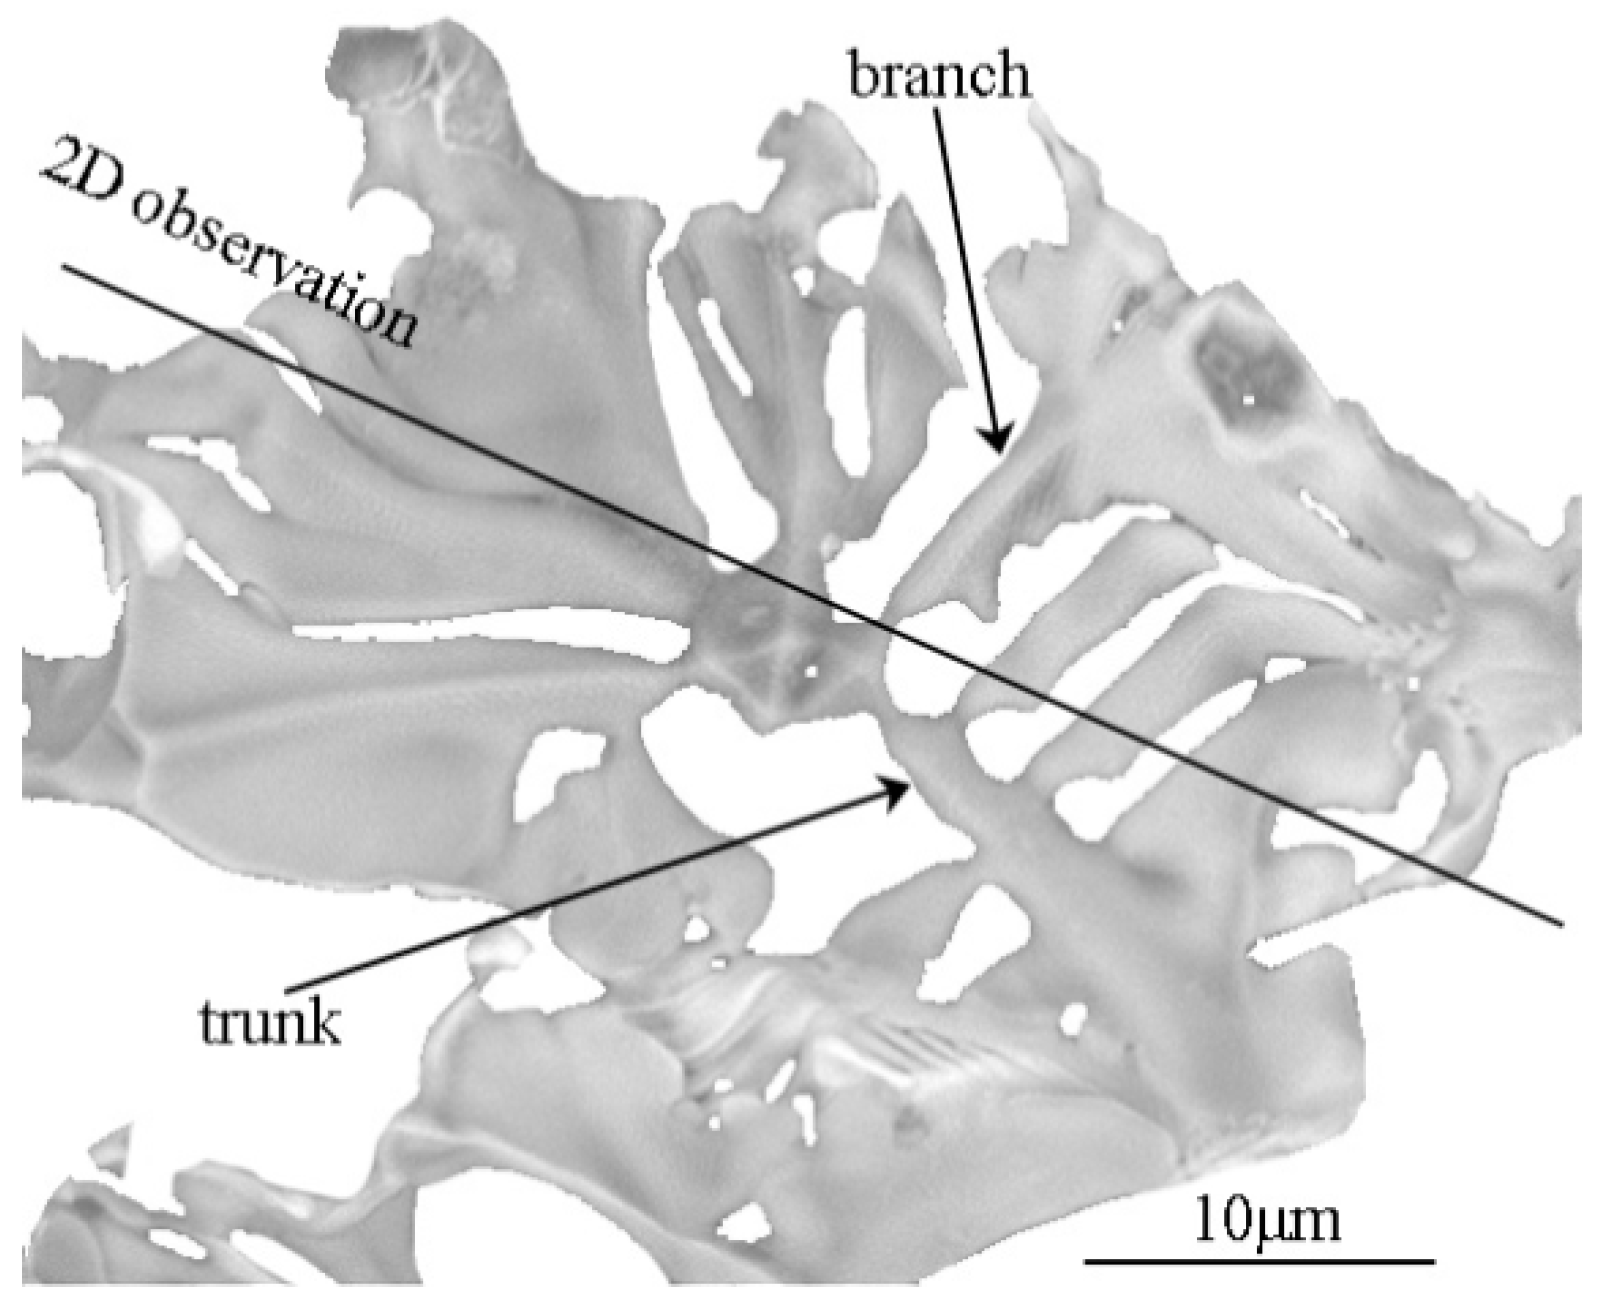
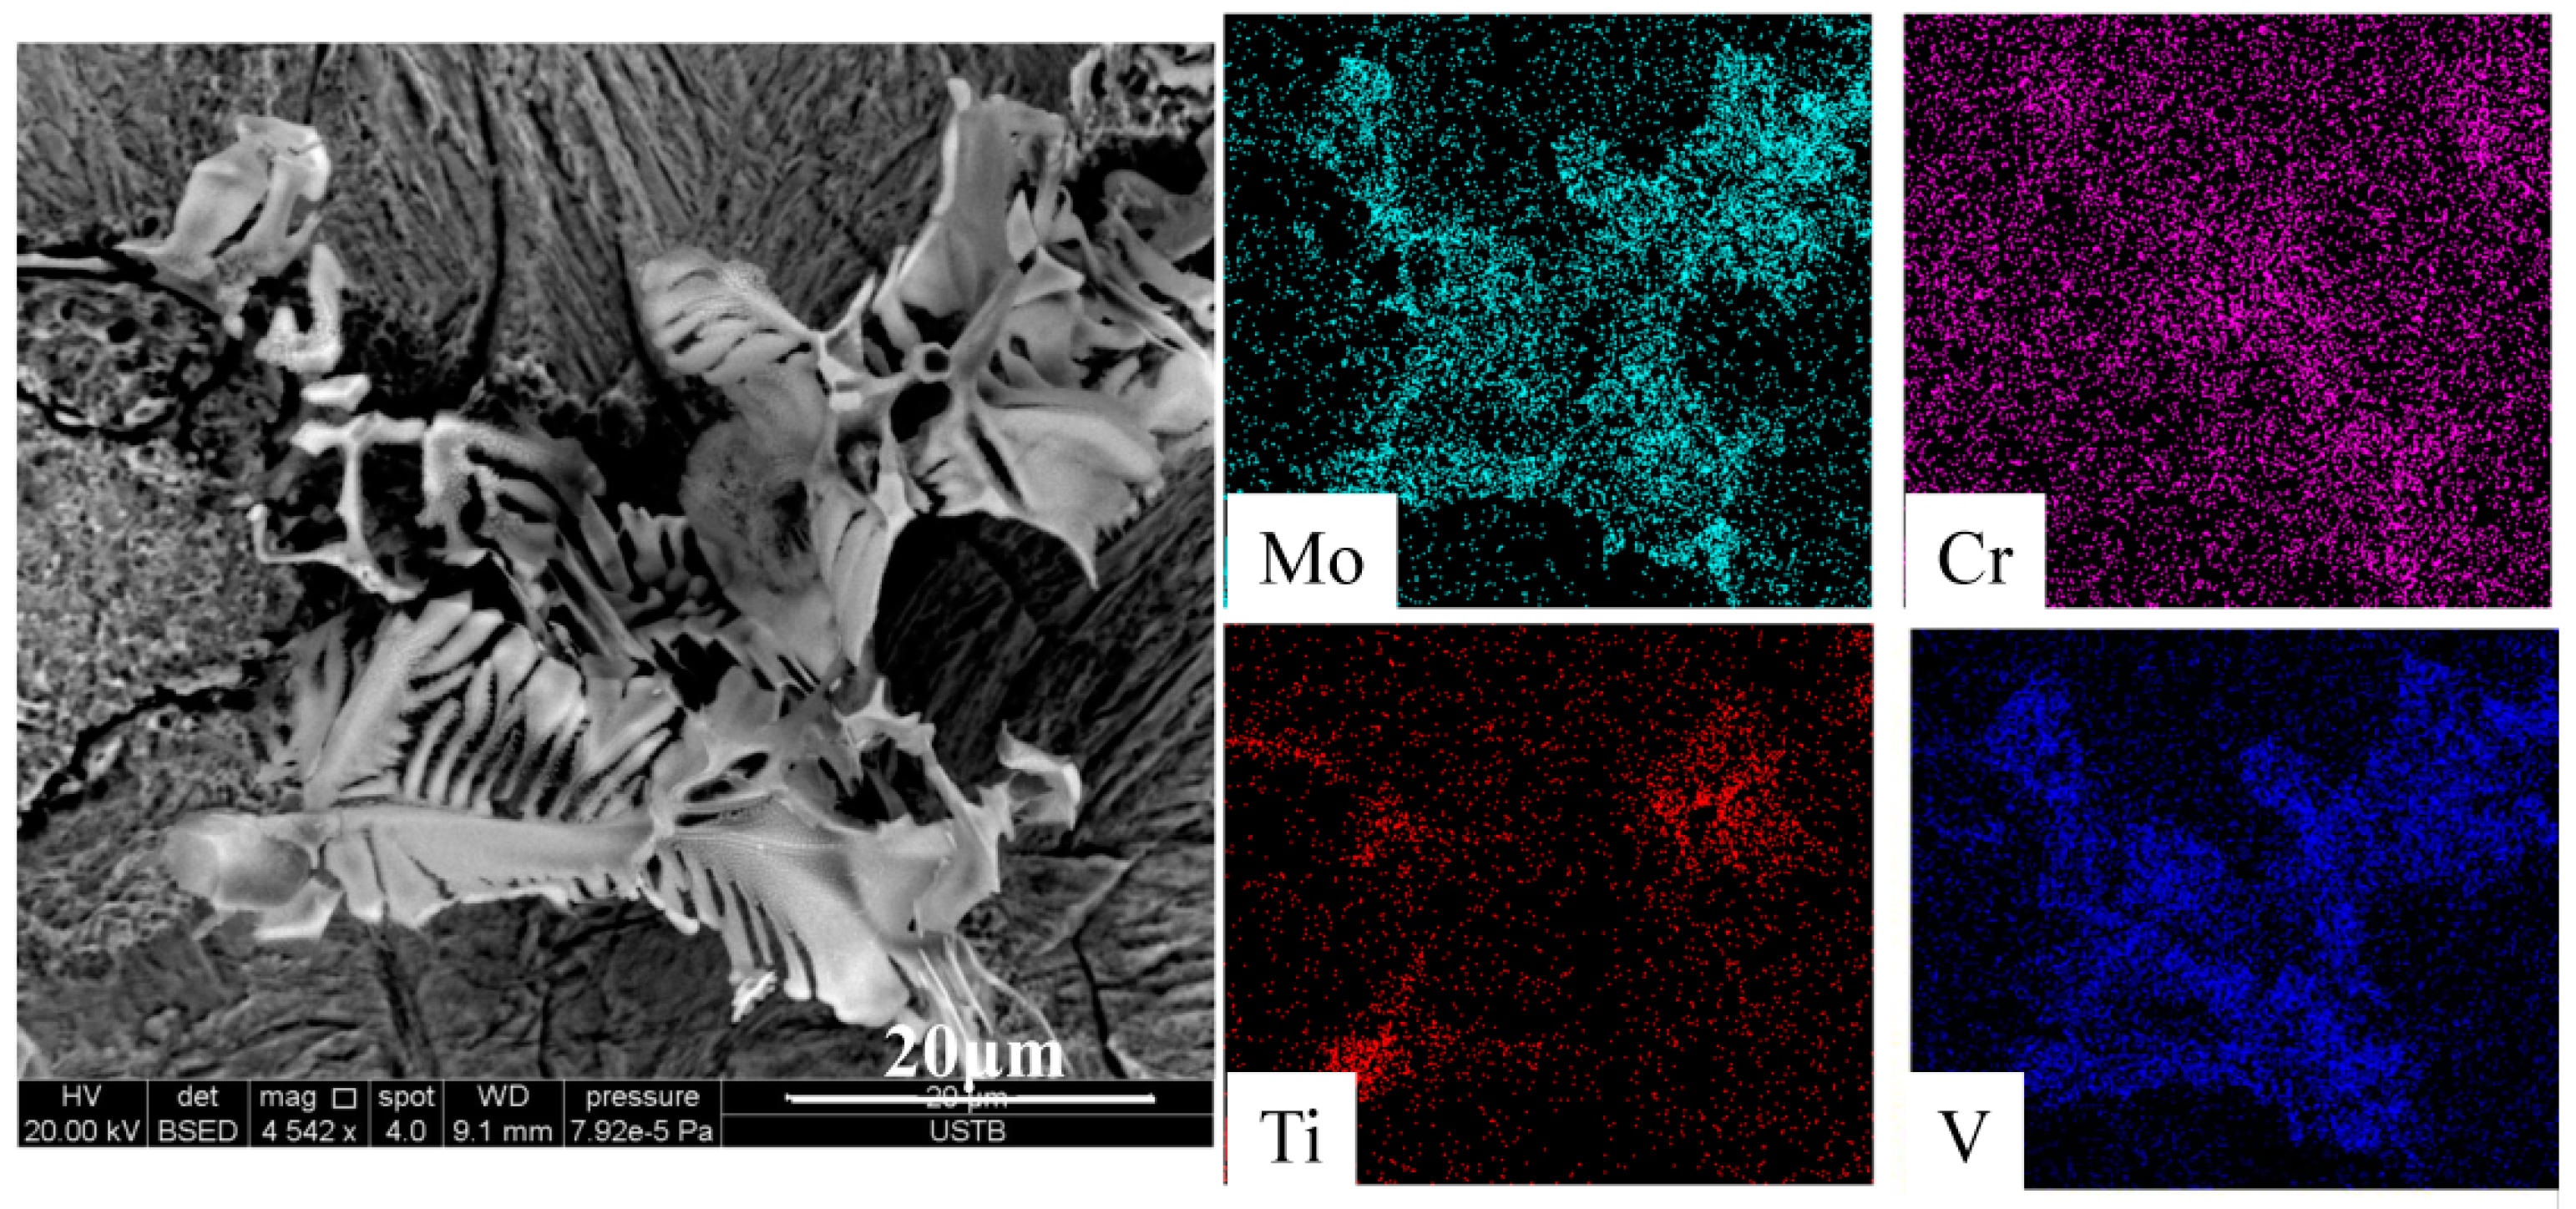
A schematic diagram of the differences between the 2D and the 3D observations is shown in Figure 9. There was a great difference between the 2D and the 3D morphologies of the primary carbides. The shape of the primary carbides according to the 3D observations was similar to a tree, including trunk and branches. There were multiple branches on the trunk, and the area of the branches was much larger than that of the trunk. The elemental mapping of the primary carbides as observed by 3D analysis is shown in Figure 10. Elemental Ti and V were obviously enriched in the trunk, and elemental V and Mo were enriched in the branches. Therefore, the primary carbide in the trunk was the Ti–V-rich carbide, while that in the branches was the V-rich carbide. Moreover, the distribution of the Ti element in the trunk was not uniform. The closer to the central part, the more the Ti element was enriched, which is basically consistent with our previous research results [26].
Figure 9 can clarify the confusing experimental results in Figure 7a and the limitations of the 2D observation. The Ti–V-rich, V-rich, and Cr–Mo-rich carbides observed in the 2D observation were just different portions of the dendritic primary carbide observed in the 3D observation; they were not three independent primary carbides. Therefore, the 2D observation significantly underestimated the size of the primary carbide and overestimated the number density of the primary carbide compared to the 3D observation, because only a part of the trunk and/or branch could be observed in the 2D analysis. The incorrect statistics of the primary carbide determined by the 2D observation, as shown in Figure 7b and Figure 8b, underestimated its harm to the performance of H13 steel. Since the area of the branches was much larger than that of the trunk, the statistical size of V-rich carbide was larger than that of the T–V-rich carbide according to the 2D observation, as shown in Figure 7b and Figure 8b. Because of the uneven distribution of the Ti element in the Ti–V-rich carbide and the uniform distribution of the V element in the V-rich carbide, the composition of Ti–V-rich carbides in different points varied, whereas the composition of V-rich carbides was uniform in the 2D observation, as shown in Figure 7a and Figure 8a–c. Therefore, only a 3D observation can truly determine the characteristics of the primary carbide in H13 ingots.
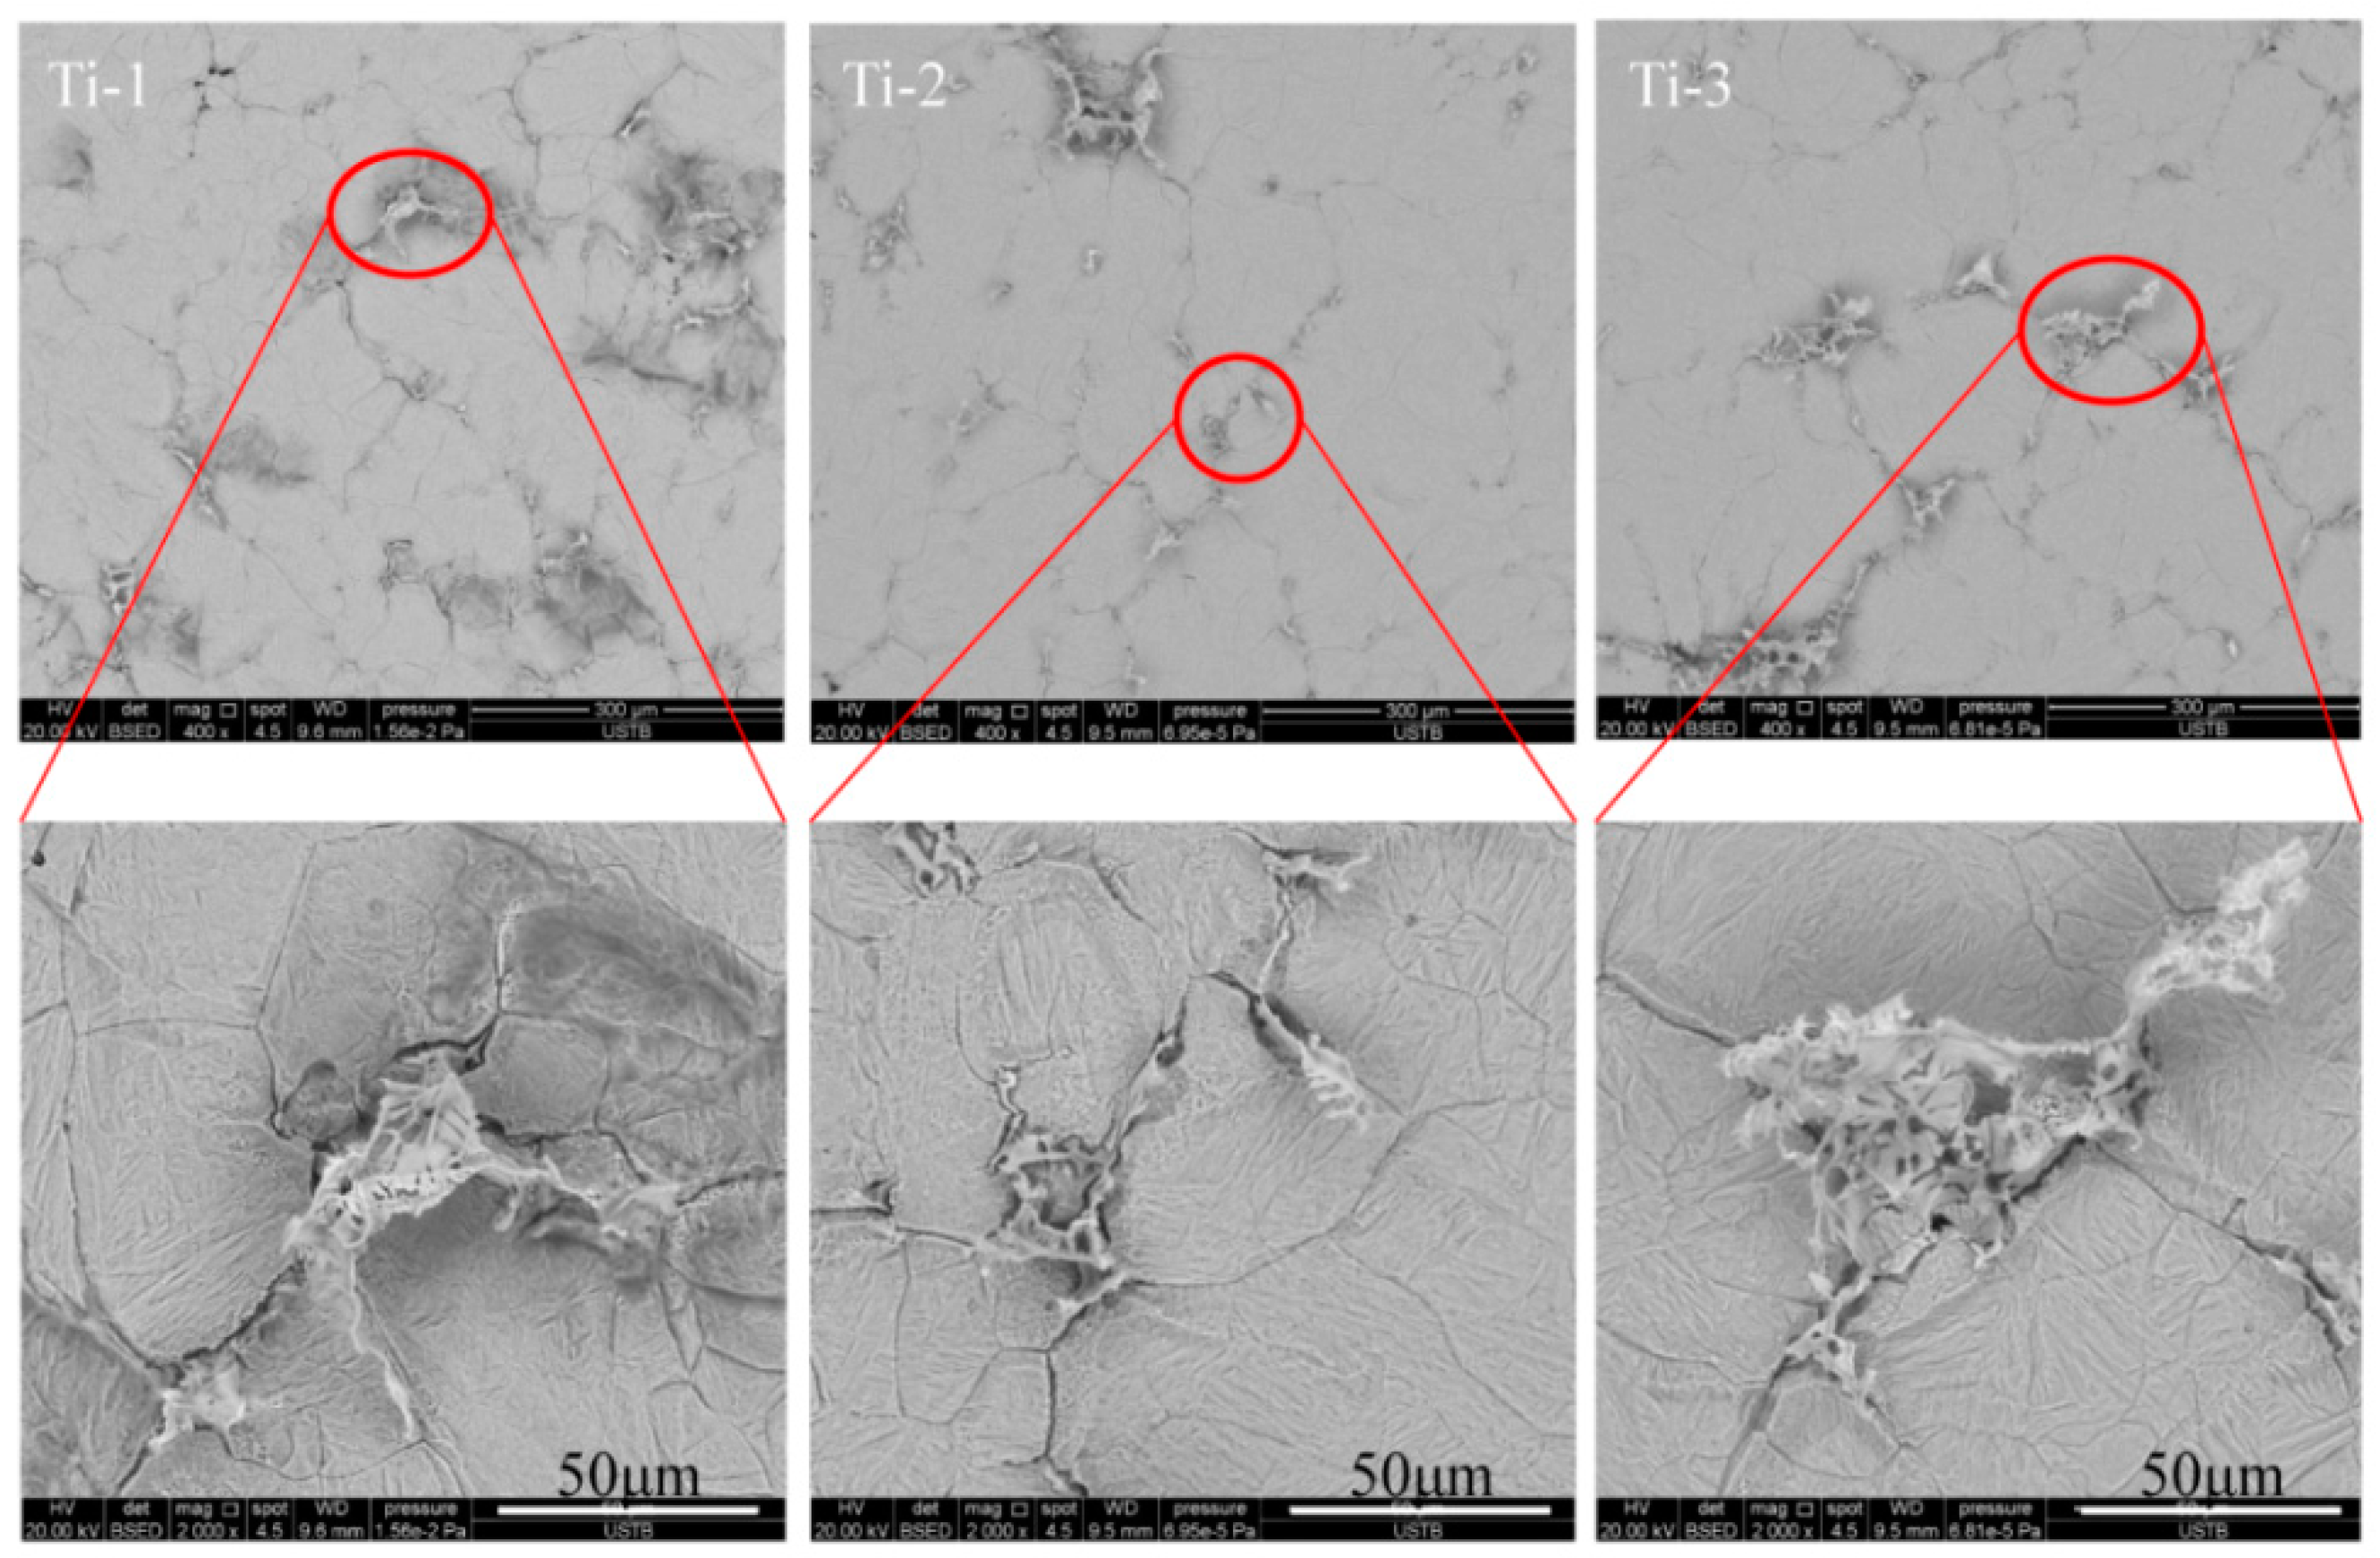
The 3D morphologies of the primary carbides in the samples are shown in Figure 11. The primary carbides were distributed in a network and showed obvious aggregation. The primary carbides in the samples had a typical dendritic structure, with a size larger than 100 μm. The primary carbides in the samples were all mainly located at the grain boundary junction.
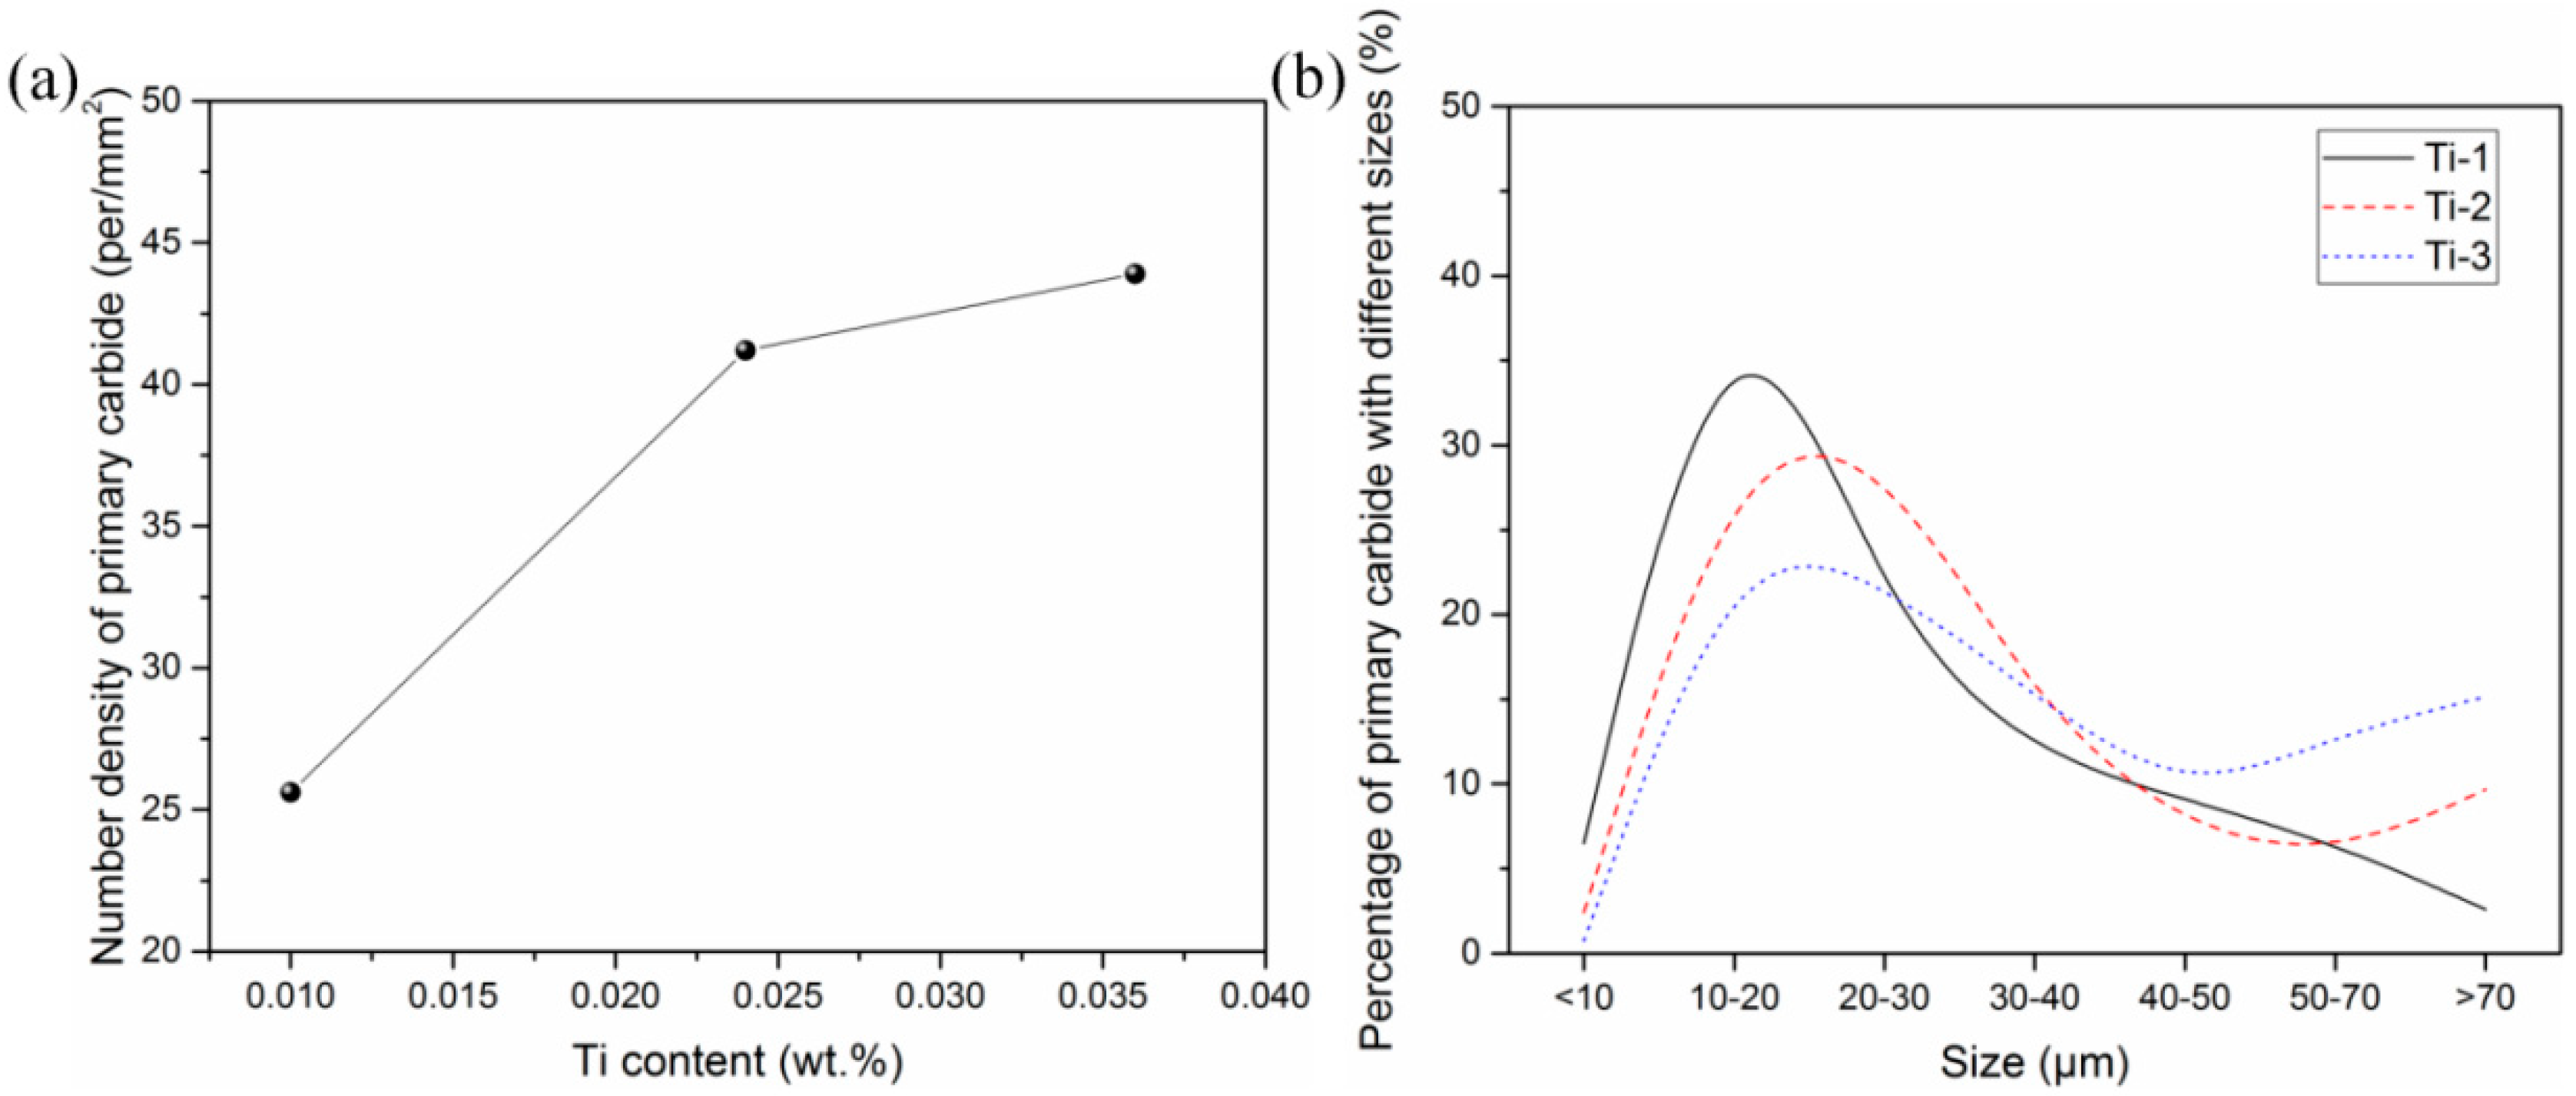
At least 100 primary carbides were analyzed by 3D observation to obtain the 3D characteristics of the primary carbides in the samples. Figure 12 shows the number density and size of the primary carbides according to the 3D observation. As the Ti content increased, the number density of the primary carbides increased from 25.6 per/mm2 to 43.9 per/mm2. The size of the primary carbides in the samples was mainly about 20 μm, and their percentage decreased gradually with the increase of the Ti content. Moreover, as the Ti content increased, the percentage of the primary carbides with a size larger than 50 μm increased rapidly. The statistical number density and size of the primary carbides in the 3D observation were different from those in the 2D observation, especially the size. The statistical results of primary carbide size in the 3D observation are in the Supplementary Materials. To effectively reduce the detrimental effect of large-size primary carbides on the service life of H13 steel, the Ti content in the steel should be as low as possible. In the actual smelting process, the purity of the alloy should be increased as much as possible to reduce the content of residual Ti.

4. Discussion

4.1. Influence of the 3D Characteristics of Primary Carbides on the Mechanical Properties of Steel

According to the results in Section 3, as the Ti content decreased, the number density of the primary carbide as determined by 3D observation decreased from 43.9 per/mm2 to 25.6 per/mm2, and the size of the primary carbide also decreased from 41.3 μm to 24.9 μm. Fatigue strength is one of the important mechanical properties of die steel. During the failure process of die steel, a small crack is initiated in the primary carbide in the early stages of the fatigue test and then propagates in the carbide [27]. The larger the primary carbide size, the smaller the number of cycles to failure. The higher the number density of the primary carbide, the easier the crack propagates. Therefore, the reduction of the Ti content in H13 ingots reduces the size and number density of the primary carbides, thereby increasing the service life of H13 steel.
Impact toughness is also one of the important mechanical properties of die steel. According to some research works [13,28], a coarse primary carbide causes a cleavage fracture whose formation occurs in four stages: stage 1, a microcrack initiates in the coarse primary carbide or at the interface between the inclusions and the matrix; stage 2, the microcrack propagates across the inclusion/matrix interface; stage 3, the crack propagates into the matrix within a grain; stage 4, the crack propagates through the matrix–matrix grain boundaries. Primary carbide can easily act as cleavage crack initiators during impact testing because they are brittle and present in a statistically sufficient number in steel. Therefore, the propagation of cracks is dominant during fracture failure. Whether the microcrack propagates into the matrix mainly depends on the internal stress level, the particle–matrix interface strength, and the matrix–matrix interface strength, which can be calculated with the following equations:
σ p m = ( π E γ p m ( 1 ν 2 ) a ) 1 / 2
σ m m = ( π E γ m m ( 1 ν 2 ) D ) 1 / 2
where ν is Poisson ratio, E is Young’s modulus, γpm and γmm are the particle–matrix interface energy and matrix–matrix interface energy, a is the size of the inclusion, and D is the grain size. Once the loading stress exceeds σpm and σmm, the crack will propagate into the matrix, which means a cleavage fracture occurs. Since the types of primary carbide and matrix structure in samples with different Ti contents are exactly the same, the values of σpm and σmm only depend on the primary carbide size and grain size. As the Ti content in the samples decreases, both the primary carbide size and the grain size decrease, resulting in larger values of σpm and σmm and a better impact performance of the samples. Therefore, the Ti content in H13 ingots should be as low as possible.

4.2. Mechanism by Which the Ti Content Influences the 3D Characteristics of Primary Carbides

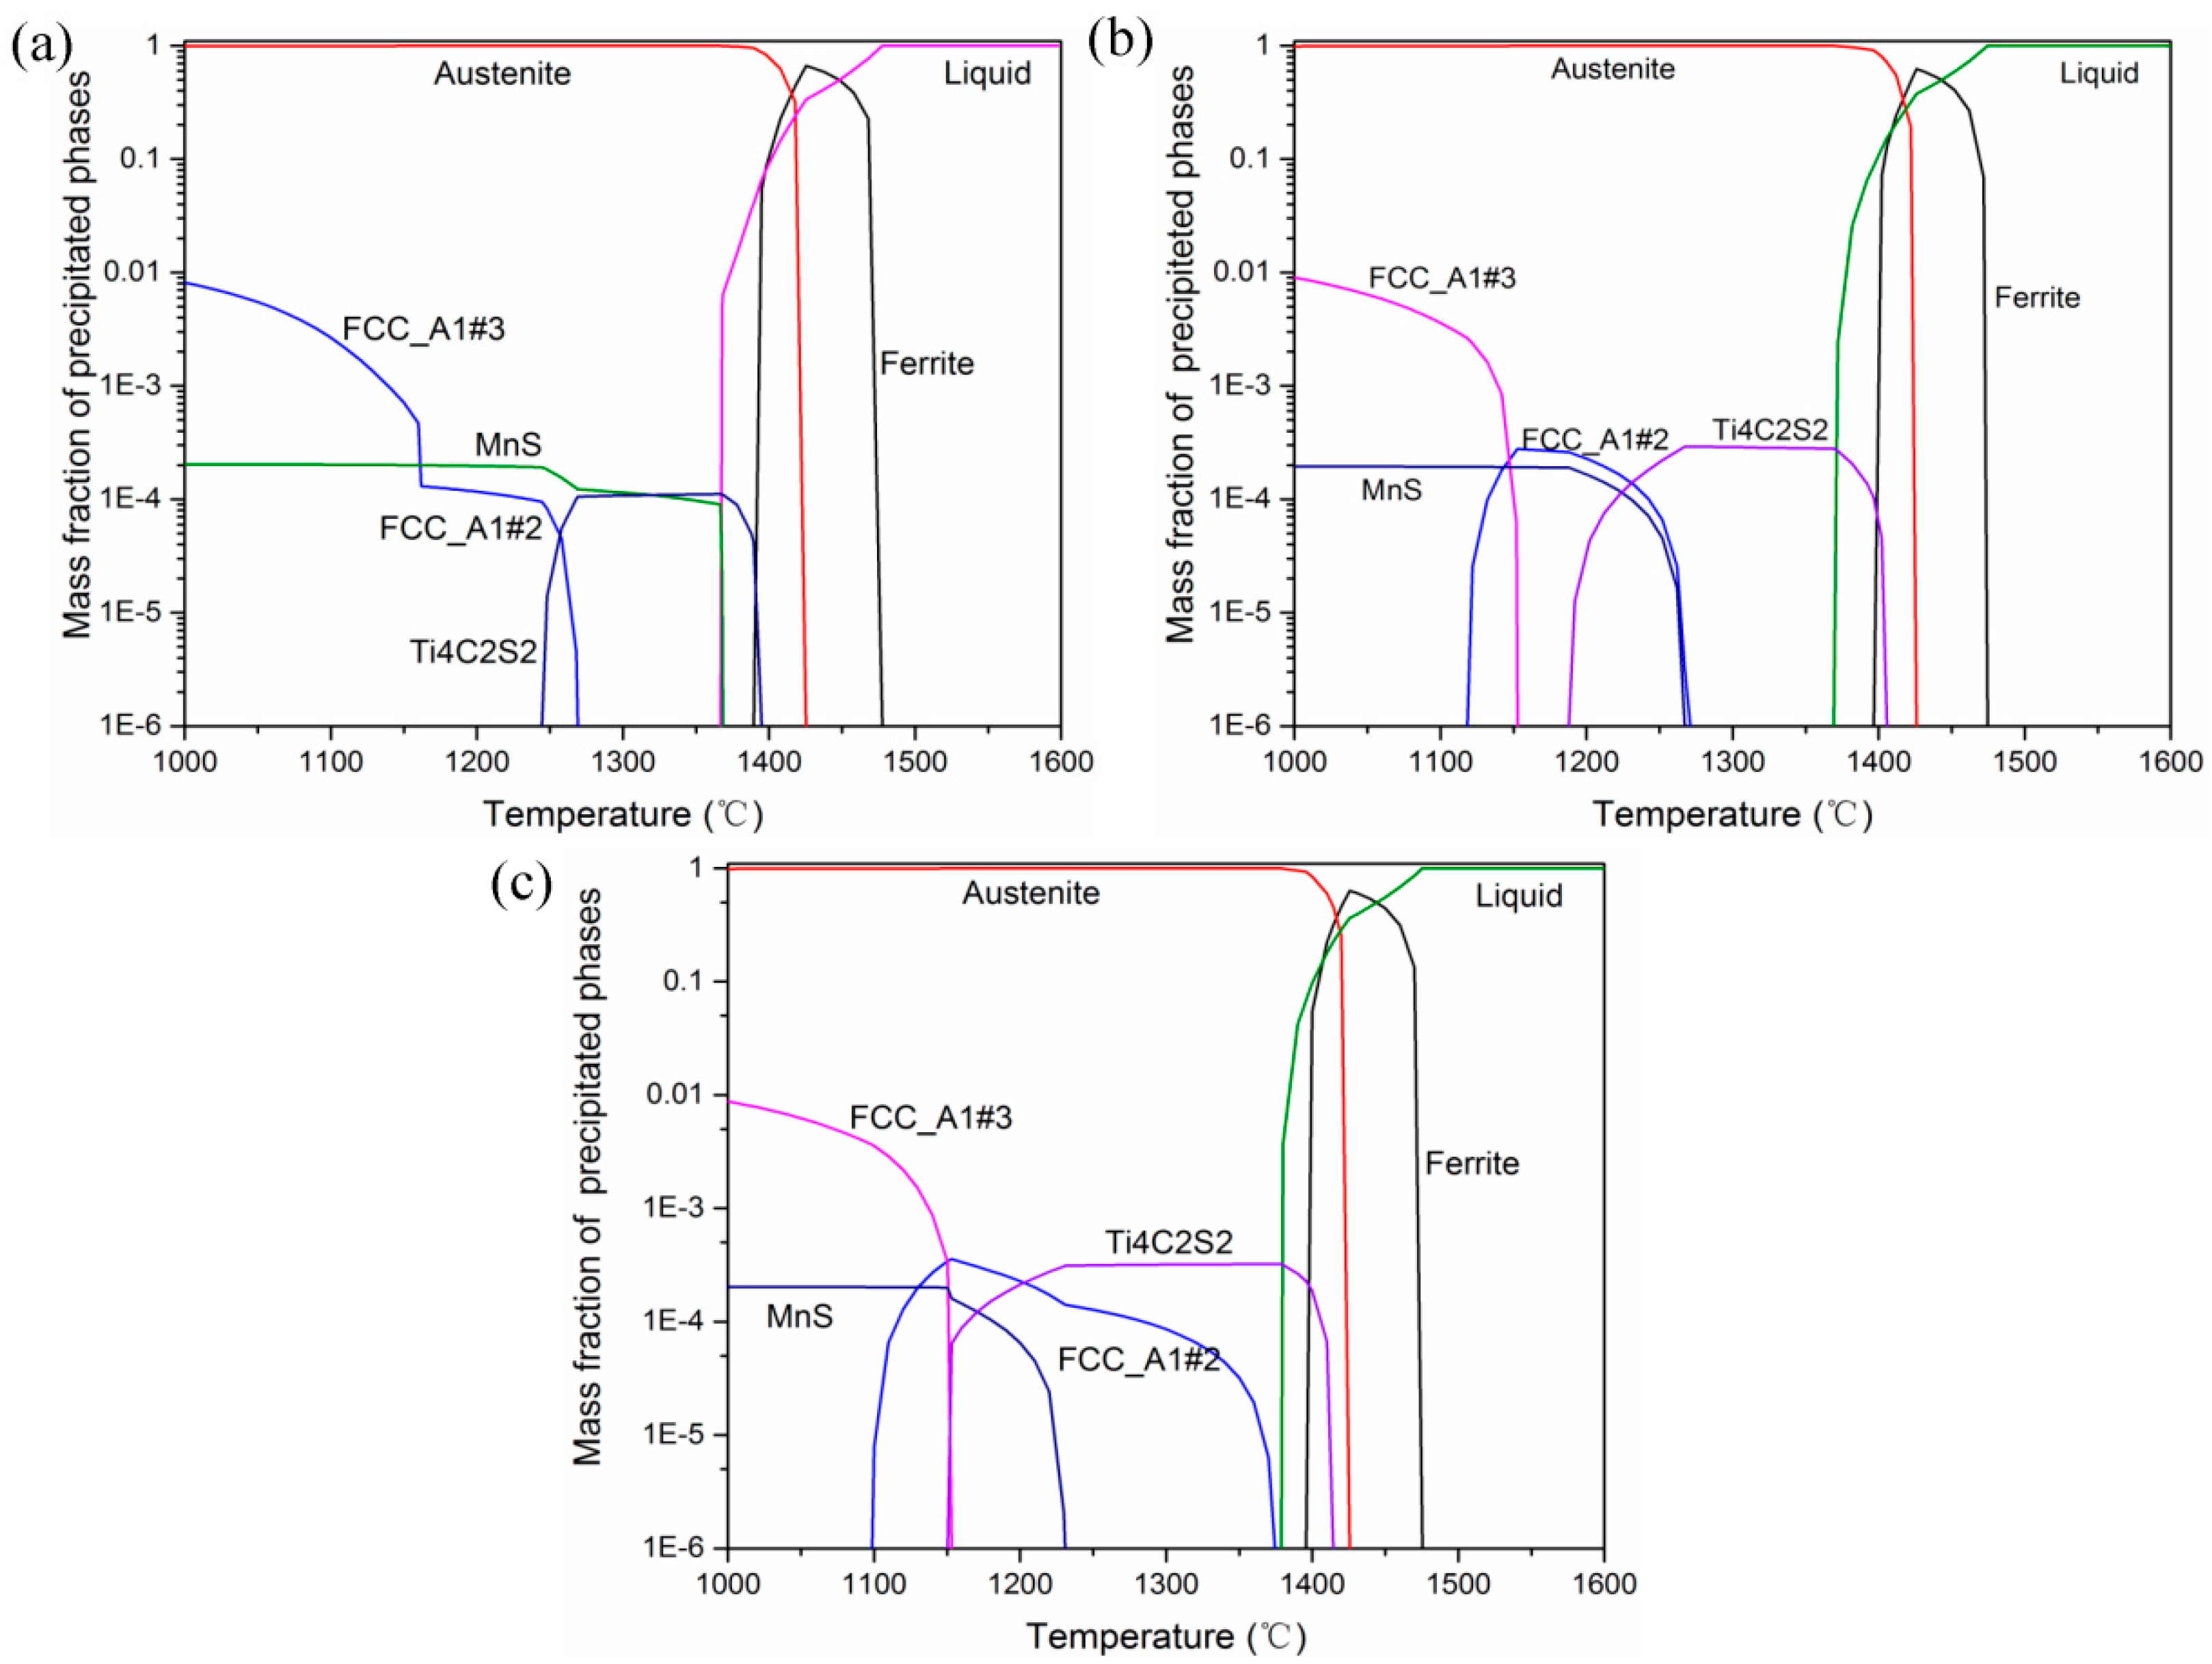
The equilibrium solidifications of the samples with different Ti content were calculated to obtain the mechanism by which the Ti content influences the 3D characteristics of the primary carbides. The results are shown in Figure 13. The Ti4C2S2 phase is the Ti4C2S2 phase, and the FCC_A1#2 and FCC_A1#3 phases are the carbides. As the temperature decreased, the δ-ferrite phase precipitated first, and then the peritectic reaction occurred, forming the austenite phase. The reactions are as follows.
Liquid δ Fe
Liquid + δ Fe γ Fe
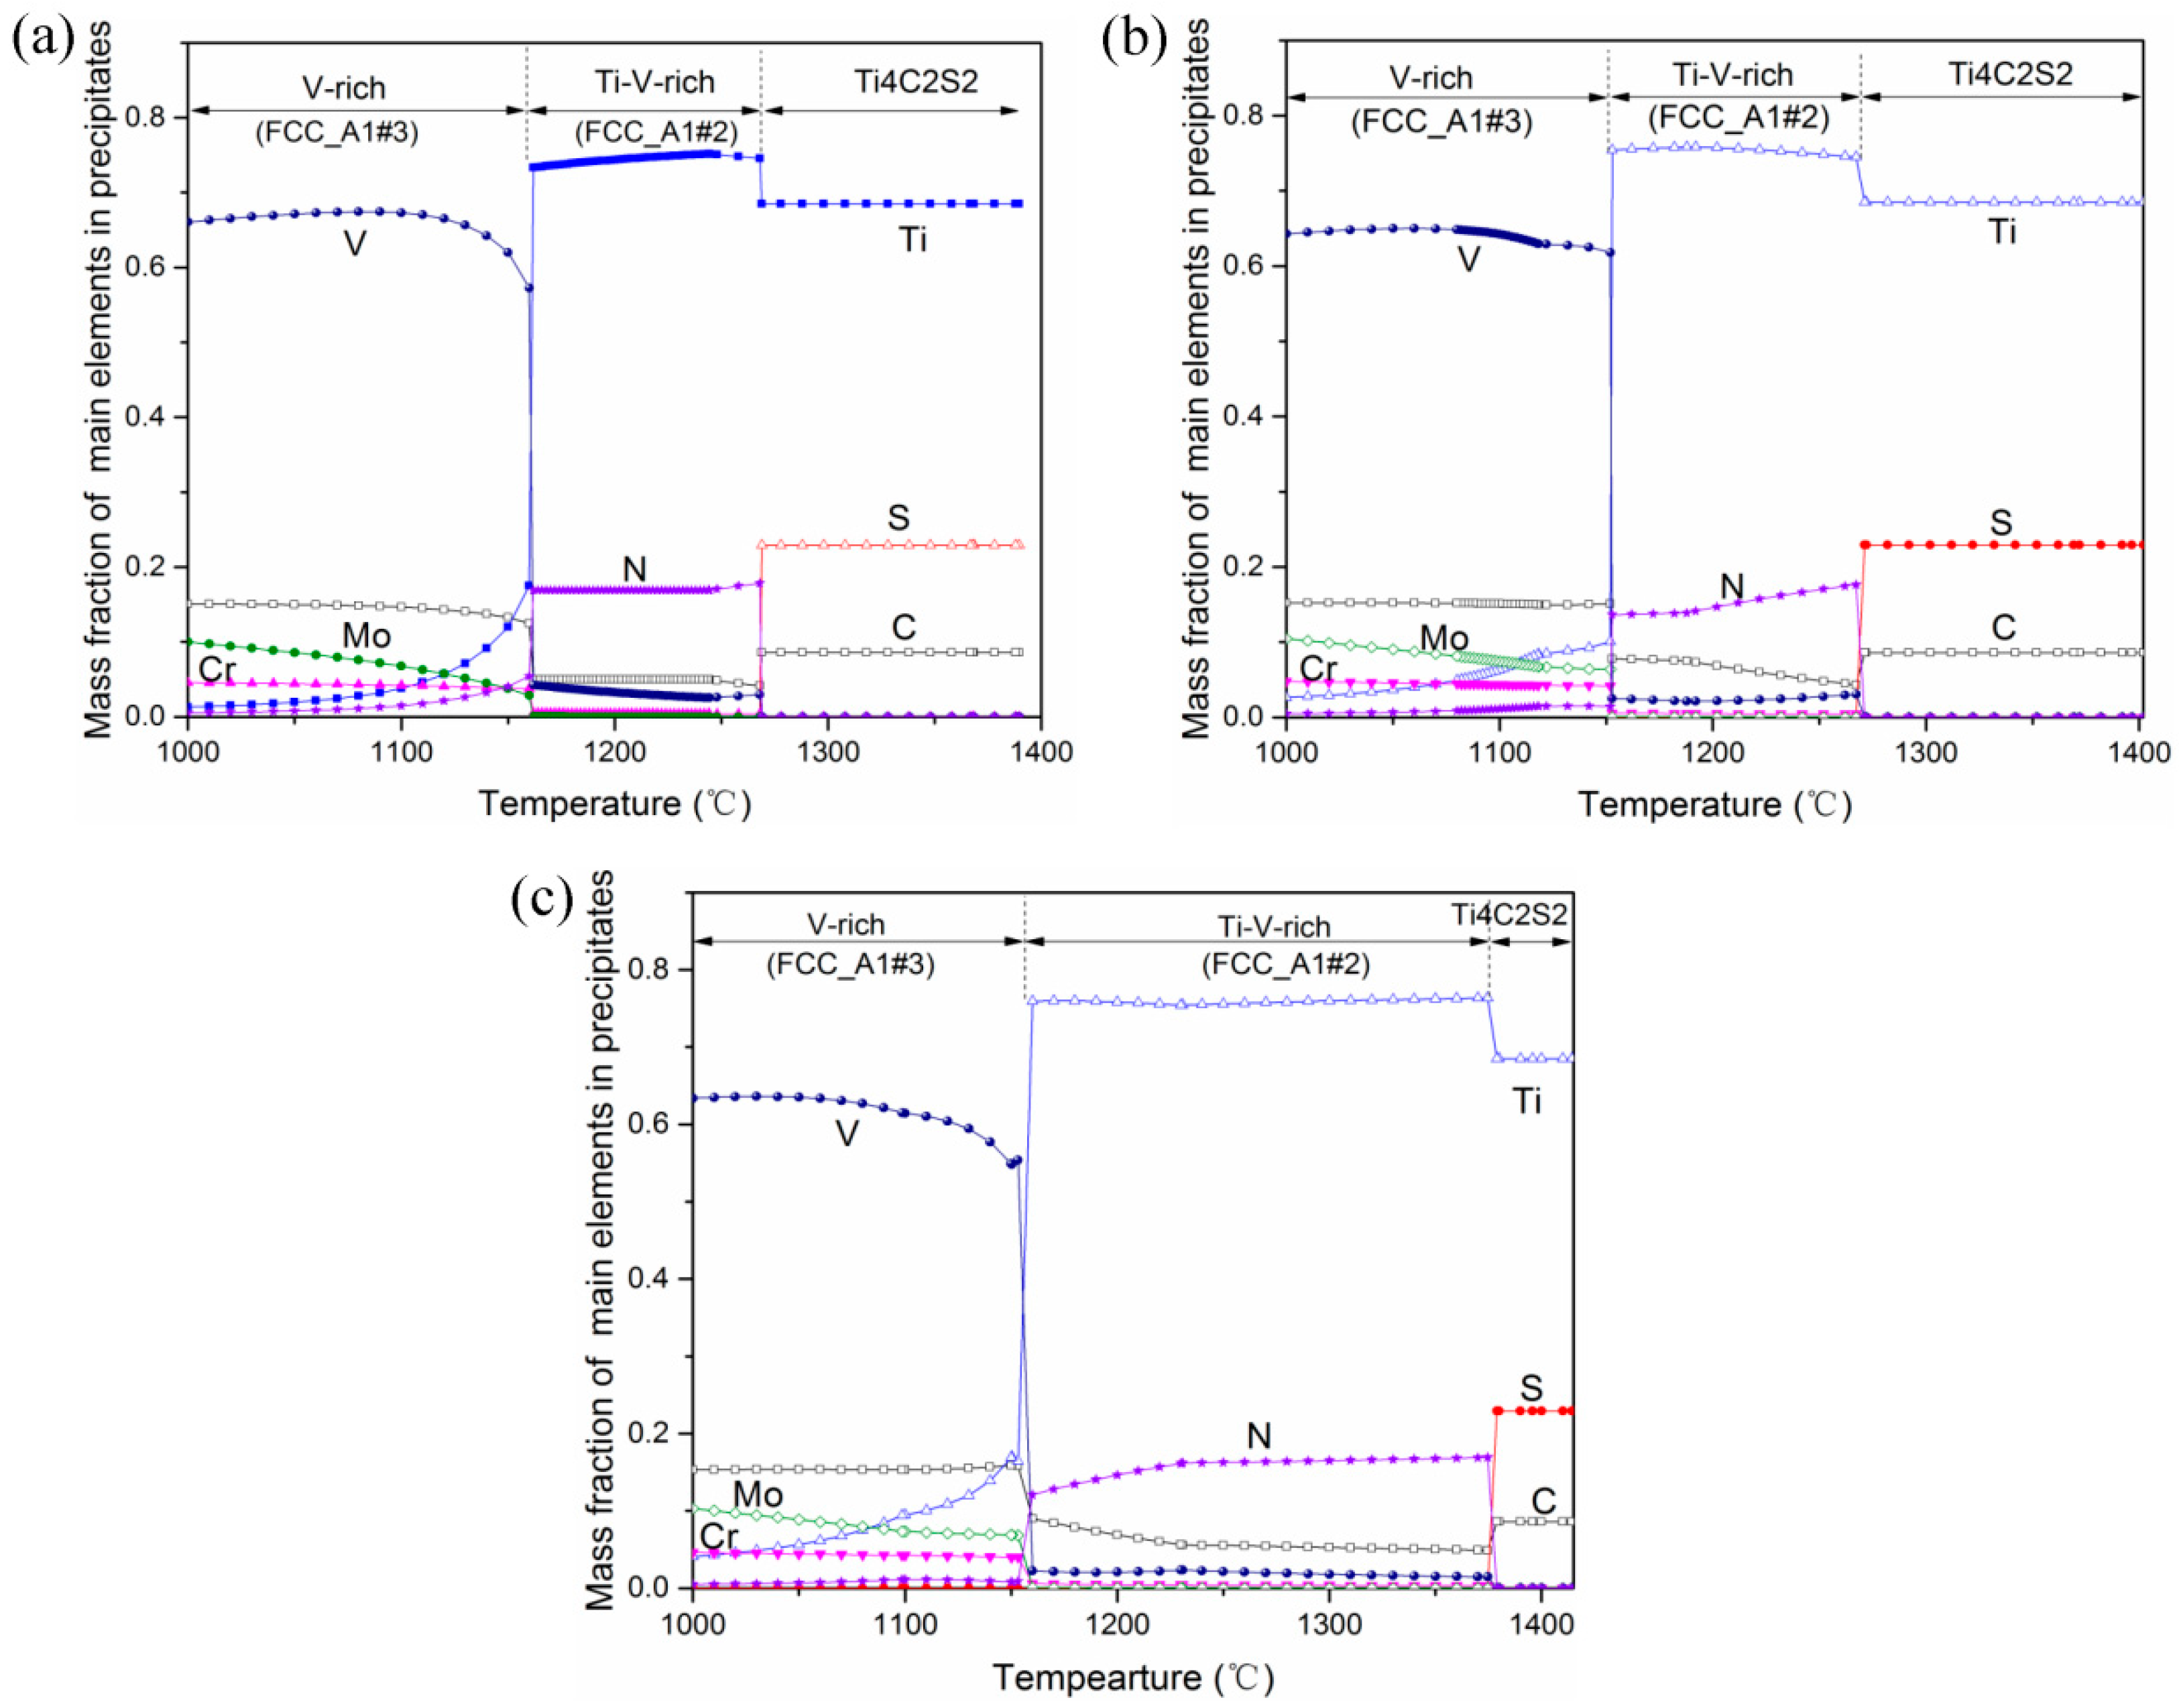
At the end stage of the solidification, the Ti4C2S2 phase formed first and then transferred into the FCC_A1#2 phases, which finally further transferred into the FCC_A1#3 phase. The variation of the mass fraction of the main elements in the primary carbides with the temperature is shown in Figure 14. The precipitation sequence of the primary carbides in the three samples was the same. The Ti4C2S2 phase enriched in elemental Ti, C, and S precipitated first. As the temperature decreased, the contents of the elemental Ti, C, and S remained basically stable. The formation reaction of the Ti4C2S2 phase is as follows.
4 [ Ti ] + 2 [ C ] + 2 [ S ] = Ti 4 C 2 S 2 ( s )
As the temperature continued to decrease, the Ti4C2S2 phase started to transform into the Ti–V-rich carbide (FCC_A1#2 phase). The transition temperature was high enough to allow the transition process to proceed completely. The transition reaction is as follows.
Ti 4 C 2 S 2 ( s ) + Ti + V + N + Mn ( Ti , V ) ( C , N ) + MnS ( s )
As the temperature continued to decrease, the Ti–V-rich carbide transformed into the V-rich carbide (FCC_A1#3 phase). Considering that the temperature was low at this time, the transformation could not be complete, so part of the Ti–V-rich carbide remained in the center of the primary carbide. The transition reaction is as follows.
( Ti , V ) ( C , N ) + V + C VC + Ti + N
With the continued precipitation of the V-rich carbide, a three-dimensional primary carbide with Ti–V-rich carbide in the center and the V-rich carbide in the periphery formed, as shown in Figure 10. Xie studied the precipitation behavior of primary precipitates in Ti-microalloyed H13 tool steel and found that the Ti–V-rich carbide precipitated first, followed by the V-rich carbide, which is basically consistent with our work [22]. However, the Ti4C2S2 phase did not form in Xie’s work. The difference in S content may be the main reason for this. The S content in this paper reached about 75 ppm, which promoted the precipitation of the Ti4C2S2 phase and of the MnS inclusions. He et al. also stated that TiN precipitated first and then acted as a heterogeneous nucleation core for V-rich and Mo-rich carbides [29], which agrees well with our work.
Since the equilibrium calculation does not consider the segregation of alloy elements during solidification, the FCC_A1#2 and FCC_A1#3 phases formed and/or transformed in the solid phase. If we take into consideration the segregation of alloying elements during solidification, the precipitation and/or transformation of the FCC_A1#2 and FCC_A1#3 phases may start during the solidification process. Mao et al. found that in the interdendritic zone of H13 steel, there were obvious Cr and Mo segregation and slight C and V segregation [30]. Therefore, the solute concentration would vary with the solid fraction, which allows the generation of primary carbides. However, the equilibrium results in this paper illustrated the precipitation mechanism of the primary carbides and the mechanism by which the Ti content influenced the 3D characteristics of the primary carbides.
Although the Ti content had a little influence on the precipitation sequence of the primary carbides, it had a significant effect on the precipitation temperature of the phases, as shown in Table 2. As the Ti content increased, the precipitation temperature of the Ti4C2S2 phase increased gradually. The addition of Ti element promoted the earlier precipitation of the Ti4C2S2 phase, providing better kinetic conditions for its nucleation and growth. Moreover, as the Ti content increased, the precipitation temperature of the Ti–V-rich carbide also increased gradually, especially for the Ti-3 sample. Therefore, the increase of Ti content promoted the formation of primary carbides in H13 ingots, further increasing the size and number density of the primary carbides, as determined by 3D observations. According to Xie’s results, V-rich carbonitrides were still observed after holding the samples at 1150 °C for 6 h [31]. The stability at high temperature prevented the elimination of the primary carbides by the subsequent hot working process. Therefore, the Ti content in H13 ingots should be as low as possible to inhibit the earlier precipitation of primary carbides. Other researchers have also worked to achieve this goal. Mao stated that a high cooling rate significantly decreased the number, size, amount, and mean area of primary carbides in H13 steel, further alleviating the negative effect of primary carbides [20]. Moreover, the addition of rare earth elements also led to a reduction of coarse primary carbides and initiated changes in primary carbides’ morphology [32,33].

4.3. Precipitation Process of Primary Carbides in H13 Ingots with Different Ti Contents

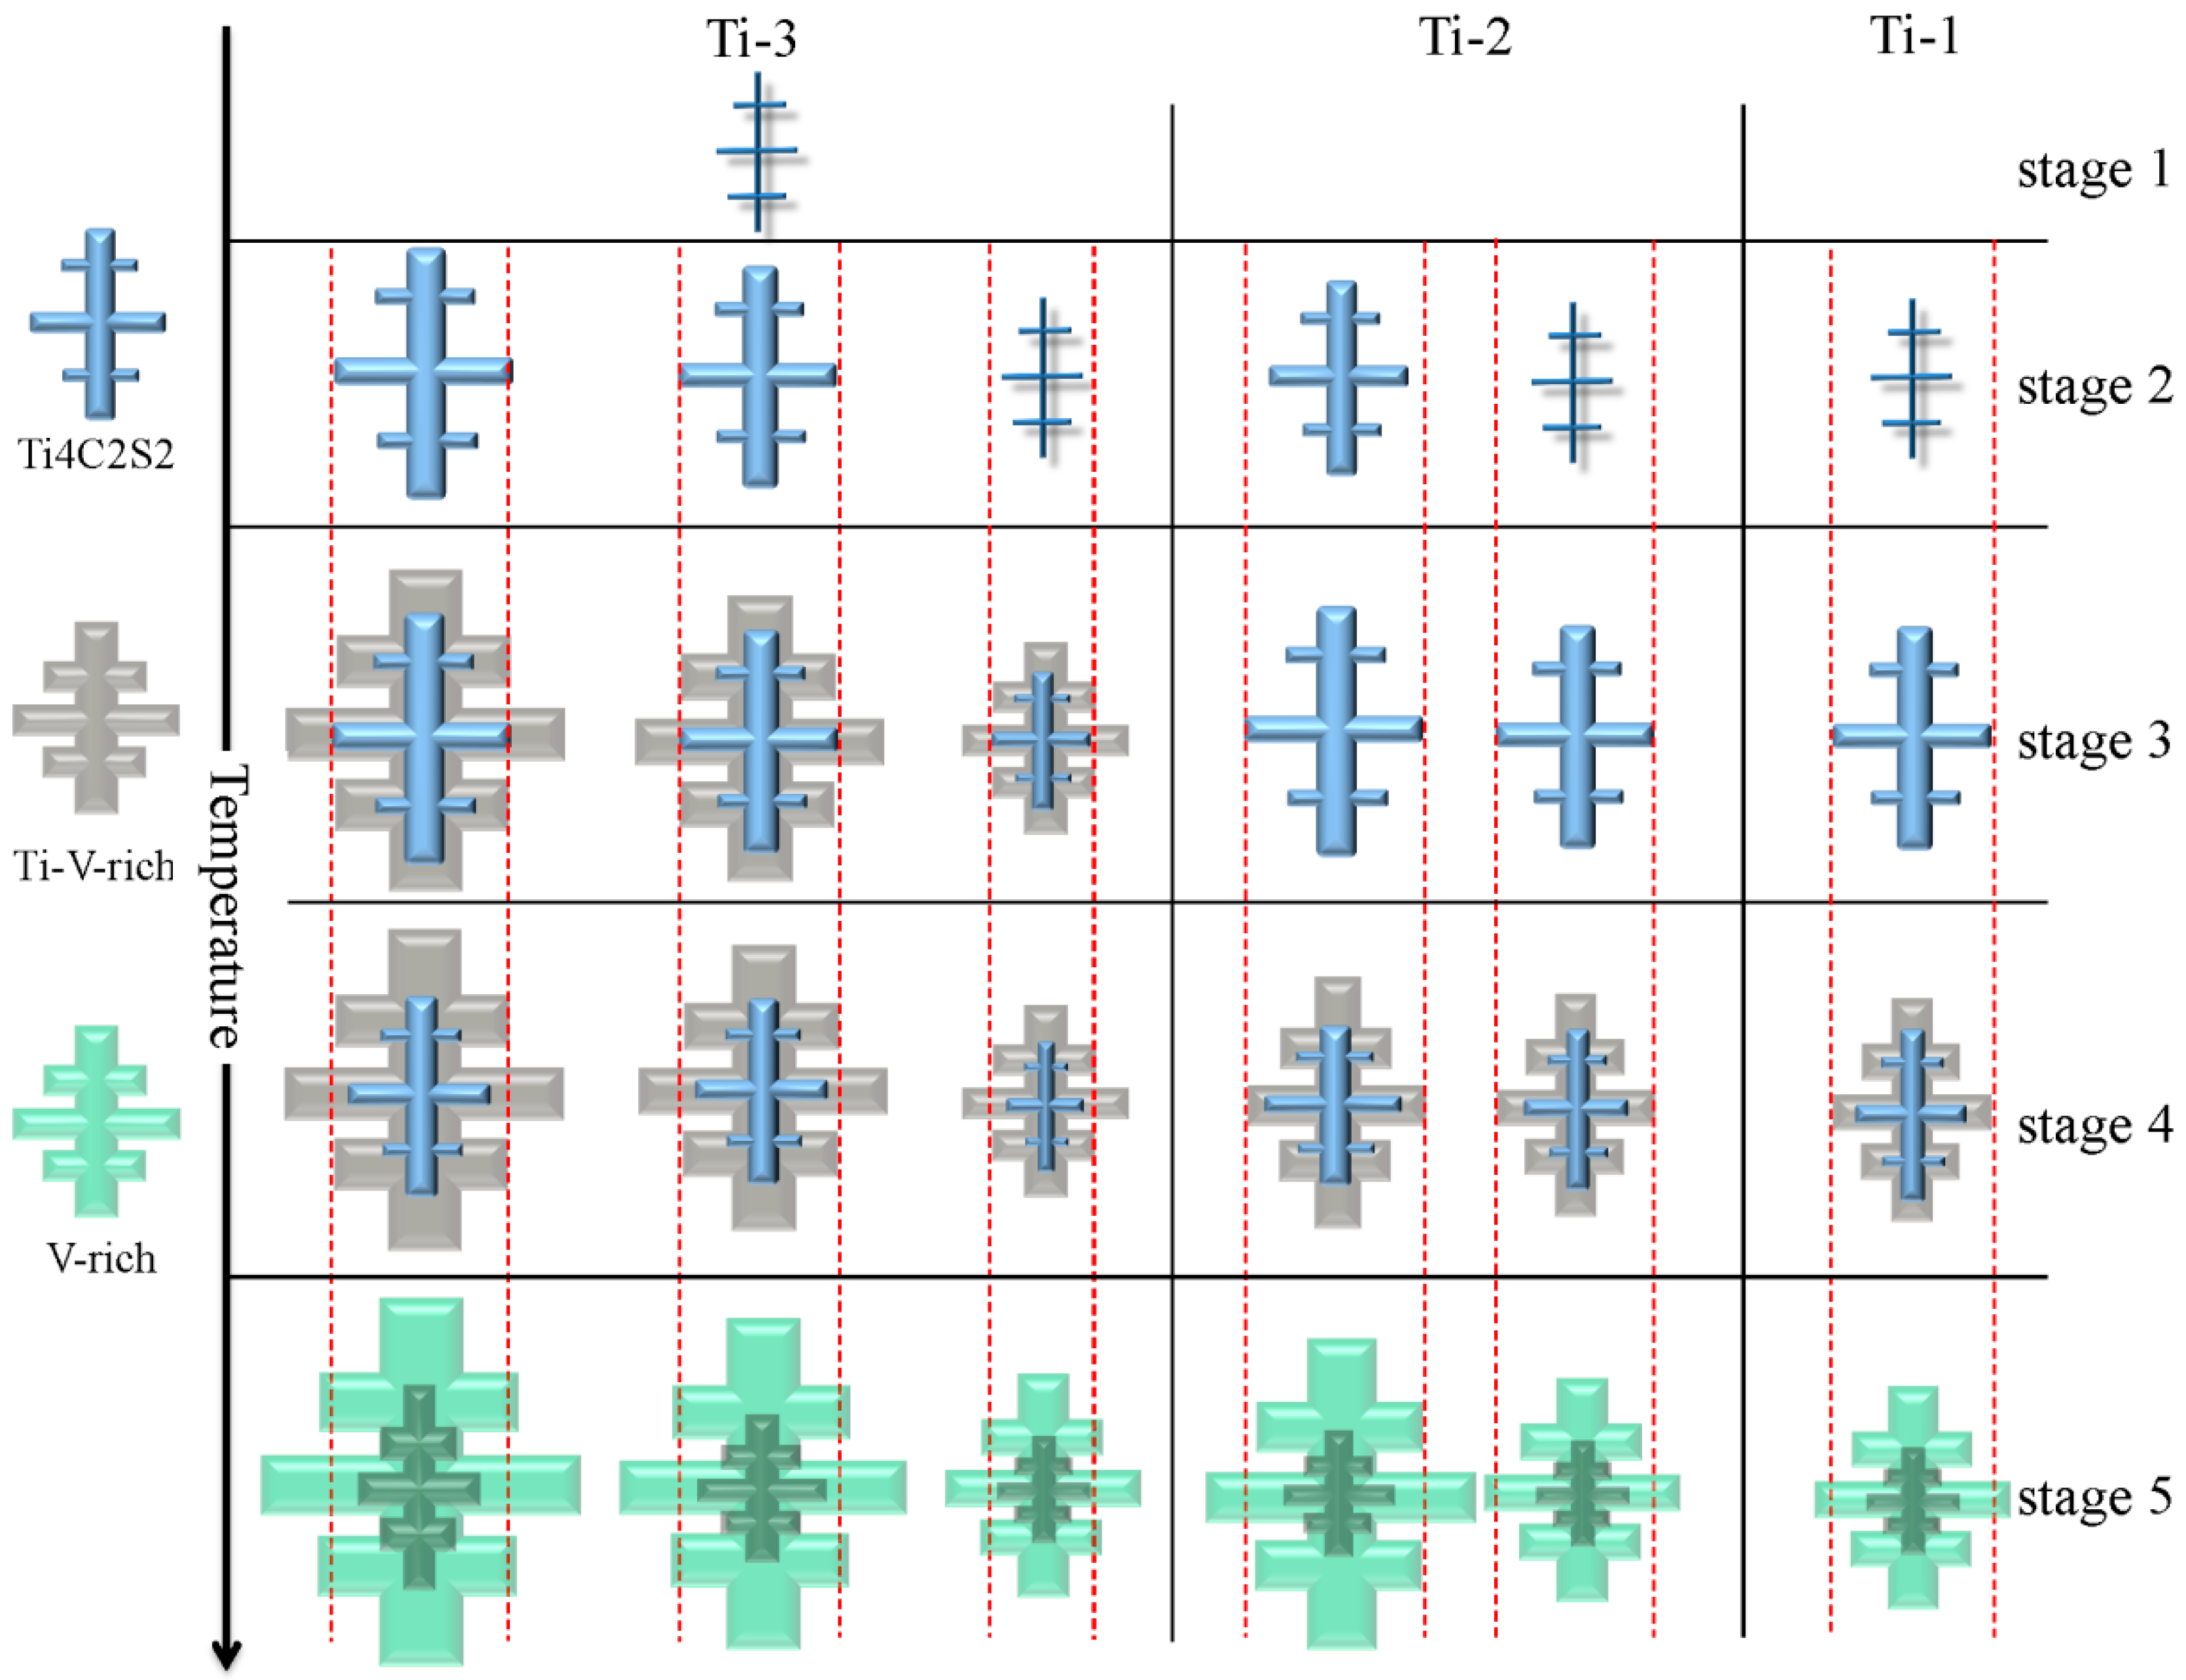
According to the thermodynamic results in Figure 14 and the experimental results in Figure 10 and Figure 12, we could determine the specific formation process of primary carbides in the samples with different Ti contents, as shown in Figure 15. The left part of the Figure shows the decrease in temperature. The right part shows different temperature ranges. The red line reflects the changes in carbide size. As the temperature decreased (stage 1), the Ti4C2S2 phase precipitated first in the Ti-3 sample, but the precipitation conditions of the Ti4C2S2 phase were not reached in the Ti-1 and Ti-2 samples. When the temperature decreased to stage 2, the Ti4C2S2 phase in the Ti-1 sample just started to precipitate. The Ti4C2S2 phases in the Ti-3 and Ti-2 samples grew into a dendritic structure and precipitated again. Therefore, the number density and size of the primary carbide in the Ti-3 sample were the largest, followed by those of the Ti-2 sample. As the temperature continued to decrease (stage 3), the Ti–V-rich carbide in the Ti-3 sample started to precipitate, using the Ti4C2S2 phase as the nucleation core. For the Ti-1 and Ti-2 samples, only further growth of the Ti4C2S2 phases occurred during this process. When the temperature decreased to stage 4, the Ti–V-rich carbide in the Ti-3 sample grew gradually, and then the Ti4C2S2 phase started to transform into Ti–V-rich carbide. Therefore, the size of the Ti–V-rich carbide continued to increase, and the size of the Ti4C2S2 phase started to decrease. In stage 4, the Ti4C2S2 phases started to change into Ti–V-rich carbide in the Ti-1 and Ti-2 samples. Therefore, the size of the Ti4C2S2 phase in the Ti-1 and Ti-2 samples continued to decrease, and the sizes of the primary carbide remained basically the same. When the temperature decreased to stage 5, the Ti4C2S2 phase completely changed into the Ti–V-rich carbide in all samples, and the Ti–V-rich carbide started to change into V-rich carbide. Considering that the transformation temperature was relatively low at this time, the transformation could not be complete, so the small-sized Ti–V-rich carbides remained in the core of the primary carbide. Subsequently, the V-rich carbide started to precipitate around the periphery of the primary carbide, and the size of the primary carbide gradually increased. The three-dimensional features of the final primary carbides are shown in Figure 10 and Figure 12.

5. Conclusions

(1) Primary carbides and MnS inclusions formed in the last-to-solidify region. As the Ti content increased, the size of the last-to-solidify region increased.
(2) There was a huge difference between the 2D characteristics and the 3D characteristics of the primary carbides. A two-dimensional observation does not accurately reflect the essential characteristics of the primary carbides in H13 ingots. As the Ti content increased, the number density and size of the primary carbides gradually increased, as determined by 3D observation.
(3) During the formation process of primary carbides, the Ti4C2S2 phase precipitated first, then the Ti–V-rich carbide formed, and finally the V-rich carbide precipitated. The addition of Ti element rapidly increased the temperature leading to the precipitation of the Ti4C2S2 and Ti–V-rich phases and the transformation of the Ti4C2S2 phase into Ti–V-rich carbide, finally resulting in an increase of the number density and size of the primary carbides.

Supplementary Materials

The following are available online at https://www.mdpi.com/2075-4701/10/6/837/s1, Statistical Results of Primary Carbide Size Observed in 3D Observation.

Author Contributions

Writing—review and editing, Y.H.; writing—original draft preparation, Y.H.; conceptualization, G.C.; resources, M.Z.; methodology, M.Z. All authors have read and agreed to the published version of the manuscript.

Funding

This research was funded by the National Natural Science Foundation of China, grant number 51874034.

Acknowledgments

Many thanks to Huijing Chen, from the University of Science and Technology, Beijing, for her great help with SEM and automatic inclusion analysis system.

Conflicts of Interest

The authors declare no conflict of interest.

References

  1. Zeng, Z.; Reddy, K.; Song, S.; Wang, J.; Wang, X. Microstructure and mechanical properties of Nb and Ti microalloyed lightweight δ-trip steel. Mater. Charact. 2020, 164, 110324. [Google Scholar] [CrossRef]
  2. Cao, Y.; Wan, X.; Hou, Y.; Niu, C.; Liu, Y.; Li, G. In situ observation of grain refinement in the simulated heat-affected zone of al–ti-0.05% ce-deoxidized steel. Steel Res. Int. 2019, 90, 1900084. [Google Scholar] [CrossRef]
  3. Zhan, D.; Qiu, G.; Li, C.; Qi, M.; Jiang, Z.; Zhang, H. Effects of Ti addition on the microstructure and tensile properties of china low activation martensitic steel for nuclear fusion reactors. Steel Res. Int. 2019, 90, 1900109. [Google Scholar] [CrossRef]
  4. Sasaki, M.; Matsuura, K.; Ohsasa, K.; Ohno, M. Refinement of as-cast austenite grain in carbon steel by addition of titanium. ISIJ Int. 2009, 49, 1362–1366. [Google Scholar] [CrossRef] [Green Version]
  5. Maity, S.; Ballal, N.; Kawalla, R. Development of ultrahigh strength steel by electroslag refining: Effect of inoculation of titanium on the microstructures and mechanical properties. ISIJ Int. 2006, 46, 1361–1370. [Google Scholar] [CrossRef] [Green Version]
  6. Ohta, H.; Inoue, R.; Suito, H. Effect of TiN precipitation on austenite grain size in Fe-1.5%Mn-0.12%Ti-Si(<1.1%)-C(0.05 and 0.15%) alloy. ISIJ Int. 2008, 48, 294–300. [Google Scholar] [CrossRef] [Green Version]
  7. Wang, B.; Liu, X.; Wang, G. Inclusion characteristics and acicular ferrite nucleation in Ti-containing weld metals of X80 pipeline steel. Metall. Mater. Trans. A 2018, 49, 2124–2138. [Google Scholar] [CrossRef]
  8. Cui, X.; Song, B.; Yang, Z.; Liu, Z.; Li, L.; Wang, L. Effect of Mg on the evolution of inclusions and formation of acicular ferrite in La–Ti-treated steels. Steel Res Int. 2020, 91, 1900563. [Google Scholar] [CrossRef]
  9. Ito, A.; Suito, H.; Inoue, R. Size distribution of multi-phase deoxidation particles for heterogeneous crystallization of TiN and solidification structure in Ti-added ferritic stainless steel. ISIJ Int. 2012, 52, 1196–1205. [Google Scholar] [CrossRef] [Green Version]
  10. Wang, Q.; Cheng, G.; Hou, Y. Effect of titanium addition on As-cast structure and high-temperature tensile property of 20Cr-8Ni stainless steel for heavy castings. Metals 2020, 10, 529. [Google Scholar] [CrossRef]
  11. Li, J.; Cheng, G.; Ruan, Q.; Pan, J.; Chen, X. Characteristics of nozzle clogging and evolution of oxide inclusion for Al-killed Ti-stabilized 18Cr stainless steel. Metall. Mater. Trans. B 2019, 50, 2769–2779. [Google Scholar] [CrossRef]
  12. Basu, S.; Choudhary, S.; Girase, N. Nozzle clogging behavior of Ti-bearing Al-killed ultra low carbon steel. ISIJ Int. 2004, 44, 1653–1660. [Google Scholar] [CrossRef]
  13. Huang, Y.; Cheng, G.; Li, S.; Dai, W.; Xie, Y. Effect of Ti(C, N) particle on the impact toughness of B-microalloyed steel. Metals 2018, 8, 868. [Google Scholar] [CrossRef] [Green Version]
  14. Zhang, L.; Davis, C.; Strangwood, M. Dependency of fracture toughness on the inhomogeneity of coarse TiN particle distribution in a low alloy steel. Metall. Mater. Trans. A 2001, 32, 1147–1156. [Google Scholar] [CrossRef]
  15. Yan, W.; Shan, Y.; Yang, K. Effect of TiN inclusions on the impact toughness of low-carbon microalloyed steels. Metall. Mater. Trans. A 2006, 37, 2147–2159. [Google Scholar] [CrossRef]
  16. Wang, X.; Li, G.; Liu, Y.; Cao, Y.; Wand, F.; Wand, Q. Investigation of primary carbides in a commercial-sized electroslag remelting ingot of H13 steel. Metals 2019, 9, 1247. [Google Scholar] [CrossRef] [Green Version]
  17. Xie, Y.; Cheng, G.; Chen, L.; Zhang, Y.; Yan, Q. Characteristics and generating mechanism of large precipitates in Nb–Ti-microalloyed H13 tool steel. ISIJ Int. 2016, 56, 995–1002. [Google Scholar] [CrossRef] [Green Version]
  18. Li, J.; Li, J.; Wang, L.; Zhu, Q. Study of the effect of trace Mg additions on carbides in die steel H13. Met. Sci. Heat Treat. 2016, 58, 330–334. [Google Scholar] [CrossRef]
  19. Ning, A.; Mao, W.; Chen, X.; Guo, H.J. Precipitation behavior of carbides in H13 hot work die steel and its strengthening during tempering. Metals 2017, 7, 70. [Google Scholar] [CrossRef]
  20. Mao, M.; Guo, H.; Wang, F.; Sun, X. Effect of cooling rate on the solidification microstructure and characteristics of primary carbides in H13 steel. ISIJ Int. 2019, 59, 848–857. [Google Scholar] [CrossRef] [Green Version]
  21. Yoshida, J.; Katsumata, M.; Yamazaki, Y. Effect of primary carbide on fatigue life in die steel for cold working. Tetsu-To-Hagane 1998, 84, 79–84. [Google Scholar] [CrossRef] [Green Version]
  22. Xie, Y.; Cheng, G.; Meng, X.; Chen, L.; Zhang, Y. Precipitation behavior of primary carbide precipitates in Ti-microalloyed H13 tool steel. ISIJ Int. 2016, 56, 1996–2005. [Google Scholar] [CrossRef] [Green Version]
  23. Voller, V.; Beckermann, C. A unified model of microsegregation and coarsening. Metall. Mater. Trans. A 1999, 30, 2183–2189. [Google Scholar] [CrossRef]
  24. Won, Y.; Thomas, B. Simple model of microsegregation during solidification of steels. Metall. Mater. Trans. A 2001, 32, 1755–1767. [Google Scholar] [CrossRef]
  25. Huang, Y.; Cheng, G.; Li, S.; Dai, W. Precipitation Behavior of Large Primary Carbides in Cast H13 Steel. Steel Res. Int. 2019, 90, 1900035. [Google Scholar] [CrossRef]
  26. Huang, Y.; Cheng, G.; Li, S.; Dai, W. Distribution characteristics and thermal stability of primary carbide in cast Ce-H13 steel. ISIJ Int. 2020, 60, 267–275. [Google Scholar] [CrossRef] [Green Version]
  27. Ozaki, K. Effect of the Distribution of Primary Carbide on Fatigue Strength of Cold Work Die Steels. Denki Seiko 2005, 76, 249–257. [Google Scholar] [CrossRef]
  28. Du, J.; Strangwood, M.; Davis, C. Effect of TiN particles and grain size on the charpy impact transition temperature in steels. J. Mater. Sci. Technol. 2012, 28, 878–888. [Google Scholar] [CrossRef]
  29. He, B.; Li, J.; Shi, C.; Wang, H. Effect of Mg addition on carbides in H13 steel during electroslag remelting process. Metall. Res. Technol. 2018, 115, 501–508. [Google Scholar] [CrossRef]
  30. Mao, M.; Wand, F.; Sun, X.; Guo, H. In situ research of partial melt in as-cast H13 steel at elevated temperature. Ironmak Steelmak. 2020, 47, 159–167. [Google Scholar] [CrossRef]
  31. Xie, Y.; Cheng, G.; Meng, X.; Huang, Y. Thermal stability of primary elongated V-rich carbonitrides in H13 tool steel. Metall. Res. Technol. 2017, 114, 206–213. [Google Scholar] [CrossRef]
  32. Hufenbach, J.; Helth, A.; Lee, M.; Wendrock, H.; Giebeler, L.; Choe, C.; Kim, K.; Kuhn, U.; Kim, T.; Eckert, J. Effect of cerium addition on microstructure and mechanical properties of high-strength Fe85Cr4Mo8V2C1 cast steel. Mater. Sci. Eng. A 2016, 674, 366–374. [Google Scholar] [CrossRef]
  33. Liu, H.; Fu, P.; Liu, H.; Sun, C.; Gao, J.; Li, D. Carbides evolution and tensile property of 4Cr5MoSiV1 die steel with rare earth addition. Metals 2017, 7, 436. [Google Scholar] [CrossRef] [Green Version]
Figure 1. Matrix structure of the Ti-1, Ti-2, and Ti-3 samples.
Metals 10 00837 g001
Figure 2. Location of the precipitated inclusions in the Ti-1, Ti-2, and Ti-3 samples.
Metals 10 00837 g002
Figure 3. Variation of Ti content with the size of the last-to-solidify region.
Metals 10 00837 g003
Figure 4. Two-dimensional morphologies of the inclusions in the samples. (a,c,d) MnS; (a,b) V-rich; (c,d,e,f) Ti–V-rich.
Metals 10 00837 g004
Figure 5. Variation of the number density of the inclusions in samples with the Ti content.
Metals 10 00837 g005
Figure 6. Aspect ratios (a) and size (b) of MnS inclusions in the samples.
Metals 10 00837 g006
Figure 7. Composition (a) and size (b) of Ti–V-rich carbide inclusions in the samples.
Metals 10 00837 g007
Figure 8. Composition (a–c) and size (d) of V-rich carbide inclusions in the samples.
Metals 10 00837 g008
Figure 9. Schematic diagram of the difference between the 2D and the 3D observations.
Metals 10 00837 g009
Figure 10. Elemental mapping of the primary carbide in the three-dimensional observation.
Metals 10 00837 g010
Figure 11. Three-dimensional morphologies of primary carbide in the samples.
Metals 10 00837 g011
Figure 12. Number density (a) and average size (b) of the primary carbides in the three-dimensional observation.
Metals 10 00837 g012
Figure 13. Equilibrium solidifications of H13 ingots. (a) Ti-1 sample; (b) Ti-2 sample; (c) Ti-3 sample.
Metals 10 00837 g013
Figure 14. Mass fractions of the main elements in the primary carbides. (a) Ti-1 sample; (b) Ti-2 sample; (c) Ti-3 sample.
Metals 10 00837 g014
Figure 15. Schematic diagram of the precipitation process of primary carbides during solidification.
Metals 10 00837 g015
Table 1. Chemical compositions of H13 ingots (wt.%).
SamplesCSiMnPSCrMoVTiN
Ti-10.361.000.600.0150.00755.501.400.970.0110.0045
Ti-20.391.000.600.0140.00725.501.400.980.0240.0045
Ti-30.381.000.600.0150.00755.501.400.960.0360.0044
Table 2. Precipitation temperature of the phases, °C.
SamplesSolidTi4C2S2Ti-V-RichV-RichMnS
Ti-11366.71395.11269.111601368.4
Ti-21369.31405.61271.21152.81267.2
Ti-31378.91414.41374.61150.31230.9