Abstract
Up to now, the Fe content of nonmetallic particles has often been neglected in chemical evaluations due to the challenging analysis of matrix elements in nonmetallic inclusions (NMI) in steel by scanning electron microscope and energy dispersive spectroscopy analysis (SEM/EDS). Neglecting matrix elements as possible bonding partners of forming particles may lead to inaccurate results. In the present study, a referencing method for the iron content in nonmetallic inclusions in the submicrometer region is described focusing on the system Fe-Mn-O. Thermodynamic and kinetic calculations are applied to predict the inclusion population for different Fe/Mn ratios. Reference samples containing (Fe,Mn)-oxide inclusions with varying Fe ratios are produced by manganese deoxidation in a high-frequency induction furnace. Subsequent SEM/EDS measurements are performed on metallographic specimens and electrolytically extracted nonmetallic inclusions down to 0.3 µm. The limits of iron detection in these particles, especially for those in the submicrometric regime, as well as the possible influence of electrolytic extraction on Fe-containing oxide particles are examined. The measured inclusion compositions correlate well with the calculated results regarding segregation and kinetics. The examinations performed are reliable proof for the application of SEM/EDS measurements to evaluate the Fe content in nonmetallic inclusions, within the physical limits of polished cross-section samples. Only electrolytic extraction ensures the determination of accurate compositions of dissolved or bonded matrix elements at smallest particles enabling quantitative particle descriptions for submicrometric (particles ≤ 1 µm) steel cleanness evaluations.
1. Introduction
Along with increasing quality demands, steel cleanness has recently gained major importance in modern steelmaking. Studying inclusion formation and modification over the production process is the basis for increased knowledge regarding steel cleanness control and optimization. Especially inclusion size [1,2] and composition [3] are known to essentially affect material properties which are finally crucial for material failure [4,5,6,7,8]. Thus, a comprehensive and reliable characterization of nonmetallic inclusions is indispensable [9]. Research groups and industries have been analyzing and simulating characteristics of nonmetallic inclusions in liquid and solid steel to improve final product properties for years [10]. Depending on the detectable inclusion size, available sample volume and required time effort, different characterization methods for steel cleanness exist. However, none of them covers the entire spectrum of inclusion properties for particles. As far as steel cleanness in the micro and submicro regime is concerned, automated and manual SEM/EDS analyses are well-established and powerful methods for studying nonmetallic inclusions. Their output consists of the number, size, distribution and chemical composition of particles on a given sample area. The measurement of chemical compositions needs to be considered with respect to the physical limits [11,12,13]. Several parameters and sources of errors need careful attention for an objective and scientifically sound evaluation: interaction volume, topography effects or stereological effects while measuring minor or trace elements [14,15].
Additionally, depending on the specific inclusion size, the surrounding matrix is often stimulated during SEM/EDS analysis. The first studies including matrix elements in particle considerations were conducted by Doohstmohammadi et al [16] and Pistorius et al. [14] with a different approach utilizing the intensity of Fe characteristic X-rays for (noniron-containing) particle depth assumptions. As of yet, the iron content of particles has more or less been neglected in particle considerations, often disregarding the effect of solute or bonded Fe on the inclusions’ behavior in various states as agglomeration, clogging or separation effects [17,18,19,20]. As an example, the question of mathematical correction of matrix interaction gets more and more relevant, the smaller the detected particle size. Even if inclusion characterization by means of SEM/EDS is a state-of-the-art method nowadays, various simplifications are still made when evaluating measurement results, which might have a substantial influence on the final data quality and subsequent conclusions.
The present paper deals with the fundamental question of how accurately matrix element contents in particles can be evaluated by SEM/EDS. Accordingly, the development, analysis and evaluation of Fe-containing nonmetallic inclusions in steel down to submicrometric particles are investigated. Special focus is put on the sample production itself, thermodynamic and kinetic calculations and the application of two different methods for inclusion analysis: automated SEM/EDS measurements on cross-section samples and filter residues after extraction of particles from the steel matrix. Different approaches to dissolving the surrounding steel matrix to enable a 3D analysis of particles have already been discussed in the literature [16,21,22]. The present paper uses an alternative approach, applying a new electrolyte in combination with samples out of the well-known Fe-Mn-O system. The aim is to study the practicability of electrolytic extraction of iron-containing inclusions in steel without affecting the particles’ composition or morphology. Based on that, the error of matrix interaction in SEM/EDS analysis for different size ranges is studied. As a result, a standard production and treatment methodology for related problems is derived. This referencing method especially improves the investigative problems for particles ≤ 1 µm in micro and submicro steel cleanness evaluations.
2. Materials and Methods
The procedure of creating a standard for analyzing Fe-containing particles in different samples was outlined by a holistic description of predicting, developing and evaluating nonmetallic inclusions. The aim was to classify the applicability of combining dissolution experiments with SEM/EDS technology on high iron-containing particles. For this purpose, an appropriate inclusion population needs to be defined and developed possibly avoiding distinct agglomeration or segregation effects. The theoretical setup was based on Mn deoxidation of a Fe-O master alloy. Different deoxidation levels were defined, resulting in deoxidation products with varying FeO contents. Due to the complete solubility of Fe and Mn in oxidic form, with an increasing Mn/O ratio, the amount of Fe in the particles decreases. Firstly, the change in the nonmetallic inclusions’ composition was described by thermodynamics and kinetics and secondly investigated on a laboratory scale. As a further step, the particles were analyzed by SEM/EDS in extracted and cross-sectional form. Finally, quantification of EDS results and a comparison to the theoretic calculations was performed leading to a referencing approach for matrix interaction error determination at inclusions < 0.5 µm during SEM/EDS analysis.
2.1. Thermodynamic and Kinetic Calculations
Theoretical considerations of inclusion populations were performed by Factsage7.3 (FSstel and FToxide databases (2019)) and a thermodynamic and kinetic model coupling nonmetallic inclusion formation and micro segregation. First, for an overview, the equilibrium conditions for the Fe-Mn-O system were evaluated regarding the systems stable phases at different temperatures by using Factsage7.3 Equilib (GTT-Technologies, Herzogenrath, Germany).
Additionally, a study of the inclusions’ changes during solidification of steel was achieved by the application of a model proposed by You et al. [23]. In this, the thermodynamic equilibrium calculation was performed by ChemApp [24] and the mentioned thermodynamic databases from FactSage. The solute enrichments in the residual liquid were predicted using an improved version of Ohnaka’s model [25], where the local partition and diffusion coefficients were calculated at each solidification step [26,27]. The stable phases, composition and precipitation sequence of the inclusions in the residual liquid steel and the effects of microsegregation were studied. In the present calculation, the cooling rate was set as 10 K/s. The predicted secondary dendrite arm spacing (SDAS) ranges from 16 to 22 µm, which corresponds well to the measured value. Input parameters for the model were the initial steel composition, cooling rate and SDAS. The equilibrium calculation of completely liquid steel (fs = 0) was performed at liquidus temperature. The stable inclusion phases in liquid steel and their compositions can be obtained from the calculation as exemplarily illustrated in Figure 1 assuming one of the investigated Mn/O ratios. In the present case, an increase of the FeO content in the illustrated nonmetallic phase was predicted during solidification. The behavior of each thermodynamically stable nonmetallic phase was calculated for all samples.
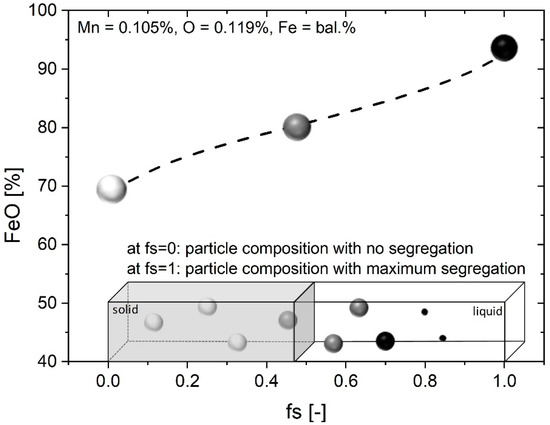
Figure 1.
Enrichment of nonmetallic phase during solidification according to [27].
2.2. Sample Production, Preparation and Analysis
The development of varying particle populations in steel samples was performed on a laboratory scale with sample weights of approx. 60 g. Figure 2 schematically displays sample conditions at room temperature and in the liquid phase.
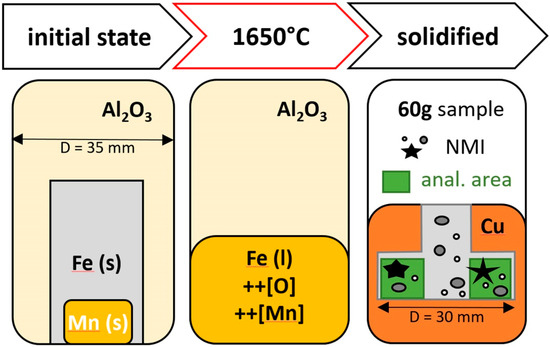
Figure 2.
Schematic overview of different states during sample production.
Ensuring a homogenized melt, sample handling without oxygen pickup and defined cooling conditions, the Fe-O master alloy was deoxidized with high purity manganese in a Lifumat Met.3 high-frequency remelter (HFR; Linn High Term GmbH, Eschenfeld, Germany) with a spin caster unit in inert Ar atmosphere. By superheating to 1650 °C for 1.5 min, equilibrium conditions before cooling are guaranteed. A solid–liquid–solid experimental process time of approx. 4 min and the use of a densely sintered Al2O3 crucible enable sample production without any refractory reactions. Solidification in a copper mold assures the best reproducibility for all samples. Thus, differences in chemistry or morphology can be attributed to the varying deoxidation potential. Chemical analyses of final compositions were carried out by emission-spectroscopy and in addition, the oxygen content was analyzed by means of LECO combustion analysis for the highest accuracy. Electrolytically reduced iron (99.99%Fe, Allied Metals) and manganese (99.98%Mn, Alfa Aesar) of highest purity were used as raw materials in order to avoid any contamination. In the subsequent analysis of the produced samples, no other elements were detected in the composition analysis. Varying chemical compositions of samples discussed in this work, summarized in Table 1, have the potential to form differing inclusion populations in composition and morphology.

Table 1.
Chemical compositions of Samples 1–7 in wt %.
SEM/EDS point measurements on nonmetallic inclusions were performed with a field-emitting secondary electron microscope (JEOL 7200F at 15 kV, probe current = 12, BED-C and WD = 10 mm; JEOL Germany GmbH, Freising, Germany) equipped with an 80 mm² SDD-EDS detector (Oxford Instruments xMax80; Oxford Instruments GmbH NanoAnalysis, Wiesbaden, Germany). The evaluation of chemical composition was performed both manually (Aztec Point&ID) and automatically (AZtecFeature 4.2; Oxford Instruments GmbH NanoAnalysis, Wiesbaden, Germany) on nonmetallic inclusions with various morphologies down to 0.3 µm in size at cross-sections and C-sputtered electrolytic extraction filters. Manual analyses were performed in two steps. In a first step, to justify the application of single-point EDS measurements, homogeneity of the inclusions was verified by concentration mappings. Due to the significant number of particles < 1 µm equivalent circle diameter (ECD), the overall inclusion content in the analyzed samples was extremely high, with up to 20,000 inclusions/mm2. This high inclusion number was mainly caused by the fact of applying Mn deoxidation to a melt without slag treatment and almost no time for inclusion separation. Therefore, the detection of particles > 2 µm ECD only in automated measurements, was hardly feasible for these samples. Consequently, in a second manual step, 50–100 particles for each particle class > 2 µm ECD were analyzed on the BSE image.
For automated measurements, considering the high number of particles, the measured sample area was only about 1 mm2 in all cases. Particle identification was performed by back-scattered electron contrast of the nonmetallic inclusions compared to the matrix. Greyscale parameters were calibrated on detected nonmetallic inclusion > 0.3 µm as listed in Table 2. All features darker than 20,000 operational units were measured by EDS point analysis in cross-section samples. In contrast, due to the bright appearance of (Fe,Mn)oxide inclusions on polycarbonate filters, inverse thresholds were used (Table 2). All events brighter than 10,000 operational units were analyzed in extracted form. After the analysis, further data processing was applied excluding scratches, porosities, grinding or polishing residues as well as insufficient measurements. Corresponding rules are also given in Table 2.
Table 2.
Greyscale parameters and EDS data processing thresholds.
For all cross-section samples, a distance of 1–6 mm relative to the HFR disks’ outer radius (D = 15 mm) was defined as the measurement area for manual as well as automated analyses (see Figure 2).
As a second method, electrolytic extraction was applied; to avoid chemical attack of particles during the extraction, a careful selection of the electrolyte was essential [22]. For the present study, an ionic liquid (choline chloride/urea = ≈1:1) with a dimethylformamide additive was used for electrolytic dissolution experiments (dissolution conditions: 60 °C, 0.1 A and 15 V for 180 min). This electrolyte already proved good stability and applicability for the extraction of (Fe,Mn)oxide inclusions in previous experiments by the authors [28]. Thus, the electrochemically stable nonmetallic inclusions were extracted and post processed by alternating ethanol washing and filtering. The filtering was a step-by-step sequence using a vacuum filtering system with polycarbonate filters (diameter = 50mm) with different pore sizes (12, 1, 0.4 and 0.1 µm). This means each filter contains a defined size fraction of particles and the overall number of inclusions per filter was functional for unaffected EDS analysis of particles. If only one filtering step with a small pore size was executed, a single measurement of extracted inclusions would have been impossible due to the extremely high overall particle number. In the end, carbon sputtering ensured the best performance in the high-resolution SEM. In Figure 3, particles of the same population are shown on a metallographic specimen and in an extracted state.
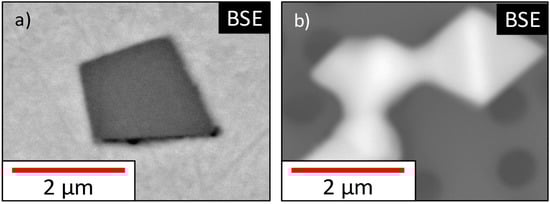
Figure 3.
Particles of the same origin in different states: cross-section (a) and extracted form (b).
The advantage of dissolution experiments regarding morphological particle analysis was obvious [29]. Possible influences of electrolytic extraction on EDS data acquisition and on chemistry or morphology of extracted nonmetallic inclusions were presented by comparing results of various particles and different sizes. Finally, the influence of EDS matrix interaction of small particles at automated and manual analysis on cross-sections can be validated; special focus was put on submicro particles for steel cleanness evaluations.
2.3. Relation Between Particle Classes and EDS Data Acquisition
To define detailed particle classes for evaluating preparation, measurement and segregation influences, two facts need to be considered: Firstly, initially forming particles tend to be larger than those precipitating during solidification. Secondly, especially for small particles, the surrounding Fe matrix falsifies the measured Fe value in inclusions in SEM/EDS analysis of cross-sections [30]. To create comparable values for extracted inclusions with the same Fe content one particle category must ensure matrix-free EDS analysis. Electron interaction bulb calculations with the Monte Carlo simulation model by CasinoV2.51 [31] resulted in a theoretical electron interaction depth of approx. 800 nm for MnO particles during EDS analysis. For particles larger than 1.6 µm in diameter, no influence of the surrounding matrix on the measured EDS result was calculated or observed. Combining these two facts with general morphological characteristics, three main inclusion morphology classes (A, B, C) were defined for two different groups of particle sizes: <0.5 µm and >2 µm in ECD.
These thresholds enable a comparison of all aforementioned issues. Particles between 2 and 0.5 µm were not considered due to the unclear transition from no EDS matrix interaction to a detectable EDS matrix interaction. The minimum particle size limit was set to 0.3 µm, below this size physical limits hinder a proper quantification. Due to solidification effects, samples can contain several inclusion populations. Depending on the initial sample composition inclusions can change their chemistry and/or morphology during cooling. In Figure 4, the defined particle classes are displayed, whereas filled symbols indicate EDS values of particles at classical sections of metallographic specimens (1) and unfilled symbols represent EDS values of electrolytically extracted particles measured on a C-sputtered filter (2):
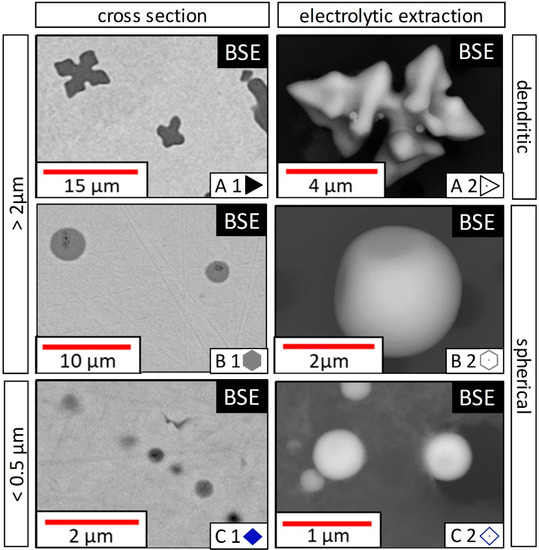
Figure 4.
Inclusion classes categorized by morphology and size.
- A: inclusions > 2 µm with an outstanding dendritic or faceted shape;
- B: inclusions > 2 µm with a spherical shape;
- C: inclusions < 0.5 µm.
Advantages of the mentioned morphology classes with varying FeO contents can be defined as follows:
- A1: optimum EDS conditions enabling measurements without matrix interaction at low FeO contents with distinctive morphology;
- B1: optimum EDS conditions enabling measurements without matrix interaction at medium to high FeO contents;
- C1: optimum EDS conditions, but massively falsified for all FeO contents due to size-dependent matrix interaction;
- A2, B2, C2: three-dimensional observation of particles without matrix interaction for all FeO contents.
Results for this work were acquired by contrasting explicit characteristics of the defined classes. In Table 3, the outcome of comparing the different particle populations was described, applicable (+) and not applicable (-) characteristics result in different outcomes (1–4).
Table 3.
Outcome of correlating characteristics and particle classes.
For evaluating the influence of the preparation method itself on the particles’ morphology and on EDS spectrum generation, a distinctive dendritic morphology as in Group A was necessary. Comparing A1 and A2, highly dendritic shapes must remain after electrolytic extraction. An accurate FactSage verification can be applied by measuring particles with optimum EDS conditions without any matrix interaction at spectrum generation. Therefore, FeO values of all A1 and B1 populations should be in accordance with the thermodynamically calculated ranges; C1 particles cannot be taken into account due to their falsified FeO results. Chemical dissolution or dissociation effects during electrolytic extraction can be evaluated by checking B2 and A2 particles against B1 and A1. To achieve quantification of matrix interaction at inclusions < 0.5 µm, C1 particle measurements need to be correlated to the corresponding C2 EDS result. So, the limits of the analyzing method on changes in particles’ chemistry can be evaluated.
3. Results and Discussion
In the following section, theoretical thermodynamic calculations and experimental results are compared. Depending on the deoxidation potential, the nonmetallic inclusion population of each sample resulted in (Fe,Mn)oxide particles with varying FeO content as shown in Table 4. Thermodynamic calculations revealed the occurrence of two possible nonmetallic phases: Slag inclusions theoretically existing in all samples, and mono particles becoming stable with a higher Mn/O ratio. Both types are theoretically increasing their FeO content during solidification (fs = 0 to fs = 1). After evaluating practical EDS results, only in Sample 3 inclusions of Class A (comparable to mono) and Class B (comparable to slag) exist at the same time. C inclusions are detected in all samples. As already stated beforehand, the overall number of detected particles is extremely high, mainly caused by the predominant percentage of C type inclusions accounting for more than 70% of the total inclusion population. A comparison of particle number between cross-section and filter is problematic. On extraction filters, nonmetallic inclusions positions can be randomly and irregularly distributed and each filter contains a defined size fraction of particles. Therefore, the complete area of each filtration step needs to be analyzed to correlate two-dimensional and three-dimensional particle densities. Due to the extremely high number causing a massive time effort for measuring, only single filter parts were analyzed automated and manually. This circumstance is also illustrated in Figure 5.
Table 4.
Calculated and measured wt %FeO.
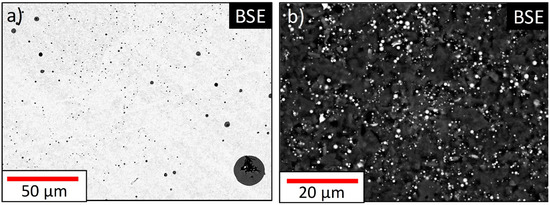
Figure 5.
BSE image of (a) cross-section and (b) polycarbonate filter of Sample 1.
In the following paragraphs, the resulting FeO values are discussed in detail and used for calculations and interpretations. The mean standard deviation for EDS results on cross-section samples ranges from 0.2% to 3.6%FeO for A1 and B1 classes supporting the 2 µm threshold for single-point EDS measurements on (Fe,Mn)oxide particles without matrix interaction. The extracted inclusion classes A2, B2 and C2 show a mean standard deviation up to 6.3%FeO, supporting the applicability of electrolytic extraction in the present case.
The influence of electrolytic extraction and carbon sputtering on EDS data acquisition (e.g., A(1-2)) in Section 3.2 is quantified by Equations (1)–(3). For easier comparison, in Section 3.3, mean FeO values (A and B) for each class without matrix interaction were calculated according to Equation (4).
3.1. Results of Thermodynamic Considerations in the Fe-Mn-O-System
According to FactSage 7.3 Equilib calculations, three phases can exist at a high iron content in the Fe-O-Mn system with respect to different Mn/O ratios, as shown in Figure 6. The liquidus projection for 1526.02 °C and additional isotherms in 50 °C steps are plotted. The calculation results presented in Figure 6 are in good accordance with the first calculations of Fischer et al. [32]. At low concentrations, both elements, Mn and O, are thermodynamically stable in a Fe solution. With increasing Mn and O, a liquid nonmetallic slag phase (slag (l)) and a solid (Fe,Mn)-oxide phase (mono (s)) exist at equilibrium conditions. The composition of Samples 1–7 displayed in the phase diagram indicates a change of the nonmetallic inclusion population from mainly slag to mono particles with increasing addition of deoxidation agent. Caused by different particle origins, differences regarding the final FeO content in the nonmetallic inclusions are expected.
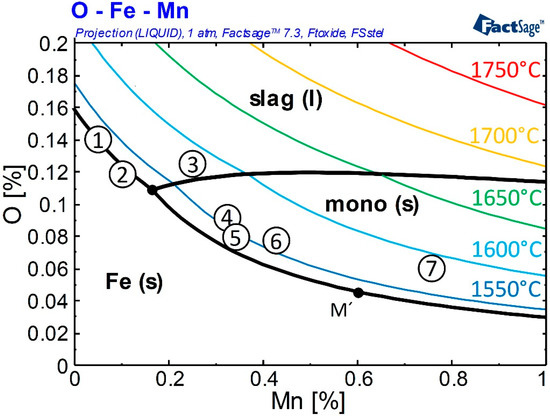
Figure 6.
Fe-Mn-O system M’ [32] and positions of Samples 1–7.
Depending on the melt composition, the nonmetallic system will increase in FeO or MnO content with decreasing temperatures. During solidification, the oxygen content in the liquid slag phase will constantly increase also leading to a higher FeO content in the particles. According to the literature [32], the solid particle phase of Sample 5 will increase the FeO content in the inclusion population by oxygen segregation below 0.6%Mn (M’). Sample 7, characterized by a higher amount of Mn, has the potential to increase the Mn content in the inclusion resulting in a decreasing FeO percentage in the particles. Figure 6 also demonstrates that there is no thermodynamic stability for nonmetallic particles at high temperatures. Superheating the melt above 1650 °C combined with the exceptional dendritic particle structure of high Mn containing oxides (Figure 4) indicates inclusion formation by supersaturation while cooling. Particles already formed during heating the raw materials should be completely dissolved at 1650 °C. Their presence in the re-solidified sample can thus be excluded. It is assumed that all detected particles formed during the cooling process.
Additional calculations are performed for a better understanding of possible segregation effects caused by cooling: To study the change in inclusion composition under nonequilibrium conditions, Mn/O ratios of Samples 1–7 are calculated as described in Section 2.1 and Figure 1. The results are shown in Table 4 and Section 3.3 as composition ranges from fs = 0 to fs = 1. Particles formed, should be within the ranges framed by calculated extreme values during solidification at 10 K/s cooling rate for slag and mono particles. With increasing Mn content, the compositions of both possible phases start overlapping. At an Mn/O ratio of 12.44 for Sample 7, only a minimum FeO segregation can be calculated. The presence of liquid slag particles at high Mn values is questionable; in literature [32] an increase of MnO in particles during solidification is assumed. Therefore, the existence of a liquid slag phase is attributed to the calculation procedure; at high Mn values, the limit of the segregation calculation may have been reached. An additional output of the segregation model used is the calculated amount of slag phase: The calculated fraction of nonmetallic phases during solidification changes due to varying deoxidation ratios. At the highest [O] activity and lowest Mn content, the inclusion population of Sample 2 consists of 100% slag. A higher Mn/O ratio in Sample 5 reveals 40% slag and 60% mono particles, and further increasing the addition of deoxidation agent in Sample 7 leads to an inclusion consisting of 94% of mono phase.
3.2. Influences of Preparation on EDS Data Acquisition A(1-2) and B(1-2)
The first practical validation step includes the evaluation of electrolytic extraction combined with carbon sputtering influencing data acquisition with respect to EDS values of cross-section measurements. Generally, an influence in analyzing extracted particles can be seen. At EDS data acquisition, the oxygen values of extracted particles can reach up to 60% in total. The high oxygen values measured may be caused by adsorbed oxygen, geometric effects of the particles with respect to the detector position or the carbon overflow creating a peak doubling phenomenon. Fe and Mn content are measured by SEM/EDS and oxygen are calculated stoichiometrically, for easier comparison. Figure 7 displays the difference caused by three-dimensional effects and sputtering indirectly influencing the EDS output for nonmetallic inclusions (NMI) > 2 µm. The different results between cross-section and extracted particle measurements (e.g., A(1-2)) are calculated according to Equations (1) and (2). A mean ∆FeO fluctuation of 3.7% is observed.
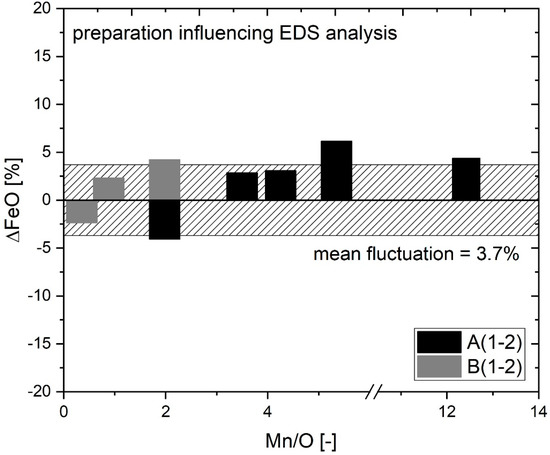
Figure 7.
EDS data evaluation for A(1-2) and B(1-2).
The occurrence of positive and negative ∆FeO deviation in Figure 7 supports size categorization for particles > 2 µm having no matrix interaction at cross-section analysis. Otherwise, a general positive ∆FeO as in C inclusions of 4.7–76.9% (Table 4) would be present in all samples. C(1-2) inclusions are not displayed due to their massive Fe falsification.
The affinity for electrochemical dissolution theoretically increases with increasing FeO content in the inclusion population. Particles of Sample 1 (90.6%FeO) are highly suitable for demonstrating a possible influence on inclusions’ composition by electrolytic extraction. A comparison between B1 particles and B2 particles of Samples 1 and 2 show a similar amount of FeO (∆2.5%). This indicates that electrolytic extraction does not affect the chemical composition of high iron-containing particles. Sample 7 with finest dendritic structures remaining for A1 and A2 inclusions (Figure 5) and a ∆FeO of 4.4% being within the range of calculated mean standard deviation affirms the assumption of a negligible influence of electrolytic extraction on inclusions’ properties in the present investigations.
An apparent increase of inclusion sizes caused by stereological effects of nonspherical particle classes before (A1: average = 4.5 µm; max = 18.2 µm) and after (A2: average = 9.1 µm; max.= 27.3 µm) electrolytic extraction affirms the advantage of three-dimensional SEM analysis for morphological particle evaluations. In contrast, mean sizes of spherical B1 (average = 2.8 µm; max = 20.8 µm) and B2 (average = 2.4 µm; max = 17.6 µm) inclusions are not affected by this effect.
3.3. Comparison of Theoretical Consideration and SEM/EDS Results
The aforementioned influences of thermodynamics and particle origins can be discussed, taking the unfalsified FeO content of different particles as an indication. Due to no indication of detected matrix interaction at A1 and B1 in EDS measurements (Figure 7, Table 4), the mean particle composition A and B (Equation (4)) can be displayed for a clearer representation. For particles of Category C, only C2 compositions can be considered. Figure 8 shows the particle compositions with respect to the calculated ranges for slag and mono phases according to the existing Mn/O ratio.
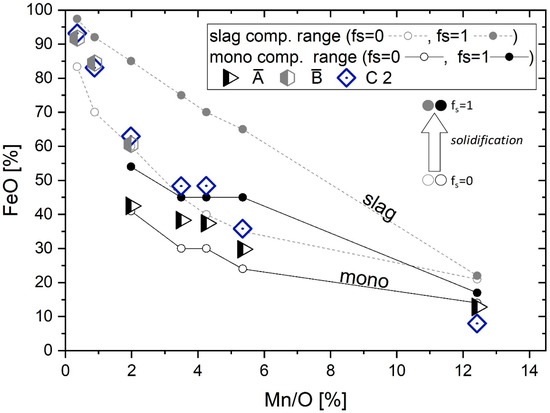
Figure 8.
Comparison of thermodynamic results with measured particle compositions.
In the diagram, the theoretically calculated composition corridors are in accordance with measured SEM/EDS values of the different nonmetallic particles. The beginning of sample solidification is indicated by fs = 0; particles can already exist before solidification. As already predicted by the equilibrium diagram in Figure 6, the particle population varies from slag to slag+mono resulting in a mono dominated inclusion population with increasing deoxidation potential. In the performed thermodynamic calculations, the existence of a slag phase at high Mn content may be attributed to the limits of an equilibrium consideration (complying with the mass balance). Neither in the literature [32] nor current measurement results’ compositions corresponding to the slag phase are observed at high Mn contents. Solid mono particles show a progressively dendritic shape with increasing Mn content of the system. The formed particles show the expected tendencies in chemical composition as well as a change in morphology. The nonequilibrium calculation is in good accordance with the measured values, which affirms both the good thermodynamic database and the applied modeling approach.
3.4. Evaluation of Produced Particle Population as Standard for EDS Measurements
The aim of the present paper is to develop a methodology for producing a nonmetallic inclusion population that can be used as a standard for EDS reference measurements of Fe-containing particles. Figure 9 displays the %FeO values of different single-point EDS particle measurements. In the diagram, the values of cross-section evaluations are contrasted to measurements on extracted particles. For every cross-section class, a corresponding %FeO value gathered after electrolytic extraction exists. In the following figure these values are used as coordinates (e.g., A1 vs. A2 = A(1,2)). If a matrix interaction is observed, the result deviates from the 1:1 line in the diagram by the amount of %FeO overestimation. Therefore, morphology classes A(1,2) and B(1,2) are located along the 1:1 line proving unaffected FeO EDS evaluation at particle sizes > 2 µm. The absolute error caused by different preparation methods can be visualized by the distance of the data points for A and B populations to the 1:1 line. Increasing relative errors with decreasing absolute content of a definite component need to be considered. Nevertheless, with a mean fluctuation of 3.7%FeO and standard deviations up to 6.6%FeO for extracted particles the described methodology demonstrates stunning accuracy.
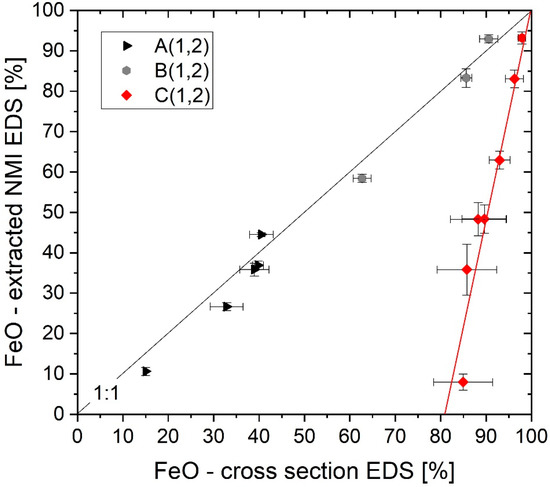
Figure 9.
Referencing cross-section with extracted nonmetallic inclusions (NMI) single-point EDS measurements.
Additionally, the mean values of several automated inclusion analyses for particles 0.3–0.5 µm are displayed with respect to the corresponding unfalsified extraction FeO values (C(1,2)). Unlike the other classes, the C(1,2) results show a high divergence from the 1:1 line. Due to significant matrix interaction, automated SEM/EDS measurements cannot be used yet for Fe quantification in small cross-section particles under the applied conditions. As explained beforehand, particles in the size range between 0.5 and 2 µm ECD were not considered in detail in the evaluations due to the uncertain transition of no to massive EDS matrix interaction; additionally, influenced by a significant effect of cutting position [14,16,33]. In Figure 9, inclusions in this size range would be located in the area between the 1:1 line and the C(1,2) results, showing no clear tendency or trend. For this reason, only very small particles (0.3–0.5 µm ECD) and inclusions > 2 µm in size have been considered.
However, Figure 9 provides a first indication for quantifying the influence of matrix interaction in automated SEM analysis of inclusions. Assuming particles with 0%FeO and 0.3–0.5 µm of size are measured by automated SEM/EDS (15kV), chemical information will be accompanied by steel matrix interaction, resulting in a quantified FeO overestimation of approx. 80%.
4. Summary and Conclusions
This paper examines the possible error caused by matrix interaction in automated SEM/EDS measurements of nonmetallic inclusions in steel, by analyzing particles with varying FeO content especially considering the influence of inclusion size and sample preparation. Theoretical considerations in equilibrium and nonequilibrium conditions enable comprehensible research reflecting various possible influence parameters on the final particle composition, even for particles at 0.3–0.5 µm in size. Samples with different nonmetallic inclusion populations were produced by Mn deoxidation on a laboratory scale with seven different Mn/O ratios. Reasonable accordance of theory and practical EDS measurements for defined measurement conditions at 15kV could be found. The main findings can be summarized as follows:
- A holistic methodology was established producing an inclusion standard for matrix element evaluations in nonmetallic inclusion analysis using the system Fe-Mn-O. This method of sample production, preparation and analysis can be applied for reference measurements to evaluate matrix interaction in SEM/EDS analyses.
- Electrolytic extraction applying a nonaqueous electrolyte (choline chloride and urea), has shown no negative effect neither on low nor on high iron-containing (Fe,Mn) oxides’ morphology and chemistry.
- A comparison between EDS results of cross-sections and filters for the analyzed samples, showed a mean EDS fluctuation of 3.7%FeO, which has to be considered as a quantification limit under the defined measurement conditions.
- First quantification of matrix interaction in submicro steel cleanness EDS evaluations for particle sizes < 0.5 µm resulted in 80%FeO overestimation at 15kV.
- However, for particles with ECD > 2 µm (A and B), the measured FeO content by SEM/EDS is a representative value applicable for further considerations.
The demonstrated detailed analysis combining theoretical and practical examination has identified the current possibilities and limits of iron content evaluations in nonmetallic inclusions emphasizing the role of particle size and morphology. The obtained results can be used as a reference for further research regarding particle formation or matrix element quantification by means of SEM/EDS. However, it was shown clearly that there is the need for further research on matrix element corrections of automated SEM/EDS measurements to fulfill the demanding needs towards a precise inclusion characterization, especially for small size classes.
Author Contributions
Conceptualization, A.M., S.K.M. and C.B.; methodology, A.M.; software, D.Y.; validation, P.P., formal analysis, A.M. and D.Y.; investigation, A.M.; resources, C.B.; data curation, A.M.; writing—original draft preparation, A.M.; writing—review and editing, S.K.M.; visualization, A.M.; supervision, S.K.M.; project administration, A.M.; funding acquisition, C.B. All authors have read and agreed to the published version of the manuscript.
Funding
This research received no external funding.
Conflicts of Interest
The authors declare no conflict of interest.
References
- Makino, T.; Neishi, Y.; Shiozawa, D.; Kikuchi, S.; Saito, H.; Kajiwara, K.; Nakai, Y. Rolling Contact Fatigue Damage from Artificial Defects and Sulphide Inclusions in High Strength Steel. Procedia Struct. Integr. 2017, 7, 468–475. [Google Scholar] [CrossRef]
- Sandaiji, Y.; Tamura, E.; Tsuchida, T. Influence of Inclusion Type on Internal Fatigue Fracture under Cyclic Shear Stress. Procedia Mater. Sci. 2014, 3, 894–899. [Google Scholar] [CrossRef][Green Version]
- Tervo, H.; Kaijalainen, A.; Pikkarainen, T.; Mehtonen, S.; Porter, D. Effect of impurity level and inclusions on the ductility and toughness of an ultra-high-strength steel. Mater. Sci. Eng. A 2017, 697, 184–193. [Google Scholar] [CrossRef]
- Atkinson, H.V.; Shi, G. Characterization of inclusions in clean steels: A review including the statistics of extremes methods. Prog. Mater. Sci. 2003, 48, 457–520. [Google Scholar] [CrossRef]
- Costa e Silva, A.L.V.D. The effects of non-metallic inclusions on properties relevant to the performance of steel in structural and mechanical applications. J. Mater. Res. Technol. 2019, 8, 2408–2422. [Google Scholar] [CrossRef]
- Garrison, W.M.; Wojcieszynski, A.L. A discussion of the effect of inclusion volume fraction on the toughness of steel. Mater. Sci. Eng. A 2007, 464, 321–329. [Google Scholar] [CrossRef]
- Kaushik, P.; Lehmann, J.; Nadif, M. State of the Art in Control of Inclusions, Their Characterization, and Future Requirements. Metall. Mater. Trans. B 2012, 43, 710–725. [Google Scholar] [CrossRef]
- Murakami, Y. Metal Fatigue: Effects of Small Defects and Nonmetallic Inclusions, 1st ed.; Elsevier Science Ltd.: Oxford, UK, 2002. [Google Scholar]
- Zhang, L.; Thomas, B.G. State of the Art in Evaluation and Control of Steel Cleanliness. ISIJ Int. 2002, 43, 271–291. [Google Scholar] [CrossRef]
- Bartosiaki, B.G.; Pereira, J.A.M.; Bielefeldt, W.V.; Vilela, A.C.F. Assessment of inclusion analysis via manual and automated SEM and total oxygen content of steel. J. Mater. Res. Technol. 2015, 4, 235–240. [Google Scholar] [CrossRef]
- Goldstein, J.I.; Newbury, D.E.; Michael, J.R.; Ritchie, N.W.M.; Scott, J.H.J.; Joy, D.C. Scanning Electron Microscopy and X-Ray Microanalysis; Springer: New York, NY, USA, 2018. [Google Scholar]
- Pistorius, P.C.; Verma, N. Matrix effects in the energy dispersive X-ray analysis of CaO-Al(2)O(3)-MgO inclusions in steel. Microsc. Microanal. 2011, 17, 963–971. [Google Scholar] [CrossRef]
- Tang, D.; Ferreira, M.E.; Pistorius, P.C. Automated Inclusion Microanalysis in Steel by Computer-Based Scanning Electron Microscopy: Accelerating Voltage, Backscattered Electron Image Quality, and Analysis Time. Microsc. Microanal. 2017, 23, 1082–1090. [Google Scholar] [CrossRef] [PubMed]
- Pistorius, P.C.; Patadia, A.; Lee, J. A Correction of Matrix Effects on Microanalysis of Calcium Aluminate Inclusions. In Proceedings of the AISTech 2013; AISTech: Pittsburgh, PA, USA, 2013. [Google Scholar]
- Pistorius, P.C.; Tang, D.; Ferreira, M.E. Consistency in Automated Inclusion Analysis. In Proceedings of the 9th International Conference on Clean Steel—Cleansteel 9, Budapest, Hungary, 8–9 September 2015. [Google Scholar]
- Doostmohammadi, H.; Karasev, A.; Jönsson, P.G. A Comparison of a Two-Dimensional and a Three-Dimensional Method for Inclusion Determinations in Tool Steel. Steel Res. Int. 2010, 81, 398–406. [Google Scholar]
- Diéguez-Salgado, U.; Michelic, S.; Bernhard, C. Investigation of Metallurgical Phenomena Related to Process and Product Development by Means of High Temperature Confocal Scanning Laser Microscopy; MPPE: Leoben, Austria, 2015. [Google Scholar]
- Sasai, K. Direct Measurement of Agglomeration Force Exerted between Alumina Particles in Molten Steel. ISIJ Int. 2014, 54, 2780–2789. [Google Scholar] [CrossRef]
- Sasai, K.; Misukami, Y. Mechanism of Alumina to continous caster nozzle reoxidation of molten steel. ISIJ Int. 2001, 41, 1331–1339. [Google Scholar] [CrossRef]
- Zheng, L.; Malfliet, A.; Wollants, P.; Blanpain, B.; Guo, M. Effect of Alumina Morphology on the Clustering of Alumina Inclusions in Molten Iron. ISIJ Int. 2016, 56, 926–935. [Google Scholar] [CrossRef]
- Inoue, R.; Ueda, S.; Ariyama, T.; Suito, H. Extraction of Nonmetallic Inclusion Particles Containing MgO from Steel. ISIJ Int. 2011, 51, 2050–2055. [Google Scholar] [CrossRef]
- Inoue, R.; Kimura, R.; Ueda, S.; Suito, H. Applicability of Nonaqueous Electrolytes for Electrolytic Extraction of Inclusion Particles Containing Zr, Ti, and Ce. ISIJ Int. 2013, 53, 1906–1912. [Google Scholar] [CrossRef]
- You, D.; Michelic, S.K.; Bernhard, C.; Loder, D.; Wieser, G. Modeling of Inclusion Formation during the Solidification of Steel. ISIJ Int. 2016, 56, 1770–1778. [Google Scholar] [CrossRef]
- Petersen, S.; Hack, K. The thermochemistry library ChemApp and its applications. IJMR 2007, 98, 935–945. [Google Scholar] [CrossRef]
- You, D.; Bernhard, C.; Wieser, G.; Michelic, S. Microsegregation Model with Local Equilibrium Partition Coefficients During Solidification of Steels. Steel Res. Int. 2016, 87, 840–849. [Google Scholar] [CrossRef]
- Ohnaka, I. Mathematical Analysis of Solute Redistribution during solidification with doffusion in Solid Phase. ISIJ Trans. 1986, 26, 1045–1051. [Google Scholar] [CrossRef]
- You, D.; Michelic, S.; Bernhard, C. Formation of Multi-Type Inclusions during the Cooling and Solidification of Steel: A Trend Model. Metals 2018, 8, 452. [Google Scholar] [CrossRef]
- Mayerhofer, A.; Michelic, S.K.; Bernhard, C. Analyse von Fe, Mn-Oxiden mittels REM/EDX: Bringt die elektrolytische Extraktion was sie verspricht? In Proceedings of the Materialographietagung 2019, Dresden, Germany, 18–21 September 2019; pp. 181–186. [Google Scholar]
- Janis, D.; Inoue, R.; Karasev, A.; Jönsson, P.G. Application of Different Extraction Methods for Investigation of Nonmetallic Inclusions and Clusters in Steels and Alloys. Adv. Mater. Sci. Eng. 2014, 2014, 1–7. [Google Scholar] [CrossRef]
- Pistorius, P.C.; Patadia, A. The Steel Matrix Affects Microanalysis of CaO-Al2O3-CaS Inclusions. In Proceedings of the 8th International Conference on Clean Steel—Clean Steel 8, Budapest, Hungary, 14–16 May 2012. [Google Scholar]
- Drouin, D.; Couture, A.R.; Joly, D.; Tastet, X.; Aimez, V.; Gauvin, R. CASINO V2.42: A fast and easy-to-use modeling tool for scanning electron microscopy and microanalysis users. Scanning 2007, 29, 92–101. [Google Scholar] [CrossRef]
- Fischer, W.A.; Fleischer, H.J. Die Reaktionen von manganhaltigem Eisen mit seinen Oxyden im Kalktiegel bei 1600 bis 1800 °C. Archiv Eisenhüttenwesen 1961, 32, 305–313. [Google Scholar] [CrossRef]
- Michelic, S.; Wieser, G.; Bernhard, C. On the Representativeness of Automated SEM/EDS Analyses for Inclusion Characterization with Special Regard to the Measured Sample Area. ISIJ Int. 2011, 51, 769–775. [Google Scholar] [CrossRef][Green Version]
© 2020 by the authors. Licensee MDPI, Basel, Switzerland. This article is an open access article distributed under the terms and conditions of the Creative Commons Attribution (CC BY) license (http://creativecommons.org/licenses/by/4.0/).