Article

Wear Behaviour of High Strength Tool Steel 90MnCrV8 in Contact with Si3N4

Faculty of Special Technology, Alexander Dubcek University of Trenčín, 911 06 Trenčín, Slovakia
*
Author to whom correspondence should be addressed.
Metals 2020, 10(6), 756; https://doi.org/10.3390/met10060756
Submission received: 14 May 2020 / Revised: 4 June 2020 / Accepted: 4 June 2020 / Published: 6 June 2020

Abstract

:
Tool steels are used in technological processes of forming and cutting and as cutting tools due to their good mechanical properties. During their working cycle, steels are exposed to several aggressive conditions, such as thermal stress, fatigue and various forms of wear. In this article, the selected 90MnCrV8 tool steel slid against the Si3N4 testing ceramic bearing ball. All measurements were performed on a universal tribometric device UMT TriboLab (TA Instruments, New Castle, Delaware, USA) under dry conditions. The main objective of the performed experiments was to analyse the frictional properties and compare the wear of the 90MnCrV8 tested tool steel in contact with the 6.35 mm diameter ceramic ball at different friction speeds. In this measurement evaluation, the authors of the article mainly focused on the influence of the magnitude of the peripheral speed on the wear change and coefficient of friction. Further analysis was focused on the change of surface roughness of the counterpart ceramic balls as well as of the tested tool steel samples. Experimental results show the fact that tested tool steels, which can also be considered as high strength steels, can also successfully represent wear-resistant steels. It has been shown experimentally that increasing the friction speed also leads to significant degradation of the material on the sample surface. Finally, the effect of hardness on wear has also been experimentally demonstrated. The Si3N4 ceramic ball with its high strength also behaves like an abrasive, thus increasing the wear rate on the experimental tool steel samples.

1. Introduction

In industrial practice, a variety of tool steels are used in the manufacture of various components, which are subject to high stress and wear during processes of friction that have a large impact during their operating life. They are most often used in milling, drilling, sawing and measuring instruments, as well as in the production of various types of dies and moulds. In recent years, many researchers have focused on the study of wear processes in several types of tool steels. Bourithis et al. [1] examined the wear properties of two tool steels (X153CrMoV12 steel and O1 steel) using the pin on disc method. Their results clearly show that the microstructure of tool steel has a significant influence on determining the wear properties. Besides, Omer and Muammer [2] studied and compared the wear of seven different materials (X153CrMoV12, Vanadis 4, Vancron 40, K340 ISODUR, Caldie, Carmo, and 0050A) using a newly developed wear test device. Miloradovič et al. [3] investigated the tribological behaviour of zinc–aluminium alloy by the block on ring method in dry sliding friction. In all these performed tests, the 90MnCrV8 tool steel was used as the opposite sliding surface. These results show the fact that the coefficient of friction decreases as the sliding speed increases, while the wear rate also decreases. Ekinovic et al. [4] considered, in their work, the concept of “machinability” under the different cutting conditions. The intention of the authors was to determine the change in the behaviour of steel in comparison with conventional and modified machining conditions. The investigation was performed on steel 90MnCrV8 DIN, known to be a material that has “good machinability”. Cutting conditions as well as workpiece properties were set to enclose the transition region from conventional to high-speed machining. The quality of the machined surface was chosen as the measure of machinability. The results also focused on the basic annealed state of the tested material. It was shown that the basic annealed state of the tested workpiece material leads to an increase in the surface quality of the material and a reduction in the tool wear. Dubovská et al. [5] analyzed the differences between hard finish turned and grinded functional surfaces of hardened steel and measured wear on the special tribological device. Dobrocký et al. [6] also performed an analysis of tribological properties of layers created by plasma nitriding + DLC (Diamond-like Carbon) coating. Jaroš et al. [7] investigated the influence of Physical Vapour Deposition (PVD) coatings for dry groove milling on the 90MnCrV8 steel. The main emphasis of their studies was on understanding the modification of the formation of three types of PVD coating. The main aim of the experiment was to compare PVD coated and uncoated milling cutters and to find out the advantages of PVD coatings in the slot milling process. The main changing parameters in their realized experiments were force loads. The flank wear rate of the tested cutting tools was monitored to determine the results. Their results clearly show the fact that the PVD coating of the selected tool steel significantly improves the flank wear rate during the selected machining process. It is clear from their achieved results that the flank wear rate on the tested cutting tool also increases with increasing of force load. Knowledge of the coefficient of friction is also important, for example, in other numerical simulations, where generally known values are usually used, which arise between individual contacts of materials in order to achieve good simulation results [8,9,10,11]. However, it is obvious that friction usually depends on several input factors such as speed, pressure, type of material that is in contact with the temperature and surface roughness. It should be appreciated that most of the authors in the article dealing with the friction of tool steels and their wear mainly focus on one particular material, which is mostly surface-treated or uses very low loads, but that does not occur in practice at all. Krbaťa et al. [12], who are authors of this article, have already studied this type of tool steel and investigated the mechanical and tribological behaviours of the 90MnCrV8 steel after a plasma nitriding process. The investigated steel was plasma nitrided and examined for wear resistance using the pin-to-disc method. Their results showed that the surface nitriding layer significantly improves the mechanical and tribological properties of the selected tool steel.
In the processes of realized experiments, dry sliding friction on the 90MnCrV8 tool steel and comparison of wear in contact with the Si3N4 ceramic bearing ball was investigated. The whole measurement process was performed on the universal tribometric instrument UMT TriboLab, where the main changing parameter was the peripheral speed of rotation (0.2, 0.4, 0.6, 0.8, 1.0 and 1.2 m/s). The basic microstructure of the tested tool steel was investigated by light optical microscopy (LOM) as well as by atomic force microscopy (AFM). Using AFM microscopy (Oxford Instruments Asylum Research, Santa Barbara, CA, USA) a high-resolution microstructure was observed, as well as the size and shape of the individual phases formed in the microstructure of the material. Using the AFM microscope, 3D topographies of the counterpart ceramic balls as well as the formed grooves were obtained and the resulting roughness was determined after individual experiments. All obtained friction coefficient and wear results are discussed in the next part of the article. Figure 1 shows a typical friction coefficient curve, which can be divided into two main parts. The first part of the curve is called a transition part, is comprised of the run-in part and has a generally short linear part in the curve. At the end of this part, the peak of the coefficient friction usually occurred. The second part of the curve is the so-called steady state period, where the friction coefficient curve is already stabilized. Depending on the selected parameters and types of contact pairs, the second part of the curve may have either a slightly decreasing or a rising direction.

2. Materials and Methods

The base material used in this experiment was the 90MnCrV8 high strength tool steel. This type of examined steel is one of the low alloy tool steels used for less stressed cutting tools and lower cutting speeds. This steel is predominantly alloyed with manganese, chrome and a small amount of vanadium.
This steel is predominantly used in the engineering industry and is characterized by high hardenability and high dimensional stability after heat treatment and is also suitable for oil quenching. Furthermore, it can also be used for various forming dies, moulds, sheet drawing tools, extruders, etc., for complex shape, medium stressed moulds for pressing metal and non-metal powders and for plastics processing with the requirement for good dimensional stability during heat treatment. Finally, it is also used for hand tools and tools such as taps and various types of gauges. Table 1 shows both the prescribed and measured chemical composition using the Q4 Tasman chemical analyser. The fundamental mechanical properties are shown in Table 2.
The experimental material was supplied in the form of a rod with a diameter of 90 mm and a length of 500 mm. The supplied material was produced in electric furnaces with the possibility of so-called treatment of liquid steel in aggregates of secondary metallurgy. The 90MnCrV8 steel was supplied in a soft annealed condition with heating at 700 °C throughout the cross-section, followed by cooling in the furnace at a rate of 20 °C/h with a maximum hardness of 230 HV5. The microstructure of the base material showed the presence of coarse and fine spheroidized carbide particles in the ferrite matrix. This matrix is highly machinable and offers less resistance to deformation compared to other microstructures formed during hardening of tool steels. The larger spheroidal carbide particles are shown in Figure 2 where the primary Fe3C carbides are formed during solidification, and have dispersed as a result of the heat treatment. Finer carbides are formed from secondary precipitation during carbide spherodization. These are formed by the transformation of austenite into the microstructure of ferrite carbides by cooling after earlier normalization of heat treatment [13].
The microstructure of basic sample was evaluated using LOM and AFM. The samples were etched with a 3% Nital etchant. For AFM, a silicon tip with a radius of 7 nm and a spring constant of 26 N/m was used for the measurement. The microscope worked in the tapping mode, where the tip was not in constant contact with the tested surface, but only tapped on it to achieve longer service life, and especially to keep the tip as sharp as possible for longer measuring time, which was for each figure about 1800 s to achieve desired resolution.

2.1. Hardness Test

Hardness was measured using a Vickers hardness testing machine (Instron Wolpert 930, Norwood, MA, USA) equipped with diamond indenter under the load applied of 49.05 N and dwell time of 10 s. An average of five indentations for each sample were measured. Hardness verification was measured on the experimental material as well as on the counterpart ball. The hardness measurement was always carried out in five places for its qualitative determination.

2.2. Dry Sliding Test

Wear tests were performed using the UMT TriboLab high-speed rotary module (Figure 3). The configuration of the UMT TriboLab device was set to the ball-on-disc measurement method using one kind of pressing material [14]. This material was the Si3N4 silicon nitride ceramic ball, which is used in bearings, with a diameter of 4.76 mm. Silicon nitride is difficult to produce as a bulk material—it cannot be heated over 1850 °C, which is well below its melting point, due to dissociation to silicon and nitrogen. Therefore, application of conventional hot press sintering techniques is problematic. An alternative is to use spark plasma sintering where heating is conducted very rapidly (seconds) by passing pulses of electric current through the compacted powder. Dense silicon nitride compacts have been obtained by this technique at temperatures from 1500 to 1700 °C. Silicon is stabilized by nitrogen and can form three crystallographic structures, designated as α, β and γ phases. The α- and β-Si3N4 have trigonal (Pearson symbol hP28, space group P31c, No. 159) and hexagonal (hP14, P63, No. 173) structures, respectively, which are built up by corner-sharing SiN4 tetrahedra. They can be regarded as consisting of layers of silicon and nitrogen atoms in the sequence ABAB... or ABCDABCD... in β-Si3N4 and α-Si3N4, respectively. The Si3N4 tetrahedra in β-Si3N4 are interconnected in such a way that tunnels are formed, running parallel with the C-axis of the unit cell. Due to the c-glide plane that relates AB to CD, the α structure contains cavities instead of tunnels. The longer stacking sequence results in the α-phase having higher hardness than the β-phase. However, the α-phase is chemically unstable compared with the β-phase. At high temperatures when a liquid phase is present, the α-phase always transforms into the β-phase [15,16,17,18]. Therefore, β-Si3N4 is the major form used in Si3N4 ceramics, as was the case for our example (Figure 4a).
Principle of experimental measurements and the pin-on-disk method are shown in Figure 4b. Before the start of the tests, all balls and tested samples were degreased, rinsed with ethanol and air dried.
Rotational tribometric tests were performed at load of 50 N. The extruded ceramic ball was firmly clamped in the holder and slid on the tool steel at a set speed over a diameter of 19 mm without using lubrication. Samples of tool steels were made in the shape of a disc with a diameter of 50 mm and a thickness of 10 mm. Table 3 summarizes the measurement parameters, each measurement being repeated three times to obtain an average value. All measurements were performed at room temperature. Friction coefficients were continuously registered during the test. The maximum contact area was considered for wear. The volume loss of the test material was calculated by multiplying the length of the glide path by the cross-section of the worn area.
The UMT Tribolab tribometric instrument automatically calculates and records the coefficient of friction (COF) with the help of electrical sensors using the ratio of the normal force and the horizontal frictional force.

2.3. Roughness of Counterpart Balls and Tool Steel

The surface roughness of the balls and tested tool steels was evaluated by AFM microscopy. The measurements were carried out at five different areas each time and average values of roughness were calculated. The arithmetical mean height (Sa) was used as the main roughness parameter. This parameter expands the profile (line roughness) parameter Ra three-dimensionally. It represents the arithmetic mean of the absolute coordinate Z (x,y) within the evaluation area. It provides stable results since the parameter is not significantly influenced by scratches, contamination and measurement noise.
The averaged result of the roughness of the pressure balls is shown in Figure 5a. The resulting roughness value Sa for the Si3N4 ceramic ball was 0.148 µm.
The surface roughness of the experimental tool steels together with their average value is shown in Figure 5b. The samples were made on a lathe, where finish turning was used during the last machining cycle. The resulting roughness of the individual tool steels had similar values and their average value was Sa = 0.161 µm.

3. Results and Discussions

3.1. Wear Behaviour

Wear was evaluated in the form of a specific wear rate W depending on the sliding distance. Specific wear rate was calculated as:
W = V F · l
where V is the volume loss, F is the applied load and l is the total sliding distance. The volume loss in cubic millimeters was measured on samples using an optical microscope. The measured sample was transversely cut to observe the cross-section of the friction surface. Subsequently, the test area of the material was marked and then was removed in a subsequent experiment. It is possible to see the area of the removed material indicated by a red colour in Figure 6. This area was then multiplied by the length of the glide path to calculate the material volume loss.
The volume loss of the testing pressure ball material was also calculated and considered, after which the two wear values were compared. The volume loss calculation of the worn counterpart ball material is:
V = π · h 2 · ( r h 3 )
where h is the height of the worn ball part and r is the radius of the ball. The Si3N4 ceramic material has a very high hardness value of 2196 HV5 compared to the hardness of the experimental tool steel 90MnCrV8, which has only 230 HV5. This difference represents more than nine times higher hardness of ceramic material.
The volume loss of the selected tool steel compared to the friction rate is shown in Figure 7 and Figure 8. It is possible to observe, and it is clear from the obtained results, that the change in friction speed significantly affects the wear of the tested tool steel. The results show the fact that, when a greater value of the friction speed is used during testing, the wear of the test material is greater. The lowest volume loss of 0.350 mm3 can be observed at the lowest friction speed of 0.2 m/s, while the largest volume loss of 0.451 mm3 can be seen at the highest friction speed of 1.2 m/s. The Si3N4 ceramic material was also removed from the ball during experiments. Since this ceramic material is more than nine times harder than the experimental tool steel, the obtained results of the ball wear are also comparatively smaller. Contact of the ceramic ball with the investigated tool steel results in so-called micro-peeling of the material. This acts as an abrasive particle and creates a cutting edge that cuts the material from the experimental sample [19]. At a lower friction speed from 0.2 to 0.4, significant scratches can be observed on the contact surfaces. Figure 9 shows individual friction coefficient curves as a function of friction speed. The highest value of the coefficient of friction was reached at the lowest friction speed (Figure 9a) and the lowest value of the coefficient of friction was achieved at the highest friction rate (Figure 9f). It is possible to perform a comparison of all six friction coefficient measurements that are overlapped by the y = A1 + (A1A2)/(1 + (x/x0)p) function for better comparison (Figure 10a). The results clearly indicate that a decreasing value of the friction coefficient is associated with an increase in the friction speed of the measurement. Several factors influence these results. The first is to increase the temperature between the contact materials due to the increase in the friction rate. According to several authors [20,21,22], an increasing of the temperature reduces the coefficient of friction due to formation of a so-called “glaze” layer, consisting of sintered iron oxide wear particles. The formation of this layer, which works as a protective coating, is promoted at higher temperatures. Another factor is the contact area that mediates the transmission of movement. However, it is not the geometric area that matters, but the actual area of contact, which is always smaller. The actual surface contact is dependent on the roughness of the contact bodies at which the peaks of these surfaces interact. As the load increases, these peaks are abraded, and the contact area is increased, concerning which the contact pressure is gradually distributed. This abrasion also generates the heat and transforms it into a reduction in the coefficient of friction [23]. The resulting roughness of the base material was Sa = 0.161 µm, which is a very low value. Comparison of the average values of the friction coefficients is shown in Figure 10b. The individual curves were divided into three parts, of which the first part is the initial part of the friction process. The average value of each measurement was thus calculated from two thirds of the friction process.
Considering the load and the total sliding distance, the dependence between the specific wear rate and the sliding velocity was created (Figure 11). The results show that for tool steel the specific wear rate decreases with increasing sliding velocity. This decrease was up to almost 80% at the highest speed compared to the slowest. A similar situation was shown in the case of the ceramic ball, where the wear rate also decreased with increasing speed. In this case, the decrease in wear rate was about 50% between the highest and lowest speed. This ceramic material has excellent mechanical properties and therefore can withstand much greater wear than experimental tool steel.

3.2. Wear Mechanisms

A more detailed examination of the worn surface by means of an optical microscope identifies two kinds of wear. These two types of wear occur either separately or simultaneously depending on the friction speed. The first type is abrasive wear, which creates deep scratches in the materials due to peeled hard microparticles. These hard microparticles of the released material move freely and form cutting edges that later create deep scratches directly in the tested material or fill in the resulting microcraters. These released microparticles become harder than the base material due to intense plastic deformation or oxidation by air. The two surfaces rubbing against each other are never ideally smooth and the contact does not occur on the entire surface, but on many contact points. Due to the forces, the peaks of the protrusions on the surface are plastically deformed and the atoms of both surfaces are in close contact and form so-called micro-couplings. All these micro-couplings later break at the points above the material contact on one of the friction bodies due to the formation of a surface area. This area is reinforced by plastic deformation and the strength is higher than that of the subsurface areas in Figure 12a. When the micro-couplings were broken, the microparticles were transferred from the surface of one body to the other. These remained attached to the surface of the second body. Alternatively, as loose particles, they moved between materials and encouraged the formation of additional abrasive particles. As the friction speed increased, the wear conditions subsequently changed. Due to the increase in speed, the method of wear also changed to adhesive. Plastic deformation also occurred during adhesive wear in Figure 12b. The experimental material was gradually strain hardened to form a hard shell that resisted volume wear. While this hard shell had a higher hardness than the base material, it also increases its brittleness. Microcracks form on the shell surface due to cyclic loading. These microcracks are mostly perpendicular to the axis and when they cross, the worn part, which has the shape of a thin scale, is torn off. These thin shells of material are gradually crushed and turned into hard abrasive microparticles. Figure 13 shows all ceramic balls used in the realized experiment. In Figure 13a,b scratches, which have been caused by abrasive wear, are visible. A low friction rate of 0.2 and 0.4 m/s was used with these ceramic balls. Due to the load, micro-abrasive particles were formed. Due to the lower frictional speed, the particles were not able to deform into even finer microparticles and large scratches were formed on the surface of the friction ball by abrasive action. As the friction speed gradually increased, these grooves gradually ceased to appear. Subsequently, only adhesive wear on the surface of the friction ball was recorded.
For a deeper examination of the friction mechanism, two balls are selected, which are shown in Figure 14. Figure 14a shows a ceramic ball at a friction speed of 0.2 m/s and it is possible to observe deep grooves formed mainly by abrasion wear. Figure 14b shows the ball at a maximum friction speed of 1.2 m/s. In this case, the surface is completely different and there is a typical adhesive wear, which is accompanied by the occurrence of adhesive craters and deep ploughing grooves [24].

3.3. Analysis of Surface Roughness

Figure 15 shows the resulting roughness on the experimental material in the formed grooves. The roughness of the basic samples after their production was Sa = 0.161 µm. The roughness values had a decreasing character due to the increasing of friction speed. At the lowest friction speed of 0.2 m/s, deep scoured craters formed on the friction groove surface (as can be seen in Figure 15a). As the speed gradually increased, the roughness of the grooves was reduced. As the friction speed increased, the contact ceramic material behaved like a grinding wheel, since it was much harder than the experimental material. Figure 15b,c show a decrease in the size and depth of the craters. The improvement in the overall roughness of the grooves is also clearly visible from Figure 15d. Deep craters in the grooves no longer arise and thus the roughness of the grooves achieves better values. In Figure 15e,f, only small parallel grooves on the surface are clearly visible. The lowest groove roughness value was obtained for the last sample on which the highest friction speed was used.
As regards the roughness of the worn surfaces of the ceramic balls, qualitatively better roughness results were obtained here than on experimental tool steel. The highest surface roughness of the tested balls was Sa = 53 nm. Unlike experimental tool steel, the roughness on a ceramic ball at friction speed does not have large craters. Thus, it is rather a rotation of peaks and recesses in the same spacing (seen in Figure 16a). At another ball and with a speed of 0.4 m/s, a similar roughness effect was achieved except that the resulting roughness was reduced to Sa = 52 nm (seen in Figure 16b). The intensity of the alternation of the peaks and recesses increases with respect to the measured roughness area, as can be seen in Figure 16c,d. They also improve their roughness values at Sa = 50 nm and 48 nm, respectively. In Figure 16e,f, only very small parallel grooves are visible on the surface of the test balls. The smallest surface roughness value of the ball was obtained for the last sample Sa = 41 nm.
Figure 17a shows the average roughness of the grooves formed on the surface of the experimental tool steel. Here, it can be observed that, at the lowest friction speed of 0.2 m/s, the roughness of the experiment process was up to nine times higher than at the highest friction speed. From this it can then be concluded that, as the friction speed increases, the resulting roughness of the material under investigation is significantly influenced. The resultant average roughness of the compared pressure ceramic balls can be seen in Figure 17b. The direction of the curve has the same character as in the previous case, and the resulting surface roughness decreases as the friction speed increases. The only significant factor distinguishing from the previous resulting roughness is that the difference between the highest and lowest roughness is only about 0.2 times smaller. This small difference is related to the hardness of the pressure ceramic ball, which is more than nine times greater than in the examined tool steel. Moreover, very interesting is the fact that at the highest friction speed of 1.2 m/s the same roughness of both the ceramic counterpart ball and the experimental material was achieved. This phenomenon can be explained by the fact that with increasing of the friction speed also increases the contact temperature, which significantly affects the mechanical properties of the materials. First, the hardness of the tool steel is reduced. However, since the ceramic material is much harder and resistant to high temperatures, its qualitative mechanical properties exceed the mechanical properties of the investigated steel. The hard-ceramic ball becomes abrasive at a friction speed of 1.2 m/s and then abrades the tool steel surface under the influence of load and temperature. The examined tool steel then only copies the frictional contact surface of the counterpart ball.

4. Conclusions

In this study, the tribological processes of the 90MnCrV8 test steel in contact with Si3N4 based ceramic material, which was in the form of bearing balls, were investigated. The whole experiment was performed under dry condition and constant load. The only changing parameter was the peripheral speed, which was set at 0.2 to 1.2 m/s. In this evaluation, the authors also focused on the change of surface roughness of experimental samples as well as counterpart ceramic balls. The following conclusions can be drawn from the present work:
(1)
Tool steels that also belong to high strength steels can successfully represent wear resistant steels. Because their chemical composition positively supports the resulting mechanical properties.
(2)
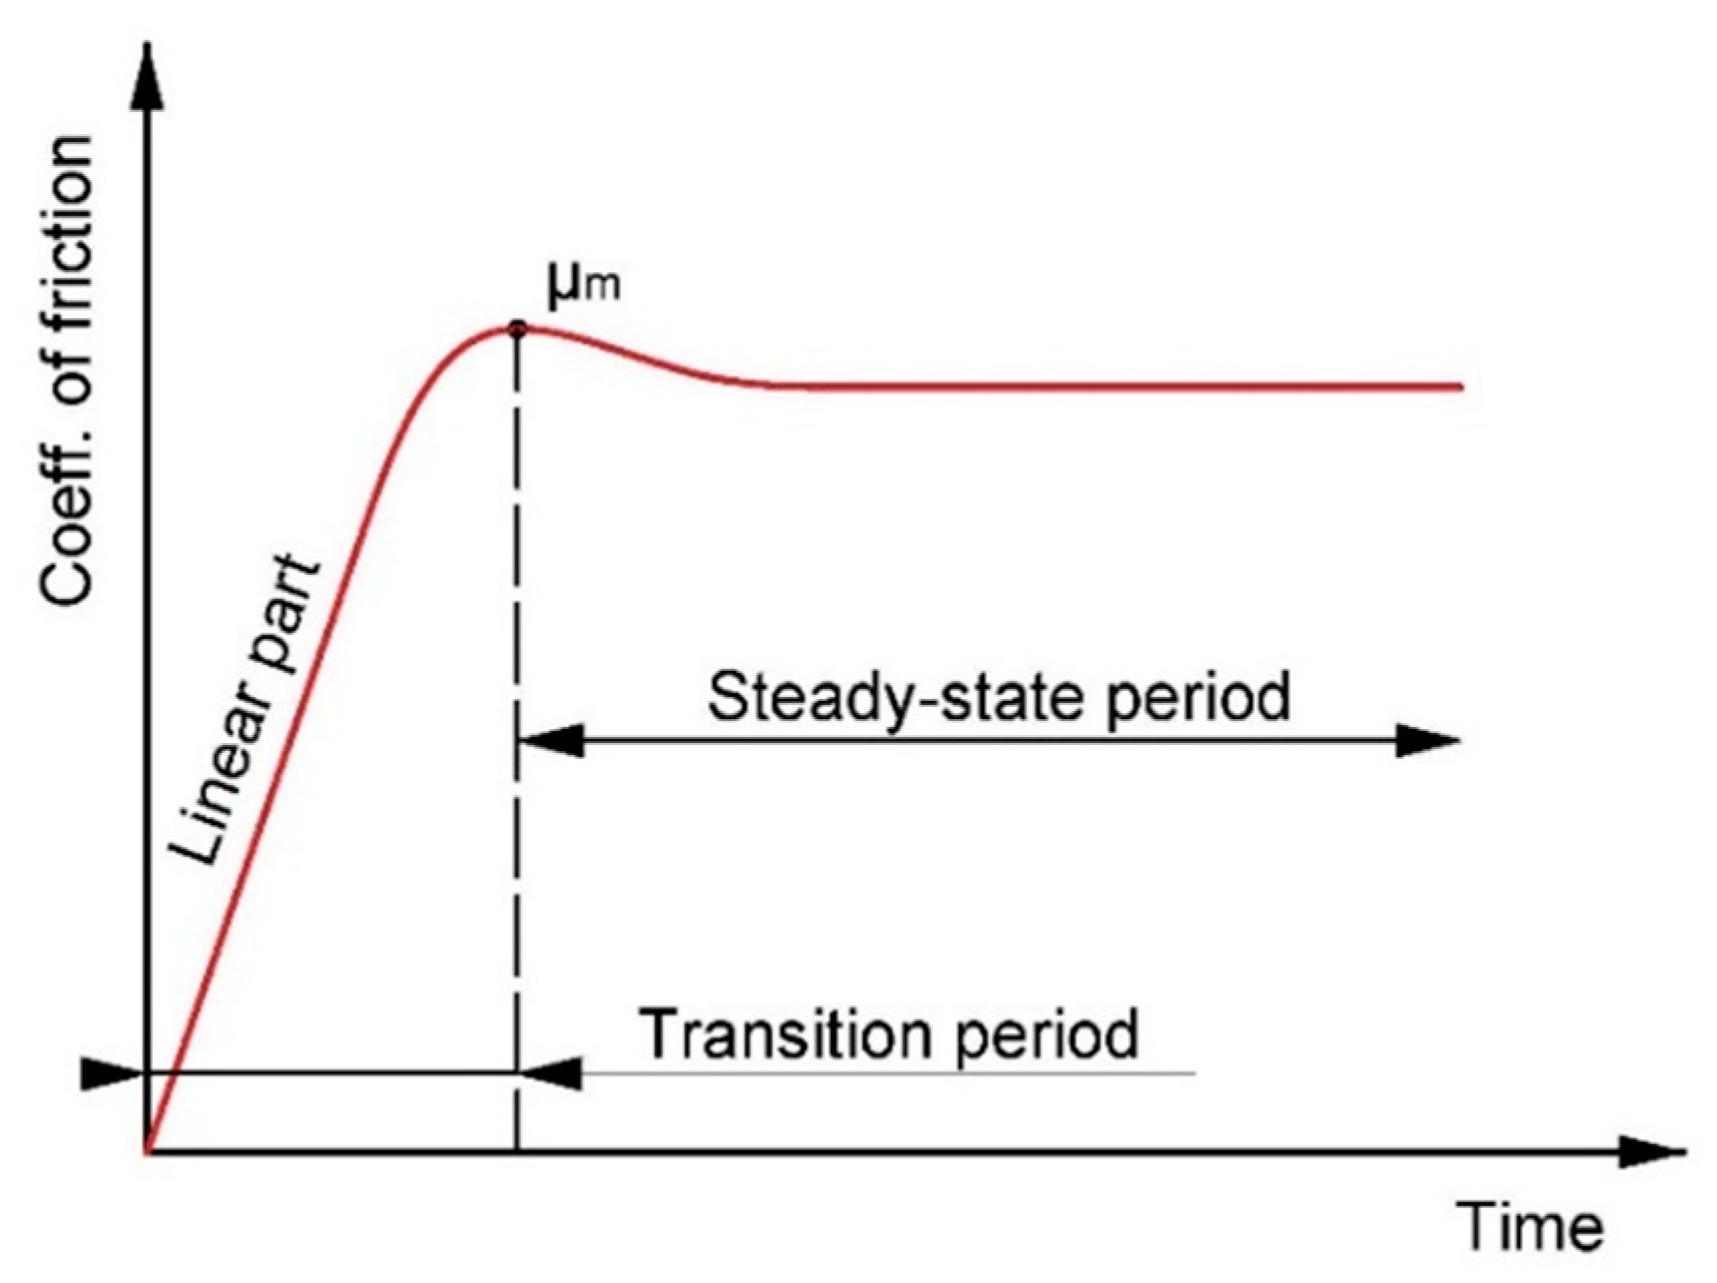
In the case of tool steel, this hardness is closely linked to the microstructure. The hardness of the ceramic ball is nine times higher and therefore behaves like an abrasive, thus removing microspheres from the 90MnCrV8 steel surface. This is reflected in a sharp increase in the coefficient of friction in the early stages of the friction process.
(3)
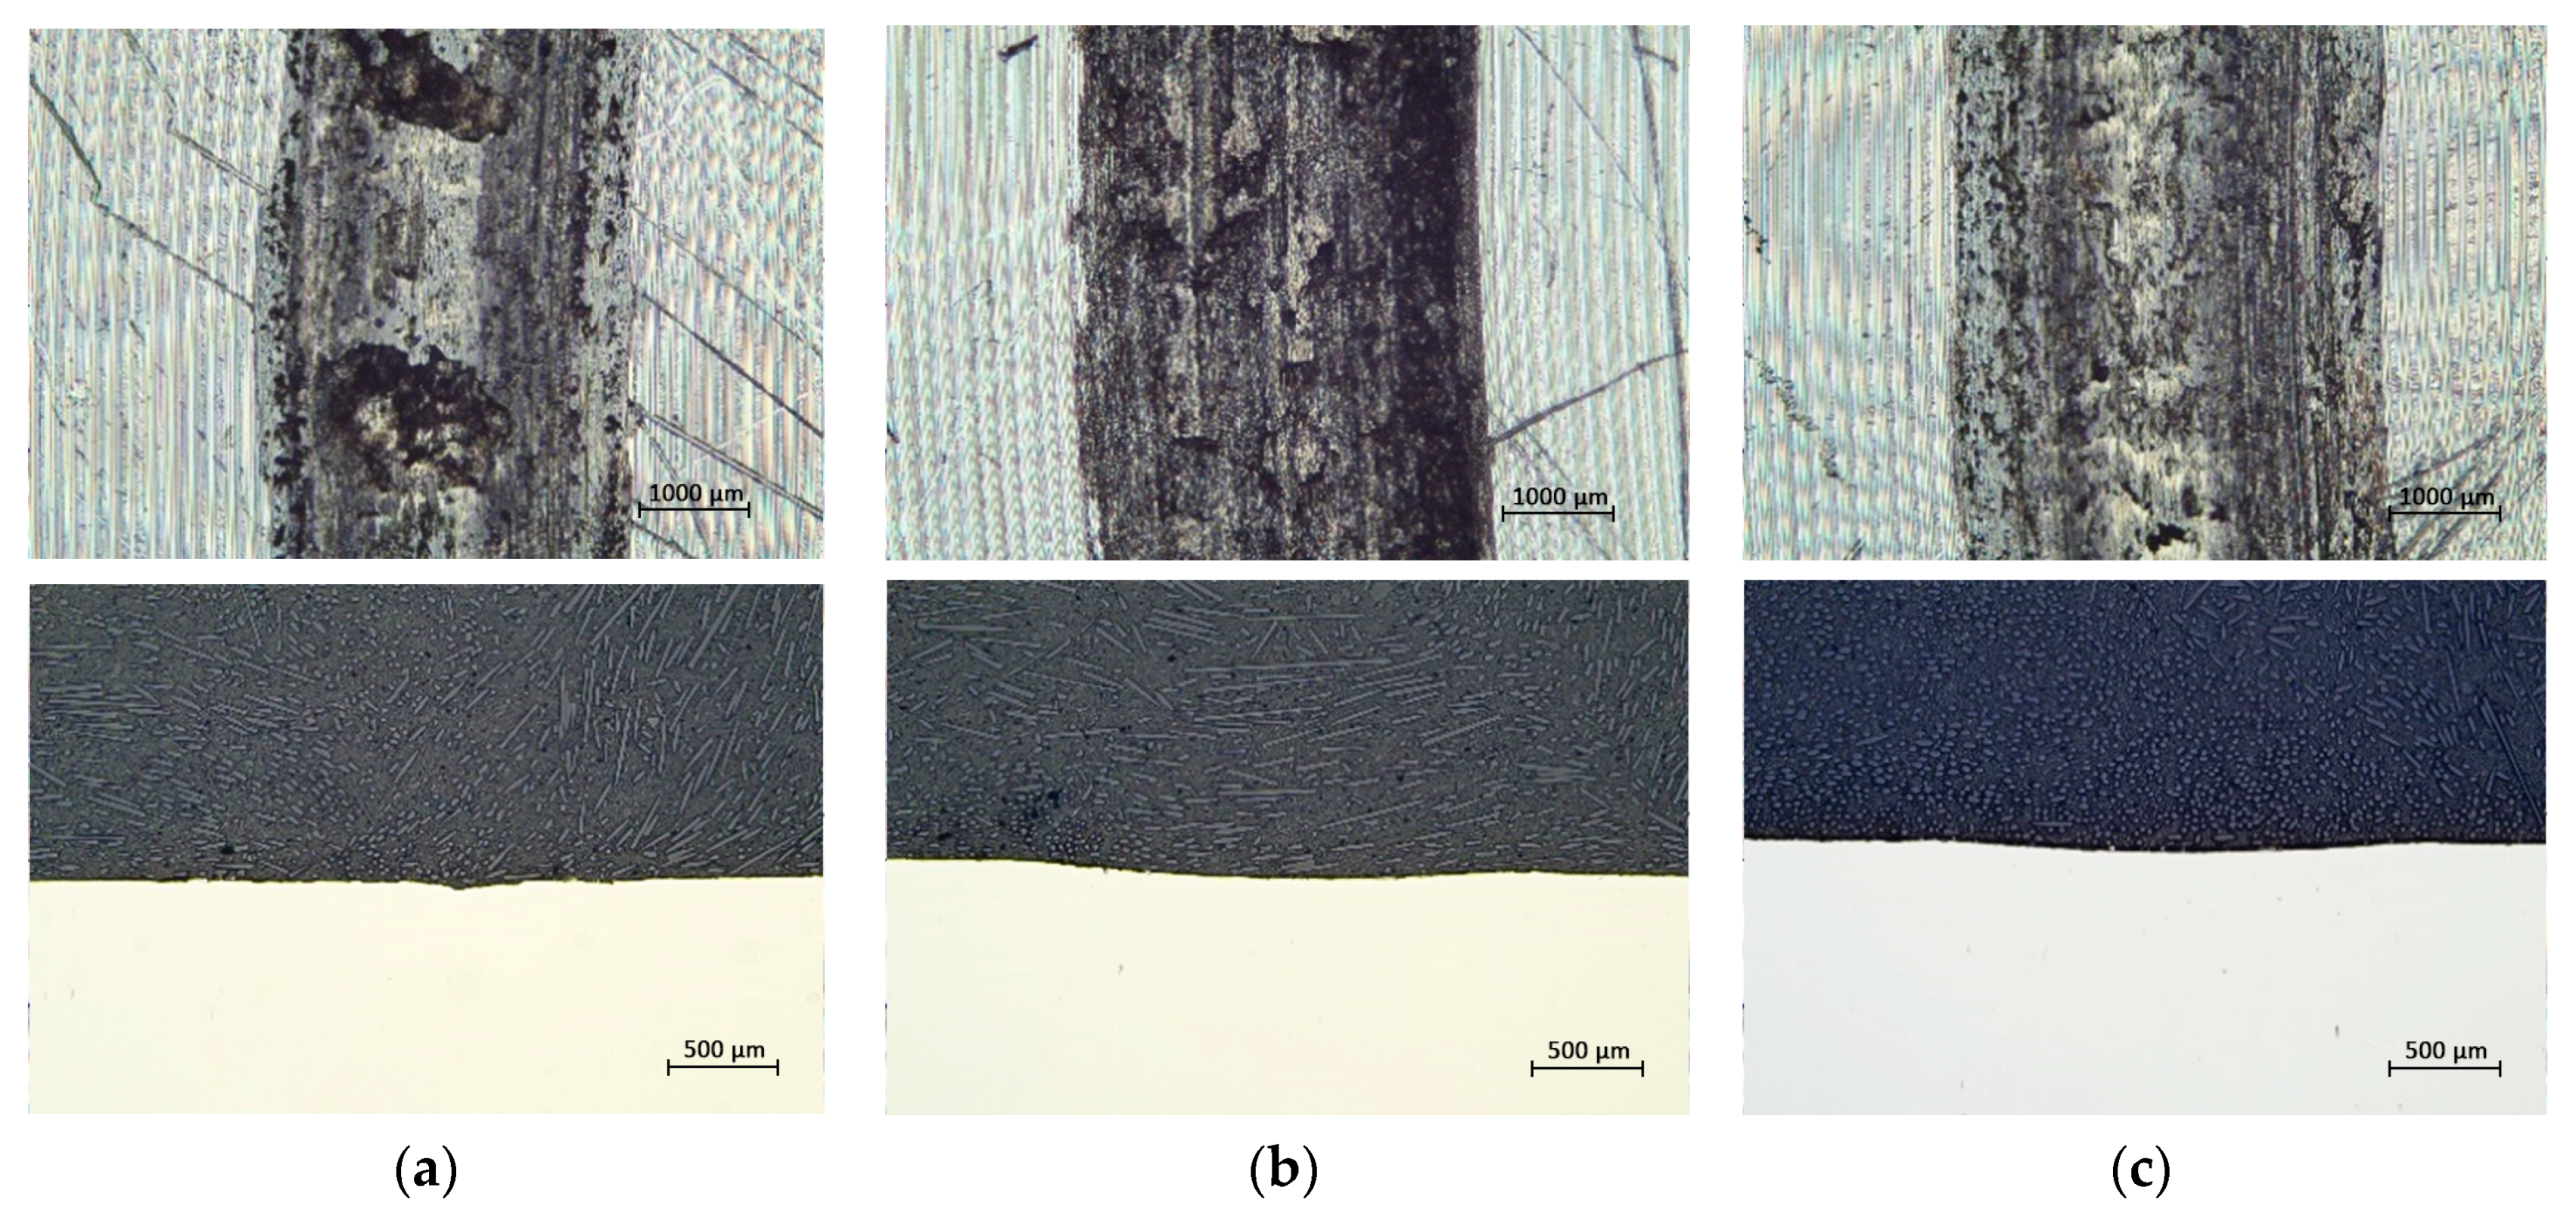
Another important factor that plays one of the most important roles is the friction speed in tribological testing. Increasing of the friction speed leads to a significant degradation of the material on the sample surface. However, when comparing the specific wear rate at different speeds, it was shown to decrease with increasing speed. This decrease was up to 80% in the case of tool steel and about 50 % in the case of a ceramic ball. This is related to a reduction in the coefficient of friction and an increase in temperature at higher friction speeds.
(4)
The roughness of the worn grooves on the experimental samples was improved by increasing of the friction speed. At the highest applied speed of 1.4 m/s, the same roughness of the worn groove as well as the contact surface of the ceramic ball was achieved at Sa = 41 nm.
(5)
The coefficient of friction was decreasing due to the increasing of friction speed. This result is associated with increasing of temperature due to increasing of friction speed. Because the increasing temperature positively affects the coefficient of friction due to the change in friction energy on heat, this heat is associated by the vibrational movement of the atoms, which are looser and create less friction resistance.
(6)
The friction speed is also closely related to the resulting type of wear on the friction surface of the tool steel. Abrasive as well as adhesive wear occurs at a lower speed. As the friction speed gradually increases, the abrasive wear disappears and only the adhesive wear remains.

Author Contributions

Conceptualization, M.K. and M.E.; methodology, M.K.; software, M.E.; validation, M.E., I.B. and J.M.; formal analysis, M.K.; investigation, I.B.; resources, M.E.; data curation, M.K.; writing—original draft preparation, J.M.; writing—review and editing, J.M.; visualization, M.E.; supervision, M.K.; project administration, M.K.; funding acquisition, I.B. All authors have read and agreed to the published version of the manuscript.

Funding

The Slovak Research and Development Agency under the contract No. APVV-15-0710 supported this work. This work was supported by the Research Agency of the Ministry of Education, Science, Research and Sport of the Slovak Republic under the contract (ITMS2014+) no. 313011W442-CEDITEK II.

Conflicts of Interest

The authors declare no conflict of interest. The funders had no role in the design of the study; in the collection, analyses, or interpretation of data; in the writing of the manuscript, or in the decision to publish the results.

References

  1. Bourithis, L.; Papadimitriou, G.D.; Sideris, J. Comparison of wear properties of tool steels AISI D2 and O1 with the same hardness. Tribol. Int. 2006, 39, 479–489. [Google Scholar] [CrossRef]
  2. Omer, N.C.; Muammer, K. Experimental investigations on wear resistance characteristics of alternative die materials for stamping of advanced high-strength steels (AHSS). Int. J. Mach. Tools Manuf. 2009, 49, 897–905. [Google Scholar]
  3. Miloradović, N.; Vujanac, R.; Mitrović, S.; Miloradović, D. Dry Sliding Wear Performance of ZA27/SiC/GraphiteComposites. Metals 2019, 9, 717. [Google Scholar] [CrossRef] [Green Version]
  4. Ekinovića, S.; Dolinšek, S.; Begovića, E. Machinability of 90MnCrV8 steel during high-speed machining. J. Mater. Process. Technol. 2005, 162, 603–608. [Google Scholar] [CrossRef]
  5. Dubovská, R.; Majerík, J. The research analysis of surface finish and wear on the special tribological device. Procedia Eng. 2015, 100, 730–736. [Google Scholar] [CrossRef]
  6. Dobrocky, D.; Pokorný, Z.; Studený, Z.; Van Doan, T. Analyse of tribological properties of layers created by plasma nitriding + DLC. Manuf. Technol. 2018, 18, 379–386. [Google Scholar] [CrossRef]
  7. Jaros, A.; Sedlak, J.; Vondra, J. Investigation of the influence of pvd coatings for dry groove milling. MM Sci. J. 2018, 2516–2520. [Google Scholar] [CrossRef]
  8. Balasundar, I.; Raghu, T. Effect of friction model in numerical analysis of equal channel angular pressing process. Mater. Des. 2010, 31, 449–457. [Google Scholar] [CrossRef]
  9. Djavanroodi, F.; Ebrahimi, M. Effect of die channel angle, friction and back pressure in the equal channel angular pressing using 3d finite element simulation. Mater. Sci. Eng. 2010, 527, 1230–1235. [Google Scholar] [CrossRef]
  10. Dumoulin, S.; Roven, H.J.; Werenskiold, J.C.; Valberg, H.S. Finite element modeling of equal channel angular pressing: Effect of material properties, friction and die geometry. Mater. Sci. Eng. 2005, 410, 248–251. [Google Scholar] [CrossRef]
  11. Yang, Y.L.; Lee, S. Finite element analysis of strain conditions after equal channel angular extrusion. J. Mater. Process. Technol. 2003, 140, 583–587. [Google Scholar] [CrossRef]
  12. Krbaťa, M.; Majerík, J.; Barényi, I.; Mikušová, I.; Kusmič, D. Mechanical and tribological features of the 90MnCrV8 steel after plasma nitriding. Manuf. Technol. 2019, 19, 238–242. [Google Scholar] [CrossRef]
  13. Barrena, M.I.; Gómez de Salazar, J.M.; Matesanz, L. Interfacial microstructure and mechanical strength of WC-Co/90MnCrV8 cold work tool steel diffusion bonded joint with Cu/Ni electroplated interlayer. Mater. Des. 2010, 31, 3389–3394. [Google Scholar] [CrossRef]
  14. Kusmic, D.; Doan, T.V.; Pilch, O.; Krbaťa, M. Corrosion resistance and tribological properties of plasma nitrided and tenifered 42CrMo4 steel. In Proceedings of the 25th Anniversary International Conference on Metallurgy and Materials, Brno, Czech Republic, 25–27 May 2016; pp. 47–81. [Google Scholar]
  15. Park, J.Y.; Kim, C.H. The α- to β-Si3N4 Transformation in the Presence of Liquid Silicon. J. Mater. Sci. 1988, 23, 233049–233054. [Google Scholar] [CrossRef]
  16. Pearson, R.; Shipway, P.H.; Abere, J.O.; Hewitt, R.A.A. The effect of temperature on wear and friction of a high strength steel in fretting. Wear 2013, 303, 622–631. [Google Scholar] [CrossRef]
  17. Obata, F.; Konishi, D.; Yamamoto, K.; Hashimoto, N.; Aoishi, M. Effects of surface roughness on friction coefficient of plate bricks (Part 2): Sliding characteristics at elevated temperature. Jpn. J. Tribol. 2001, 47, 384–391. [Google Scholar]
  18. Wanga, Y.; Yanga, Q.; Chenb, J.; Zhoub, J. Graphite and nickel containing tin Bronze-steel bimetals as lead free bearing materials. Mater. Res. 2016, 19, 770–775. [Google Scholar] [CrossRef]
  19. Jiang, J.; Ma, A.; Song, D.; Yang, D.; Shi, J.; Wang, K. Anticorrosion behavior of ultrafine-grained Al-26 wt% Si alloy fabricated by ECAP. J. Mater. Sci. 2012, 47, 7744–7750. [Google Scholar] [CrossRef]
  20. Srivastava, A.K.; Das, D. Microstructural characterization of Hadfield austenitic manganese steel. J. Mater. Sci. 2008, 43, 5654–5658. [Google Scholar] [CrossRef]
  21. Dong, H. Tribological properties of titanium-based alloys. In Surface Engineering of Light Alloys; Woodhead Publishing: Boca Raton, FL, USA, 2010; pp. 58–80. [Google Scholar]
  22. Ogata, S.; Hirosaki, N.; Koce, C.; Shibutani, Y. A comparative ab initio study of the ‘ideal’ strength of single crystal α- and β-Si3N4. Acta Mater. 2004, 52, 233–238. [Google Scholar] [CrossRef]
  23. O’Hare, P.A.G.; Tomaszkiewicz, I.; Beck, C.M.; Seifertd, H.J. Thermodynamics of silicon nitride. I. Standard molar enthalpies of formation ΔfHmoat the temperature 298.15 K of α-Si3N4and β-Si3N4. J. Chem. Thermodyn. 1999, 31, 303–322. [Google Scholar] [CrossRef]
  24. Ewais, E.M.M.; Attia, M.A.A.; Abousree-Hegazy, A.; Bordia, R.K. Investigation of the effect of ZrO2 and ZrO2/Al2O3 additions on the hot-pressing and properties of equimolecular mixtures of α- and β-Si3N4. Ceram. Int. 2010, 36, 1327–1338. [Google Scholar] [CrossRef]
Figure 1. Typical curve of coefficient of friction vs. time.
Metals 10 00756 g001
Figure 2. Basic microstructure of tool steel 90MnCrV8: (a) AFM, (b) LOM.
Metals 10 00756 g002
Figure 3. Set-up of rotary drive UMT TriboLab during experiments.
Metals 10 00756 g003
Figure 4. (a) Hexagonal β-Si3N4 structure; (b) principle of measurement by the ball-on-disc method.
Metals 10 00756 g004
Figure 5. Surface roughness evaluated by the atomic force microscopy (AFM): (a) Si3N4–Sa = 0.148 µm; (b) 90MnCrV8–Sa = 0.161 µm.
Metals 10 00756 g005
Figure 6. Groove created during the wear test with the marked area of removed material.
Metals 10 00756 g006
Figure 7. Worn surfaces and cross section of the traces of tribological pair at friction speed (m/s): (a) 0.2, (b) 0.4, (c) 0.6.
Metals 10 00756 g007
Figure 8. Worn surfaces and cross section of the traces of tribological pair at friction speed (m/s): (a) 0.8, (b) 1.0, (c) 1.2.
Metals 10 00756 g008
Figure 9. Resulting values of coefficient of friction for peripheral speed (m/s): (a) 0.2, (b) 0.4, (c) 0.6, (d) 0.8, (e) 1.0, (f) 1.2.
Metals 10 00756 g009
Figure 10. (a) Comparison of friction coefficients and their function override. (b) Average values of coefficients of friction.
Metals 10 00756 g010
Figure 11. Specific wear rate depending on the sliding velocity: (a) 90MnCrV8, (b) ceramic ball Si3N4.
Metals 10 00756 g011
Figure 12. Wear analysis of worn surfaces 90MnCrV8: (a) 0.2 m/s, (b) 1.2 m/s.
Metals 10 00756 g012
Figure 13. Worn surfaces of ceramic balls at friction speed (m/s): (a) 0.2, (b) 0.4, (c) 0.6, (d) 0.8, (e) 1.0, (f) 1.2.
Metals 10 00756 g013
Figure 14. Wear analysis of worn surfaces Si3N4: (a) 0.2 m/s, (b) 1.2 m/s.
Metals 10 00756 g014
Figure 15. Evaluation of roughness of tested steel samples 90MnCrV8 at friction speed (m/s): (a) 0.2, (b) 0.4, (c) 0.6, (d) 0.8, (e) 1.0, (f) 1.2.
Metals 10 00756 g015
Figure 16. Evaluation of the roughness of tested ceramic balls at friction speed (m/s): (a) 0.2, (b) 0.4, (c) 0.6, (d) 0.8, (e) 1.0, (f) 1.2.
Metals 10 00756 g016
Figure 17. (a) Comparison of roughness of 90MnCrV8. (b) Comparison of roughness of Si3N4.
Metals 10 00756 g017
Table 1. Chemical composition of the investigated 90MnCrV8 steel (wt. %).
ElementCSiMnCrVP
min-max0.85–0.950.10–0.401.20–2.100.20–0.500.05–0.150.00–0.03
Spectral analysis0.920.351.950.400.1120.02
Table 2. Basic mechanical properties of the investigated 90MnCrV8 steel.
MaterialHardness (HRC)Modulus of Elasticity (GPa)Tensile Strength (MPa)Proof Strength Rp0.2 (MPa)Thermal Conductivity (W/m °C)Specific Heat (J/kg °C)
X153CrMoV1262–682108393222343
All data are for material in the quenched and tempered state.
Table 3. Measurement parameters for tribology.
SampleSliding Speed (m/s)Load (N)Rotation Radius (mm)Time of Rotation (s)
1.0.250191800
2.0.4
3.0.6
4.0.8
5.1.0
6.1.2

