Article

Early Stages of Plastic Deformation in Low and High SFE Pure Metals

by
Marcello Cabibbo
* and
Eleonora Santecchia
Department of Industrial Engineering and Mathematical Science (DIISM), Università Politecnica delle Marche, I-60131 Ancona, Italy
*
Author to whom correspondence should be addressed.
Metals 2020, 10(6), 751; https://doi.org/10.3390/met10060751
Submission received: 18 May 2020 / Revised: 3 June 2020 / Accepted: 4 June 2020 / Published: 5 June 2020
(This article belongs to the Special Issue Advances in Ultrafine-Grained Metals Research)

Abstract

:
Severe plastic deformation (SPD) techniques are known to promote exceptional mechanical properties due to their ability to induce significant grain and cell size refinement. Cell and grain refinement are driven by continuous newly introduced dislocations and their evolution can be followed at the earliest stages of plastic deformation. Pure metals are the most appropriate to study the early deformation processes as they can only strengthen by dislocation rearrangement and cell-to-grain evolution. However, pure metals harden also depend on texture evolution and on the metal stacking fault energy (SFE). Low SFE metals (i.e., copper) strengthen by plastic deformation not only by dislocation rearrangements but also by twinning formation within the grains. While, high SFE metals, (i.e., aluminium) strengthen predominantly by dislocation accumulation and rearrangement with plastic strain. Thence, in the present study, the early stages of plastic deformation were characterized by transmission electron microscopy on pure low SFE Oxygen-Free High Conductivity (OFHC) 99.99% pure Cu and on a high SFE 6N-Al. To induce an almost continuous rise from very-low to low plastic deformation, the two pure metals were subjected to high-pressure torsion (HPT). The resulting strengthening mechanisms were modelled by microstructure quantitative analyses carried out on TEM and then validated through nanoindentation measurements.

1. Introduction

The improved mechanical tensile, fatigue, and ductile properties yield by ultrafine-grained (UFG) metallic materials and alloys compared to the conventional grained counterparts are well-known within the scientific community [1]. Different technological methods were developed in the last three decades to obtain UFG metals and alloys.
In particular, two diametrically distant approaches are able to get similar, if not same, mechanical properties. The first of them is a top-down approach by which a bulk metallic material is plastically forced to deform and refine the grain structure accordingly. Among the most effective and well-developed such top-down techniques the severe plastic deformation (SPD) methods are the ones showing the most promising and technologically reliable ones [2,3,4,5,6,7,8,9,10]. Several SPD techniques were successfully developed so far, these include high-pressure torsion (HPT), equal-channel angular pressing (ECAP), accumulative roll-bonding (ARB), accumulative press-bonding (APB), cyclic extrusion-compression (CEC), twist extrusion (TE), friction stir processing (FSP), repetitive corrugation and straightening (RCS), high-pressure sliding (HPS) ([4,5,6,7] and references therein). A second approach start from powder metallic materials which are compacted to get UFG bulk alloys, and it is called bottom-up approach [11,12].
Especially when using the top-down approach, the physical principles behind the SPD-driven UFG formation can be properly described by using pure metals. In fact, under SPD pure metals can only be strengthened by dislocation motion and rearrangement. Tangled dislocations (TDs) can then be induced to entangle and reorganize to form boundary structures (both low-angle, i.e., cell, and high-angle, i.e., grain). With this regard, the strengthening mechanisms induced within the pure metal microstructure can be related to the metal stacking fault energy (SFE). The SFE can thus identified at least two types of pure metals, the ones with low-SFE, and others with high-SFE. Pure copper is a good example of low-SFE metal, while aluminum is an example of high-SFE. Copper has an SFE ≅ 70 mJm−2 [13,14], while aluminum has an SFE ≅ 165 mJm−2 [15].
In the present study, both pure Cu and Al were used to study the early stages of plastic deformation with the aim of determining the microstructure evolution on which is based the formation of cell boundaries (low-angle boundaries, LABs), grain boundaries (high-angle boundaries, HABs). The role of twinning formation, due to the low-SFE, in pure copper was also addressed.
To properly follow the earlier stages of plastic deformation induced in both the pure metals a SPD suitable technique was necessary. With this respect, the HPT was essentially among the few that allowed to strain the metallic materials for strain levels as low as εeq = 0.02. Moreover, by HPT an almost continuous range of strain levels can be induced by simply limiting the number fraction of plunger rotation under the applied pressure. This because HPT is able to generate progressive plastic deformation levels which depend on the arc of rotation and on the location of the disc. That is, for a given rotation the strain level varies almost continuously form the disc center, where it is minimum, to the disc periphery, where it is at its maximum.
Thus, for the present study, the two meaningful parameters are the number fraction of revolution and the location of the disc, from center to periphery. Since, the imposed strain chiefly depends on the distance from the center of the disc, the microstructure modifications imposed by HPT are greatly inhomogeneous but progressive.
As for the induced microstructure modifications with cumulative straining during SPD, a number of published works [16,17,18] recognized that the UFG formation proceeds starting from TD and dense dislocation walls (having very low-angle boundaries). These are continuously introduced in the material and eventually induced to rearrange and thus form cell structures (LABs). These are eventually induced to rise their misorientation angle to eventually become grain boundaries (HABs).
In this study, the role of twinning formation, in pure copper, and the LABs, and HABs evolution, in both pure copper and pure aluminum, to the microstructure evolution driven by the early stages of plastic deformation by HPT was addressed by electron microscopy technique (TEM). The microstructure-based strengthening model was modelled and compared to nanoindentation hardness measurements. To this purpose, an Oxygen-Free High Conductivity (OFHC) 99.99% pure Cu and a 99.9999% Al (6N-Al) were used.

2. Experimental Procedures and Method

2.1. The Pure Metals

OFHC 99.99% pure copper rod with 10 mm diameter were annealed at 673 K for 1 h, followed by cooling in the turned off furnace (cooling time of 8 h). The chemical composition of the 99.99% purity Cu is as follows (wt.% × 1000): 4.4(Ag + Pb + S), 1.5Fe, 0.5O, 0.4P, 0.2Cd, 0.9 others, 99992 Cu. The 6 N-Al (purity of 99.9999%) was annealed at 655 K for 1 h.

2.2. High-Pressure Torsion (HPT) Details

Discs of 10 mm in diameter and 1.0 mm-thick of annealed OFHC Cu and 6N-Al were HPT under quasi-constrained conditions at room temperature. This way, material outflow during straining was avoided. Quite low and low strain levels were induced to get a discrete close range of plastic deformation into the two pure metals. The strain levels here tested are reported in Table 1 for both Cu and Al. These were from εeq = 0.02 to 0.24, in 6N-Al, and from εeq = 0.40 to 1.21, in OFHC Cu.
Figure 1 shows a schematic representation of the location from which TEM discs were extracted to describe the microstructure modifications induced by the HPT strain levels reported in Table 1.
HPT strain deformation was given by dω/ω, being ω the angular rotation around the disc center. Since in the present case the disc thickness does not dependent on the rotation angle ω = 2πN, the resulting HPT shear strain, γ, was calculated according to Equation (1) [4]:
γ = 2πNr/t
where r is the distance from the disc center, ranging from 0 to the disc radius, R, and t is the disc thickness. For low HPT strains, γ, the resulting vön Mises strain is [4,19], Equation (2):
ε e q = γ 3 = 2 π N r t 3
HPT was carried out by depressing the vertical anvils to a depth of 0.05 mm into the 1 mm-thick HPT discs. Torsion strain was exerted by rotating the upper anvil at a low rotation speed of 0.7 rpm, corresponding to a rotation of ~4° s−1, under a pressure of 2.0 GPa. This anvil pressure allowed to avoid any possibility of disc slipping during rotational motion under HPT. According to Equation (2) the different strain levels, εeq, inspected by TEM according to Table 1 were obtained by extracting the TEM discs at given radial distance from the HPT disc center.

2.3. TEM Sample Preparation and Method

TEM discs were extracted from the middle height of the HPT discs. To avoid any possible artefact during sample preparation, the ~1 mm-thick HPT discs were prepared for TEM inspections by chemical and electro-chemical means down to a thickness of 200 µm. OFHC Cu was thinned using a solution of 30% of phosphoric acid 20% ethylic alcohol in 50% distilled water at room temperature and a voltage of 12 V. Final thinning to electron transparency was performed by Gatan Inc. precision ion-milling (PIPS) (Pleasanton, CA, USA) working with low dual incident beam (2° respect to the disc surface). The low incidence of the Argon beam was selected to minimize the possible artefacts coming from the disc preparation (i.e., to minimize the dislocations possibly introduced during the ion-milling process). The 6N-Al was thinned using a solution consisting of 15% HCl4, 15% C3H3(OH)3, and 70% methanol and then electro-chemically polished to electron transparency by double-jet with a solution of 1/3 nitric acid and 2/3 methanol working at 238 K and V = 12 V.
TEM inspections were carried out in a PhilipsTM C-20® (Amsterdam, The Netherlands) working at 200 keV with a double-tilt specimen holder equipped with a liquid-nitrogen cooling stage. Two-beam excitation conditions were selected for most of the TEM observation and dislocation characterizations. All the inspections of Al and Cu were carried out along the {110} crystallographic planes. Dislocation density, ρdisl., was quantitatively evaluated by stereological methods, such as the Ham’s interception method [20]. Thence, ρdisl. was calculated through the count of interception points between the mesh and the existing dislocations, ndisl, in the TEM micrographs. This was evaluated by ρdisl. = 2ndisl/(lmeshtTEM), were, lmesh is the total length of the mesh, and tTEM is the thickness of the TEM foil. Crystal thickness, tTEM, was determined through the diffracted beam intensity variation under dual beam conditions, using converged electron beam diffraction (CBED) patterns. This way, by plotting the linear interpolation of data points in a S2/nfringes2 vs. nfringes−2 graph, where S is the fringes spacing, and nfringes the number of counted fringes, tTEM−2 was determined at y-axis line intercept. Cell (LAB) and grain boundary (HAB) misorientation were measured by Kikuchi band patterns. The misorientation angle measurement procedure by Kikuchi pattern on TEM is fully described elsewhere in previous published works by this author [10,21,22]. The misorientation across the detected boundaries was measured from at least 100 g per experimental condition in both Al and Cu.

2.4. Nanoindentation Measurement Details

Nanoindentation measurements were performed at same HPT location of the ones used for the TEM inspections. Sample preparation followed the same procedures used to polish the TEM discs prior final thinning to electron transparency.
A Hysitron Inc. Triboscope UBI-1® (Minneapolis, MN, USA) was used. Calibration procedures were followed according to [23]. A trapezoidal load function of 5 s loading, 15 s at the set load, and 5 s unloading was used, with a set load, PMax = 10 mN, and at a constant loading rate of 0.25 mN/s. Series of 8 × 8 individual measurements spaced 250 µm apart were carried out for each experimental condition.
Data analysis was performed according to the Oliver–Pharr model [24]. Thence, hardness, H, was evaluated as H = PMax/A, with A = Kindhc2 being the contact area, Kind an indenter tip dependent coefficient (24.56 for Berkovich tip [25]), hc the contact depth related to the maximum penetration depth, hm, which is hc = hmPMax/S, χ = 0.75 for Berkovich tip [24] and S the material stiffness. Stiffness was measured through the unloading slope at the maximum penetration depth, hm, being S = Bm(hm-hr)m−1, where B is the unloading curve intercept at P = 0, m is the unloading slope, and hr is the residual depth (the permanent plastic penetration depth on unloading). By using the Oliver–Pharr method, the reduced elastic modulus is Er = [(π/4)0.5/β]·[S/(A)0.5], where β = 1.034 for Berkovich tips [24]. Thence, H = 0.041·PMax/hc2 and Er = 0.173·S/hc.

3. Experimental Results

3.1. Microstructure

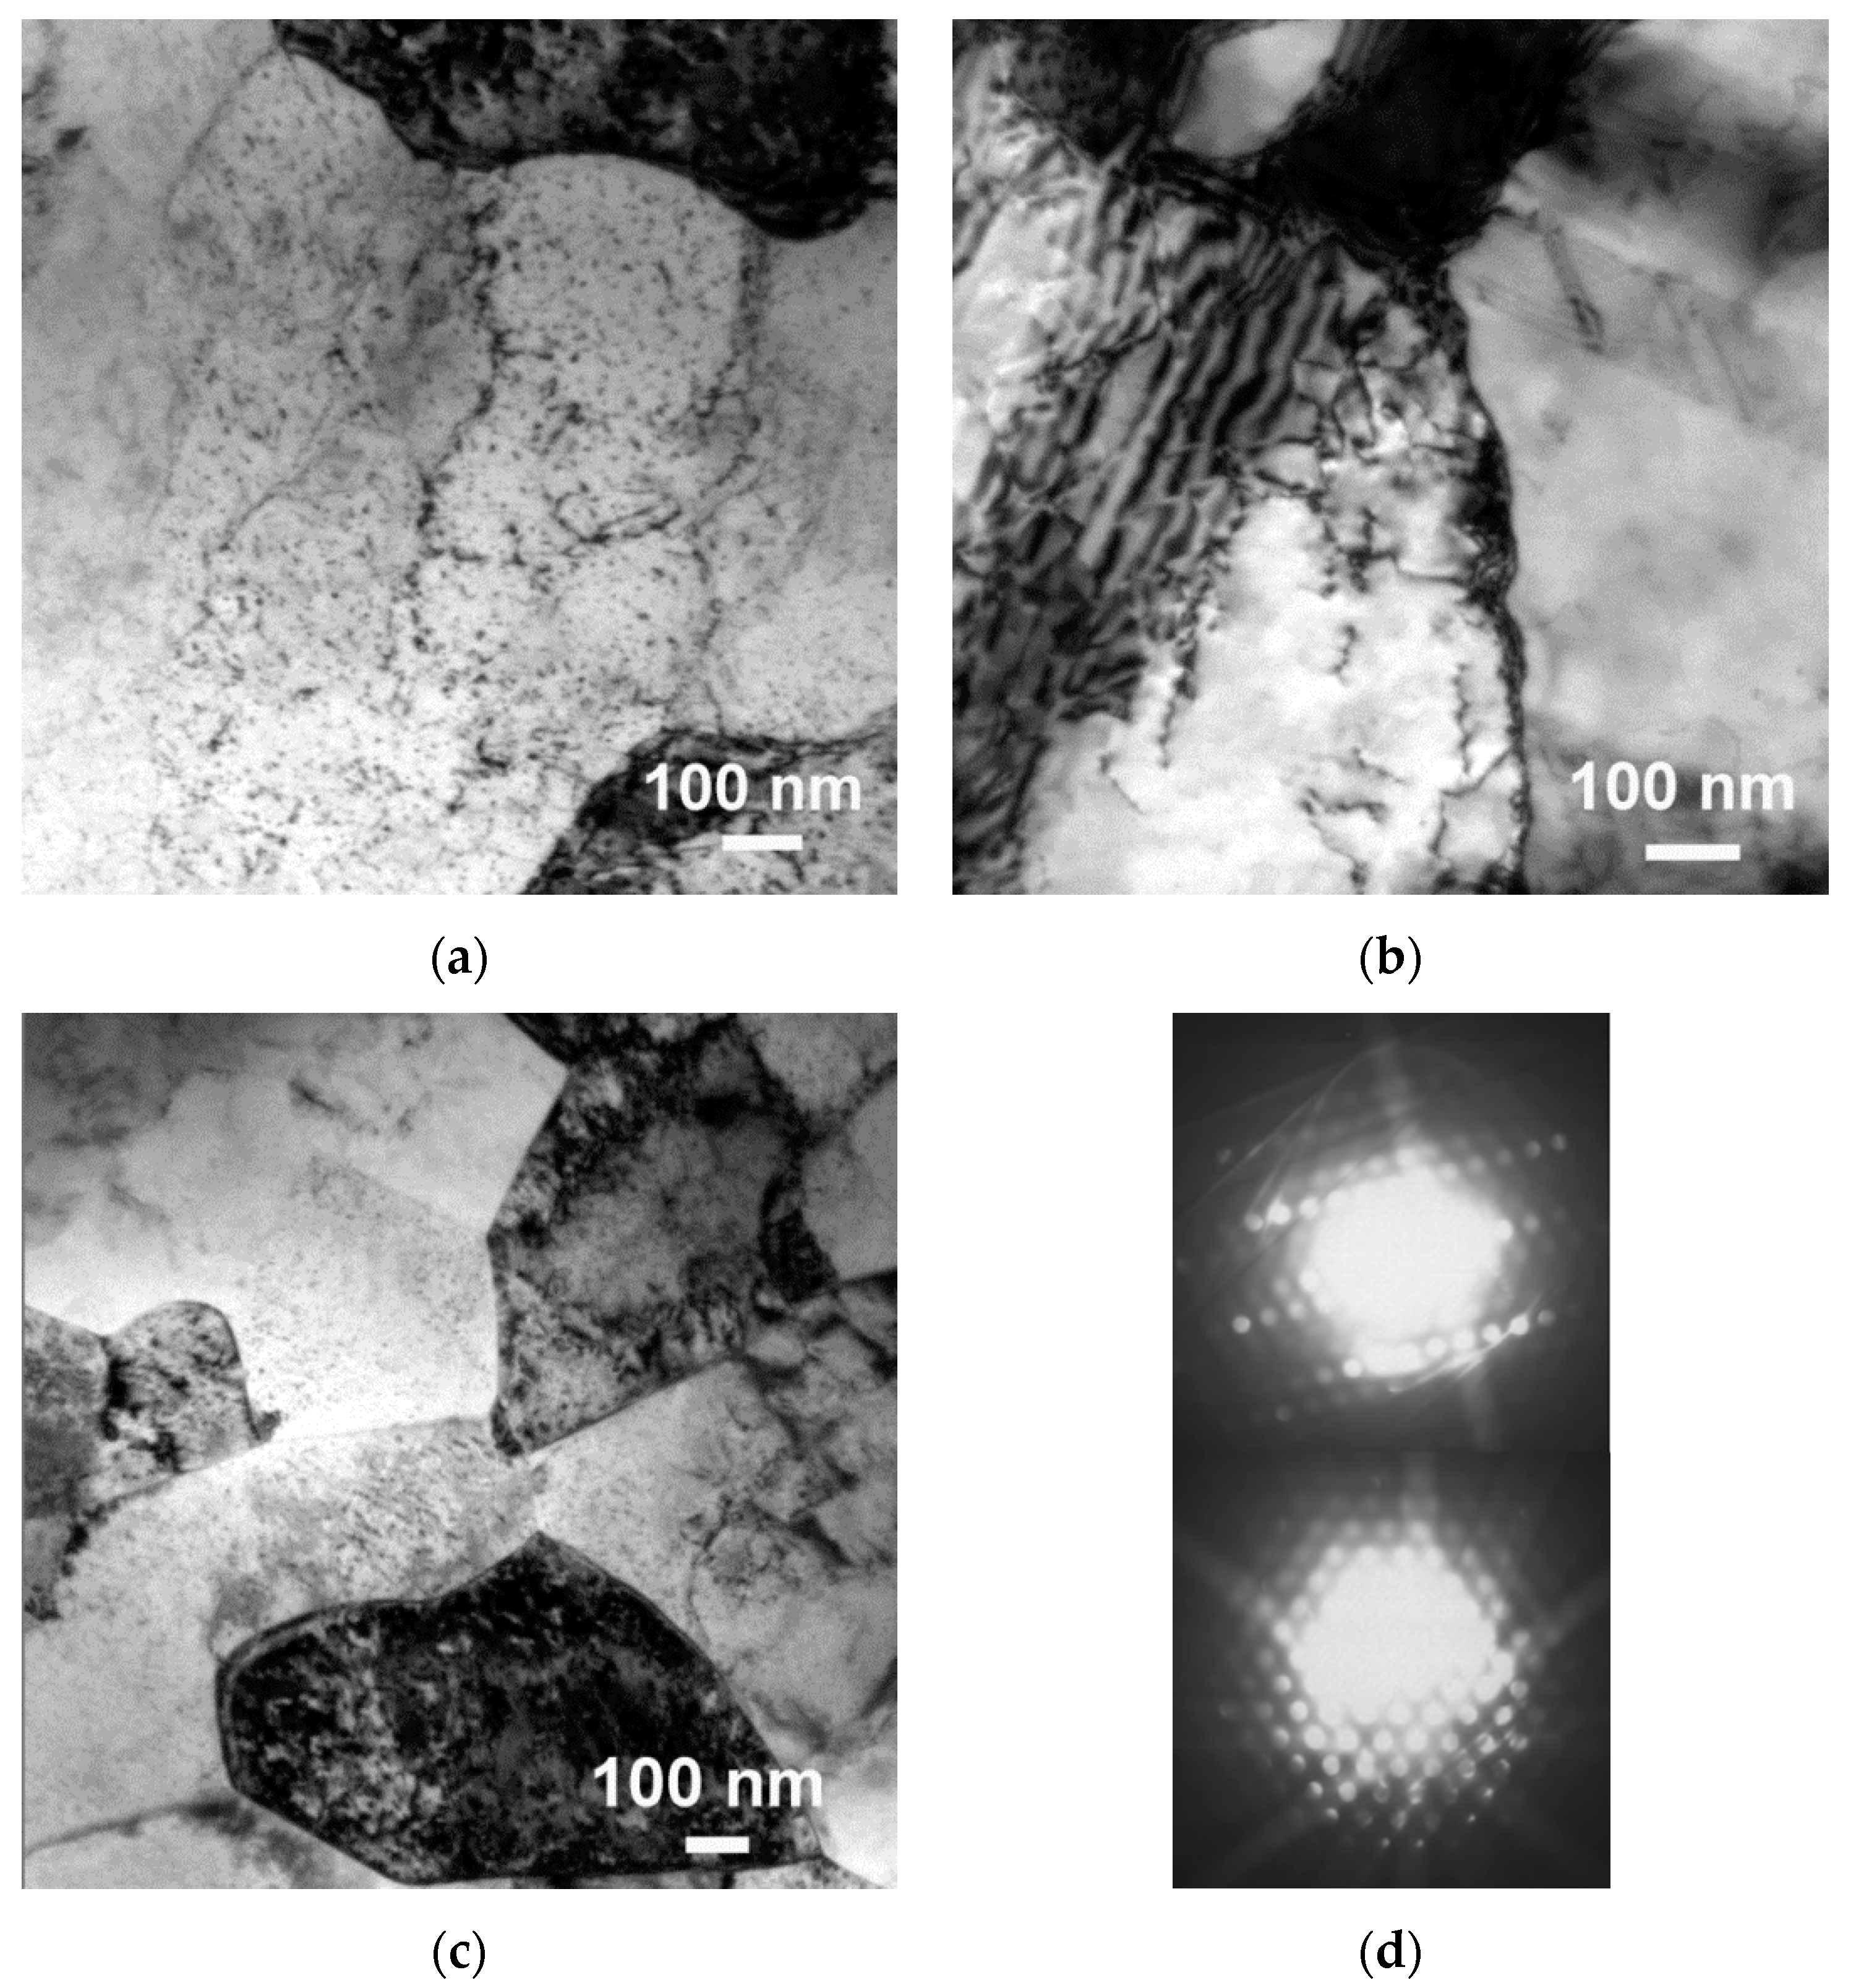
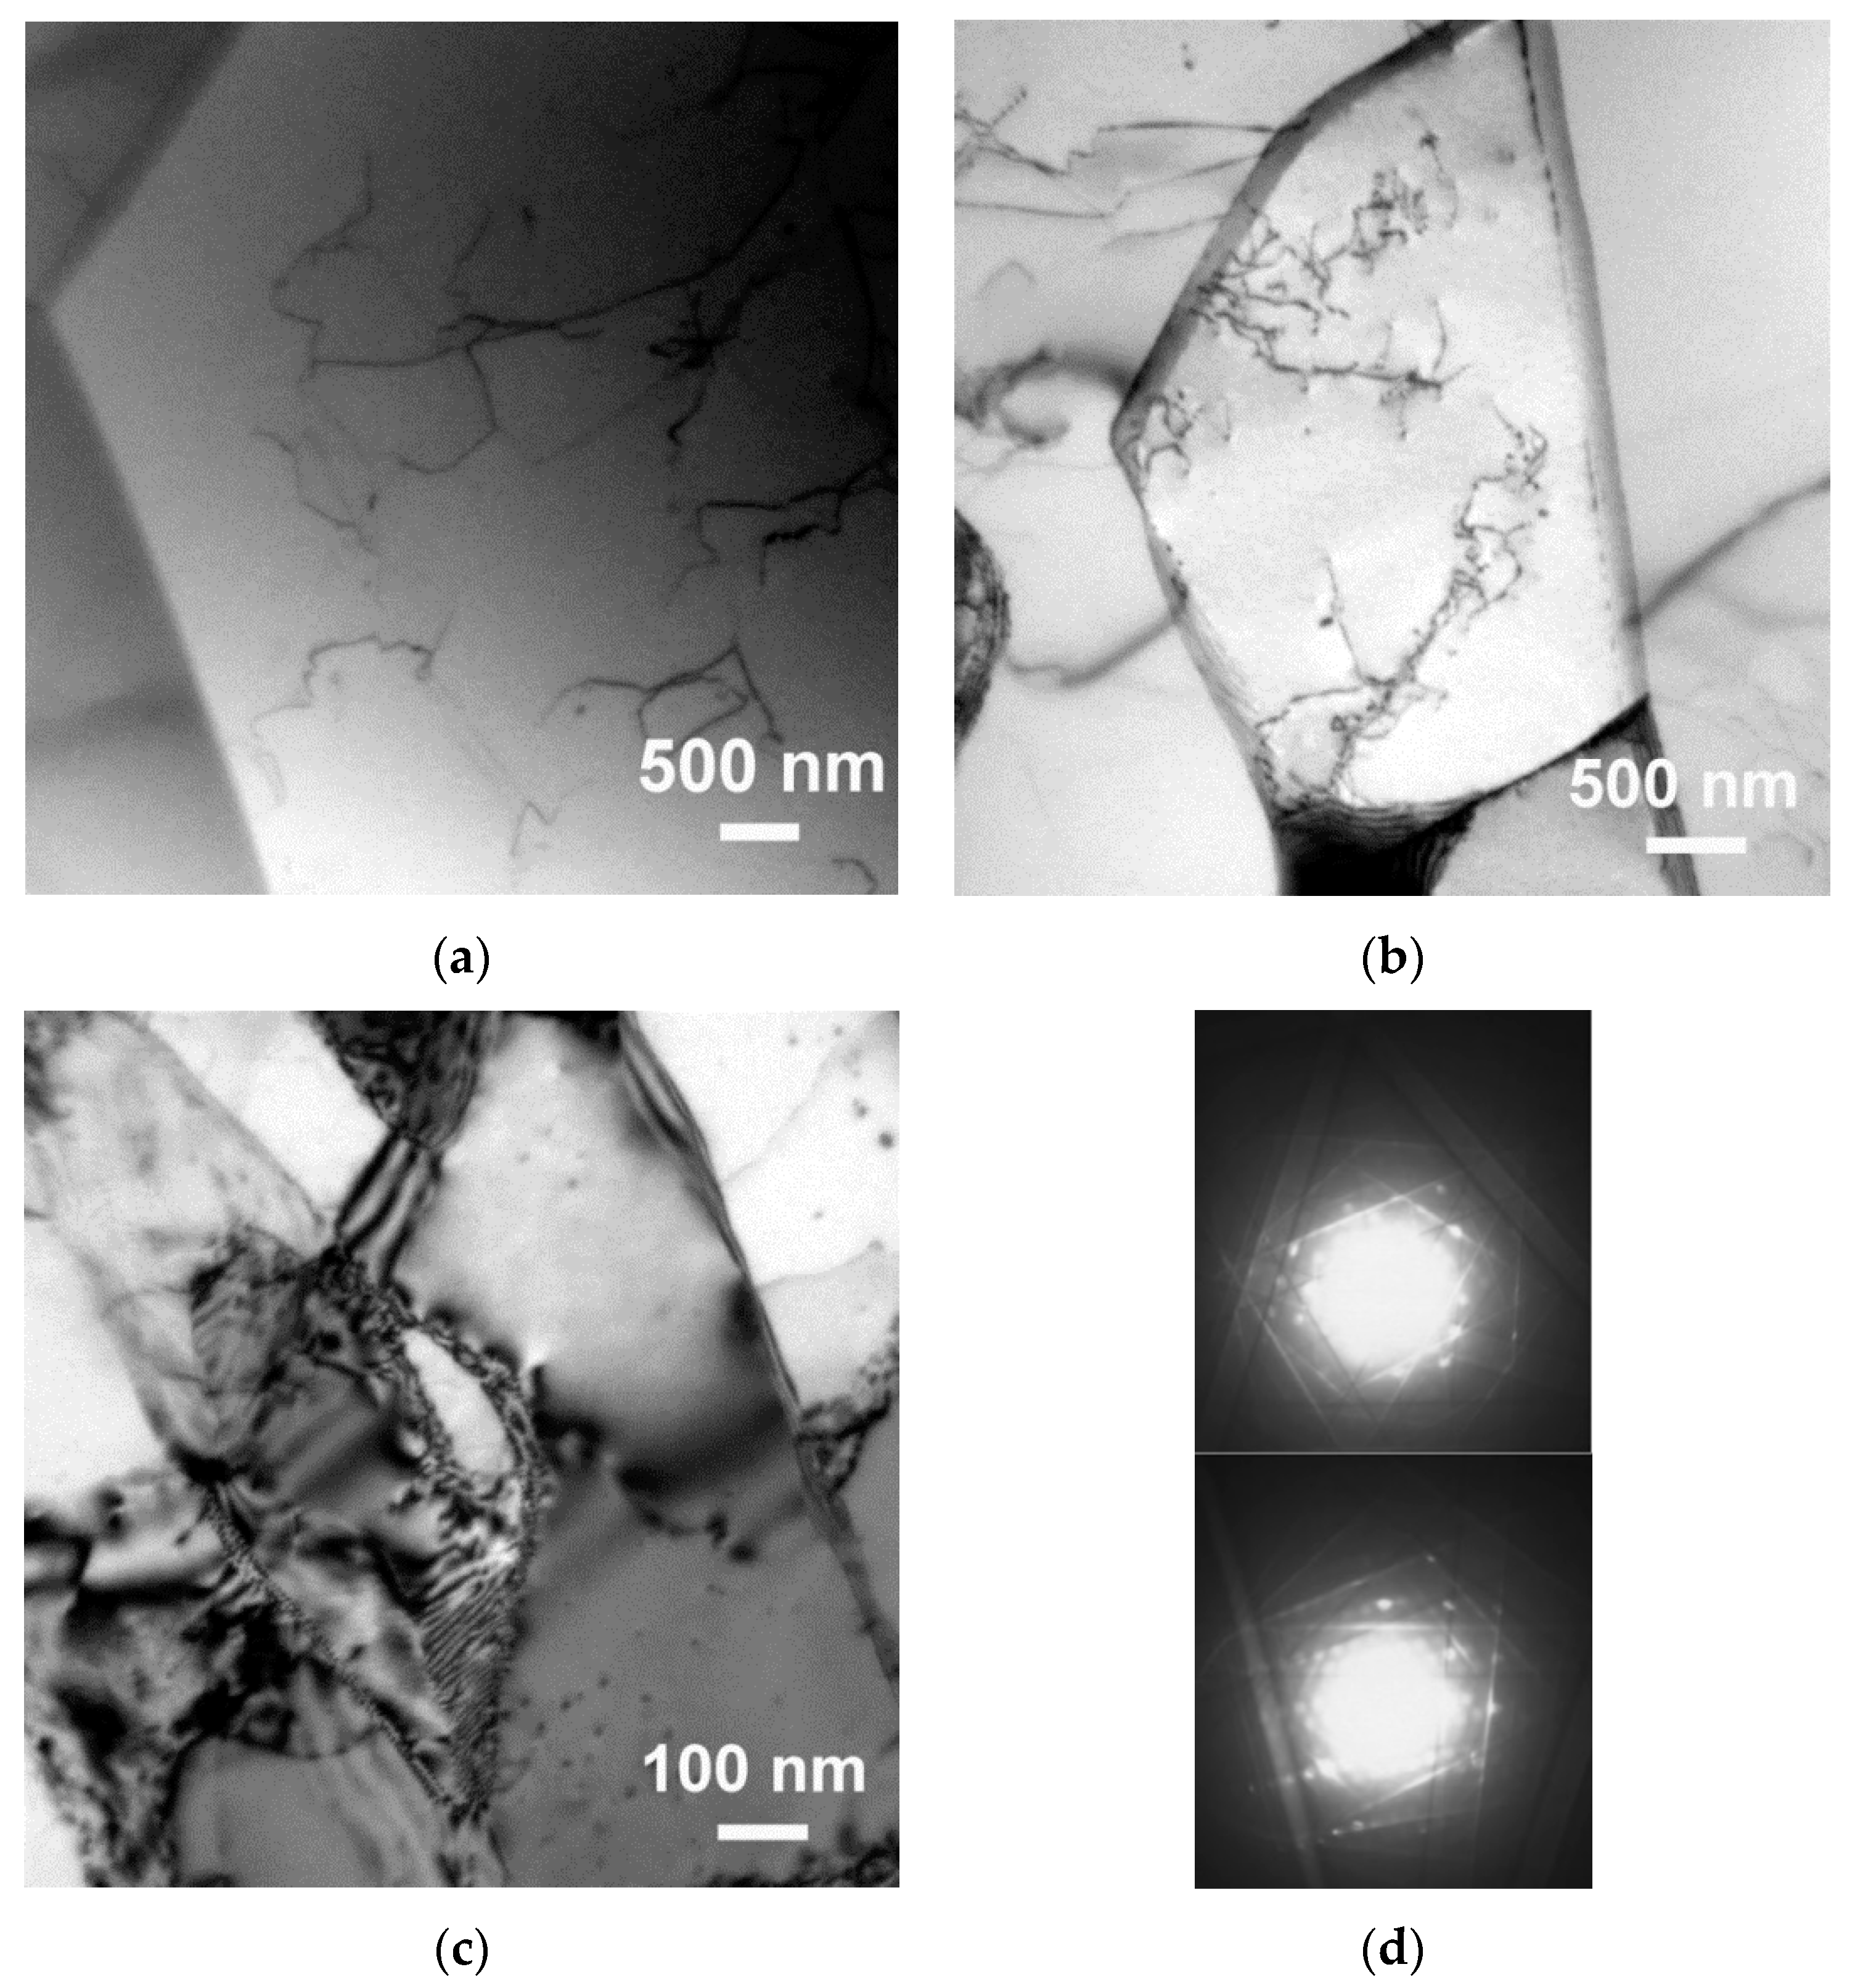
The microstructure evolution induced by HPT in OFHC 99.99% pure Cu and 6N-Al is shown in Figure 2, which reports strain levels of εeq = 0.40, 0.91, and 1.21 for Cu, and in Figure 3, reporting the microstructure after εeq = 0.02, 0.05, and 0.10 for Al.
In the case of copper, twins were formed from a HPT strain level of εeq = 0.91. From this HPT strain level Cu started to refine its grain structure through significant formation of grain boundaries (HABs). At the same time, twins started to cumulate within the refining grains. Thus, Cu microstructure initially started to deform by formation of statistically stored dislocations (SSD) and by geometrically necessary dislocations (GND) (εeq = 0.40, Figure 2a). Eventually, at εeq = 0.91 both SSDs and GNDs were promoted to form the first cell boundaries (LABs) and new grain boundaries (HABs) (Figure 2b). At this strain level twins started to form. That is, from εeq = 0.91 two strengthening mechanisms are activated at the same time, twin and grain boundary mechanisms. Thence, the strain level εeq = 0.91 can be considered a threshold-like strain limit to initiate a microstructure twin strengthening. At strain levels above it, εeq = 1.21, the pure copper plastically deformed under HPT straining by further generating new GNDs and by refining the grain structure (Figure 2c). Moreover, Figure 2c also shows the formation of dislocation pile-up. This, in turns, is responsible for the generation of lattice distortion on both sides of the cell wall that evolves together with the twins. These twins nucleated at grain boundaries to extend within the grain.
The formation of these twins is responsible for the development of sharp grain boundaries, which in turns implies a substantial stress relief in the boundary surrounding areas.
The microstructure evolution of the 6N-Al proceeds by the initial formation and then evolution of the TDs (εeq = 0.05, Figure 3a)). The density of the TD, ρTD, is initially quite low. Anyway, this is induced to rise steadily already at εeq = 0.05 (Figure 3b). Whenever cell boundaries and then grain boundaries are formed out of the TDs, their density start to slightly decrease (Figure 3c). The quantitative evaluation of the ρTD is reported in Table 2. In particular, Figure 3b clearly shows the formation of the first LABs, while at εeq = 0.10 (Figure 3c), some grain boundaries (HABs) were also detected. This in turns means that the minimum necessary strain to induce the formation of cell, and eventually grain boundaries, that is the initiation of microstructure refining process induced by the plastic deformation, can be identified as εeq ≅ 0.05.
Thus, it resulted that at εeq = 0.05 TDs start to rearrange and to group to a certain crystallographic orientation, forming a cell wall (LAB). By cumulating the shear deformation, even if at the earliest levels (εeq < 0.10) LABs are induced to evolve into cell boundaries, and eventually to grain boundaries (HABs).
In the case of OFHC pure Cu, the dislocation density, ρTD, continuously decreased with cumulative straining. In particular, at the strain level by which twins started to form, (εeq = 0.91), ρTD reduced by one-third respect to the tangled dislocation density measured at the strain level where no new grain boundaries were generated by HPT, (εeq = 0.40). As soon as grain boundary started to be promoted by the HPT, and twinning grains were formed, the tangled dislocation density reduction trend was found to slow down. On the other hand, the fraction of twinned grains at εeq = 0.91 and εeq = 1.21 was 3.0 ± 0.5%, and 14 ± 2%, respectively. The mean spacing of twins did not changed significantly from εeq = 0.91 to 1.21, being λT = 27 ± 3 and λT = 30 ± 5 nm, respectively.
Mean grain, dg, and cell size, dcell, evolution with cumulative HPT straining, were measured by TEM in the OFHC pure Cu. Grain, and especially cell size reduced steadily from εeq = 0.40 to 1.21. These data are reported in Table 3. Thus, from the initial annealed state, where dg = 28 µm, grain size reduced to 19 µm at εeq = 0.40, and to ~11 µm at εeq = 1.21. Correspondingly, cell size reduced from an initial mean value dcell = 1100 nm, at εeq = 0.40, to 540 nm, at εeq = 1.21.

3.2. Nanoindentation Hardness, H

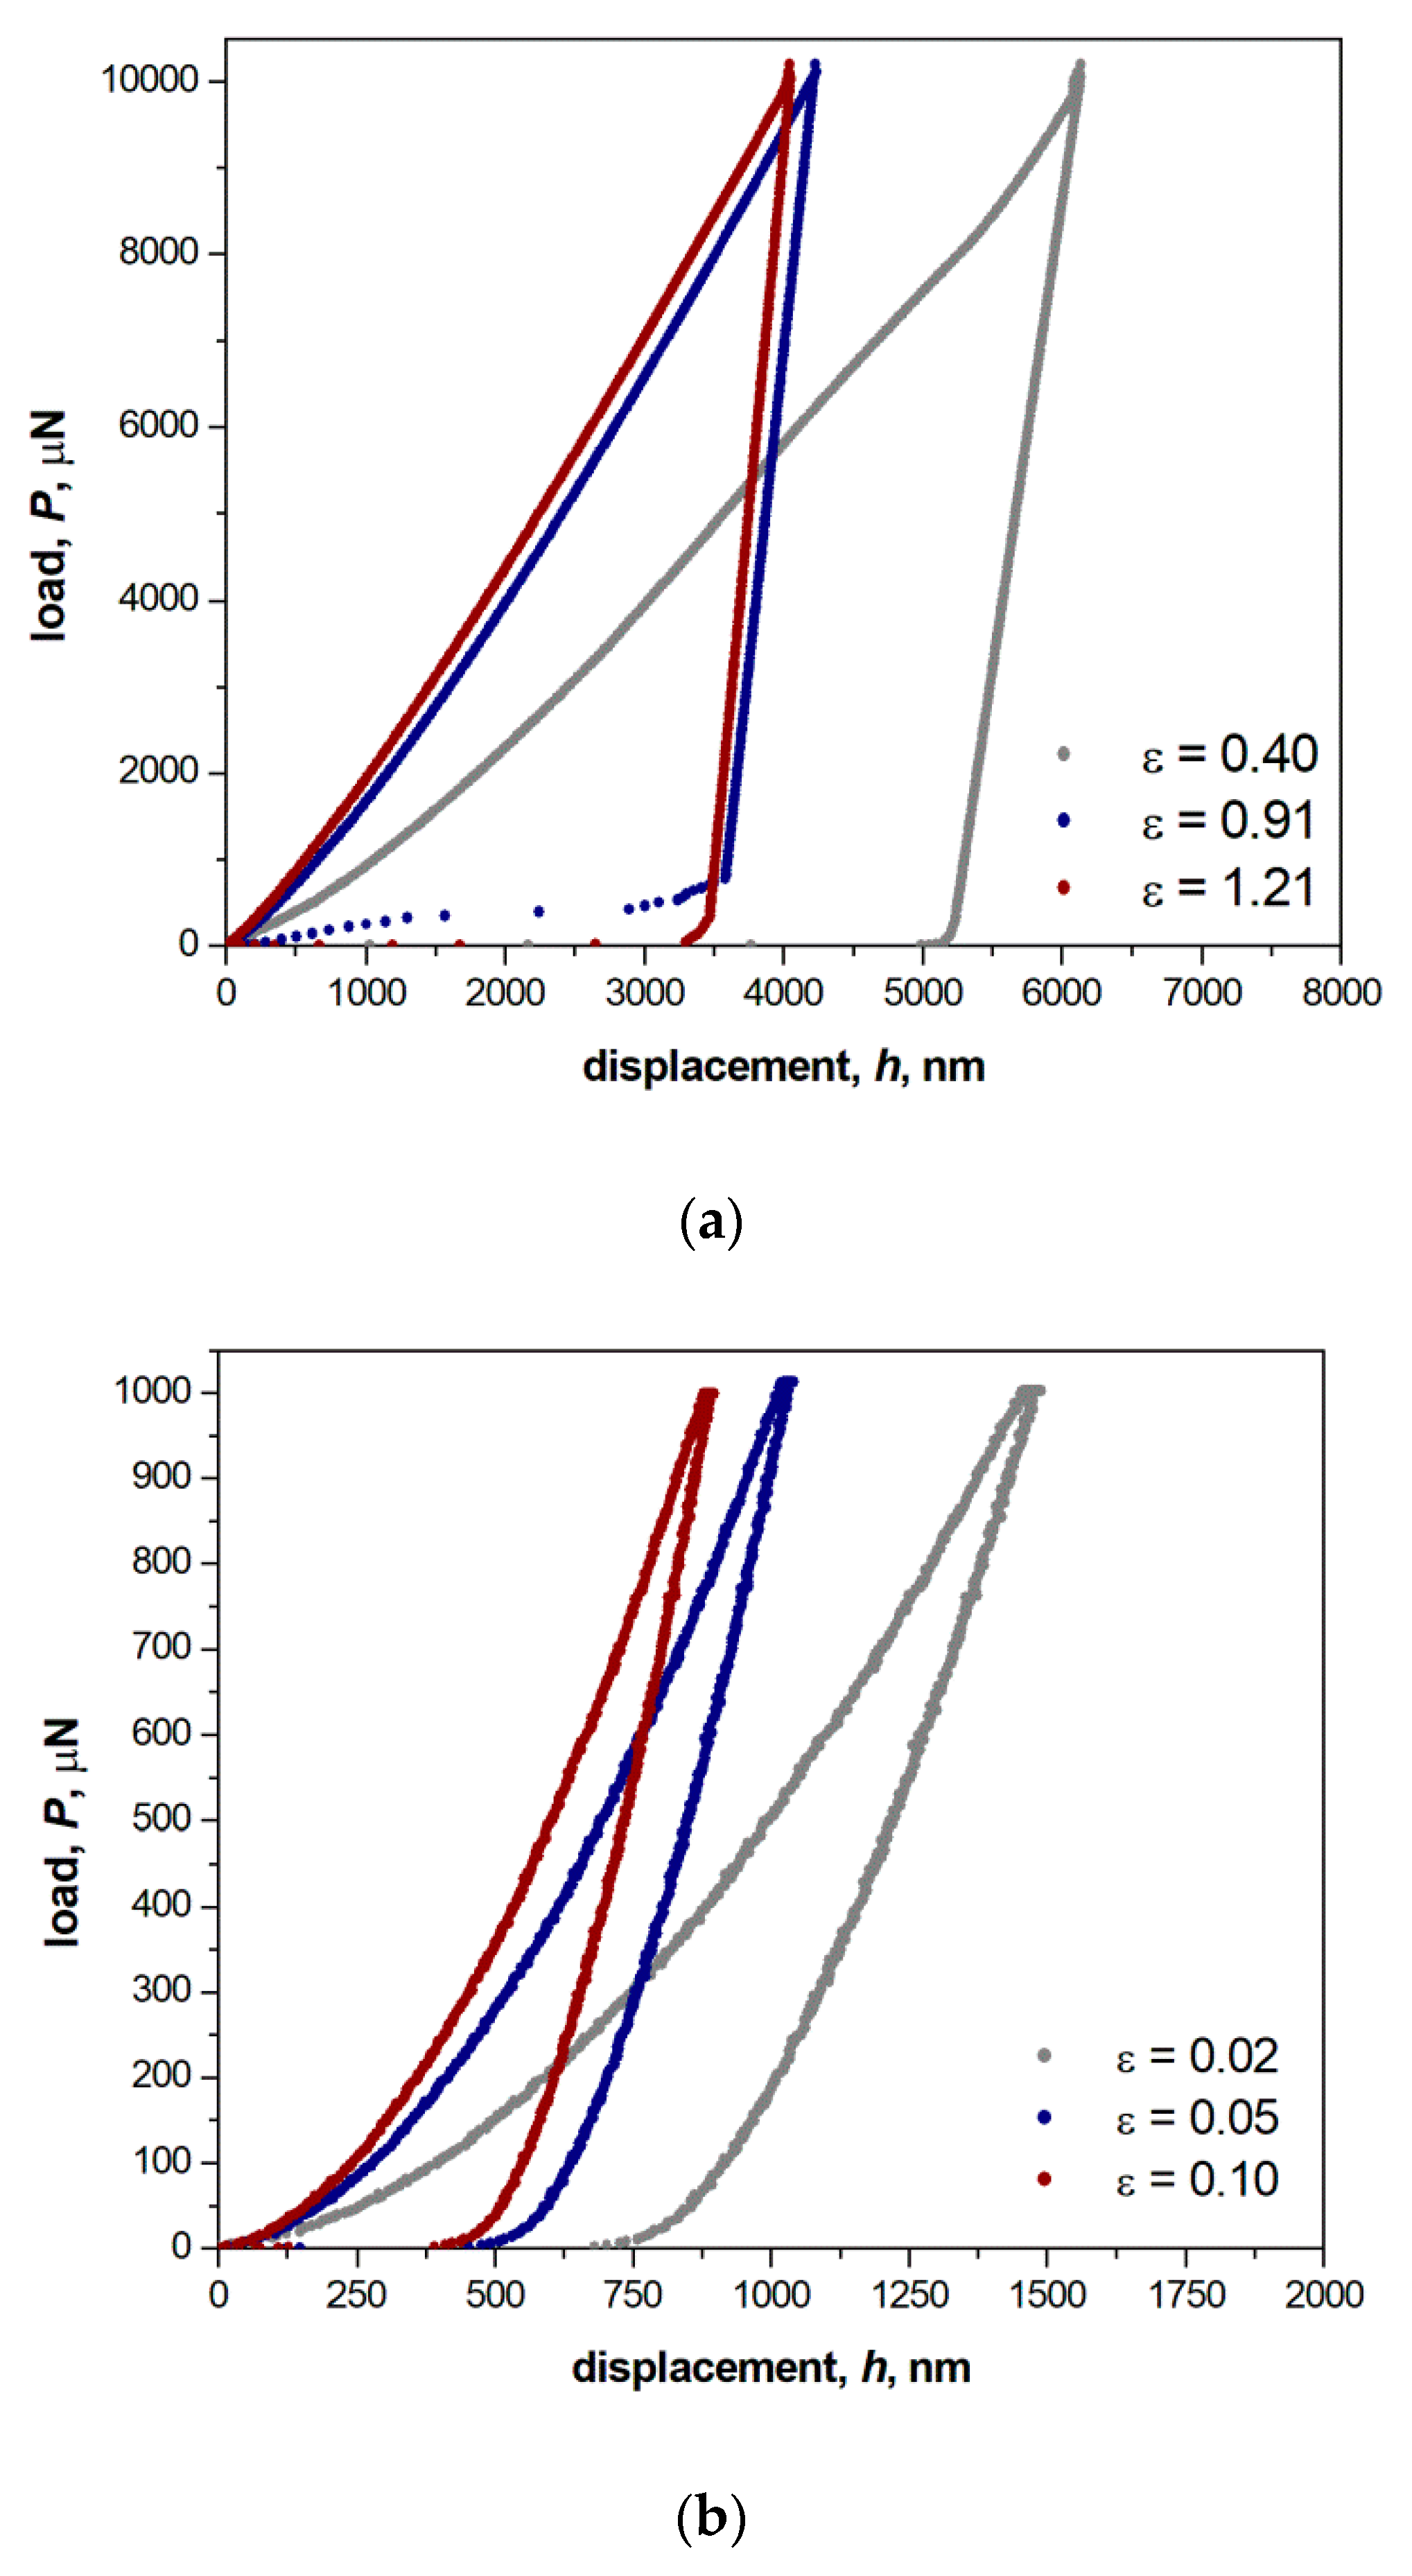
In order to describe the strengthening evolution of the two pure metals with cumulative HPT straining, nanoindentation hardness, H, measurements were performed. Figure 4 shows representative nanoindentation load–displacement curves, Ph (with a fixed load P = 10 mN) of OFHC Cu and 6N-Al. For Cu, nanoindentation curves refer to εeq = 0.40, 0.91, and 1.21, while for Al curves refer to εeq = 0.02, 0.05, and 0.10.
As expected, the penetration depth, hc, reduced with cumulative straining. In particular, for Cu, the unloading slope of the P–h slightly increased from the minimum detected strain of εeq = 0.40 to εeq = 0.91. This is due to the reduced Young’s modulus, Er, which slightly increased from a strain of εeq = 0.91. This in turns implies that the occurrence of twinning formation within the grains affects the elastic response of pure Cu. On the other hand, as reported in Table 3, H steadily increased from the minimum, εeq = 0.40, to εeq = 1.21.
In the case of Al the hardness increased from εeq = 0.02 to 0.05, and it appeared to significantly slowdown from εeq = 0.05 to 0.10 (Table 3). This is believed to be due to the detected formation of LABs, and some HABs, from TDs, which was found to occur at εeq = 0.05. That is, Al started to be hardened by the effect of the TDs continuously introduced by the HPT shear for strain levels εeq < 0.05. At εeq = 0.05, the strengthening mechanism changed from TDs to TDs, LABs, and to a much lesser extent also by HABs.

4. Discussion

4.1. Case of OFHC 99.99% Pure Copper

Dislocation formation, in form of statistically stored dislocations (SSDs), and geometrically necessary dislocations (GNDs), and twin formation with cumulative straining are the two key mechanisms of microstructure strengthening in OFHC 99.99% pure Cu. Under plastic deformation, the newly introduced dislocations are induced to slide, and deformation twinning can be activated. Both microstructure modifications account to accommodate the imposed plastic strain [26]. The mean factors governing these microstructure modifications can be identified as the material stacking fault energy (SFE), the grain size, dg, and crystallographic orientation (texture) [27,28,29]. Whenever twinned grains have a proper crystallographic orientation respect to the external load, multiple twinning systems are activated, leading to twin–twin intersection phenomena. These, in turn, become a further strengthening mechanism for the twinned metallic material [30,31].
Thence, in low SFE metals the reduced dislocation mobility make the twinning deformation a necessary-like mechanism for the microstructure rearrangement driven by the applied external load. In the present study, this necessary-like microstructure mechanism of twinning formation under HPT was found to occur for a strain level as low as εeq = 0.91. For lower strain levels, the microstructure strengthened only by formation and evolution of SSDs, GNDs, cell walls, and eventually some HABs. Thence, the role of the SSDs and GNDs referring to the continuous process of cell and grain refinement induced by the HPT deformation was twofold. On one side, it was a microstructure source of active line defects able to thickening the newly generated boundaries (cells or grains). On another side, it contributed to rise the boundary misorientation angle to promote the formation of new grain boundaries from the earlier formed cell boundaries. That is, a boundary misorientation continuous increment to promote LABs to HABs.
The OFHC Cu strengthening with cumulative HPT straining was modelled starting from the observed and quantified features acting in the deformed microstructure. These contributions were the dislocations and LABs introduced by HPT for strain levels εeq < 0.40. From this strain, the occurrence of twins make the metal strengthening to be described not any longer only by dislocations and LABs, but also by HABs, and twinning. Thence, the following relationship was proposed to model the OFHC Cu strengthening, Equation (3) [32,33]:
σy = σ0 + σdisl. + σHP + σTB
where σ0, σdisl. is the stress due to SSDs and GNDs, σHP is the stress given by the Hall–Petch relationship applied to the grains, σTB is the stress due to the twins (twin boundaries, TB).
The dislocation contribution is the linear combination of the SSDs and of the GNDs strengthening, and they are both directly dependent on the related densities. In particular, SSDs do form very low-angle and low-angle boundaries under plastic deformation, and thus their density is expressed as, Equation (4) [10]:
ρSSD = wall + (1 − f)ρTD
where f is the fraction of the SSDs that do contribute to the wall (boundary) formation, ρwall is the density of the formed walls, and ρTD represents the density of the dislocations existing in the cell and grain interiors that did not form boundaries (i.e., TD). According to [34] the value of f can be determined as f = 1 − (1 − λwall/dcell)3, λwall and dcell being the mean wall (cell boundary) thickness and cell size, respectively.
Thence, the dislocation strengthening contribution, σdisl., can be calculated as, Equation (5):
σdisl. = MαGb[wall + (1 − f)ρTD + ρGND]0.5
where M = 3.06 is the Taylor factor, α = 0.33, G = 48.2 GPa is the shear modulus of pure copper, and b = 0.256 nm is the copper Burgers vector [35].
Onset of twinning occurs whenever the slip stress reaches the minimum necessary strain to activate the twinning. The present results showed that the minimum necessary strain level to initiate the twin formation was εeq = 0.91. Thence, according to Meyers et al. [26], twins yield a further strengthening contribution given by their boundaries (TB), σTB. This strengthening contribution is of the same type of Hall–Petch for grains, with KTB = 0.28 MPa·m1/2 that is σTB = KTB·dg−1/2.
Thus, by taking into account the actual fraction of twinned grains, ftwin, the following strengthening model was here proposed, Equation (6):
σy = σ0 + MαGb{[wall + (1 − f)ρTD + ρGND]1/2 + [(ftwin·KTB + (1 − ftwinKHP]dg−1/2}
Dislocation density, namely ρwall, ρTD, ρGND, and fraction of wall boundaries, f, were determined by TEM stereology analyses (ASM EN-112). These data are reported in Table 4.
The present approach founds a number of scientific support given by previously published works and models proposed for different pure metals and alloys. These include studies by Mughrabi using a composite-like model [36], and several other modified models used to adapt the Mughrabi composite-like model to different metals and alloys [37,38,39,40]. Anyhow, the innovative aspect of the present findings is that the present approach is applied to model the earlier stages of plastic deformation in pure metals, such copper.
The strengthening obtained by Equation (6) was compared to the OFHC Cu stress derived from the experimental nanoindentation hardness measurements.
Thus, using χ = Hnanoind/σy = 3.5 [41] as multiplicative factor between the measured hardness, Hnanoind, and the metal yield stress, σy, the microstructure model described by Equation (6) showed quite a good agreement. These data are reported in Table 4. Thus, the model of Equation (6) is able to determine which microstructure features contribute to the pure Cu strengthening during the earlier stages of HPT plastic deformation.

4.2. Case of 6N-Al

In materials with medium to high SFE, as the 6N-Al used here, both SSDs and GNDs started to develop since the early stages of plastic deformation. The role of GNDs is to accommodate the shear strain gradients throughout the microstructure. SSDs are formed by tangled dislocation random trapped under uniform localized deformation. These newly introduced dislocations easily slide by cross slip and thence LABs and HABs are induced to form with cumulative strain. The mechanism of boundary formation is ultimately driven by a mutual trapping, rearrangement, and annihilation process of the TDs (chiefly being of GND type) [42].
Hardness rising trend with cumulative strain was found to slow down starting from εeq > 0.05. This is likely to be due to the high dislocation mobility that is favored by the ultrahigh purity and the high stacking fault energy. The newly formed grain boundaries start acting as dislocation sinks, as when the grain sizes are large, the dislocations can accumulate in the interior of grains and form dislocation cells.
Thus, the hardness results suggest a direct correlation between the minimum necessary strain to initiate cell boundaries (LABs) formation and the hardness trend of increment with cumulative straining. In fact, at εeq = 0.05 the density of TDs, ρTD, started to slightly reduce (Table 2). Due to the high SFE of high-purity aluminum, microstructural evolution occurs by TD rearrangement at low levels and low deformation rates under HPT, as high strain levels are needed to achieve microstructural homogeneity. In particular, due to the specific strain path induced by HPT, the vast majority of dislocations, if not all of them, are GNDs [43].
To model the pure aluminum strengthening driven by the earlier stages of HPT deformation, the following relationship was here proposed, Equation (7):
σy = σ0 + σd = σ0 + σTD + (σVLAB + σLAB + σGB)
where σ0 = 10 MPa is the frictional stress of pure Al, σd the strengthening factor given by all the existing dislocations, that is σTD due to the TDs, σVLAB the contribution form the cell boundaries with misorientation angle within 2° (very-low angle boundaries, VLABs), and σLAB and σGAB the contributions coming from the cell (LAB) and grain (HAB) boundaries, respectively. This strengthening model was first introduced by Hansen [17] and later adapted by Cabibbo in [10].
According to the TEM observations, for strain levels εeq < 0.05, the yield stress is given only by the TDs, and Equation (7) reduced to Equation(8):
σy|ε<0.05 = σ0 + σTD
On the other hand, for εeq > 0.05, Equation (7) can be rewritten as, Equation (9):
σy|ε=0.05−0.10 = σ0 + σTD + (σVLAB + σLAB)
According to [44], σTD, that as above outlined essentially coincides with the GNDs (ρTD ρGND), can be calculated as, Equation (10):
σTD = MαGbρTD0.5
where M = 2.94 is the Taylor factor [45], α is a fitting constant ranging from 0.2 to 0.3, and usually agreed to be 0.24 [45], G = 26 GPa is the shear modulus of aluminum, and b = 0.286 is the aluminum Burgers vector.
Since at low strain levels, i.e., εeq < 0.10 the detected volume fraction of the cell boundaries was quite low, and that of the grain boundaries was even lower, the strengthening contribution of these could be estimated by taking into account the mean dislocation density forming those boundaries. Thus, σVLAB + σLAB = σVLAB + LAB = MαGbρVLAB + LAB0.5, and ρVLAB + LAB is the average dislocation density that form the very-low angle and low-angle boundaries. These can be considered together, since in the early stages of formation of cell boundaries from TDs, the misorientation angle was found to be within 8°, with a large fraction around 2–6° misorientation angles.
In the present case, for low strain levels, the newly formed boundaries are rather scattered and have mostly low misorientation angles formed by few dislocations. Thus, to evaluate the cell boundary contribution the approach drawn by Qiao and co-workers [46] was here taken into account, Equation (11):
σVLAB+LAB = (α′GbS/4.365)ρVLAB+LAB
where α′ = 2 [46], S is the average distance between the boundary dislocations. This relationship holds for low angle boundaries and this why the approach of Equation (9) was used.
According to [47], the strengthening contribution by the few grain boundaries formed at 0.05 < εeq < 0.10, was modelled as, Equation (12):
σ H A B = ( α G b 4.365 ) b ρ H A B a r c t g ( b S )
Thus, Equations (8) and (9) can be rewritten as, Equations (13) and (14):
σy|ε<0.05 = σ0 + MαGbρTD0.5
σ y | ε = 0.0 0.10 = σ 0 + M α Gb ρ TD 0.5 + ( α GbS / 4.365 ) ρ VLAB + LAB + ( α G b 4.365 ) b ρ H A B a r c t g ( b S )
The average distance S of, respectively, the LAB, Equation (11), and HAB, (Equation (12)), was evaluated by TEM inspections. The 6N-Al yield stress as determined by the Equation (13) and Equation (14), for the lower strain levels, i.e., εeq < 0.10, is listed in the Table 5.
A good agreement between the modelled 6N-Al strengthening with HPT and the measured nanoindentation hardness was obtained for the three strain levels here considered, εeq = 0.02, 0.05, and 0.10. Data are reported in Table 5. It resulted that the good agreement was found by using the same multiplicative factor, χ = 3.5, between nanoindentation hardness, Hnanoind, and yield stress. In particular, in OFHC Cu the yield stress determined by the microstructure model of Equation (6), σymodel, deviated from the values obtained by the nanoindentation measurements, σynanoind, by 18% at the most. On the other hand, in 6N-Al the microstructure based strengthening model of Equations (13) and (14) underestimated the metal yield stress as determined by nanoindentation by a few percent at the lowest strain level (εeq = 0.02). The largest difference between the σymodel and the σynanoind was found at the strain level at which TDs started to form LABs, cell boundaries ((εeq = 0.05). Anyhow, the agreement between σymodel and σynanoind was reasonably good.
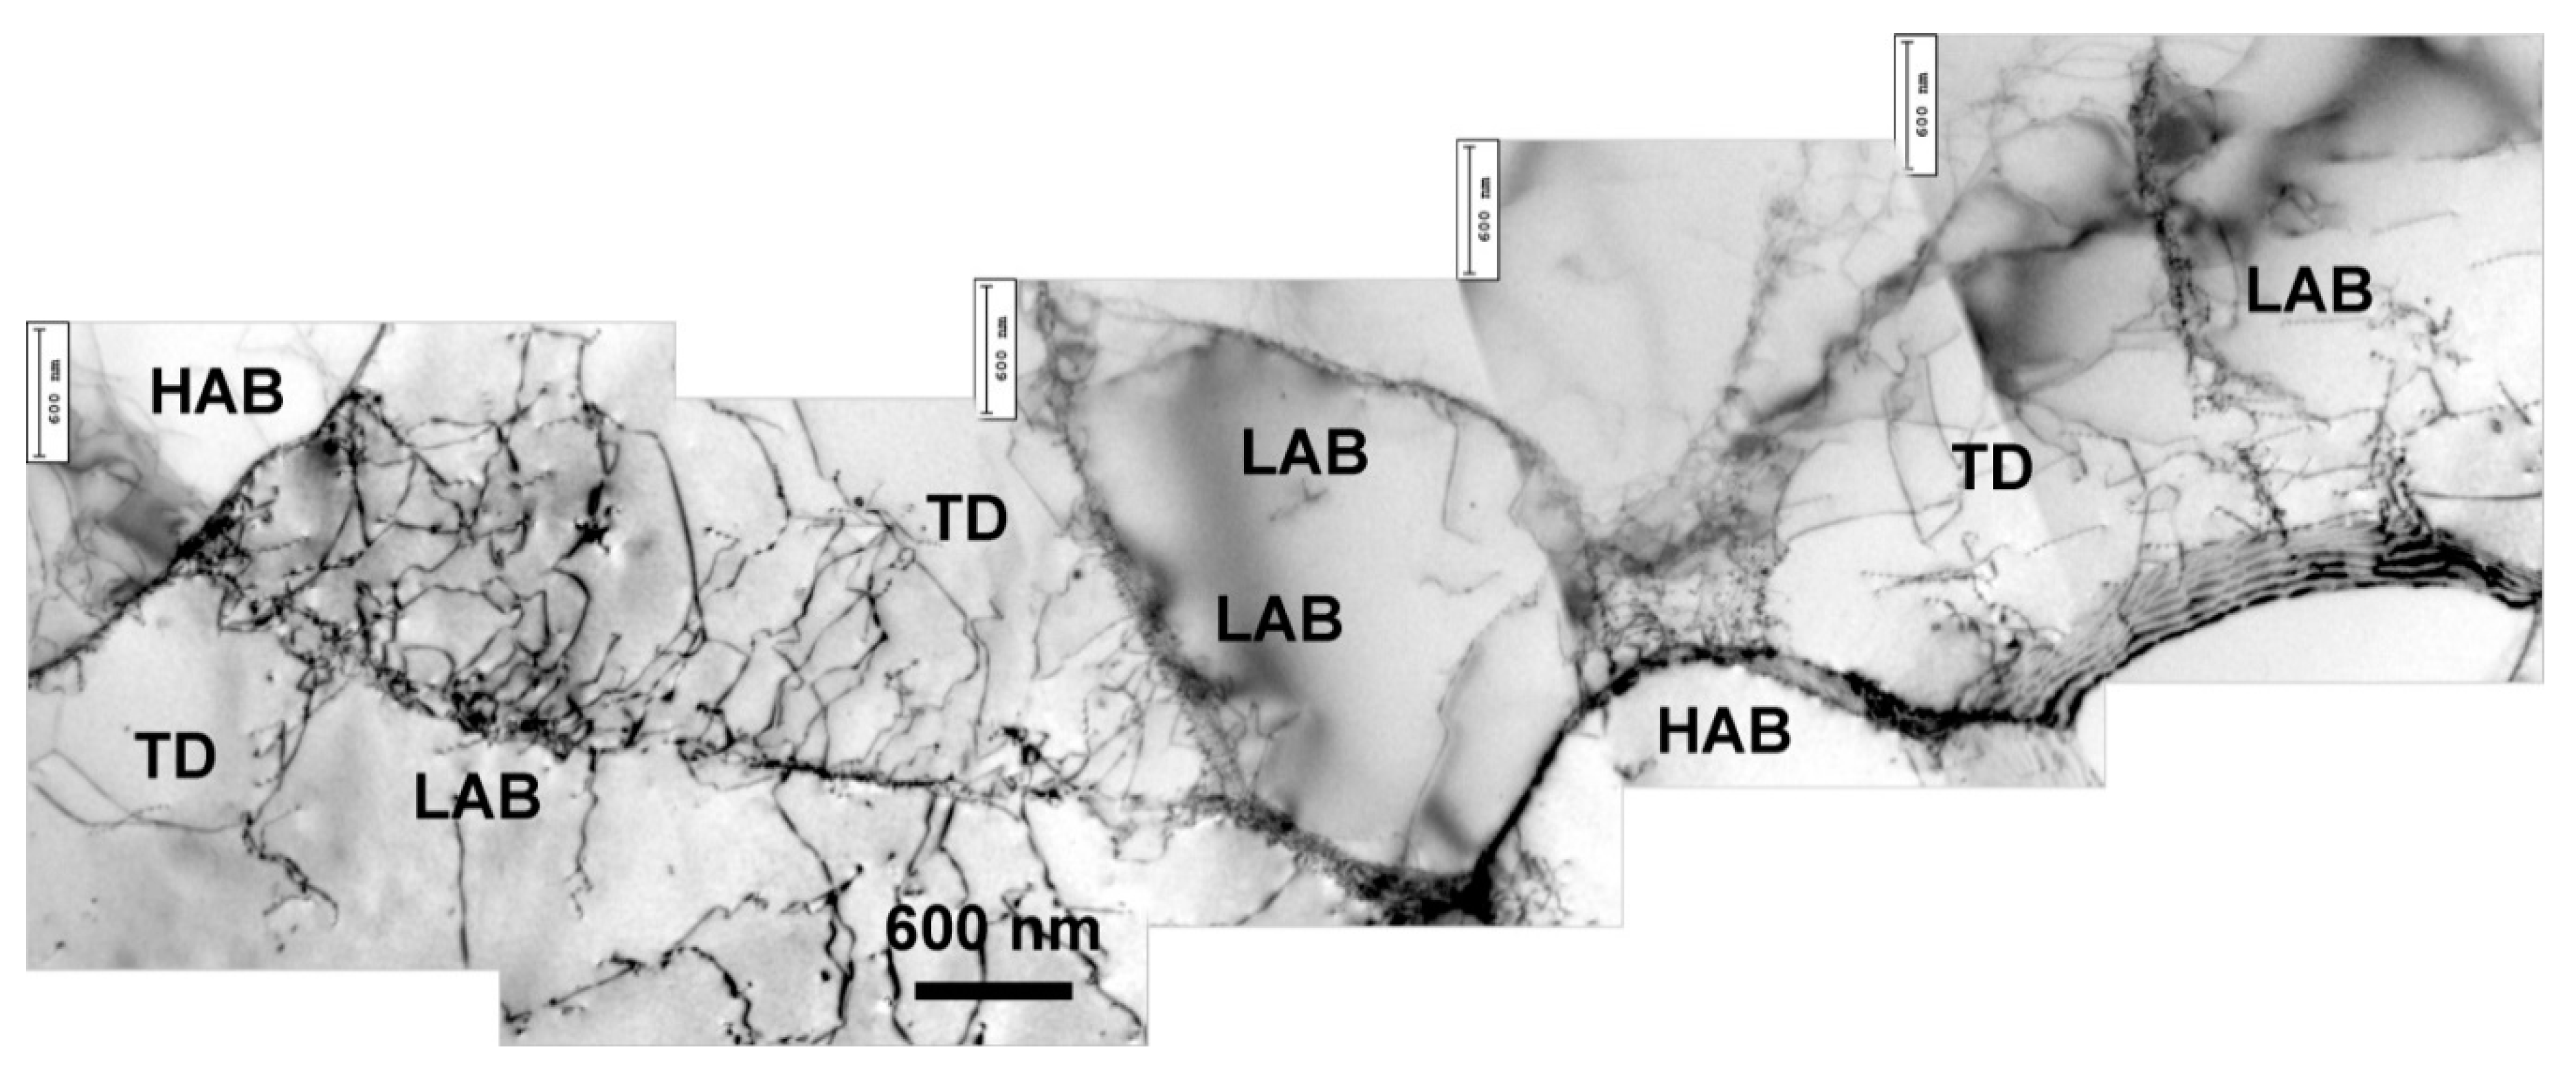
Finally, Figure 5 shows a montage of TEM micrographs documenting the process of LAB and HAB formation from TDs which was able to successfully model the microstructure strengthening induced by the early stages of plastic deformation in HPT 6N-Al.

5. Conclusions

The early stages of plastic deformation by HPT on pure copper and pure aluminum were characterized by TEM and nanoindentation A OFHC 99.99 pure Cu was subjected to shear strain up to εeq = 1.21, while a 6N-Al was plastically deformed for quite low shear strains, up to εeq = 0.10.
The following major findings can be outlined.
  • A minimum necessary strain level to induce the formation of LABs and eventually HABs was identified for both copper and aluminum, and it was found to be εeq = 0.05 for the 6N-Al, and εeq < 0.40 for the OFHC Cu.
  • In OFHC Cu a low cut-off strain level of εeq = 0.91 was identified as the minimum necessary strain to induce twin formation within the grains.
  • A microstructure based strengthening model was proposed and applied for both the pure metals. In the case of aluminum, the strengthening contribution came from the tangled dislocations (TDs) which were promoted to form LABs and eventually HABs with cumulative HPT straining. In the case of copper, being a low SFE metal, statistically stored dislocations (SSDs), geometrically necessary dislocations (GNDs), dislocation walls (DWs), and grain boundaries contributed to the metal strengthening before the occurrence of twin that was promoted by the cumulative straining from εeq = 0.91. Beyond this strain, twin boundaries started to act as further strengthening contribution for the HPT OFHC Cu.
  • Both microstructure-based models were directly compared to the metal stress obtained by the nanoindentation hardness measurements at the different experimental conditions here tested. Quite a good agreement was found by setting the multiplicative factor between the measured hardness and the resulting metal yield stress, HV/σy, χ = 3.5.

Author Contributions

Conceptualization, methodology, investigation, writing, and editing, M.C.; data analysis, validation, and editing, E.S. All authors have read and agreed to the published version of the manuscript.

Funding

This research received no external funding.

Acknowledgments

The author is grateful to “Istituto Sperimentale Metalli Leggeri” of Novara for the 6N-Al material delivery.

Conflicts of Interest

The authors declare no conflict of interest.

References

  1. Huang, X.X.; Hansen, N.; Tsuji, N. Hardening by Annealing and Softening by Deformation in Nanostructured Metals. Science 2006, 312, 249–251. [Google Scholar] [CrossRef] [PubMed] [Green Version]
  2. Sabirov, I.; Murashkin, M.Y.; Valiev, R.Z. Nanostructured aluminium alloys produced by severe plastic deformation: New horizons in development. Mater. Sci. Eng. A 2013, 560, 1–24. [Google Scholar] [CrossRef]
  3. Xun, Y.; Mohamed, F.A. Refining efficiency and capability of top-down synthesis of nanocrystalline materials. Mater. Sci. Eng. A 2011, 528, 5446–5452. [Google Scholar] [CrossRef]
  4. Zhilyaev, A.P.; Langdon, T.G. Using high-pressure torsion for metal processing: Fundamentals and applications. Prog. Mater. Sci. 2008, 53, 893–979. [Google Scholar] [CrossRef]
  5. Valiev, R.Z.; Langdon, T.G. Principles of equal-channel angular pressing as a processing tool for grain refinement. Prog. Mater. Sci. 2006, 51, 881–981. [Google Scholar] [CrossRef]
  6. Vinogradov, A.; Estrin, Y. Analytical and numerical approaches to modelling severe plastic deformation. Prog. Mater. Sci. 2018, 95, 172–242. [Google Scholar] [CrossRef]
  7. Cao, Y.; Ni, S.; Liao, X.; Song, M.; Zhu, Y. Structural evolutions of metallic materials processed by severe plastic deformation. Mater. Sci. Eng. R Rep. 2018, 133, 1–59. [Google Scholar] [CrossRef]
  8. Li, B.L.; Tsuji, N.; Kamikawa, N. Microstructure homogeneity in various metallic materials heavily deformed by accumulative roll-bonding. Mater. Sci. Eng. A 2006, 423, 331–342. [Google Scholar] [CrossRef]
  9. Ito, Y.; Edalati, K.; Horita, Z. High-pressure torsion of aluminum with ultrahigh purity (99.9999%) and occurrence of inverse Hall-Petch relationship. Mater. Sci. Eng. A 2017, 679, 428–434. [Google Scholar] [CrossRef]
  10. Cabibbo, M. Microstructure strengthening mechanisms in different equal channel angular pressed aluminum alloys. Mater. Sci. Eng. A 2013, 560, 413–432. [Google Scholar] [CrossRef]
  11. Ovid’Ko, I.A.; Valiev, R.Z.; Zhu, Y.T. Review on superior strength and enhanced ductility of metallic nanomaterials. Prog. Mater. Sci. 2018, 94, 462–540. [Google Scholar] [CrossRef]
  12. Cabibbo, M. Nanostructured Cobalt Obtained by Combining Bottom-Up and Top-Down Approach. Metals 2018, 8, 962. [Google Scholar] [CrossRef] [Green Version]
  13. Venables, J. The electron microscopy of deformation twinning. J. Phys. Chem. Solids 1964, 2, 59. [Google Scholar] [CrossRef]
  14. Zhao, Y.H.; Liao, X.Z.; Zhu, Y.T.; Horita, Z.; Langdon, T.G. Influence of stacking fault energy on nanostructure formation under high pressure torsion. Mater. Sci. Eng. A 2005, 410, 188–193. [Google Scholar] [CrossRef]
  15. Murr, L.E. Interfacial Phenomena in Metals and Alloys; Addison-Wesley Pub. Co.: Boston, MA, USA, 1975. [Google Scholar]
  16. Hansen, N.; Huang, X.; Winther, G. Grain orientation, deformation microstructure and flow stress. Mater. Sci. Eng. A 2008, 494, 61–67. [Google Scholar] [CrossRef]
  17. Hansen, N. Hall–Petch relation and boundary strengthening. Scr. Mater. 2004, 51, 801–806. [Google Scholar] [CrossRef]
  18. Starink, M.J.; Qiao, X.G.; Zhang, J.; Gao, N. Predicting grain refinement by cold severe plastic deformation in alloys using volume averaged dislocation generation. Acta Mater. 2009, 57, 5796–5811. [Google Scholar] [CrossRef] [Green Version]
  19. Polakowski, N.H.; Ripling, E.J. Strength and Structure of Engineering Materials; Prentice-Hall: Upper Saddle River, NJ, USA, 1966. [Google Scholar]
  20. Russ, J.C.; Dehoff, R.T. Practical Stereology; Springer Science and Business Media LLC: Berlin, Germany, 2000. [Google Scholar]
  21. Cabibbo, M. A TEM Kikuchi pattern study of ECAP AA1200 via routes A, C, BC. Mater. Charact. 2010, 61, 613–625. [Google Scholar] [CrossRef]
  22. Cabibbo, M.; Blum, W.; Evangelista, E.; Kassner, M.E.; Meyers, M.A. Transmission electron microscopy study of strain induced low- and high-angle boundary development in equal-channel angular-pressed commercially pure aluminium. Metall. Mater. Trans. A 2008, 39, 181–192. [Google Scholar] [CrossRef]
  23. Cabibbo, M.; Ricci, P.; Cecchini, R.; Rymuza, Z.; Sullivan, J.; Dub, S.; Cohen, S.R. An international round-robin calibration protocol for nanoindentation measurements. Micron 2012, 43, 215–222. [Google Scholar] [CrossRef]
  24. Oliver, W.C.; Pharr, G.M. Measurement of hardness and elastic modulus by instrumented indentation: Advances in understanding and refinements to methodology. J. Mater. Res. 2004, 19, 3–20. [Google Scholar] [CrossRef]
  25. Gong, J.; Miao, H.; Peng, Z. Analysis of the nanoindentation data measured with a Berkovich indenter for brittle materials: Effect of the residual contact stress. Acta Mater. 2004, 52, 785–793. [Google Scholar] [CrossRef]
  26. Meyers, M.A.; Vöhringer, O.; Lubarda, V. The onset of twinning in metals: A constitutive description. Acta Mater. 2001, 49, 4025–4039. [Google Scholar] [CrossRef]
  27. Han, W.Z.; Zhang, Z.; Wu, S.; Li, S. Combined effects of crystallographic orientation, stacking fault energy and grain size on deformation twinning in fcc crystals. Philos. Mag. 2008, 88, 3011–3029. [Google Scholar] [CrossRef]
  28. Cao, Y.; Wang, Y.B.; Liao, X.; Kawasaki, M.; Ringer, S.; Langdon, T.G.; Zhu, Y. Applied stress controls the production of nano-twins in coarse-grained metals. Appl. Phys. Lett. 2012, 101, 231903. [Google Scholar] [CrossRef] [Green Version]
  29. Laplanche, G.; Kostka, A.; Horst, O.; Eggeler, G.; George, E. Microstructure evolution and critical stress for twinning in the CrMnFeCoNi high-entropy alloy. Acta Mater. 2016, 118, 152–163. [Google Scholar] [CrossRef] [Green Version]
  30. Müllner, P.; Romanov, A. Internal twinning in deformation twinning. Acta Mater. 2000, 48, 2323–2337. [Google Scholar] [CrossRef]
  31. Christian, J.; Mahajan, S. Deformation twinning. Prog. Mater. Sci. 1995, 39, 1–157. [Google Scholar] [CrossRef]
  32. Han, W.; Wu, S.; Huang, C.; Li, S.; Zhang, Z. Orientation Design for Enhancing Deformation Twinning in Cu Single Crystal Subjected to Equal Channel Angular Pressing. Adv. Eng. Mater. 2008, 10, 1110–1113. [Google Scholar] [CrossRef]
  33. Antolovich, S.D.; Armstrong, R.W. Plastic strain localization in metals: Origins and consequences. Prog. Mater. Sci. 2014, 59, 1–160. [Google Scholar] [CrossRef]
  34. Lapovok, R.; Dallatorre, F.; Sandlin, J.; Davies, C.H.J.; Pereloma, E.; Thomson, P.; Estrin, Y. Gradient plasticity constitutive model reflecting the ultrafine micro-structure scale: The case of severely deformed copper. J. Mech. Phys. Solids 2005, 53, 729–747. [Google Scholar] [CrossRef]
  35. Dalla Torre, F.; Lapovok, R.; Sandlin, J.; Thomson, P.F.; Davies, C.H.J.; Pereloma, E.V. Microstructures and properties of copper processed by equal channel angular extrusion for 1–16 passes. Acta Mater. 2004, 52, 4819–4832. [Google Scholar] [CrossRef]
  36. Mughrabi, H. Dislocation wall and cell structures and long-range internal stresses in deformed metal crystals. Acta Metall. 1983, 31, 1367–1379. [Google Scholar] [CrossRef]
  37. Ungár, T.; Toth, L.S.; Illy, J.; Kovacs, I. Dislocation structure and work hardening in polycrystalline ofhc copper rods deformed by torsion and tension. Acta Metall. 1986, 34, 1257–1267. [Google Scholar] [CrossRef]
  38. Argon, A.; Haasen, P. A new mechanism of work hardening in the late stages of large strain plastic flow in F.C.C. and diamond cubic crystals. Acta Metall. Mater. 1993, 41, 3289–3306. [Google Scholar] [CrossRef]
  39. Estrin, Y.; Toth, L.S.; Molinari, A.; Bréchet, Y. A dislocation-based model for all hardening stages in large strain deformation. Acta Mater. 1998, 46, 5509–5522. [Google Scholar] [CrossRef]
  40. Feaugas, X.; Pilvin, P. A Polycrystalline Approach to the Cyclic Behaviour of f.c.c. Alloys-Intra-Granular Heterogeneity. Adv. Eng. Mater. 2009, 11, 703–709. [Google Scholar] [CrossRef]
  41. Cabibbo, M. Nanoindentation twin-sensitive measurements and strengthening model of HPT OFHC 99.99% purity copper. Mater. Sci. Eng. A 2020, 785, 139348. [Google Scholar] [CrossRef]
  42. An, X.; Lin, Q.; Qu, S.; Yang, G.; Wu, S.; Zhang, Z. Influence of stacking-fault energy on the accommodation of severe shear strain in Cu-Al alloys during equal-channel angular pressing. J. Mater. Res. 2009, 24, 3636–3646. [Google Scholar] [CrossRef] [Green Version]
  43. Hedman, E.; Groza, I.; Karlsson, S. Subgrain growth in Al and Al-1% Mn during annealing. J. Mater. Sci. 1978, 13, 1229–1242. [Google Scholar] [CrossRef]
  44. Cabibbo, M.; Spigarelli, S. A TEM quantitative evaluation of strengthening in an Mg–RE alloy reinforced with SiC. Mater. Charact. 2011, 62, 959–969. [Google Scholar] [CrossRef]
  45. Hansen, N.; Huang, X. Microstructure and flow stress of polycrystals and single crystals. Acta Mater. 1998, 46, 1827–1836. [Google Scholar] [CrossRef]
  46. Qiao, X.; Starink, M.J.; Gao, N. Hardness inhomogeneity and local strengthening mechanisms of an Al1050 aluminium alloy after one pass of equal channel angular pressing. Mater. Sci. Eng. A 2009, 513, 52–58. [Google Scholar] [CrossRef] [Green Version]
  47. Toth, L.S.; Estrin, Y.; Lapovok, R.; Gu, C. A model of grain fragmentation based on lattice curvature. Acta Mater. 2010, 58, 1782–1794. [Google Scholar] [CrossRef]
Figure 1. Not to scale scheme of HPT showing the location of extraction of the TEM discs; red label refers to OFHC Cu, grey labels refer to 6N-Al. The blue solid circle depicts the electron transparency area of the TEM discs.
Metals 10 00751 g001
Figure 2. Microstructure evolution with cumulative HPT shear strain of OFHC 99.99% pure Cu at εeq = 0.40 (a); εeq = 0.91 (b); and εeq = 1.21 (c). A representative Kikuchi pattern used to measuring the misorientation across the boundaries is reported in (d), in the case of OFHC 99.99% pure Cu at εeq = 1.21.
Metals 10 00751 g002
Figure 3. Microstructure evolution with cumulative HPT shear strain of 6N-Al at εeq = 0.05 (a); εeq = 0.05 (b); and εeq = 0.10 (c). A representative Kikuchi pattern used to measuring the misorientation across the boundaries is reported in (d), in the case of OFHC 99.99% pure Cu at εeq = 1.21.
Metals 10 00751 g003
Figure 4. Nanoindentation load–displacement curves, P–h, using a load P = 10 mN, for HPT OFHC 99.99% purity Cu at εeq = 0.40, 0.91, and 1.21 (a) and for 6N-Al at εeq = 0.02, 0.05, and 0.10 (b).
Metals 10 00751 g004
Figure 5. Montage of TEM micrographs showing a representative example of a progressive evolution from Tangled dislocations (TDs) to LABs (cell boundaries) and then to HABs (grain boundaries); 6N-Al at εeq = 0.10.
Metals 10 00751 g005
Table 1. Equivalent strain εeq obtained by the different HPT experimental parameters for Oxygen-Free High Conductivity (OFHC) Cu and 6N-Al; εeq calculated by rotation angle, θ°, number of turns, N, distance to disc center, r (mm) using Equation (2).
OFHC Cuεeq = 0.40
20; 1/18; 2;
εeq = 0.91
45; 1/8; 2;
εeq = 1.21
60; 1/6; 2;
6N-Alεeq = 0.02
5; 1/120; 0.3;
εeq = 0.05
15; 1/45; 0.3;
εeq = 0.10
15; 1/45; 0.6;
Table 2. Tangled dislocation density, ρTD, calculated by quantitative TEM analysis at the different HPT strain levels for OFHC Cu and 6N-Al.
OFHC Cuεeq
ρTD, 1014 m−2
0.40
3.50 ± 0.30
0.91
1.30 ± 0.20
1.21
0.90 ± 0.20
6N-Alεeq
ρTD, 1014 m−2
0.02
0.03 ± 0.01
0.05
1.80 ± 0.20
0.10
0.60 ± 0.10
Table 3. Nanoindentation hardness, H, of OFHC Cu and 6N-Al at the different experimental HPT conditions. The mean cell and grain size of OFHC Cu are also reported.
OFHC Cuεeq0.400.911.21
H, MPa780 ± 60980 ± 601060 ± 60
dg, µm19 ± 114.5 ± 0.510.6 ± 0.5
dcell, nm1100 ± 100760 ± 50540 ± 50
6N-Alεeq0.020.050.10
H, MPa75 ± 5170 ± 10210 ± 10
Table 4. Dislocation density and dislocation wall volume fraction, f, for OFHC Cu at εeq = 0.40, 0.91, and 1.21; Tangled dislocation density, ρTD, for 6N-Al at εeq = 0.02, 0.05, and 0.10.
MaterialDislocation Data Measured by TEMεeq = 0.40εeq = 0.91εeq = 1.21
OFHC Cuρwall, 1012 m−2105 ± 10130 ± 20165 ± 20
f (wall), 10−2467
ρTD, 1012 m−225 ± 535 ± 540 ± 5
ρGND, 1012 m−295 ± 5110 ± 5120 ± 10
-εeq = 0.02εeq = 0.05εeq = 0.10
6N-AlρTD, 1012 m−23 ± 1180 ± 2060 ± 10
Table 5. Yield stress, σy, as calculated according to Equation (6) for OFHC Cu, and individual microstructure contributions (σTD, σVLAB+LAB, and σHAB) as determined by Equations (13) and (14) for 6N-Al. The yield stress as determined by the nanoindentation hardness measurements, H, using χ = 3.5 as multiplicative factor are reported for comparison. σymodel refers to the microstructure model, σynanoind refers to the values determined from the nanoindentation measurements.
MaterialYield Stress, MPaεeq = 0.40εeq = 0.91εeq = 1.21
OFHC Cuσymodel, MPa217237256
σynanoind, MPa223280303
εeq = 0.02εeq = 0.05εeq = 0.10
6N-AlσTD, MPa92215
σVLAB+LAB, MPa-514
σHAB, MPa--11
σymodel, MPa193750
σynanoind, MPa214960