Validation Study on the Statistical Size Effect in Cast Aluminium


Abstract
1. Introduction
- The influence of disconnected highly-stressed volumes as statistical size effect based on accumulated highly-stressed volumes.
- The impact of the highly-stressed volume on the defect distribution and its associated parameters is verified for samples with not-yet investigated casting process conditions. This enhances the existing database and strengthens the a priori established model framework of probabilistic fatigue strength design.
- The effect of the element size during numerical evaluation of the highly-stressed volume is studied and supports recommendations for engineering applicability.
- The work validates the prior developed statistical size effect approach which depends not only on the return period of the highly-stressed volume but takes also the defect distribution of the fractograpic analysis and the material resistance as probabilistic values into account.
2. Investigated Alloy
3. Experimental Results
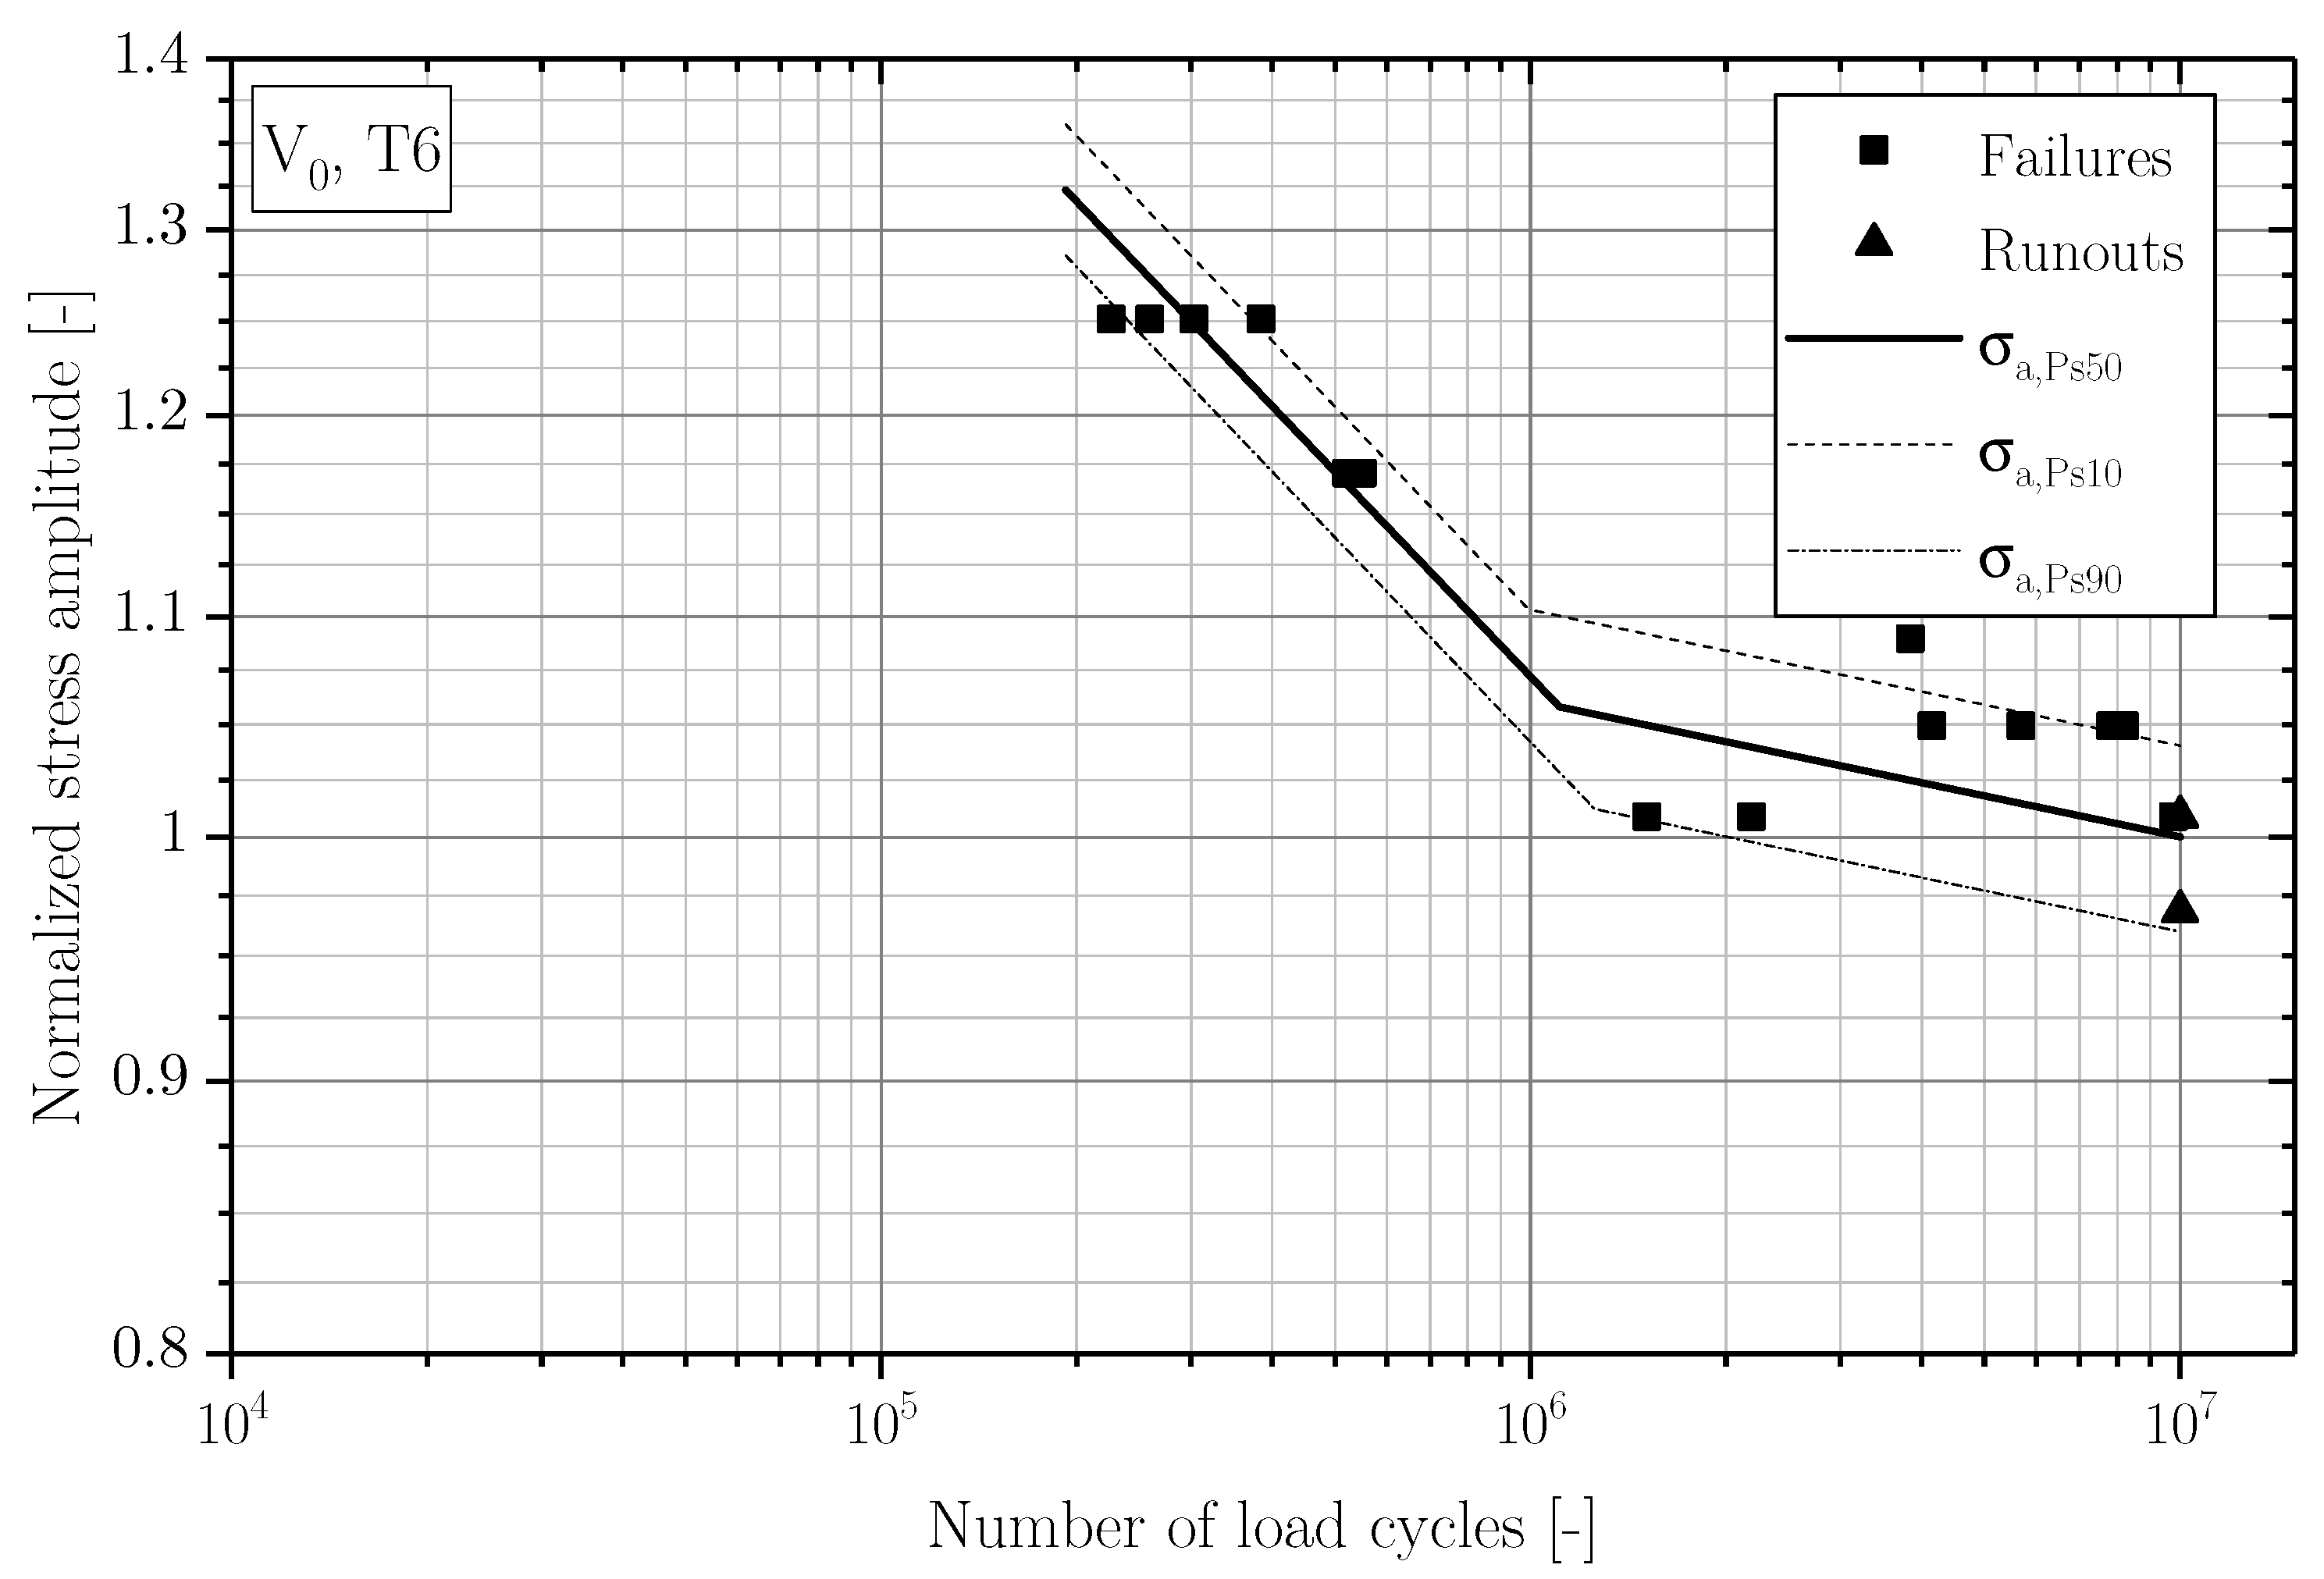
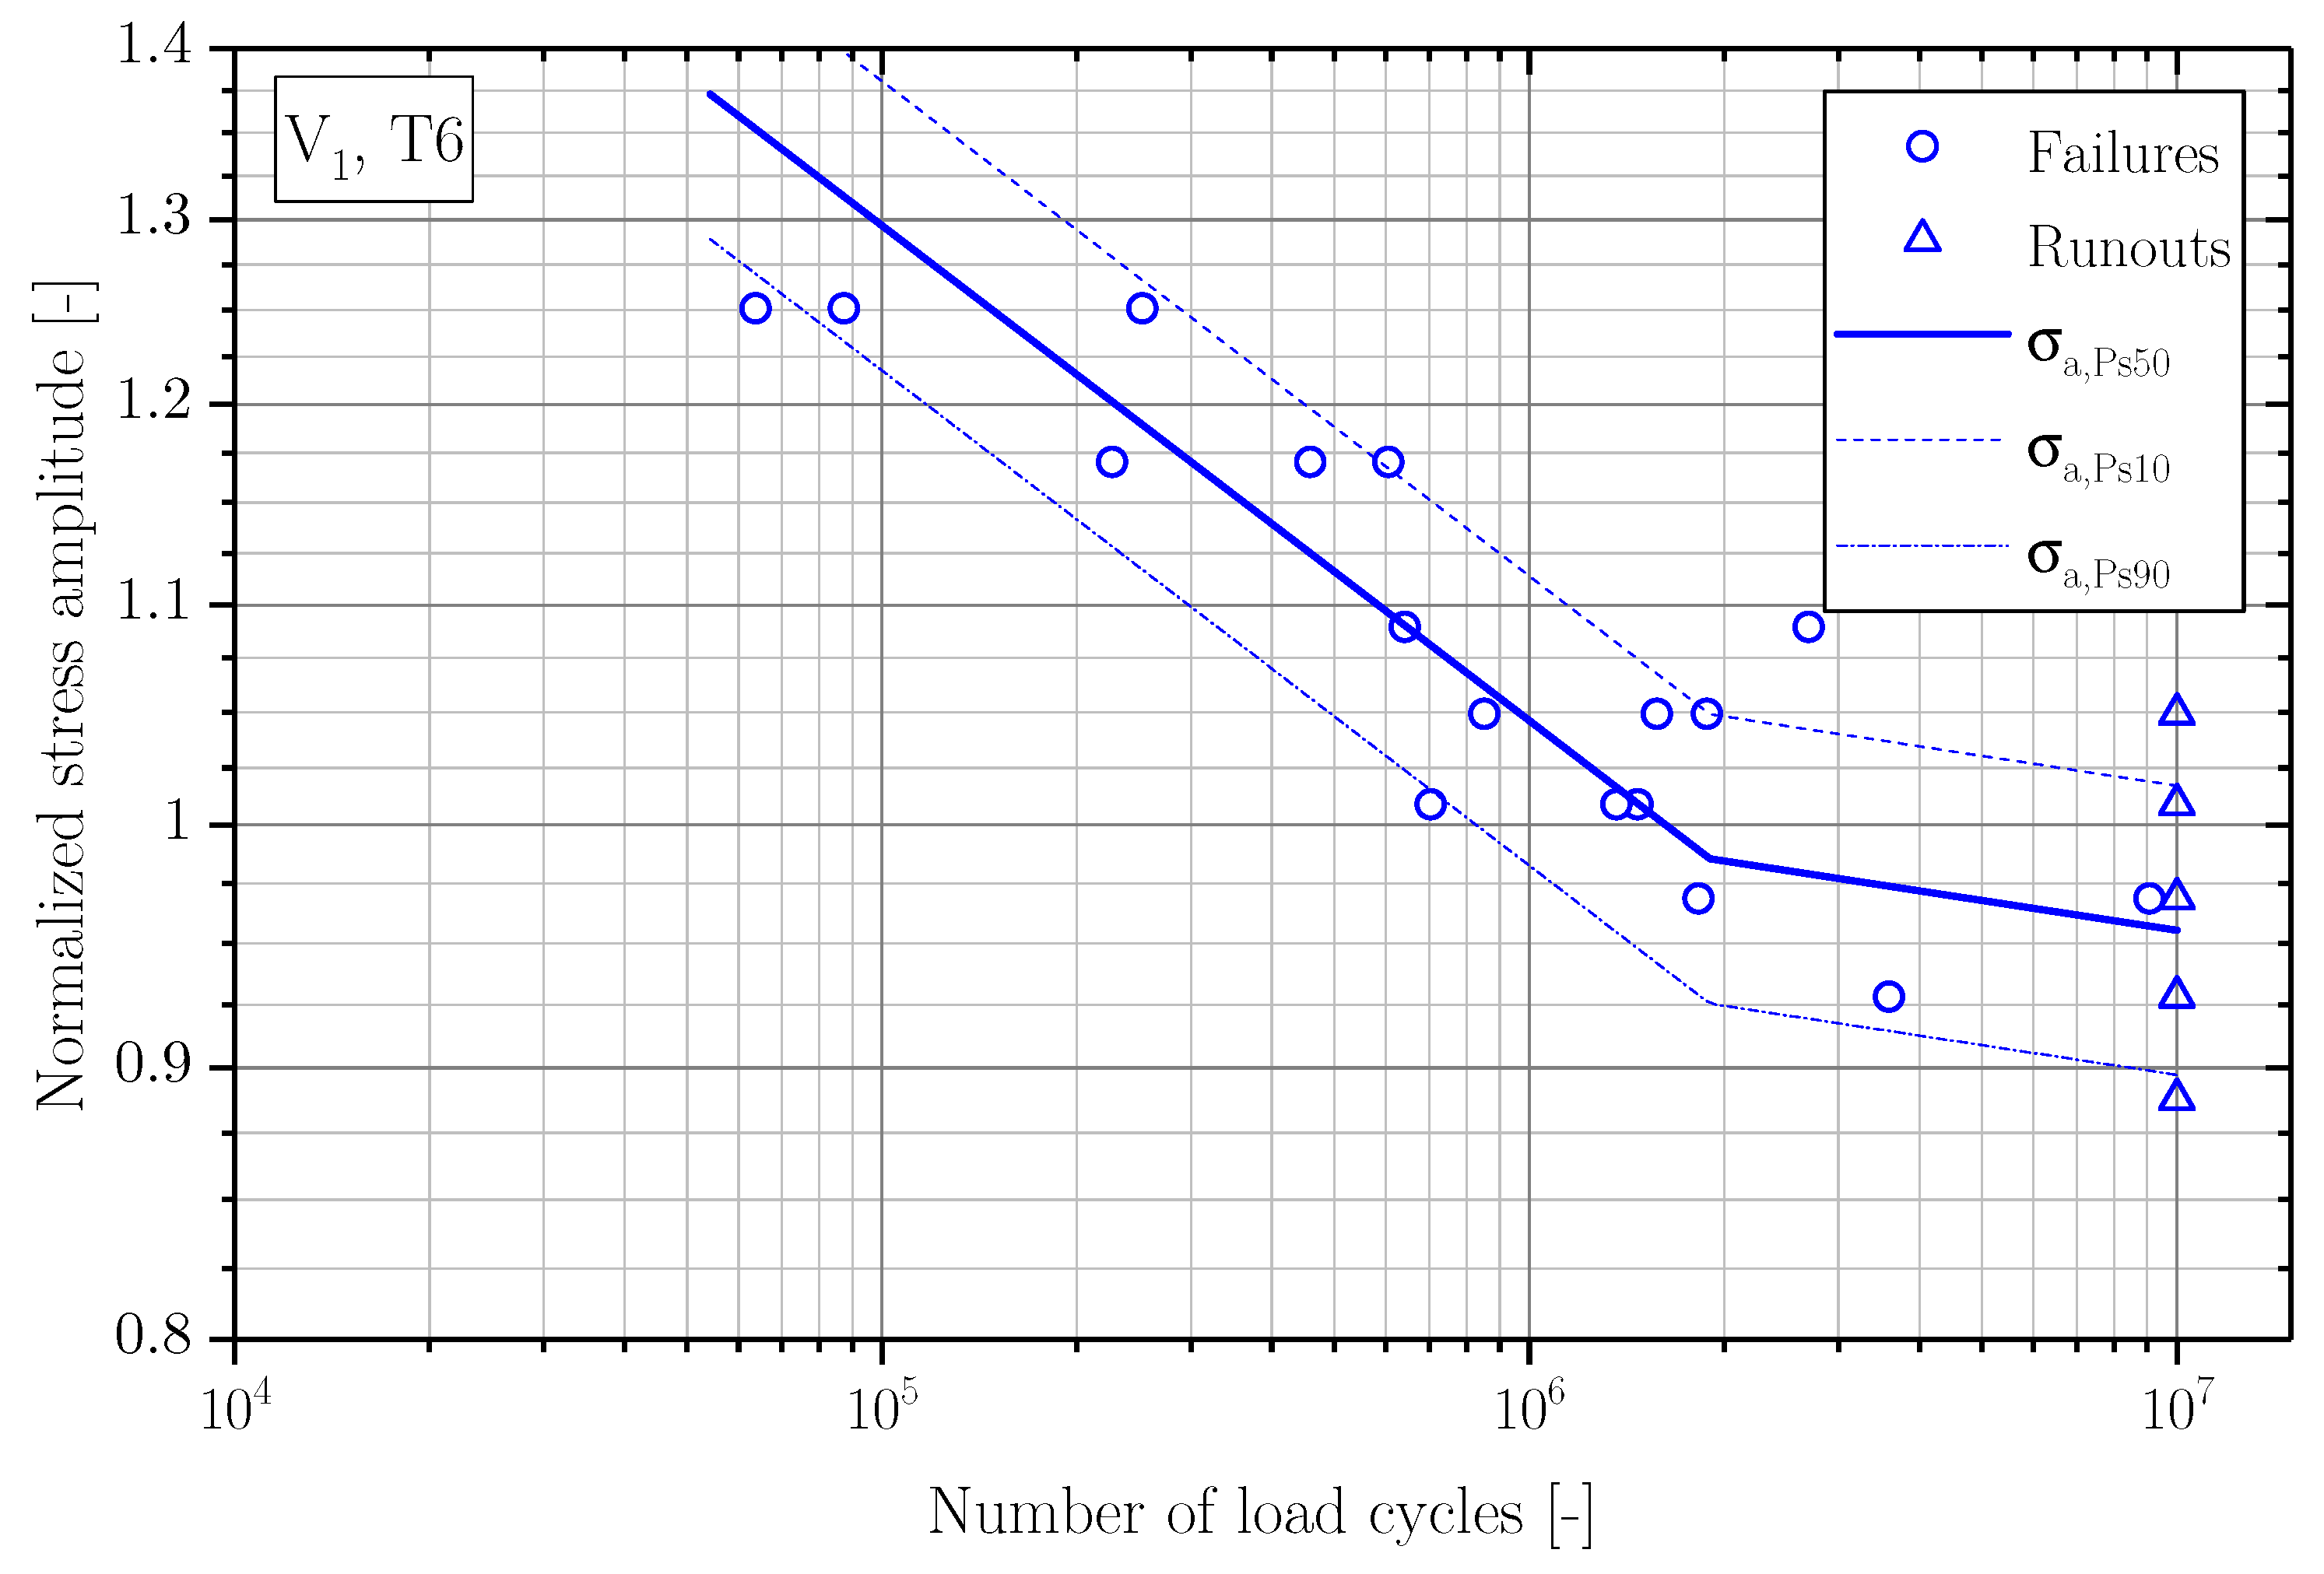
3.1. Fatigue Strength
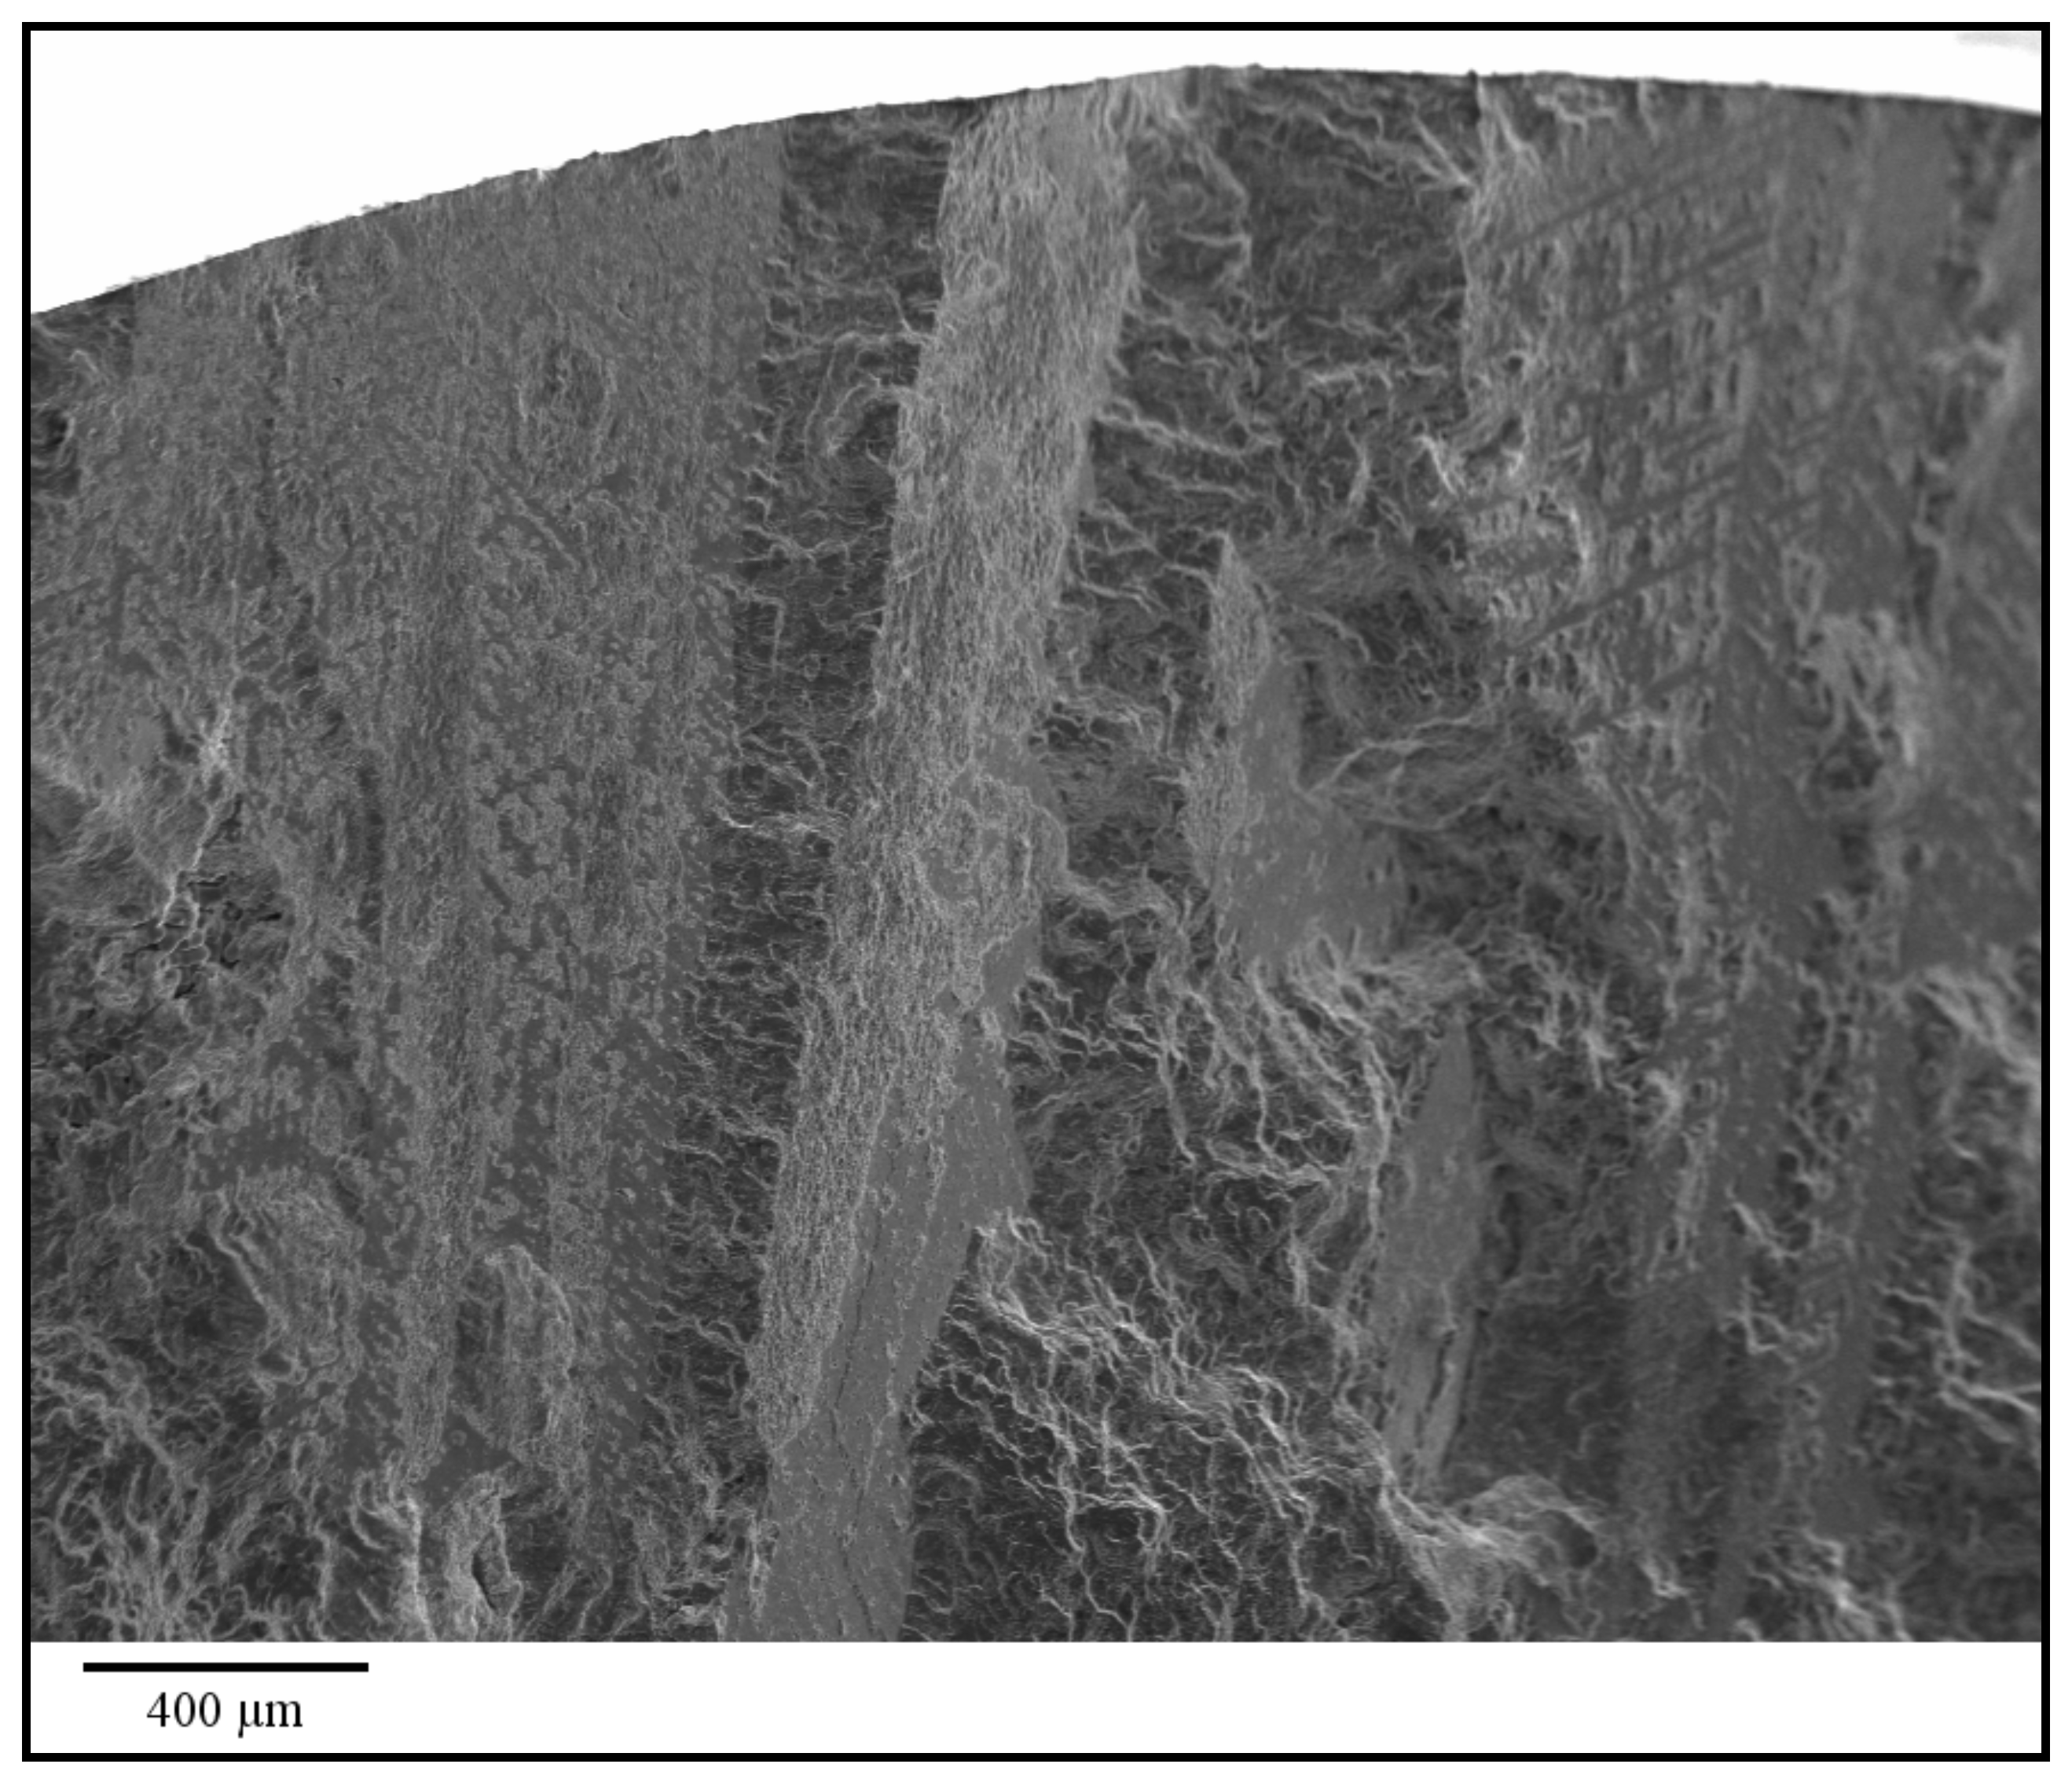
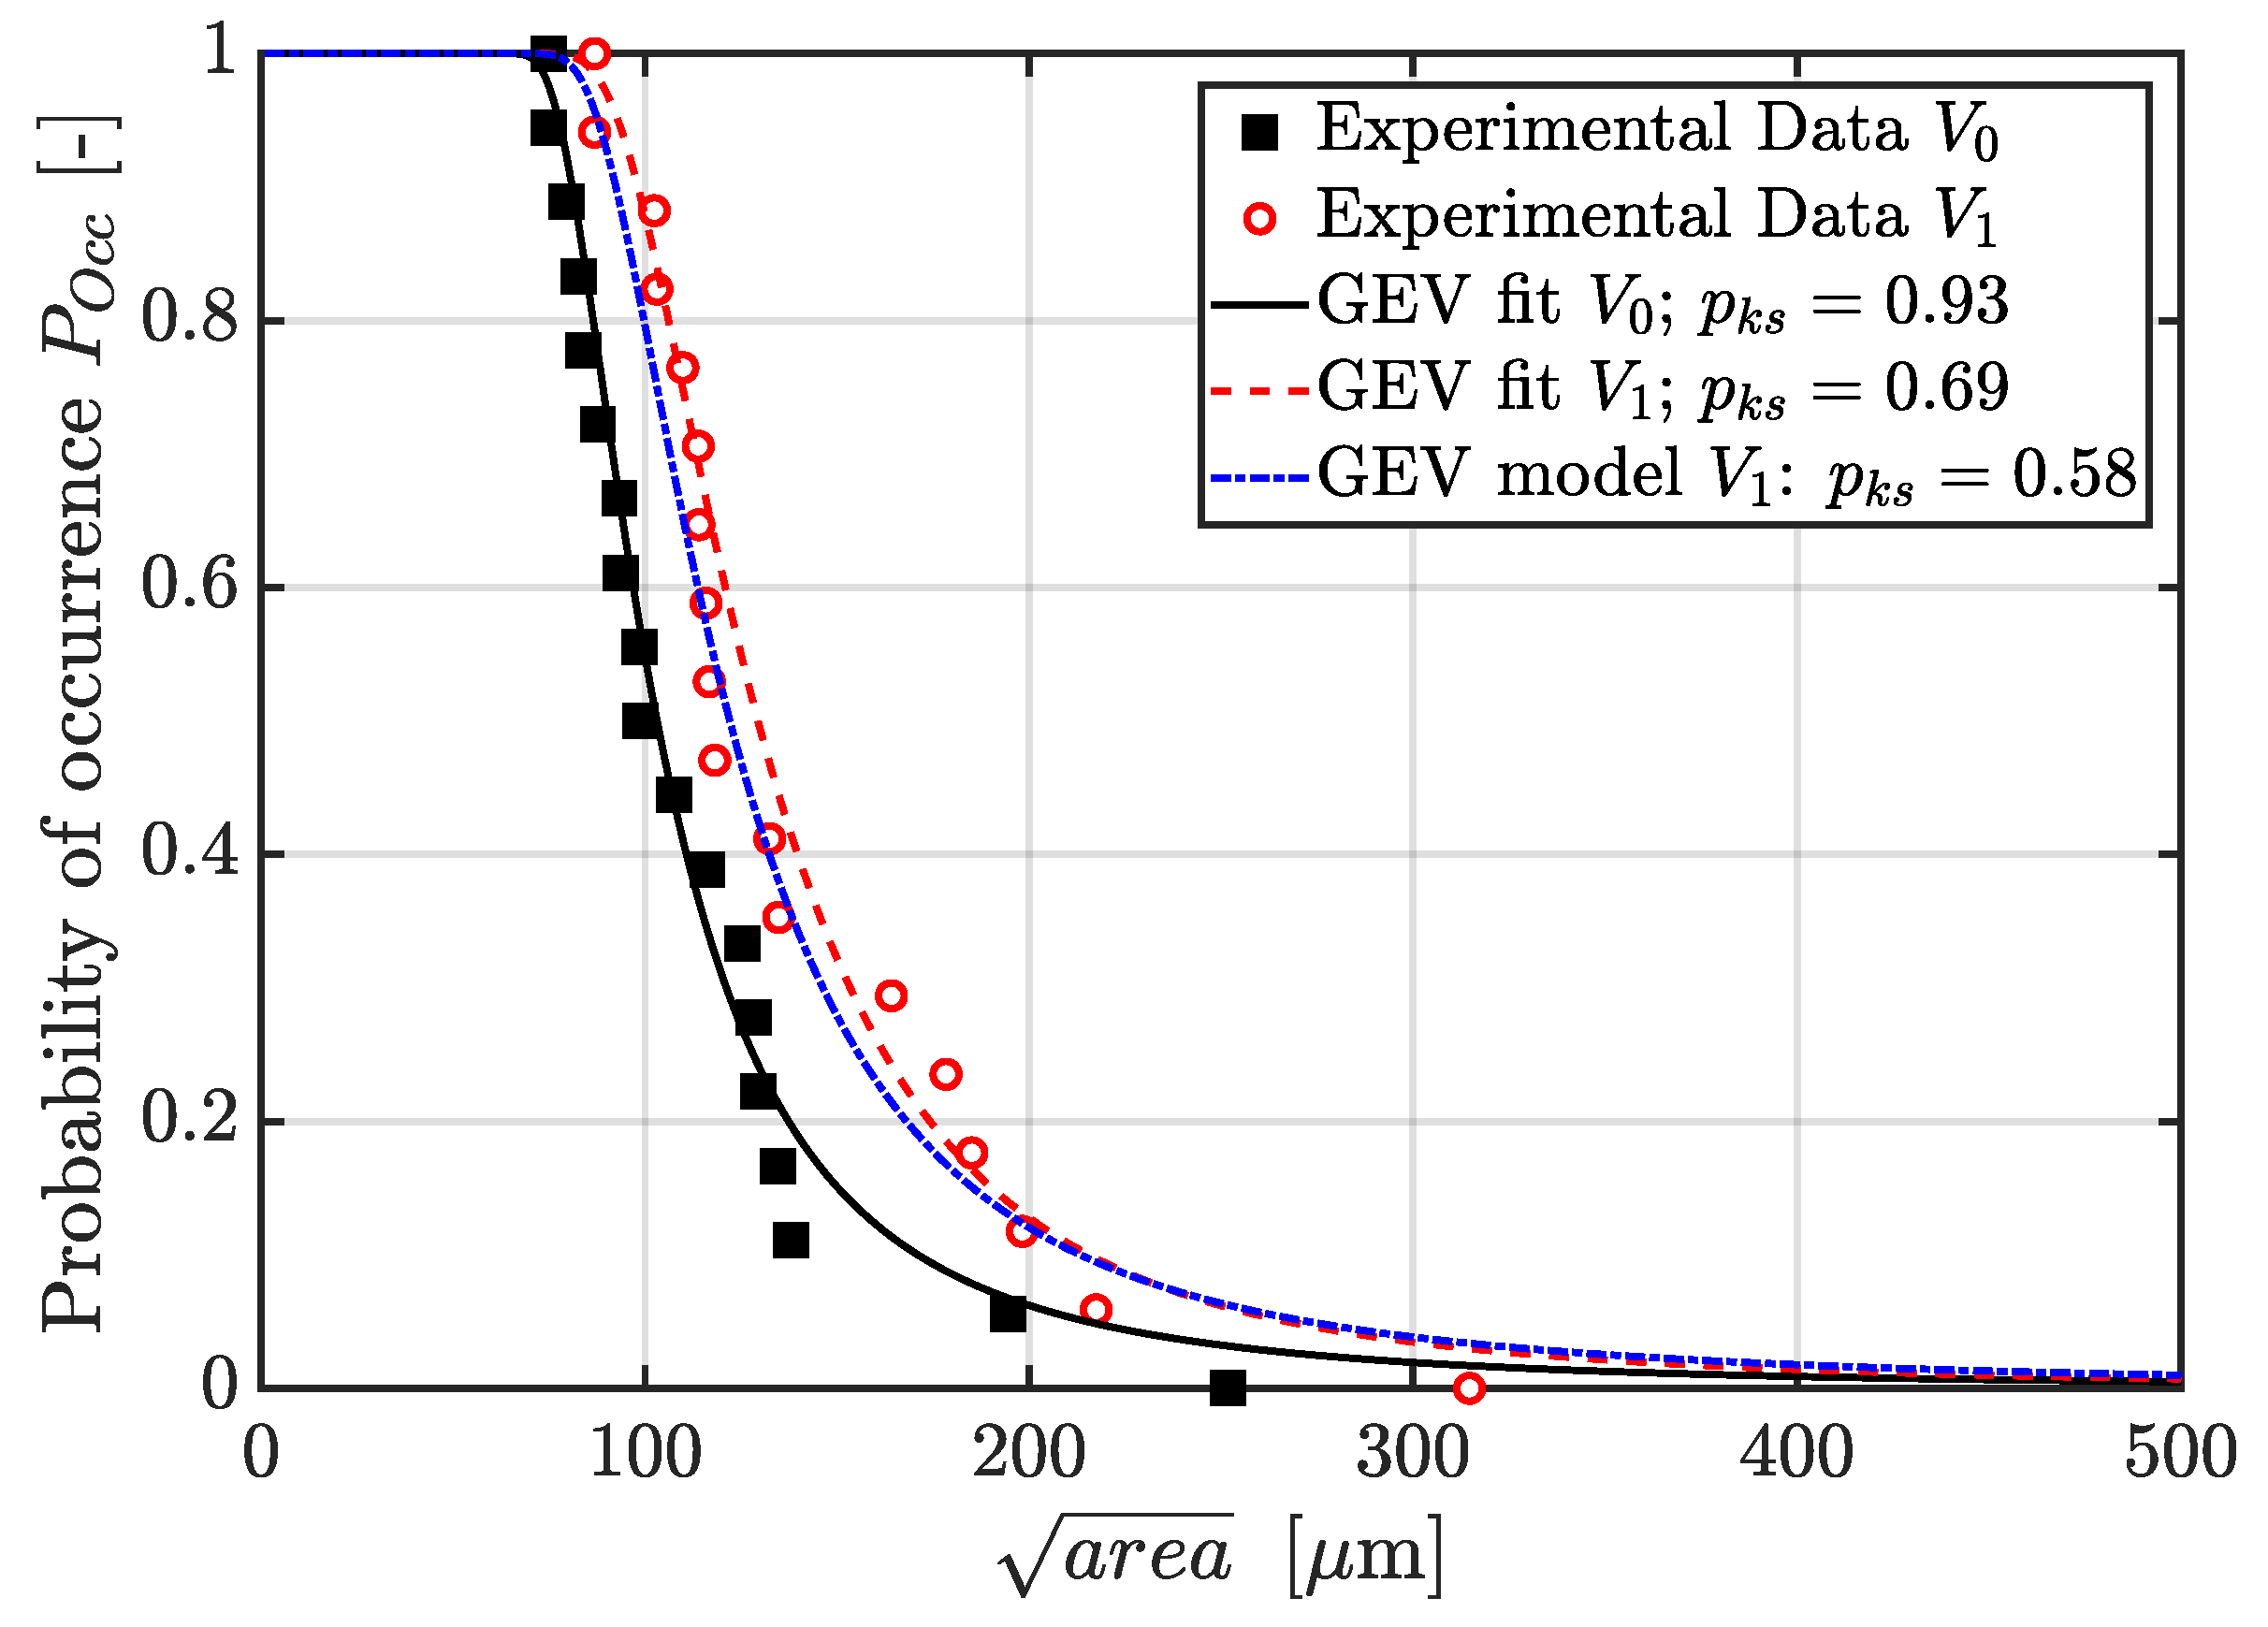
3.2. Fractography
4. Verification of Size-Effect Related Fatigue Strength
5. Conclusions
- Based on a numerical parameter study, a deviation factor of about 0.03 is recommendable for numerical evaluation of the highly-stressed volume (HSV) in engineering applications.
- If several independent HSVs with the same microstructural properties are attached as one component and loaded simultaneously, the failure of each HSV leads to failure of the whole component. Hence, the aggregated sum of disconnected HSVs has to be considered as size effect in fatigue strength design. But in the case of varying microstructures between the individual highly-stressed volumes, the local microstructure has to be considered as well.
- The conducted validation of the aforesaid defect based probabilistic fatigue assessment model, originally published in Reference [3], is based on samples with a return period of about two. The results confirm that the model assesses the fatigue strength in terms of statistical size effect best by applying the local Weibull factor depending on the return period and defect population . Thus, the verified probabilistic approach is recommendable for engineering design of complex parts, whereat the HSV has to be linked to the local microstructural properties for proper fatigue strength design.
Author Contributions
Funding
Acknowledgments
Conflicts of Interest
Abbreviations
| Defect size of Murakami’s approach | |
| Return period of the highly-stressed volume | |
| Weibull factor | |
| Long life fatigue strength | |
| Long life fatigue strength of the reference volume | |
| Long life fatigue strength of the -times enlarged volume | |
| Estimated long life fatigue strength with 50% probability of survival | |
| Experimental long life fatigue strength at position * with 50% probability of survival | |
| Deviation of model to experiment | |
| Fatigue range of near defect free material | |
| Scale parameter of the GEV distribution | |
| Scale parameter of the GEV distribution for the reference volume | |
| Scale parameter of the GEV distribution for the -times enlarged volume | |
| Location parameter of the GEV distribution | |
| Location parameter of the GEV distribution for the reference volume | |
| Location parameter of the GEV distribution for the -times enlarged volume | |
| Shape parameter of the GEV distribution | |
| Shape parameter of the GEV distribution for the -times enlarged volume | |
| Weighting factor for crack closure effect i | |
| Crack elongation, where the crack closure effect is completely build-up | |
| Long crack threshold range | |
| Crack threshold range in respect to the crack extension | |
| Effective crack threshold range | |
| Effective stress intensity factor range | |
| Maximum stress intensity factor | |
| Opening stress intensity factor | |
| Crack extension | |
| a | Crack length |
| Intrinsic crack length | |
| Crack length at the transition to long crack behaviour | |
| Crack length of the reference volume for a probability of occurrence of 50% | |
| Crack length of the reference volume for a probability of occurrence of 50% | |
| h | Segment height of a circle |
| L | Chord length of the segment |
| n | Number of elements on circumference |
| P | Probability |
| Probability of occurrence | |
| Probability of survival | |
| Defect distribution of -times enlarged volume | |
| , | Highly stressed volume of specimen A and B |
| , | 90% highly stressed volume of specimen A () and B () |
| Threshold volume | |
| -times enlarged highly stressed volume | |
| p-value of the Kolmogorov-Smirnov test | |
| Y | Geometry factor |
| Inverse slope of the S/N-curve in finite life region | |
| Inverse slope of the S/N-curve in long life region | |
| Fatigue scatter band of the S/N-curve | |
| Transition knee point of the S/N-curve | |
| R | Load ratio |
| R-curve | Cyclic crack resistance curve |
| HSV | Highly stressed volume |
| SDAS | Secondary dendrite arm spacing |
| GEV | Generalized extreme value distribution |
| CDF | Cumulative distribution function |
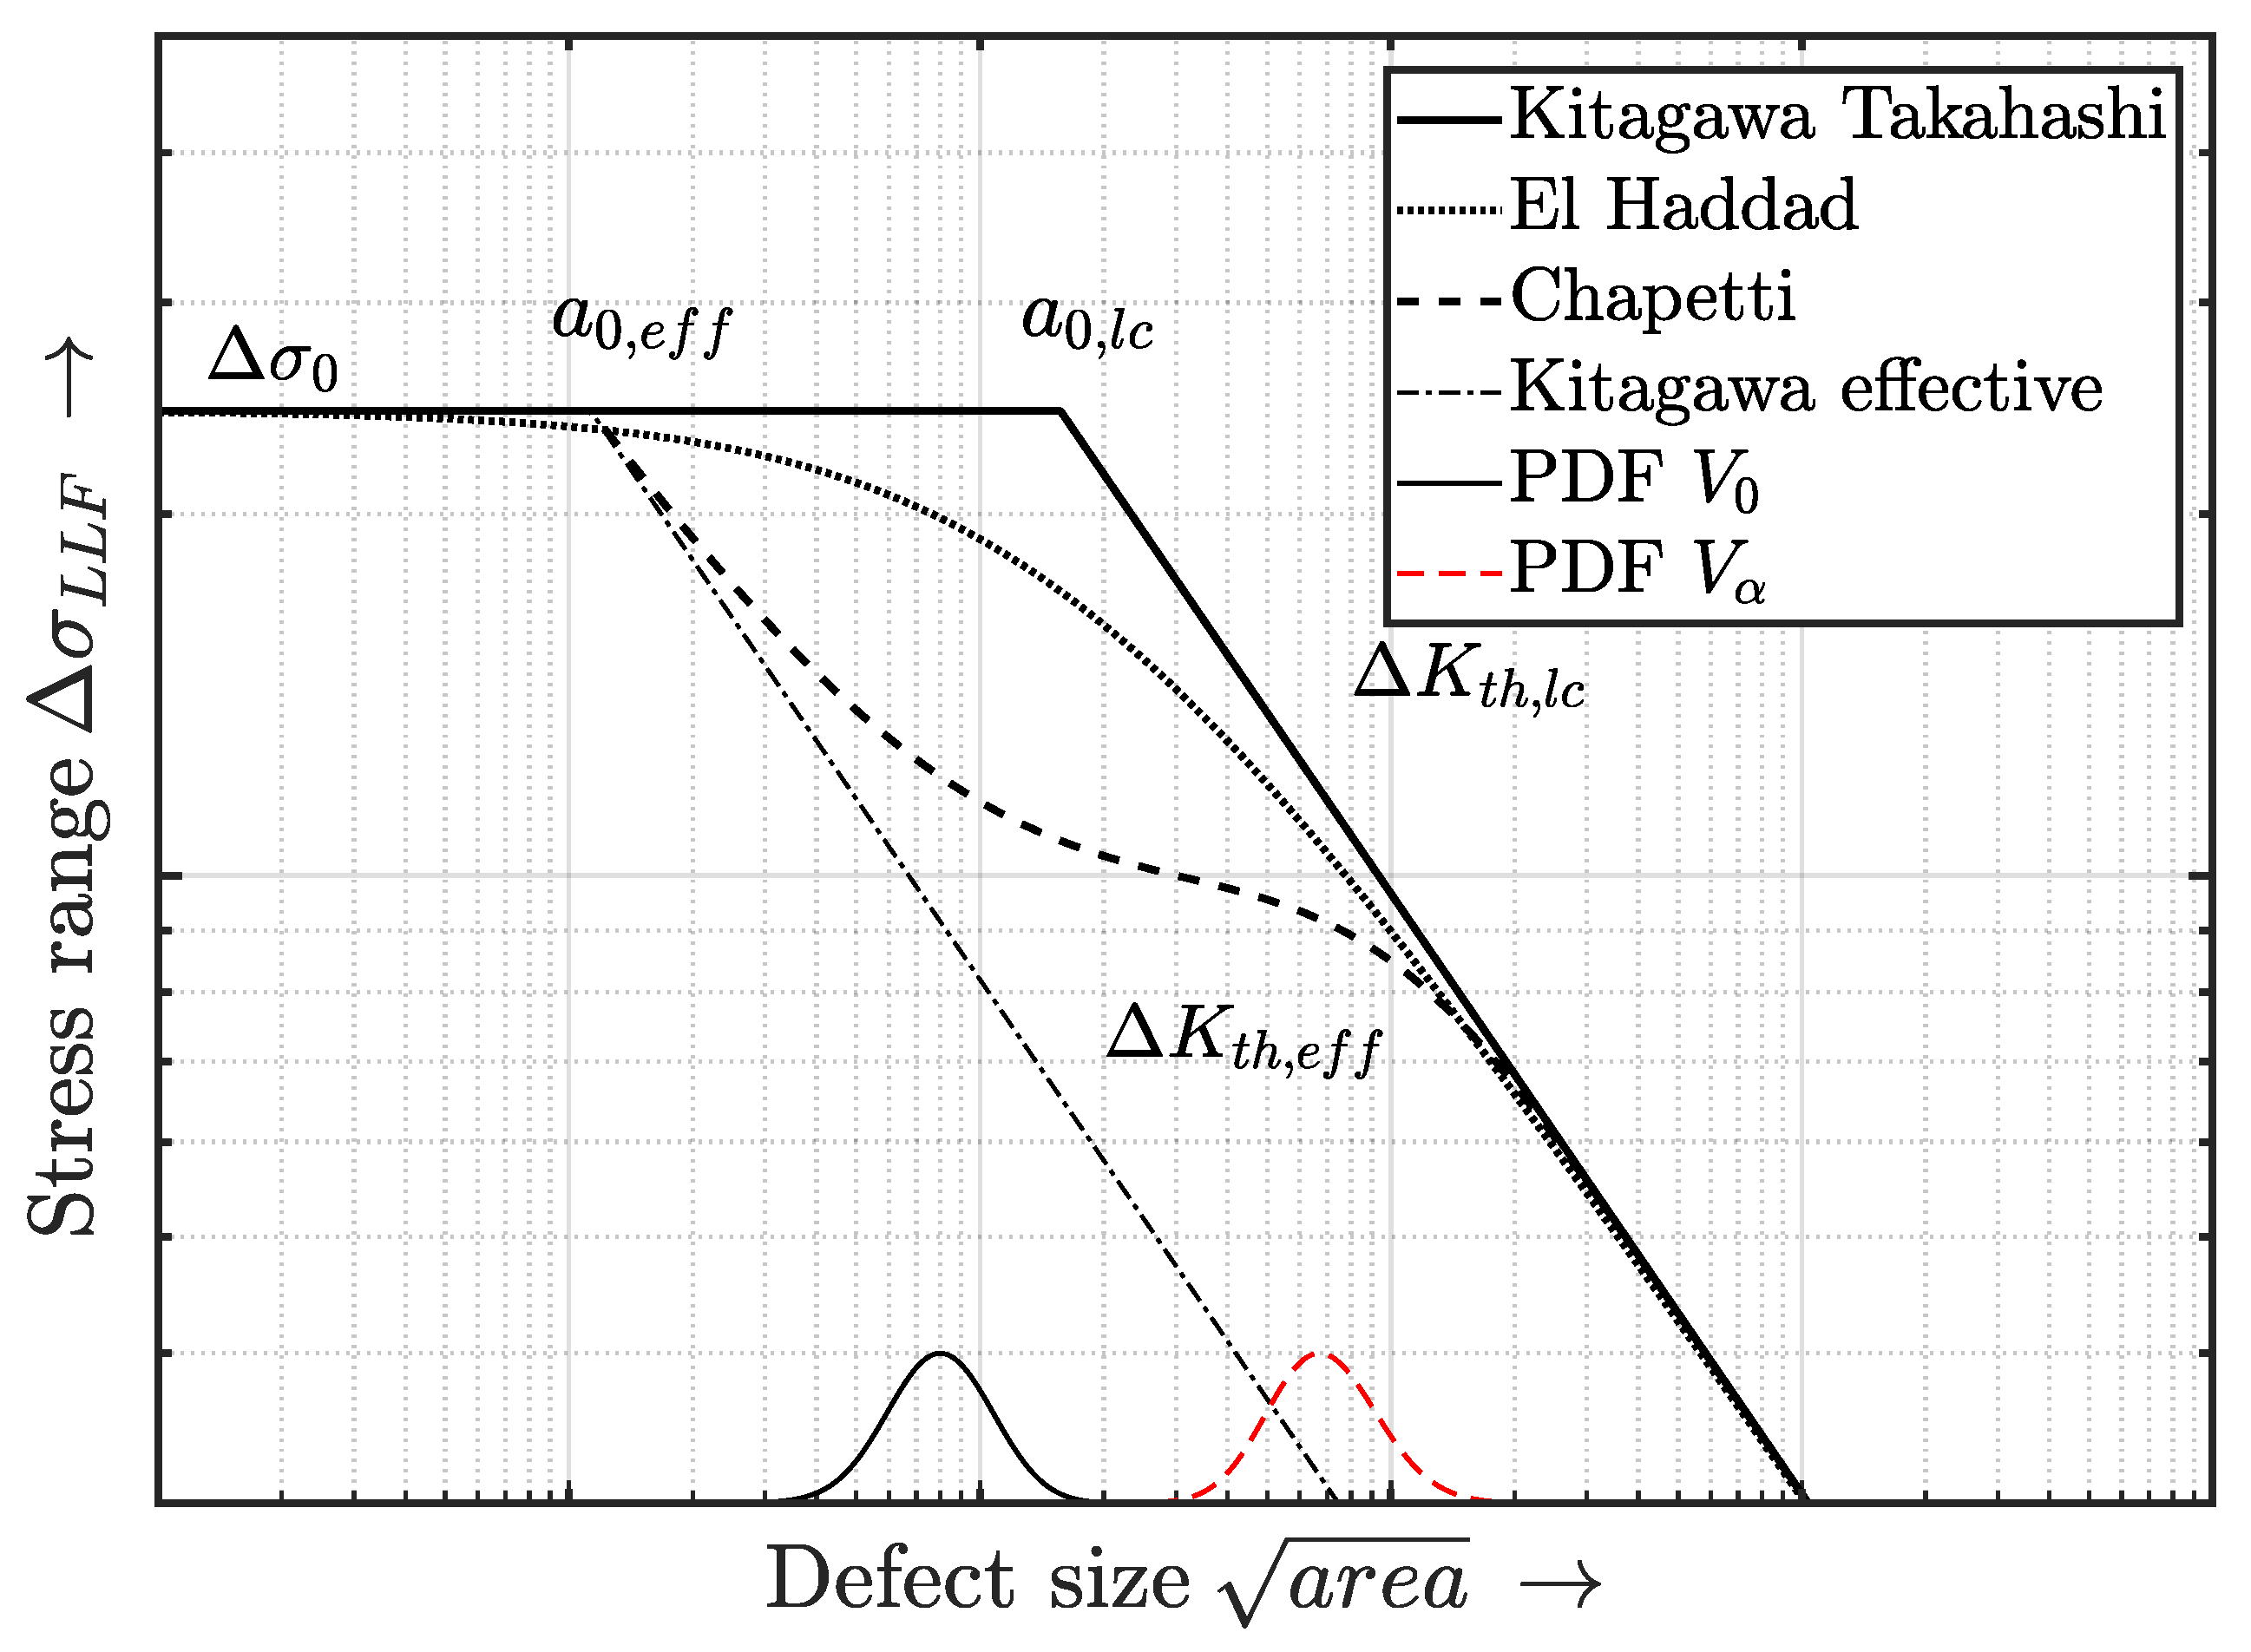
| KTD | Kitagawa Takahashi diagram |
| ECD | Equivalent circle diameter |
| FE | Finite element |
| HCF | High cycle fatigue |
| HIP | Hot isostatic pressing |
Appendix A. Fatigue Failure Hypothesis

References
- Hertel, O.; Vormwald, M. Statistical and geometrical size effects in notched members based on weakest-link and short-crack modelling. Eng. Fract. Mech. 2012, 95, 72–83. [Google Scholar] [CrossRef]
- Tomaszewski, T.; Sempruch, J. Size effect in high-cycle fatigue. J. Mach. Constr. Maint. Probl. Eksploat. 2017, 1, 29–35. [Google Scholar]
- Aigner, R.; Pomberger, S.; Leitner, M.; Stoschka, M. On the Statistical Size Effect of Cast Aluminium. Materials 2019, 12, 1578. [Google Scholar] [CrossRef]
- Aigner, R.; Pusterhofer, S.; Pomberger, S.; Leitner, M.; Stoschka, M. A probabilistic Kitagawa-Takahashi diagram for fatigue strength assessment of cast aluminium alloys. Mater. Sci. Eng. A 2019, 745, 326–334. [Google Scholar] [CrossRef]
- Aigner, R.; Leitner, M.; Stoschka, M. Fatigue strength characterization of Al-Si cast material incorporating statistical size effect. In Proceedings of the MATEC Web Conference, Poitiers, France, 27 May–1 June 2018; Volume 165, p. 14002. [Google Scholar] [CrossRef]
- Yi, J.Z.; Gao, Y.X.; Lee, P.D.; Lindley, T.C. Microstructure-based fatigue life prediction for cast A356-T6 aluminum-silicon alloys. Metall. Mater. Trans. B 2006, 37, 301–311. [Google Scholar] [CrossRef]
- Iben Houria, M.; Nadot, Y.; Fathallah, R.; Roy, M.; Maijer, D.M. Influence of casting defect and SDAS on the multiaxial fatigue behaviour of A356-T6 alloy including mean stress effect. Int. J. Fatigue 2015, 80, 90–102. [Google Scholar] [CrossRef]
- Stroppe, H. Calculation of the S-N curve for cast aluminium alloys based on static tensile test and dendrite arm spacing: Berechnung der Wöhler–Linie für Aluminium–Gusslegierungen aus dem statischen Zugversuch und dem Dendritenarmabstand. Mater. Werkst. 2009, 40, 738–742. [Google Scholar] [CrossRef]
- Brueckner-Foit, A.; Luetje, M.; Wicke, M.; Bacaicoa, I.; Geisert, A.; Fehlbier, M. On the role of internal defects in the fatigue damage process of a cast Al-Si-Cu alloy. Int. J. Fatigue 2018, 116, 562–571. [Google Scholar] [CrossRef]
- Brueckner-Foit, A.; Luetje, M.; Bacaicoa, I.; Geisert, A.; Fehlbier, M. On the role of internal defects in the fatigue damage process of a cast Al-Si-Cu alloy. Procedia Struct. Integr. 2017, 7, 36–43. [Google Scholar] [CrossRef]
- Atxaga, G.; Pelayo, A.; Irisarri, A.M. Effect of microstructure on fatigue behaviour of cast Al–7Si–Mg alloy. Mater. Sci. Technol. 2013, 17, 446–450. [Google Scholar] [CrossRef]
- Tiryakioğlu, M. On the size distribution of fracture-initiating defects in Al- and Mg-alloy castings. Mater. Sci. Eng. A 2008, 476, 174–177. [Google Scholar] [CrossRef]
- Tiryakioğlu, M. Statistical distributions for the size of fatigue-initiating defects in Al–7%Si–0.3%Mg alloy castings: A comparative study. Mater. Sci. Eng. A 2008, 497, 119–125. [Google Scholar] [CrossRef]
- Anderson, K.V.; Daniewicz, S.R. Statistical analysis of the influence of defects on fatigue life using a Gumbel distribution. Int. J. Fatigue 2018, 112, 78–83. [Google Scholar] [CrossRef]
- Kuguel, R. A relation between theoretical stress concentration factor and fatigue notch factor deduced from the concept of highly stressed volume. Proc. ASTM 1961, 61, 732–748. [Google Scholar]
- Sonsino, C.M. Zur Bewertung des Schwingfestigkeitsverhaltens von Bauteilen mit Hilfe örtlicher Beanspruchungen. Konstruktion 1993, 45, 25–33. [Google Scholar]
- Diemar, A.; Thumser, R.; Bergmann, J.W. Statistischer Größeneinfluss und Bauteilfestigkeit. Mater. Test. 2004, 46, 16–21. [Google Scholar]
- Böhm, J.; Heckel, K. Die Vorhersage der Dauerschwingfestigkeit unter Berücksichtigung des statistischen Größeneinflusses. Mater. Werkst. 1982, 13, 120–128. [Google Scholar] [CrossRef]
- Kuwazuru, O.; Murata, Y.; Hangai, Y.; Utsunomiya, T.; Kithara, S.; Yoshikawa, N. X-Ray CT Inspection for Porosities and Its Effect on Fatigue of Die Cast Aluminium Alloy. J. Solid Mech. Mater. Eng. 2008, 2, 1220–1231. [Google Scholar] [CrossRef]
- Rotella, A.; Nadot, Y.; Piellard, M.; Augustin, R.; Fleuriot, M. Fatigue limit of a cast Al-Si-Mg alloy (A357-T6) with natural casting shrinkages using ASTM standard X-ray inspection. Int. J. Fatigue 2018, 114, 177–188. [Google Scholar] [CrossRef]
- González, R.; González, A.; Talamantes-Silva, J.; Valtierra, S.; Mercado-Solís, R.D.; Garza-Montes-de Oca, N.F.; Colás, R. Fatigue of an aluminium cast alloy used in the manufacture of automotive engine blocks. Int. J. Fatigue 2013, 54, 118–126. [Google Scholar] [CrossRef]
- González, R.; Martínez, D.I.; González, J.A.; Talamantes, J.; Valtierra, S.; Colás, R. Experimental investigation for fatigue strength of a cast aluminium alloy. Int. J. Fatigue 2011, 33, 273–278. [Google Scholar] [CrossRef]
- Rechnerischer Festigkeitsnachweis für Maschinenbauteile aus Stahl, Eisenguss- und Aluminiumwerkstoffen, 6th ed.; FKM-Richtlinie, VDMA-Verl.: Frankfurt am Main, Germany, 2012; Volume 6.
- Sonsino, C.M.; Ziese, J. Fatigue strength and applications of cast aluminium alloys with different degrees of porosity. Int. J. Fatigue 1993, 15, 75–84. [Google Scholar] [CrossRef]
- Weibull, W. Zur Abhängigkeit der Festigkeit von der Probengröße. Ingenieur-Archiv 1959, 28, 360–362. [Google Scholar] [CrossRef]
- Gänser, H.P. Some notes on gradient, volumetric and weakest link concepts in fatigue. Comput. Mater. Sci. 2008, 44, 230–239. [Google Scholar] [CrossRef]
- Abroug, F.; Pessard, E.; Germain, G.; Morel, F.; Hénaff, G. Fatigue size effect due to defects in an AA7050 alloy. In Proceedings of the MATEC Web Conference, Poitiers, France, 27 May–1 June 2018; Volume 165, p. 14015. [Google Scholar] [CrossRef]
- Abroug, F.; Pessard, E.; Germain, G.; Morel, F. A probabilistic approach to study the effect of machined surface states on HCF behavior of a AA7050 alloy. Int. J. Fatigue 2018, 116, 473–489. [Google Scholar] [CrossRef]
- Kitagawa, H.; Takahashi, S. Applicability of fracture mechanics to very small cracks or the cracks in the early stage. In Proceedings of the Second International Conference on Mechanical Behavior of Materials, Boston, MA, USA, 16–20 August 1976; pp. 627–631. [Google Scholar]
- Garb, C.; Leitner, M.; Stauder, B.; Schnubel, D.; Grün, F. Application of modified Kitagawa-Takahashi diagram for fatigue strength assessment of cast Al-Si-Cu alloys. Int. J. Fatigue 2018. [Google Scholar] [CrossRef]
- Tenkamp, J.; Koch, A.; Knorre, S.; Krupp, U.; Michels, W.; Walther, F. Defect-correlated fatigue assessment of A356-T6 aluminum cast alloy using computed tomography based Kitagawa-Takahashi diagrams. Int. J. Fatigue 2018, 108, 25–34. [Google Scholar] [CrossRef]
- Roy, M.J.; Nadot, Y.; Nadot-Martin, C.; Bardin, P.G.; Maijer, D.M. Multiaxial Kitagawa analysis of A356-T6. Int. J. Fatigue 2011, 33, 823–832. [Google Scholar] [CrossRef]
- Beretta, S.; Romano, S. A comparison of fatigue strength sensitivity to defects for materials manufactured by AM or traditional processes. Int. J. Fatigue 2017, 94, 178–191. [Google Scholar] [CrossRef]
- Benedetti, M.; Santus, C. Building the Kitagawa-Takahashi diagram of flawed materials and components using an optimized V-notched cylindrical specimen. Eng. Fract. Mech. 2020, 224, 106810. [Google Scholar] [CrossRef]
- Patriarca, L.; Beretta, S.; Foletti, S.; Riva, A.; Parodi, S. A probabilistic framework to define the design stress and acceptable defects under combined-cycle fatigue conditions. Eng. Fract. Mech. 2020, 224, 106784. [Google Scholar] [CrossRef]
- Poulin, J.R.; Kreitcberg, A.; Terriault, P.; Brailovski, V. Fatigue strength prediction of laser powder bed fusion processed Inconel 625 specimens with intentionally-seeded porosity: Feasibility study. Int. J. Fatigue 2020, 132, 105394. [Google Scholar] [CrossRef]
- Radaj, D. Geometry correction for stress intesity at elliptical cracks. Weld. Cut. 1977, 29, 198–402. [Google Scholar]
- El Haddad, M.H.; Smith, K.N.; Topper, T.H. Fatigue Crack Propagation of Short Cracks. J. Eng. Mater. Technol. 1979, 101, 42. [Google Scholar] [CrossRef]
- El Haddad, M.H.; Topper, T.H.; Smith, K.N. Prediction of non propagating cracks. Eng. Fract. Mech. 1979, 11, 573–584. [Google Scholar] [CrossRef]
- Chapetti, M.D. Fatigue propagation threshold of short cracks under constant amplitude loading. Int. J. Fatigue 2003, 25, 1319–1326. [Google Scholar] [CrossRef]
- Maierhofer, J.; Pippan, R.; Gänser, H.P. Modified NASGRO equation for physically short cracks. Int. J. Fatigue 2014, 59, 200–207. [Google Scholar] [CrossRef]
- Zerbst, U.; Vormwald, M.; Pippan, R.; Gänser, H.P.; Sarrazin-Baudoux, C.; Madia, M. About the fatigue crack propagation threshold of metals as a design criterion—A review. Eng. Fract. Mech. 2016, 153, 190–243. [Google Scholar] [CrossRef]
- Pippan, R.; Hohenwarter, A. Fatigue crack closure: A review of the physical phenomena. Fatigue Fract. Eng. Mater. Struct. 2017, 40, 471–495. [Google Scholar] [CrossRef]
- Suresh, S.; Ritchie, R.O. A geometric model for fatigue crack closure induced by fracture surface roughness. Metall. Trans. A 1982, 13, 1627–1631. [Google Scholar] [CrossRef]
- Wasén, J.; Heier, E. Fatigue crack growth thresholds—The influence of Young’s modulus and fracture surface roughness. Int. J. Fatigue 1998, 20, 737–742. [Google Scholar] [CrossRef]
- Kim, J.H.; Lee, S.B. Behavior of plasticity-induced crack closure and roughness-induced crack closure in aluminum alloy. Int. J. Fatigue 2001, 23, 247–251. [Google Scholar] [CrossRef]
- Suresh, S.; Zamiski, G.F.; Ritchie, D.R.O. Oxide-Induced Crack Closure: An Explanation for Near-Threshold Corrosion Fatigue Crack Growth Behavior. Metall. Mater. Trans. A 1981, 12, 1435–1443. [Google Scholar] [CrossRef]
- Newman, J.A.; Piascik, R.S. Interactions of plasticity and oxide crack closure mechanisms near the fatigue crack growth threshold. Int. J. Fatigue 2004, 26, 923–927. [Google Scholar] [CrossRef]
- Lados, D.; Apelian, D.; Paris, P.; Donald, J. Closure mechanisms in Al–Si–Mg cast alloys and long-crack to small-crack corrections. Int. J. Fatigue 2005, 27, 1463–1472. [Google Scholar] [CrossRef]
- Murakami, Y.; Endo, M. Effects of defects, inclusions and inhomogeneities on fatigue strength. Int. J. Fatigue 1994, 16, 163–182. [Google Scholar] [CrossRef]
- Li, P.; Lee, P.D.; Maijer, D.M.; Lindley, T.C. Quantification of the interaction within defect populations on fatigue behavior in an aluminum alloy. Acta Mater. 2009, 57, 3539–3548. [Google Scholar] [CrossRef]
- Aigner, R.; Garb, C.; Leitner, M.; Stoschka, M.; Grün, F. Application of a √ area -Approach for Fatigue Assessment of Cast Aluminum Alloys at Elevated Temperature. Metals 2018, 8, 1033. [Google Scholar] [CrossRef]
- Aigner, R.; Leitner, M.; Stoschka, M.; Hannesschläger, C.; Wabro, T.; Ehart, R. Modification of a Defect-Based Fatigue Assessment Model for Al-Si-Cu Cast Alloys. Materials 2018, 11, 2546. [Google Scholar] [CrossRef]
- Gnedenko, B. Sur la distribution limite du terme maximum d’une serie aleatoire. Ann. Math. 1943, 44, 423–453. [Google Scholar]
- Jenkinson, A.F. The frequency distribution of the annual maximum (or minimum) values of meteorological elements. Q. J. R. Meteorol. Soc. 1955, 87, 145–158. [Google Scholar] [CrossRef]
- Beretta, S.; Murakami, Y. Statistical analysis of defects for fatigue strength prediction and quality control of materials. Fatigue Fract. Eng. Mater. Struct. 1998, 21, 1049–1065. [Google Scholar] [CrossRef]
- Mahdi, S.; Cenac, S. Myrtene. Estimating Parameters of Gumbel Distribution using the Methods of Moments, probability weighted moments and maximum likelihood. Rev. Mat. Teor. Apl. 2005, 12, 151–156. [Google Scholar]
- Gumbel, E.J. Statistics of Extremes; Columbia University Press: New York, NY, USA, 1958. [Google Scholar]
- Murakami, Y. Metal Fatigue: Effects of Small Defects and Nonmetallic Inclusions, 1th ed.; Elsevier: Amsterdam, The Netherlands, 2002. [Google Scholar]
- Murakami, Y. Material defects as the basis of fatigue design. Int. J. Fatigue 2012, 41, 2–10. [Google Scholar] [CrossRef]
- Feikus, F.J.; Bernsteiner, P.; Gutiérrez, R.F.; Łuszczak, M. Weiterentwicklungen bei Gehäusen von Elektromotoren. MTZ-Motortechnische Zeitschrift 2020, 81, 42–47. [Google Scholar] [CrossRef]
- Campbell, J. Complete Casting Handbook//Complete Casting Handbook: Metal Casting Processes, Metallurgy, Techniques and Design, 2nd ed.; Elsevier: Amsterdam, The Netherlands, 2015. [Google Scholar] [CrossRef]
- DIN EN 1706. Aluminium and Aluminium Alloys–Castings—Chemical Composition and Mechanical Properties, German version EN 1706:2010; Beuth: Berlin, Germany, 2010. [Google Scholar]
- Sjölander, E.; Seifeddine, S. The heat treatment of Al–Si–Cu–Mg casting alloys. J. Mater. Process. Technol. 2010, 210, 1249–1259. [Google Scholar] [CrossRef]
- Yang, H.; Ji, S.; Fan, Z. Effect of heat treatment and Fe content on the microstructure and mechanical properties of die-cast Al–Si–Cu alloys. Mater. Des. 2015, 85, 823–832. [Google Scholar] [CrossRef]
- Costa, A.T.; Dias, M.; Gomes, G.L.; Rocha, O.L.; Garcia, A. Effect of solution time in T6 heat treatment on microstructure and hardness of a directionally solidified Al–Si–Cu alloy. J. Alloys Compd. 2016, 683, 485–494. [Google Scholar] [CrossRef]
- Toschi, S. Optimization of A354 Al-Si-Cu-Mg Alloy Heat Treatment: Effect on Microstructure, Hardness, and Tensile Properties of Peak Aged and Overaged Alloy. Metals 2018, 8, 961. [Google Scholar] [CrossRef]
- Han, Y.; Samuel, A.M.; Doty, H.W.; Valtierra, S.; Samuel, F.H. Optimizing the tensile properties of Al–Si–Cu–Mg 319-type alloys: Role of solution heat treatment. Mater. Des. 2014, 58, 426–438. [Google Scholar] [CrossRef]
- Ceschini, L.; Morri, A.; Toschi, S.; Seifeddine, S. Room and high temperature fatigue behaviour of the A354 and C355 (Al–Si–Cu–Mg) alloys: Role of microstructure and heat treatment. Mater. Sci. Eng. A 2016, 653, 129–138. [Google Scholar] [CrossRef]
- Samuel, A.M.; Doty, H.W.; Valtierra, S.; Samuel, F.H. Relationship between tensile and impact properties in Al–Si–Cu–Mg cast alloys and their fracture mechanisms. Mater. Des. 2014, 53, 938–946. [Google Scholar] [CrossRef]
- Do Lee, C. Effect of T6 heat treatment on the defect susceptibility of fatigue properties to microporosity variations in a low-pressure die-cast A356 alloy. Mater. Sci. Eng. A 2013, 559, 496–505. [Google Scholar] [CrossRef]
- Zhu, M.; Jian, Z.; Yang, G.; Zhou, Y. Effects of T6 heat treatment on the microstructure, tensile properties, and fracture behavior of the modified A356 alloys. Mater. Des. 2012, 36, 243–249. [Google Scholar] [CrossRef]
- Boileau, J.M.; Allison, J.E. The effect of solidification time and heat treatment on the fatigue properties of a cast 319 aluminum alloy. Metall. Trans. 2003, 34, 1807–1820. [Google Scholar] [CrossRef]
- Fabrizi, A.; Capuzzi, S.; de Mori, A.; Timelli, G. Effect of T6 Heat Treatment on the Microstructure and Hardness of Secondary AlSi9Cu3(Fe) Alloys Produced by Semi-Solid SEED Process. Metals 2018, 8, 750. [Google Scholar] [CrossRef]
- Aigner, R.; Leitner, M.; Stoschka, M. On the mean stress sensitivity of cast aluminium considering imperfections. Mater. Sci. Eng. A 2019, 758, 172–184. [Google Scholar] [CrossRef]
- Leitner, M.; Garb, C.; Remes, H.; Stoschka, M. Microporosity and statistical size effect on the fatigue strength of cast aluminium alloys EN AC-45500 and 46200. Mater. Sci. Eng. A 2017, 707, 567–575. [Google Scholar] [CrossRef]
- Vandersluis, E.; Ravindran, C. Comparison of Measurement Methods for Secondary Dendrite Arm Spacing. Metallogr. Microstruct. Anal. 2017, 6, 89–94. [Google Scholar] [CrossRef]
- Boileau, J.M.; Zindel, J.W.; Allison, J.E. The Effect of Solidification Time on the Mechanical Properties in a Cast A356-T6 Aluminum Alloy. SAE Trans. 1997, 106, 63–74. [Google Scholar]
- Zhang, L.Y.; Jiang, Y.H.; Ma, Z.; Shan, S.F.; Jia, Y.Z.; Fan, C.Z.; Wang, W.K. Effect of cooling rate on solidified microstructure and mechanical properties of aluminium-A356 alloy. J. Mater. Process. Technol. 2008, 207, 107–111. [Google Scholar] [CrossRef]
- Ceschini, L.; Boromei, I.; Morri, A.; Seifeddine, S.; Svensson, I.L. Microstructure, tensile and fatigue properties of the Al–10%Si–2%Cu alloy with different Fe and Mn content cast under controlled conditions. J. Mater. Process. Technol. 2009, 209, 5669–5679. [Google Scholar] [CrossRef]
- Zhang, B.; Chen, W.; Poirier, D.R. Effect of solidification cooling rate on the fatigue life of A356.2-T6 cast aluminium alloy. Fatigue Fract. Eng. Mater. Struct. 2000, 23, 417–423. [Google Scholar] [CrossRef]
- Gerbe, S.; Krupp, U.; Michels, W. Influence of secondary dendrite arm spacing (SDAS) on the fatigue properties of different conventional automotive aluminum cast alloys. Frat. Integrità Strutt. 2019, 13, 105–115. [Google Scholar] [CrossRef]
- Leitner, H. Simulation des Ermüdungsverhaltens von Aluminiumgusslegierungen. Ph.D. Thesis, Montanuniversität Leoben, Leoben, Austria, 2001. [Google Scholar]
- Garb, C.; Leitner, M.; Grün, F. Application of √area-concept to assess fatigue strength of AlSi7Cu0.5Mg casted components. Eng. Fract. Mech. 2017, 185, 61–71. [Google Scholar] [CrossRef]
- ASTM International E 739. Standard Practice for Statistical Analysis of Linear or Linearized Stress-Life (S-N) and Strain Life (E-N) Fatigue Data; ASTM International: West Conshohocken, PA, USA, 1998. [Google Scholar]
- Dengel, D.; Harig, H. Estimation of the fatigue limit by progressively-increasing load tests. Fatigue Fract. Eng. Mater. Struct. 1980, 3, 113–128. [Google Scholar] [CrossRef]
- Garb, C.; Leitner, M.; Grün, F. Effect of elevated temperature on the fatigue strength of casted AlSi8Cu3 aluminium alloys. Procedia Struct. Integr. 2017, 7, 497–504. [Google Scholar] [CrossRef]
- Wang, Q.; Apelian, D.; Lados, D. Fatigue behavior of A356/357 aluminum cast alloys. Part II—Effect of microstructural constituents. J. Light Met. 2001, 1, 85–97. [Google Scholar] [CrossRef]
- Wang, Q.; Apelian, D.; Lados, D. Fatigue behavior of A356-T6 aluminum cast alloys. Part I—Effect of casting defects. J. Light Met. 2001, 1, 73–84. [Google Scholar] [CrossRef]
- Åman, M.; Okazaki, S.; Matsunaga, H.; Marquis, G.B.; Remes, H. The effect of interacting small defects on the fatigue limit of a medium carbon steel. Procedia Struct. Integr. 2016, 2, 3322–3329. [Google Scholar] [CrossRef]
- Massey, F.J., Jr. The Kolmogorov-Smirnov test for goodness of fit. J. Am. Stat. Assoc. 1951, 46, 68–78. [Google Scholar]


| Alloy | Si [%] | Cu [%] | Fe [%] | Mn [%] | Mg [%] | Ti [%] | Al [-] |
|---|---|---|---|---|---|---|---|
| EN AC-46200 | 7.5–8.5 | 2.0–3.5 | 0.8 | 0.15–0.65 | 0.05–0.55 | 0.25 | balance |
| Specimen | HT | Volume | [-] | [-] | [-] | [-] | |
|---|---|---|---|---|---|---|---|
| A | T6 | 7.84 | 1.00 | 1,100,000 | 1:1.08 | ||
| B | T6 | 10.73 | 0.96 | 1,900,000 | 1:1.23 |
| Position | Volume | [m] | [m] | [-] | [m] | [-] | |
|---|---|---|---|---|---|---|---|
| A | 95.1 | 20.1 | 0.43 | 103 | 0.93 | ||
| B | 118.4 | 28.1 | 0.36 | 129 | 0.69 | ||
| B (model) | 111.3 | 27.1 | 0.43 | 122 | 0.58 |
| [-] | [-] | [mm] | [mm] | |||
|---|---|---|---|---|---|---|
| 3.95 | 1.06 | 0.4 | 0.6 | 0.03 | 0.75 |
© 2020 by the authors. Licensee MDPI, Basel, Switzerland. This article is an open access article distributed under the terms and conditions of the Creative Commons Attribution (CC BY) license (http://creativecommons.org/licenses/by/4.0/).
Share and Cite
Oberreiter, M.; Pomberger, S.; Leitner, M.; Stoschka, M. Validation Study on the Statistical Size Effect in Cast Aluminium. Metals 2020, 10, 710. https://doi.org/10.3390/met10060710
Oberreiter M, Pomberger S, Leitner M, Stoschka M. Validation Study on the Statistical Size Effect in Cast Aluminium. Metals. 2020; 10(6):710. https://doi.org/10.3390/met10060710
Chicago/Turabian StyleOberreiter, Matthias, Sebastian Pomberger, Martin Leitner, and Michael Stoschka. 2020. "Validation Study on the Statistical Size Effect in Cast Aluminium" Metals 10, no. 6: 710. https://doi.org/10.3390/met10060710
APA StyleOberreiter, M., Pomberger, S., Leitner, M., & Stoschka, M. (2020). Validation Study on the Statistical Size Effect in Cast Aluminium. Metals, 10(6), 710. https://doi.org/10.3390/met10060710