Article

Probabilistic Surface Layer Fatigue Strength Assessment of EN AC-46200 Sand Castings

by
Sebastian Pomberger
1,*,
Matthias Oberreiter
1,
Martin Leitner
1,
Michael Stoschka
1 and
Jörg Thuswaldner
2
1
Christian Doppler Laboratory for Manufacturing Process based Component Design, Chair of Mechanical Engineering, Montanuniversität Leoben, Franz-Josef-Straße 18, 8700 Leoben, Austria
2
Chair of Mathematics and Statistics, Montanuniversität Leoben, Franz-Josef-Straße 18, 8700 Leoben, Austria
*
Author to whom correspondence should be addressed.
Metals 2020, 10(5), 616; https://doi.org/10.3390/met10050616
Submission received: 20 March 2020 / Revised: 30 April 2020 / Accepted: 5 May 2020 / Published: 9 May 2020
(This article belongs to the Special Issue Technological Aspects in Fatigue Design of Metallic Structures)

Abstract

:
The local fatigue strength within the aluminium cast surface layer is affected strongly by surface layer porosity and cast surface texture based notches. This article perpetuates the scientific methodology of a previously published fatigue assessment model of sand cast aluminium surface layers in T6 heat treatment condition. A new sampling position with significantly different surface roughness is investigated and the model exponents a 1 and a 2 are re-parametrised to be suited for a significantly increased range of surface roughness values. Furthermore, the fatigue assessment model of specimens in hot isostatic pressing (HIP) heat treatment condition is studied for all sampling positions. The obtained long life fatigue strength results are approximately 6% to 9% conservative, thus proven valid within an range of 30 µm ≤ S v ≤ 260 µm notch valley depth. To enhance engineering feasibility even further, the local concept is extended by a probabilistic approach invoking extreme value statistics. A bivariate distribution enables an advanced probabilistic long life fatigue strength of cast surface textures, based on statistically derived parameters such as extremal valley depth S v i and equivalent notch root radius ρ ¯ i . Summing up, a statistically driven fatigue strength assessment tool of sand cast aluminium surfaces has been developed and features an engineering friendly design method.

1. Introduction

For fatigue strength assessment of metallic castings in mechanical engineering the designer has to consider a manufacturing process based on local material properties such as shrinkage pores or surface texture based notches. Neglecting the effect of defects on fatigue strength will result in oversizing of mechanical components to maintain globally sufficient component safety. As nowadays lightweight construction demands and sustainable designs are encouraged, aluminium sand cast components are often utilised which enable complex geometries and thus support significant weight savings of up to 50% [1]. However, it is well known that aluminium castings inherit both internal casting defects, particularly shrinkage pores, as well as surface texture related micro and macro notches driven by the surface geometrical structure (SGS), affecting the local fatigue strength. Therefore, applicable assessment methodologies, considering these local influences, are an advantageous tool in fatigue design.
In terms of porosity effect on the cast component fatigue strength various studies have been conducted, thoroughly investigating crack growth behaviour [2,3,4,5] as well as statistical description taking into account the effect of pore size, location and shape [6,7,8,9,10,11,12,13,14,15,16,17,18,19,20,21]. Therein, fatigue assessment concepts like the a r e a -approach of Murakami [22], or threshold-based concepts like the concept of Kitagawa and Takahashi [23], are frequently applied due to their engineering feasible applicability. Defect size and spatial location within the components are thereby stated to be the driving forces in terms of fatigue strength reduction effects. Other studies [15,16,22] point out that surface defects are more critical than internal ones, which emphasises the crucial influence of the cast surface layer and its defect distribution on the local fatigue resistance.
Aside from internal inhomogeneities, the surface texture, or surface roughness, plays a decisive role on cast fatigue strength. Surface pits, caused by the SGS, basically act as micro and macro notches and increase the stress concentration, thus reducing the local fatigue strength. Therefore, cast mechanical components are often additionally surface finished by machining or by polishing, in order to counteract the detrimental surface roughness effect. Thus, many studies contribute to the surface roughness effect on fatigue strength, investigating machined surfaces obtaining periodic surface textures [24,25,26,27,28,29]. As in the literature [30,31] various analytical equations are introduced to characterise geometrical notches, these formulations are adapted to assess machined [32,33,34,35] or even cast [36,37,38], and more recently also additively manufactured [39] surfaces.
As stated in [37,38] for cast surfaces, areal roughness parameters should be used in order to characterise the surface texture thoroughly. The areal roughness evaluation methodology published by the authors of [38] enables such a holistic characterisation of cast, as well as of additively manufactured, surface textures. The presented sub-area analysis provides additional information about local roughness parameters, which focusses on more distinctive, and therefore more fatigue crack-initiating surface pits. A modification of Peterson´s stress concentration factor [31] and its application on investigated sand cast aluminium surfaces lead to an engineering feasible areal fatigue assessment approach, as presented in [36]. The modified stress concentration factor K t , m o d , as introduced in [36], is given in Equation (1) and utilises the local surface pit depth S v l o c a l , the mean value of the crack initiating cast surface pit depth S v r e v and an equivalent notch root radius ρ ¯ . Taking the local notch sensitivity into account, the surface fatigue notch factor K f , s can be subsequently evaluated. Figure 1 depicts the result of an exemplary areal fatigue assessment for a sand cast surface layer, leading to sub-area based K f , s values. The red cross marks the technical crack initiation point of the tested sample, evaluated by means of fracture surface analysis. The presented concept also features the assessment of surface layer porosity, that is, pores directly beneath the surface which are partly broached by the surface texture and therefore interact with the surface roughness based notches.
K t , m o d = 1 + 2 S v l o c a l S v r e v a 1 · S v r e v ρ ¯ 1 a 2
This methodology may be validated even further by additional datasets, which should provide significantly different cast surface textures in order to broaden the applicability of the method towards a wider range of surface roughness values. In addition, as this areal sand cast surface characterisation method is based on local roughness values, the fatigue designer has to have knowledge about these manufacturing process dependent values. However, such as localised information is in general not available for cast surface structures. Therefore, this concept is extended by a probabilistic approach as previously recommended in [36]. Moreover, the effect of sub-area size ought to be investigated to cover miscellaneous evaluation area magnitudes as well.
Therefore, this paper scientifically contributes to the following key parts.
  • Extension of the assessment methodology presented in [36] utilising an additional aluminium sand cast surface exhibiting a significantly varying surface roughness structure.
  • As-cast surfaces in the T6 heat treatment condition were the main research target in [36]; the applicability of the assessment model to cast specimens with additional hot isostatic pressing (HIP) heat treatment is evaluated.
  • Robustness study of the presented method in terms of sub-area magnitude or sample size and their effect on the evaluated statistical distribution.
  • Statistical characterisation of the sand cast surface texture and subsequently probabilistic evaluation of the manufacturing process related surface fatigue strength as design recommendations of cast components.

2. Investigated Material

The investigated aluminium alloy‘s EN numerical designation is EN AC-46200. The gravity sand cast components are crankcases, manufactured by means of the core package system (CPS) casting process [40,41,42,43]. For details about the specimen geometry and the nominal chemical composition of the material the authors refer to the work in [36] as reference. As an additional different surface roughness texture is investigated for validation in this study, the specimen series with this new sampling position is denoted by P2, while the original specimen series investigated in [36] are labelled as P1 in the following. Beside the variation of the specimen position the effect of an additional HIP heat treatment (HIP+T6), as also studied in [44], is investigated and compared to T6 heat treatment condition. The HIP+T6 specimens are subsequently labelled as HIP. Due to the HIP process, shrinkage pores within the bulk material shall be closed and its effect on the surface layer will be studied. Typically applied HIP parameters for aluminium alloys [44,45,46,47,48], such as temperature T, pressure p and time t, are given in Table 1.
Metallographic analysis revealed that the HIP specimens do not differ in microstructure in terms of secondary dendrite arm spacing (DAS) in comparison to T6 specimens, thus matching the findings in [49,50]. The DAS has been evaluated as described in [51], and the mean values of sampling position P1 and P2 in T6 as well as HIP heat treatment condition are listed in Table 2. For both, T6 P1 (Figure 2b) and HIP P1 (Figure 2a) a mean DAS of about 26 µm was evaluated. For specimens at sampling position P2 a slight DAS gradient is observable, see Figure 2c. This is caused by the increased solidification rate within the surface layer at this sampling position. Near the surface a DAS of about 21 µm was measured, which slowly increased to about 28 µm at a distance of 9 mm measured from the cast surface. This matches the results of Aigner [49], investigating the bulk material of EN AC-46200 at sampling position P2. Although in Figure 2c a specimen with T6 heat treatment is presented, the HIP micostructure in terms of DAS is identical as the process only affects the bulk material porosity. However, as DAS does not affect the fatigue strength in the presence of defects according to [6,13], differences in DAS can be neglected.
The tested material properties of both HIP and T6 heat treatment are opposed in Table 3. While the ultimate tensile strength R m as well as Vickers hardness H V 10 , Young‘s modulus E and yield strength R P 0 . 2 only differ slightly, the elongation at rupture A is significantly increased, which matches the findings in [20,44].

3. Experimental

Within this work, fatigue tests were performed on HIP sand cast surfaces at sampling positions P1 and P2. Although three test series have been experimentally investigated (HIP P1, HIP P1(2), HIP P2), only two of them (HIP P1 and HIP P2) will be presented in detail to enhance clarity. However, fatigue test results such as S/N-parameters are evaluated and tabulated for all three investigated series.
All testing series possess cast surfaces and the fatigue tests were performed identically to the procedure described in [36] utilising a Rumul Cracktronic®. Due to the load stress ratio of R = 0 under bending load the highly tensile-stressed region of the specimen is set to the cast surface layer. The S/N-curves are statistically evaluated following the procedure applied in [36]. 
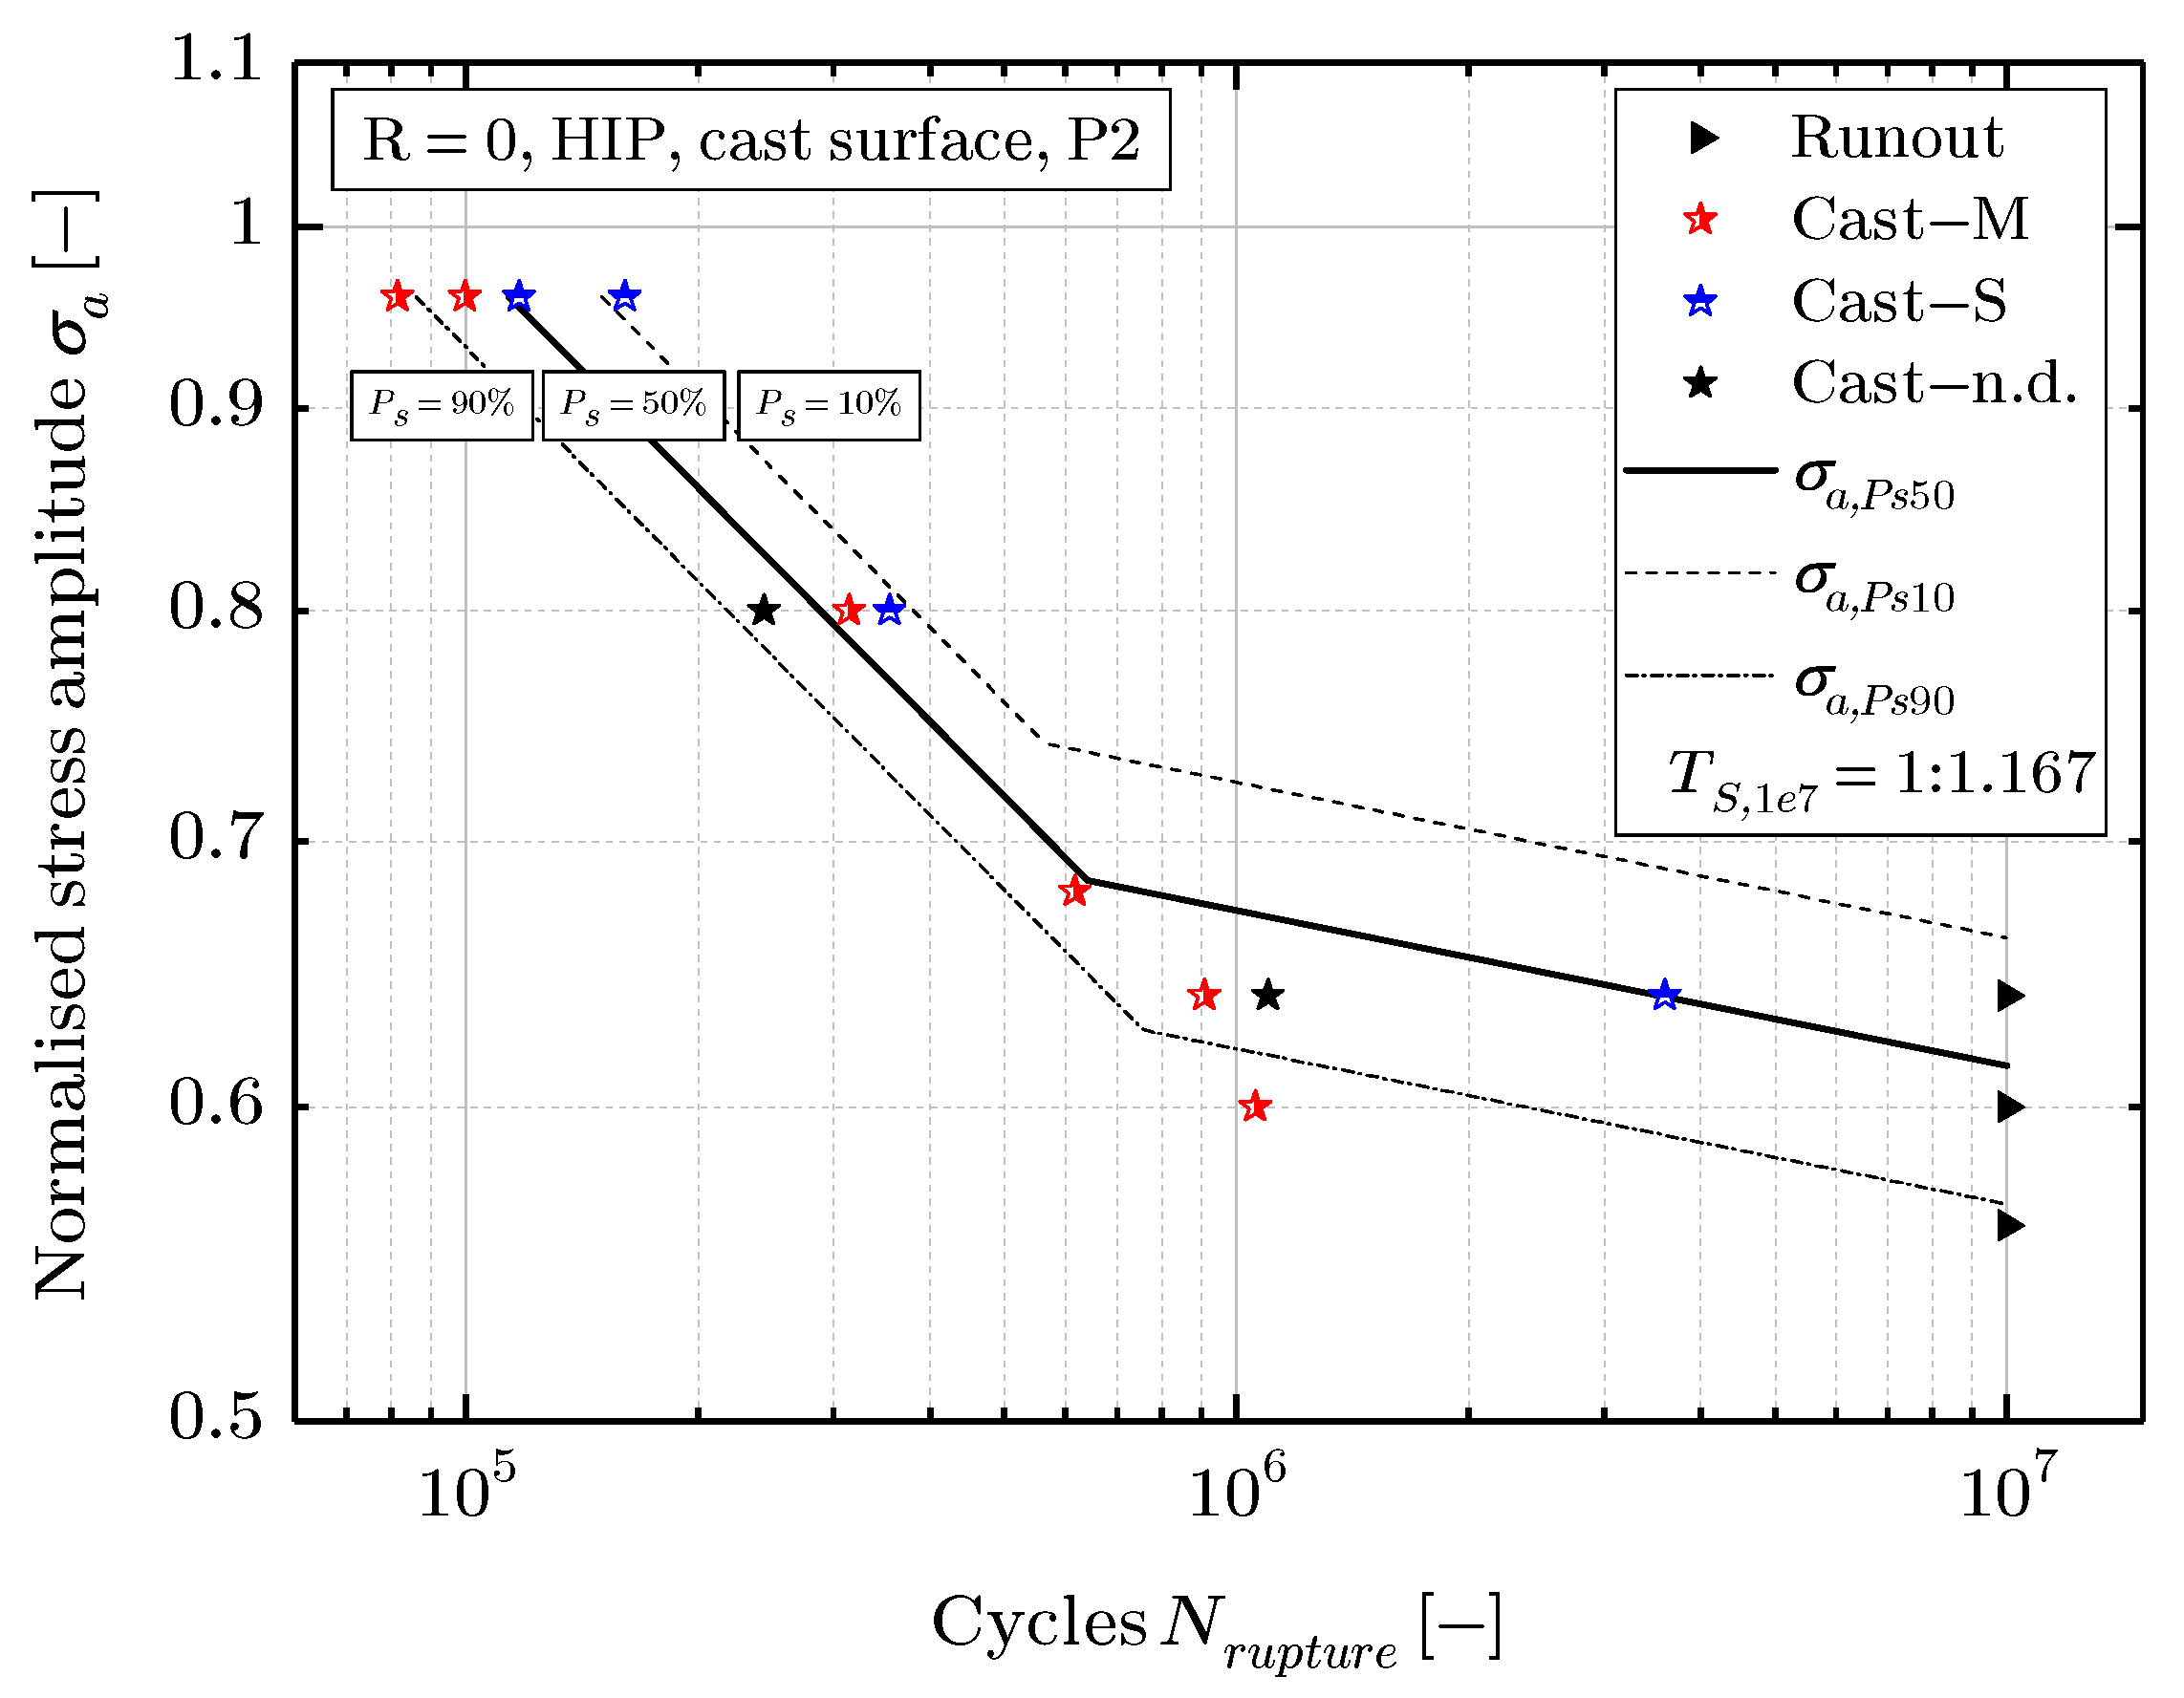
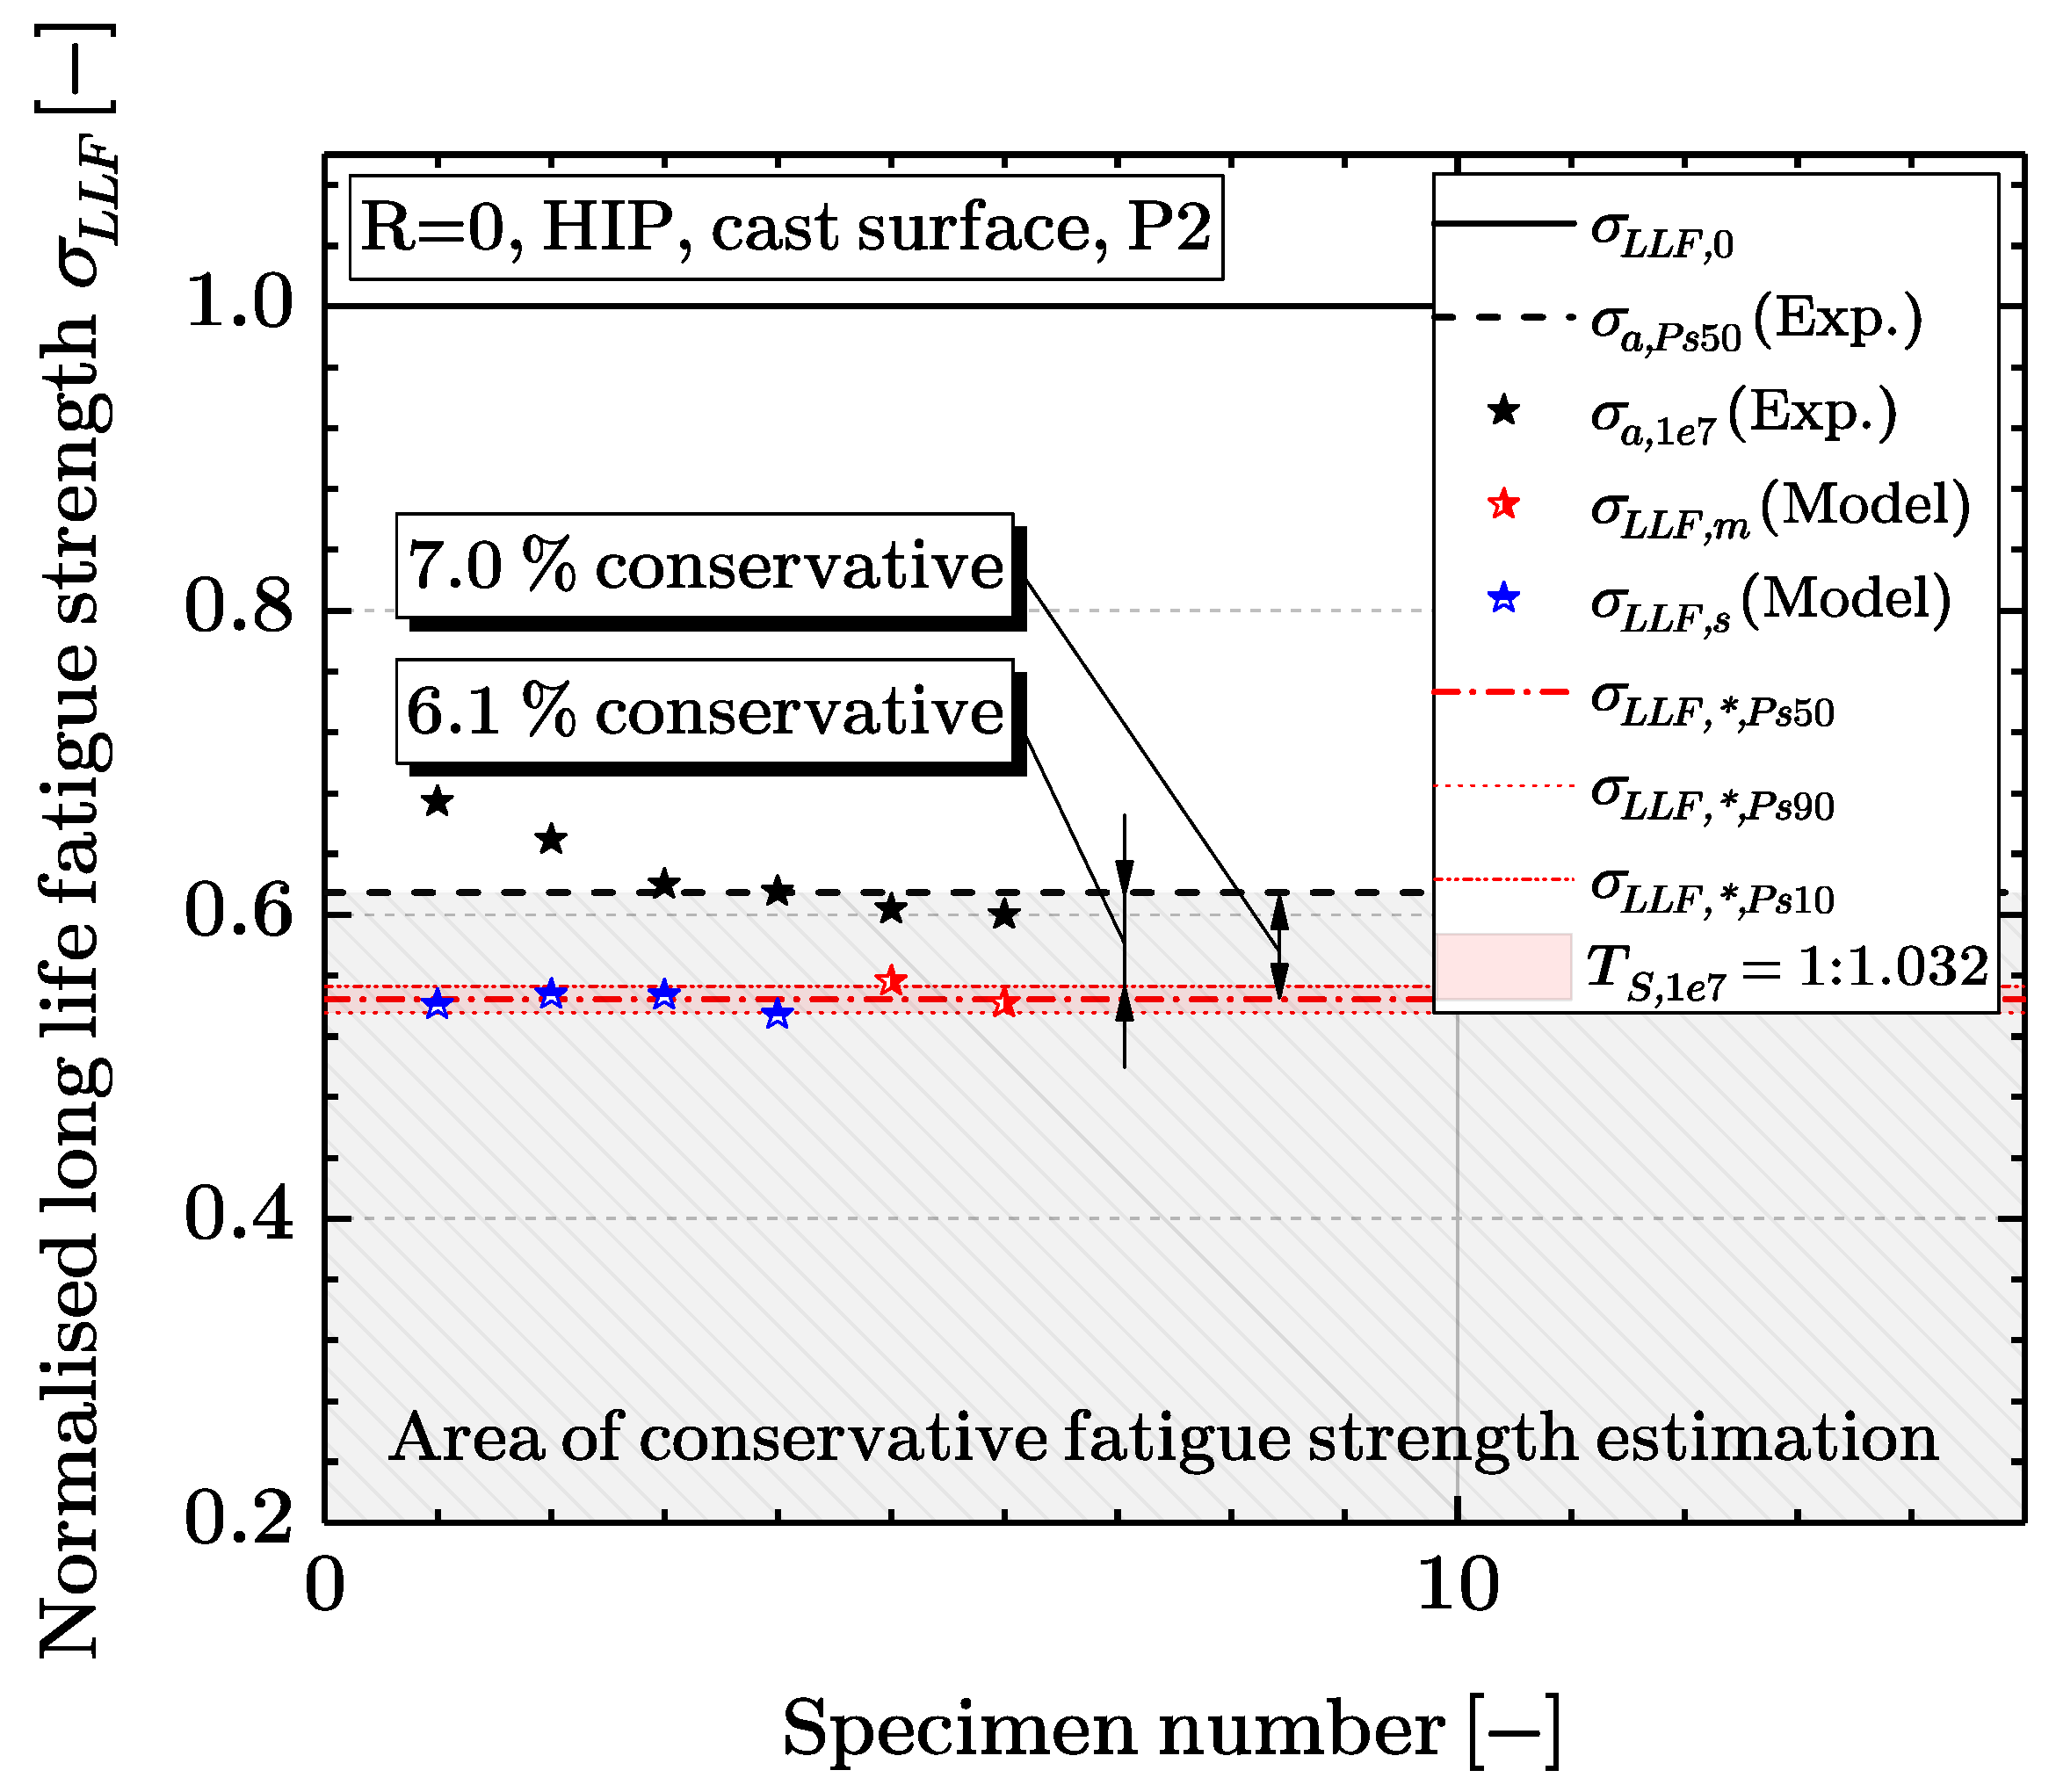
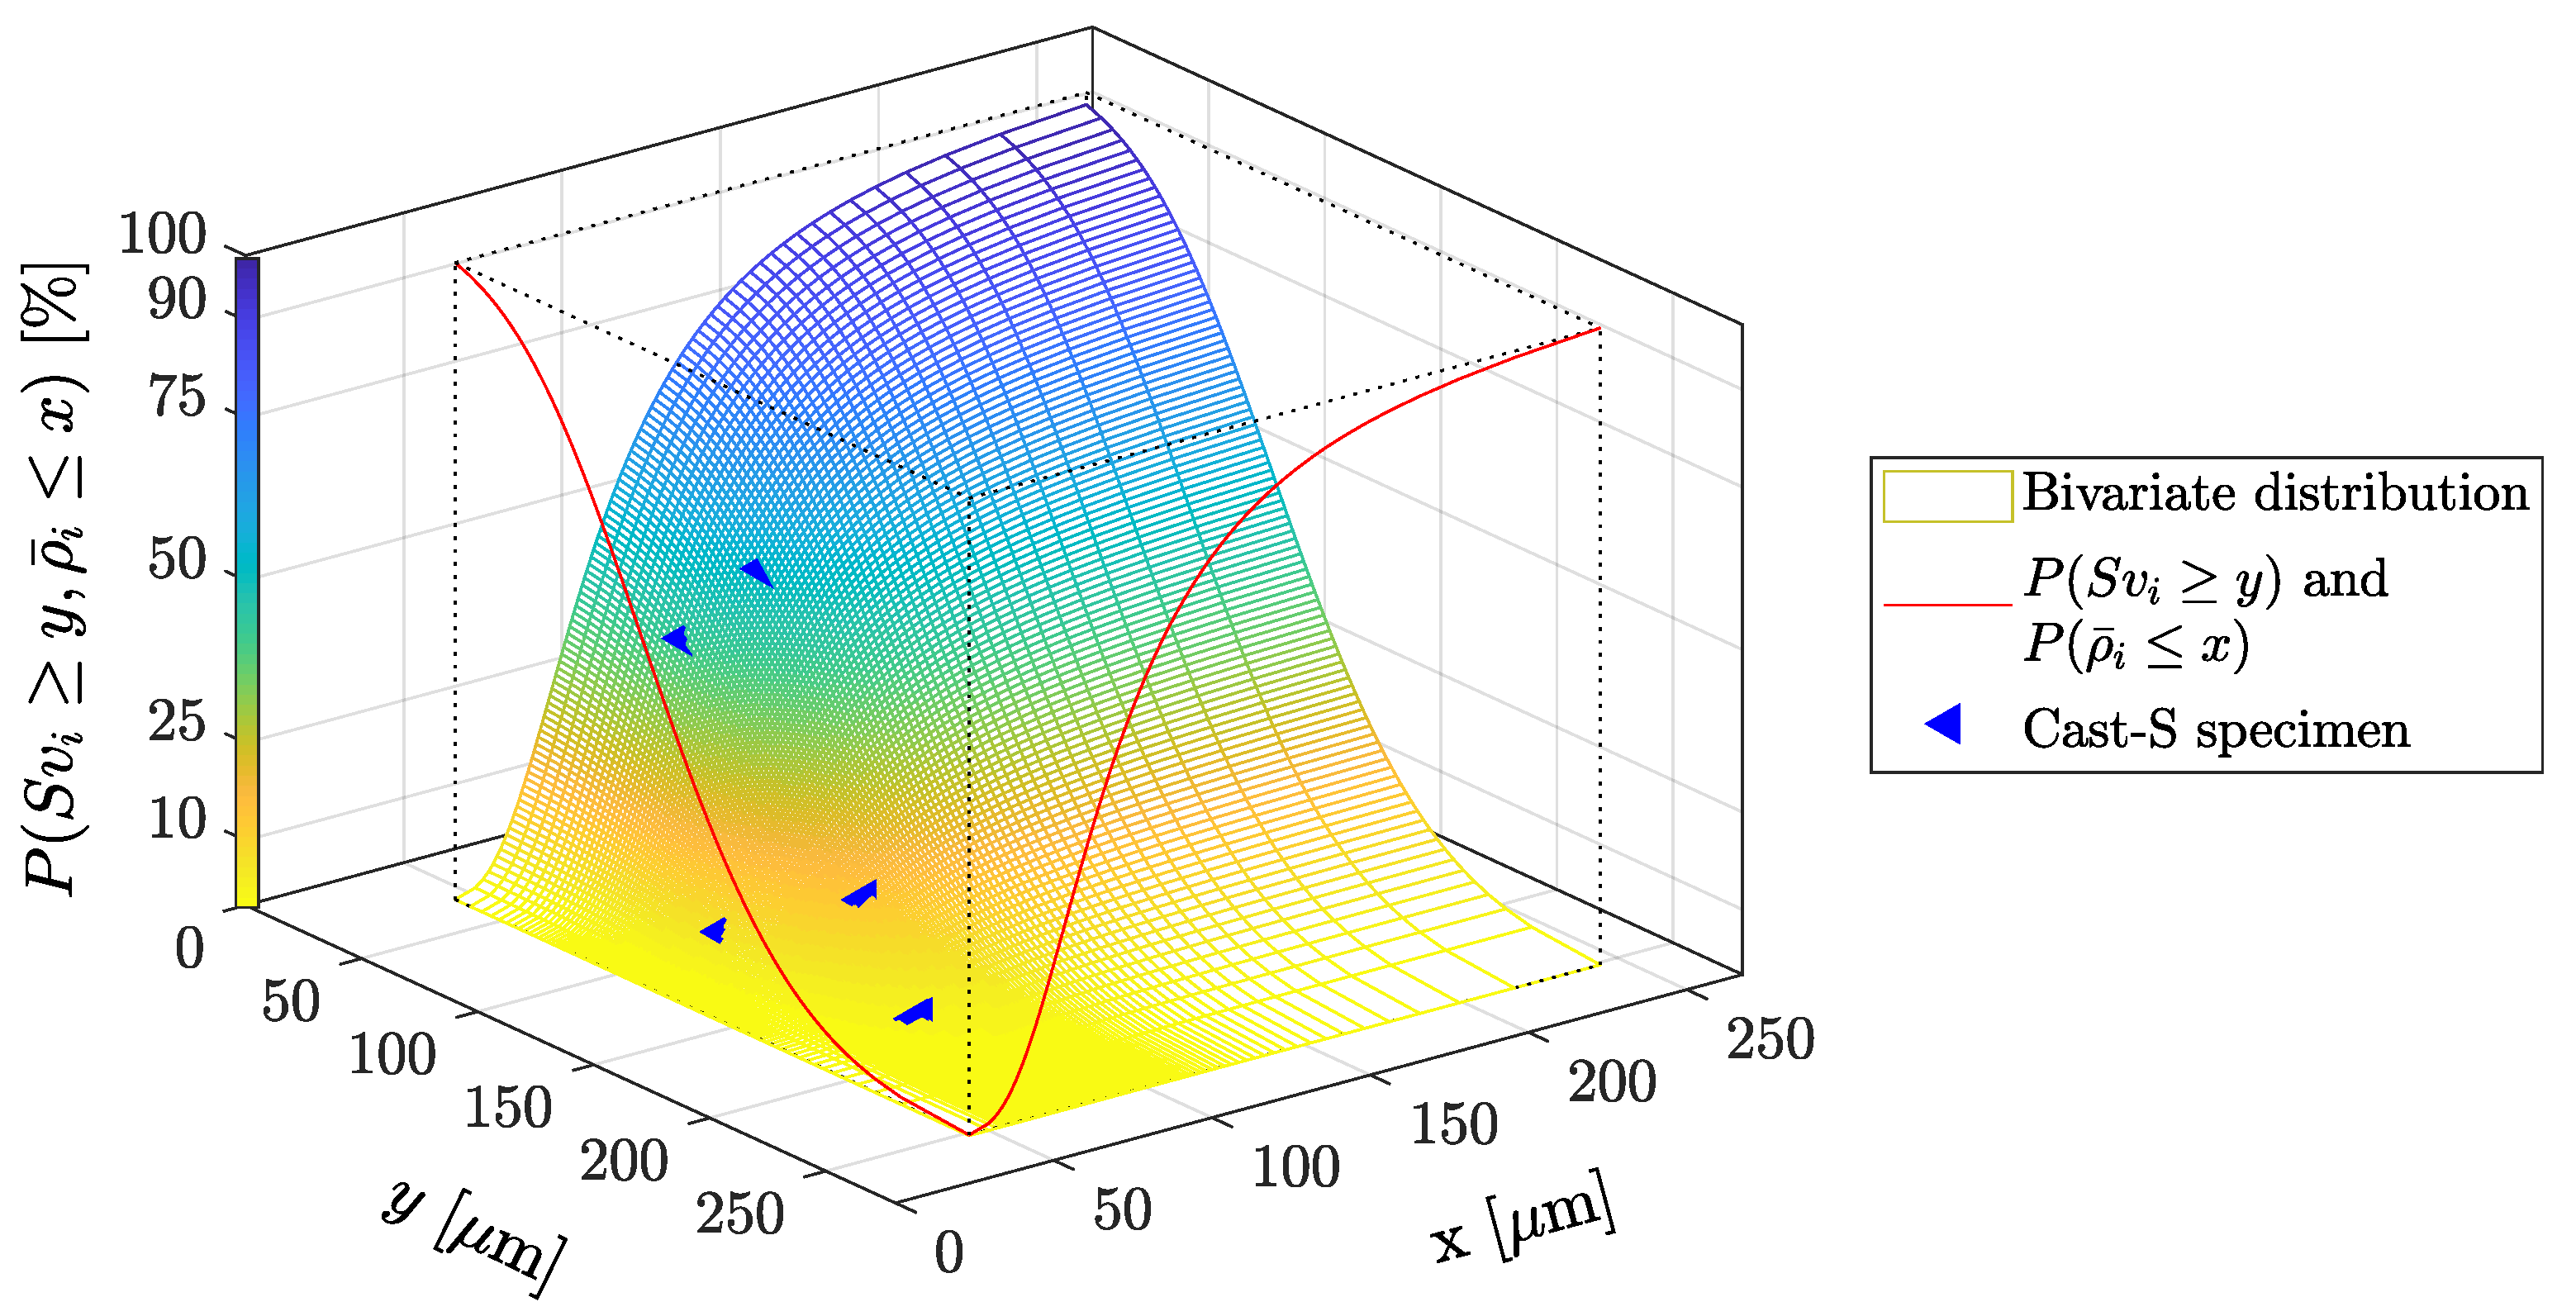
Figure 3 depicts the nominal bending S/N-curve of the HIP test series at the new sampling position P2, possessing a significantly reduced surface roughness, as discussed in Section 5. Within all S/N-figures, the stress amplitude σ a is normalised to the material‘s near defect-free long life fatigue strength σ L L F , 0 . As stated in [36], the value of σ L L F , 0 was experimentally evaluated by means of HIP specimens with machined and subsequently polished surface condition. Thus, the observed fatigue strength is unaffected both from porosity effect and surface roughness effect.
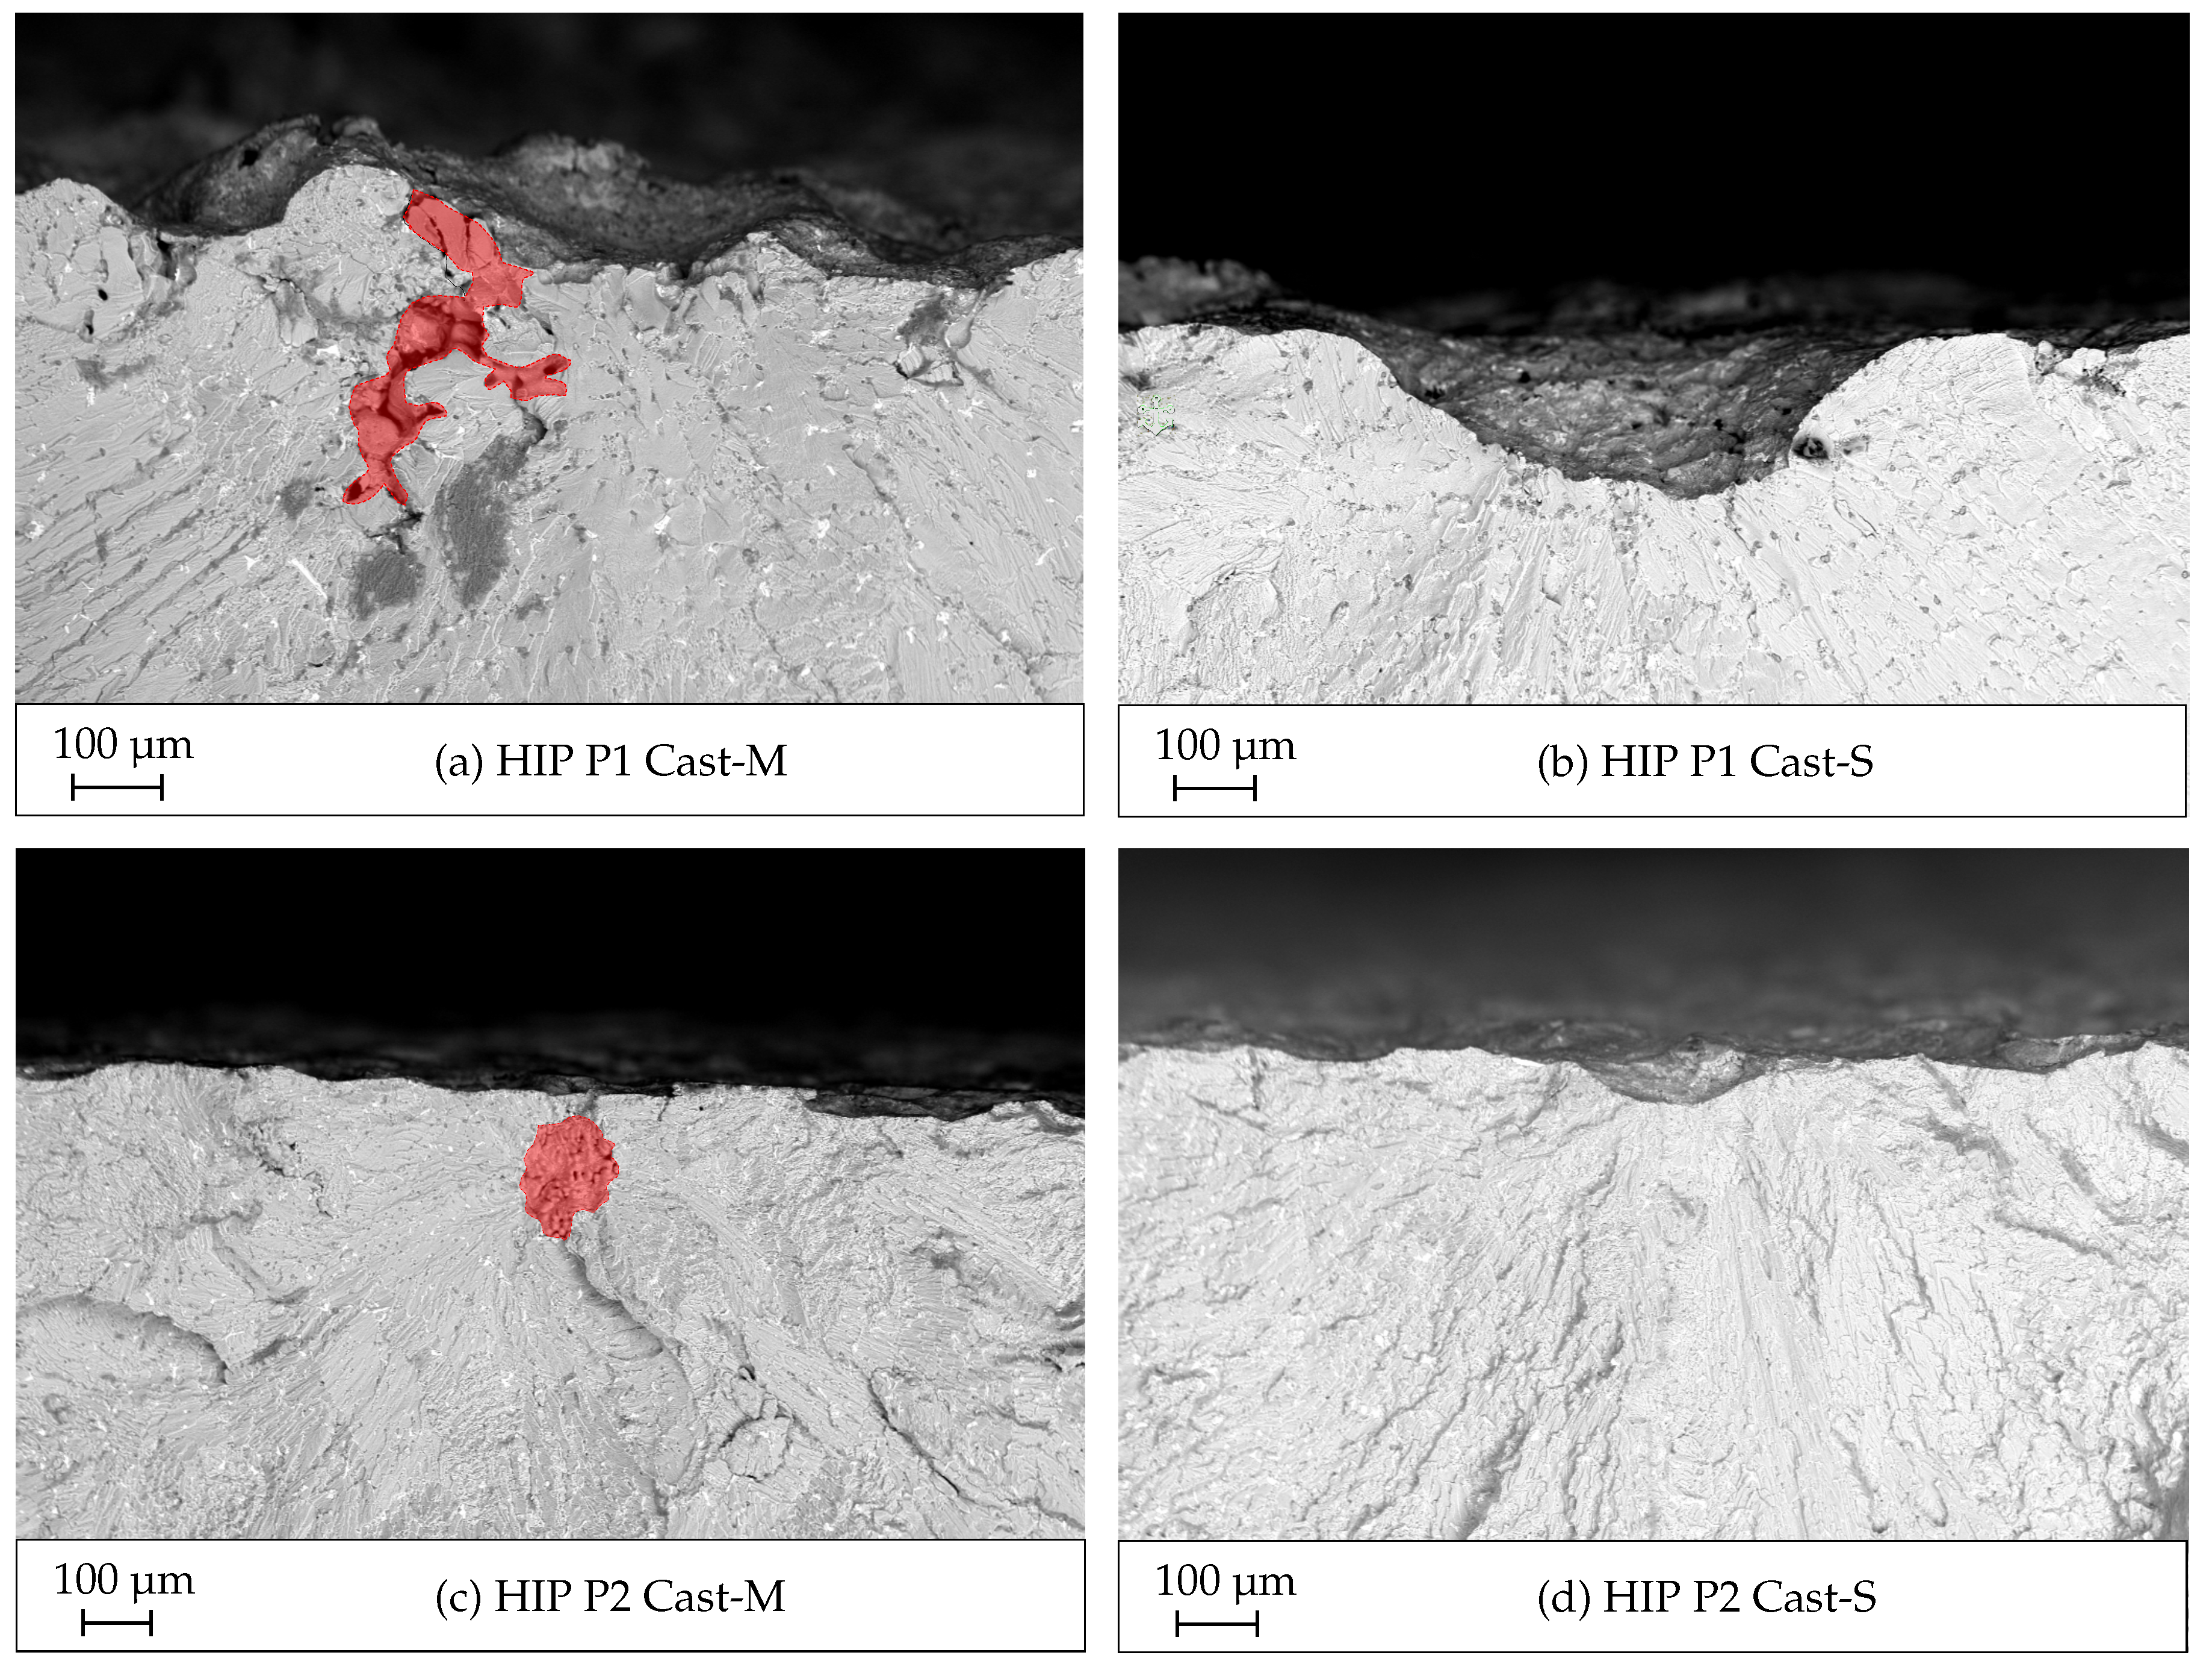
The crack initiation cause is marked red if the crack initiated at a combination of a surface pit and a micropore located directly within the surrounding area (Cast-M), and blue if only the cast surface texture (Cast-S), that is, surface roughness, caused technical crack initiation. Figure 4 exemplary depicts the fractographically evaluated crack initiating defects of Cast-S and Cast-M specimens of the HIP P1 and HIP P2 testing series by means of scanning electron microscopy (SEM). Fractographic images of HIP P1 are also representative for the T6 P1 testing series of [36]. For almost all Cast-M specimens shrinkage porosity was observed to participate in crack initiation. Only few cases revealed gas pores, bifilms or intermetallic phases to be critical. In contrast with the locations of the pores of Cast-M P1 specimens, those of Cast-M P2 rarely have been broached, but were found to be located about 10 µm to 30 µm beneath the surface. This may be caused by the elevated solidification rate within the surface layer at this sampling position. For Cast-n.d. specimens, no distinct crack initiation cause could be clearly determined by fracture surface analysis, which is why they are not subsequently taken into account for validation.
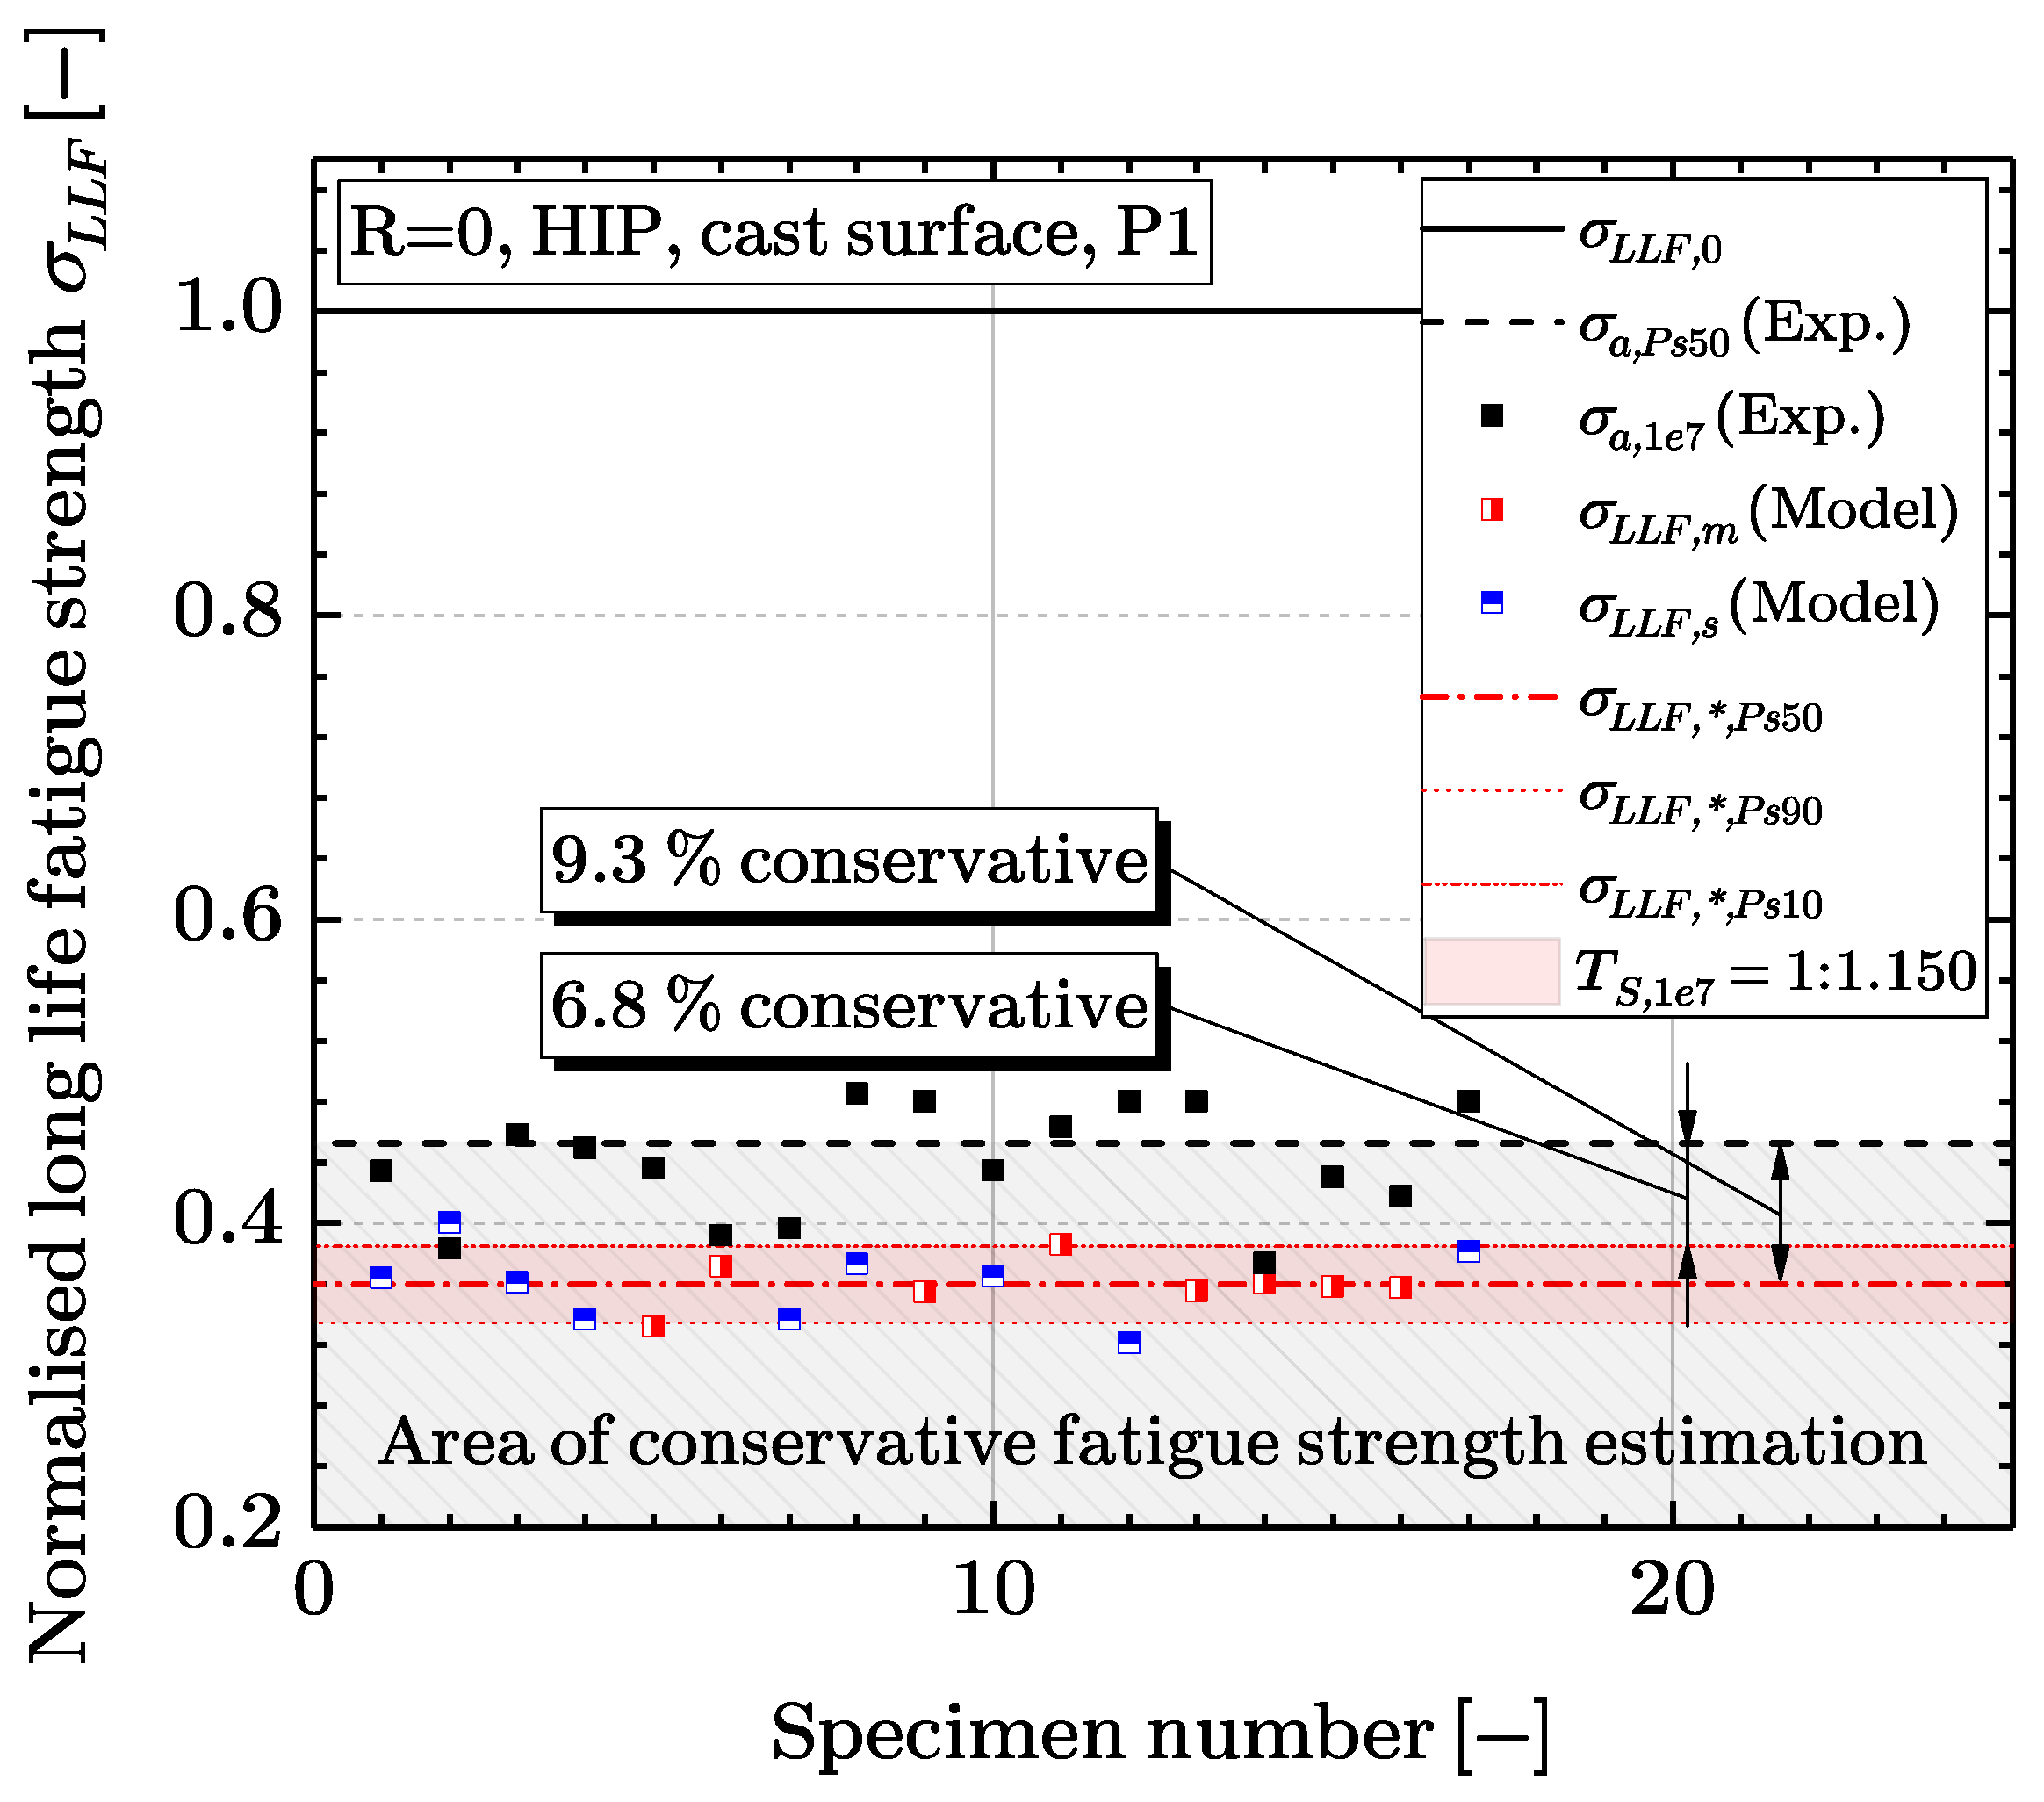
The S/N-curves (Figure 3 and Figure 5) are given with their 90% and 10% probability of survival and the stress scatter index T S , 1 e 7 is calculated according to [52] by means of Equation (2) at ten million load cycles. The evaluated S/N-curve provides in Table 4 the value of the inverse slopes k 1 and k 2 , which is five times k 1 [53], the transition knee point N T and the normalised long life fatigue strength σ a , P s 50 as well as the stress scatter index T S , 1 e 7 .
T S , 1 e 7 = 1 : σ a ( P s = 10 % ) σ a ( P s = 90 % )
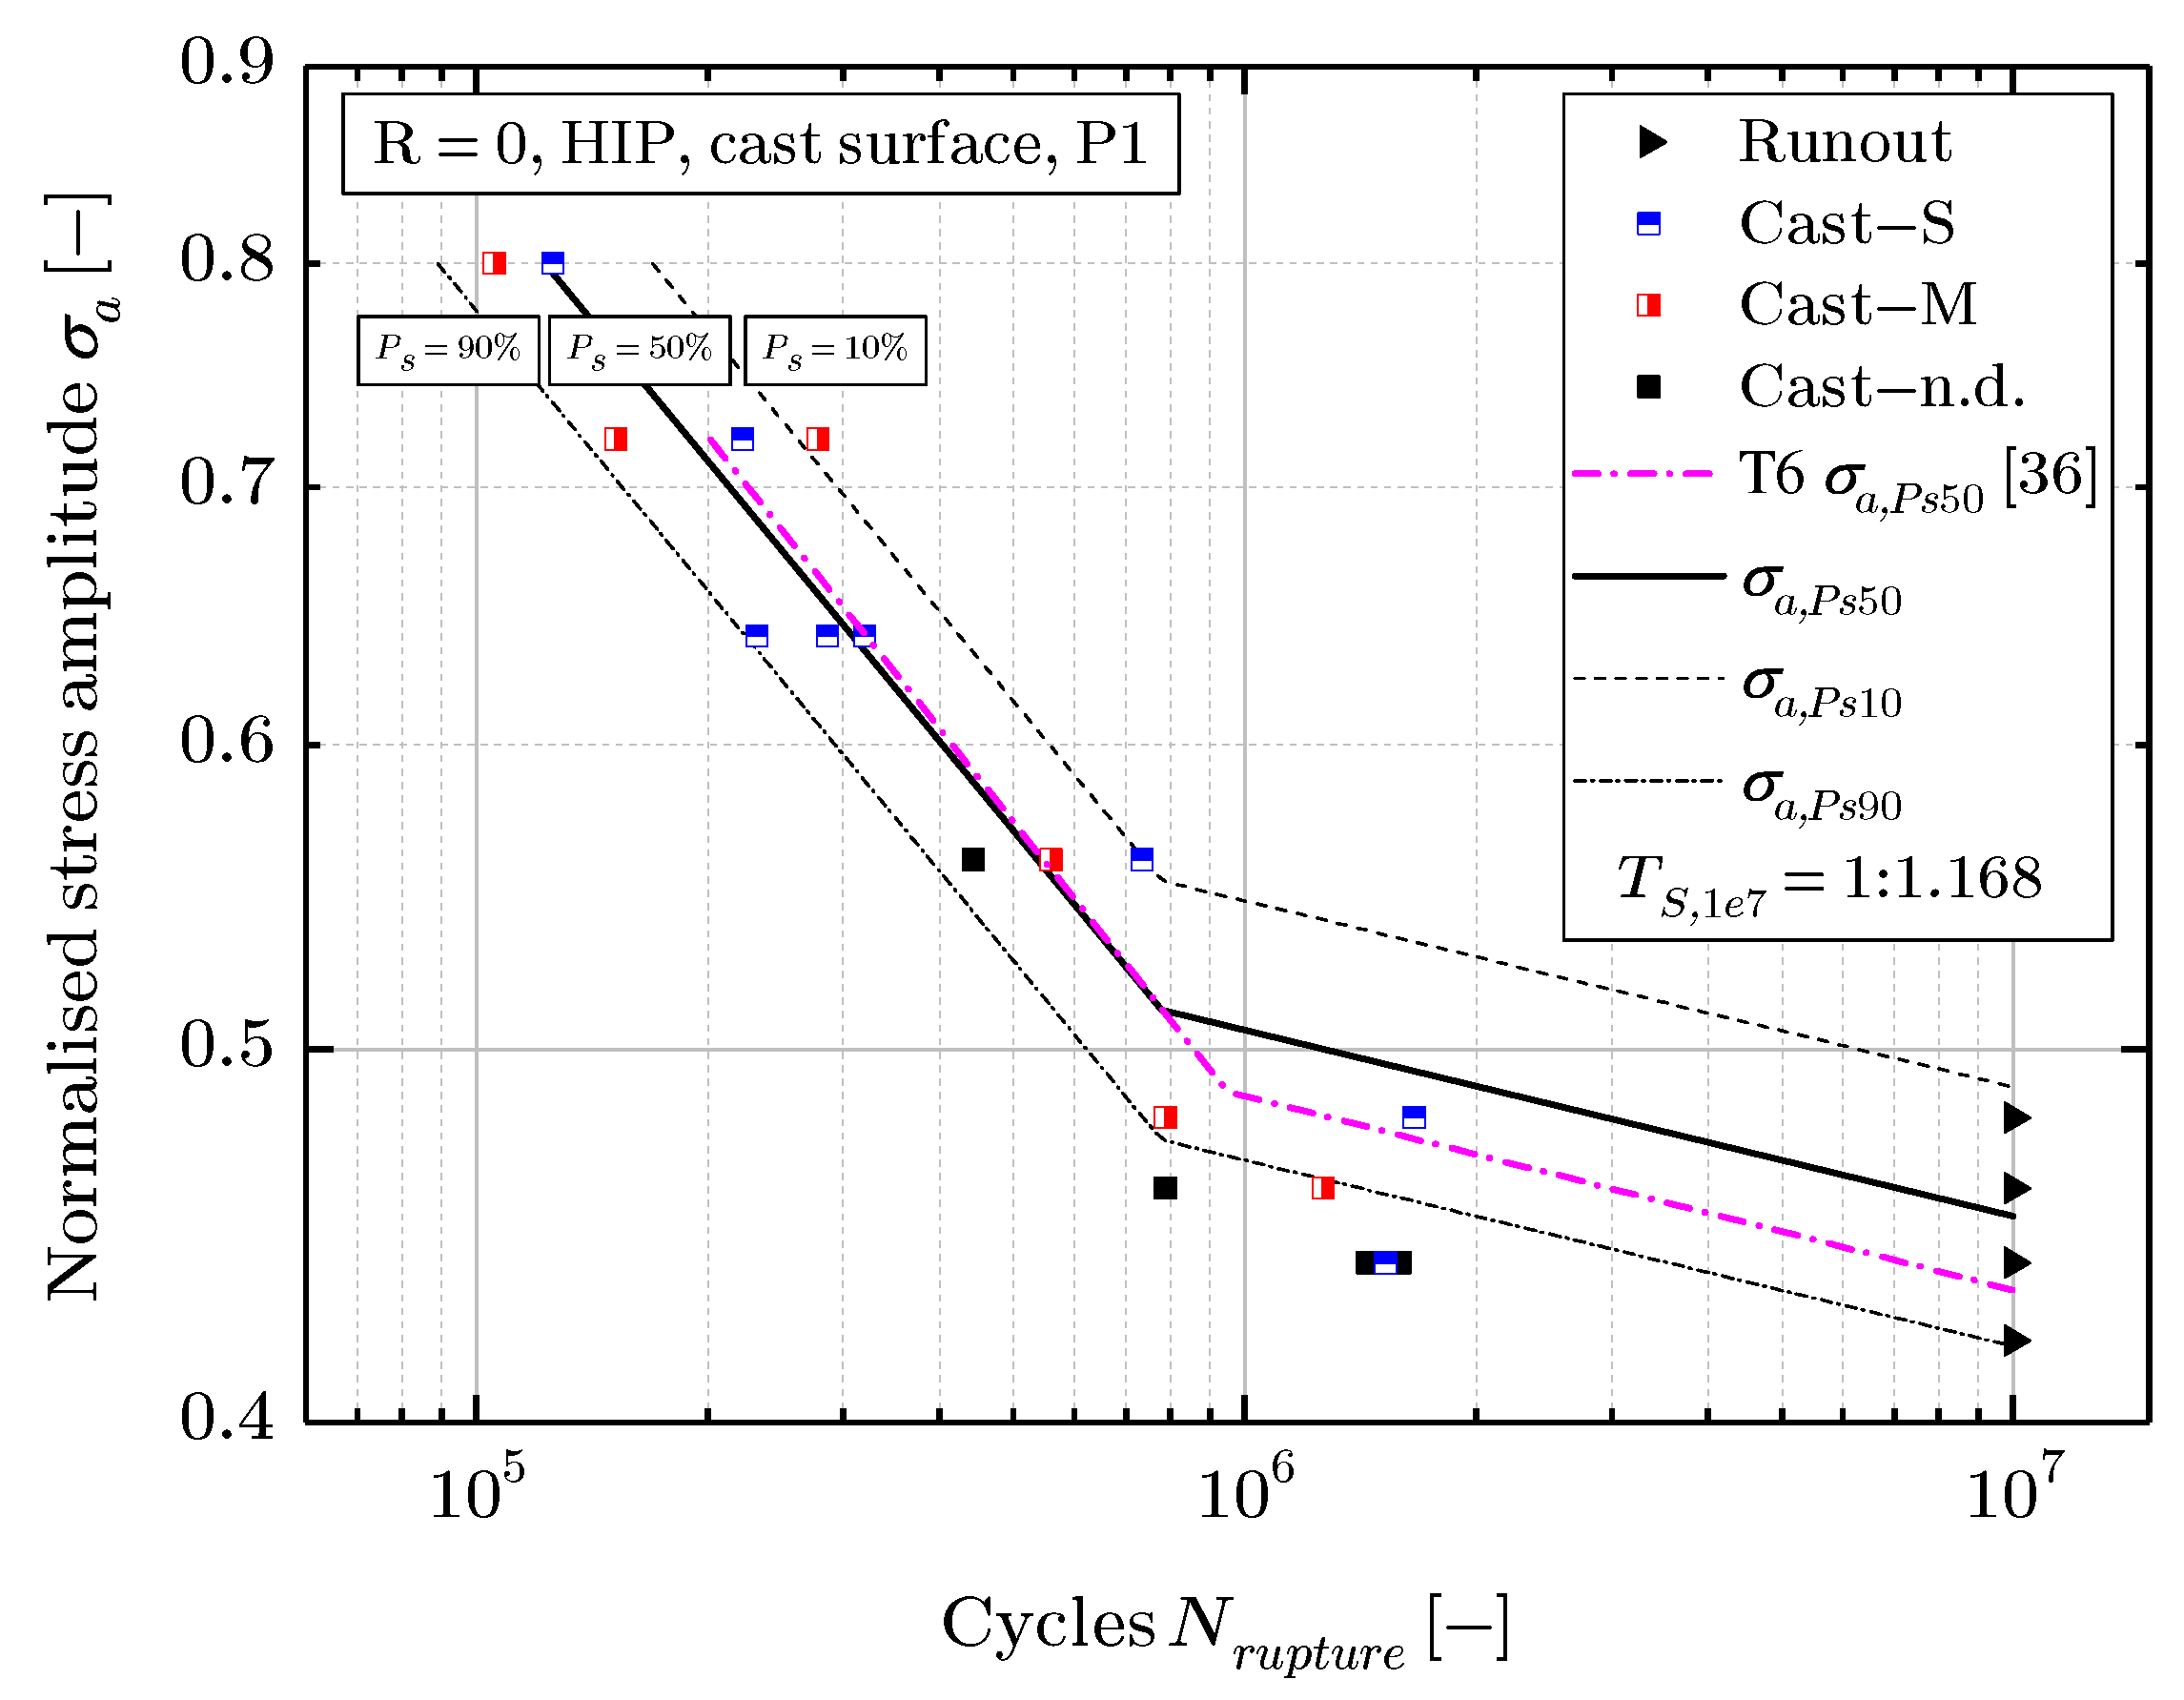
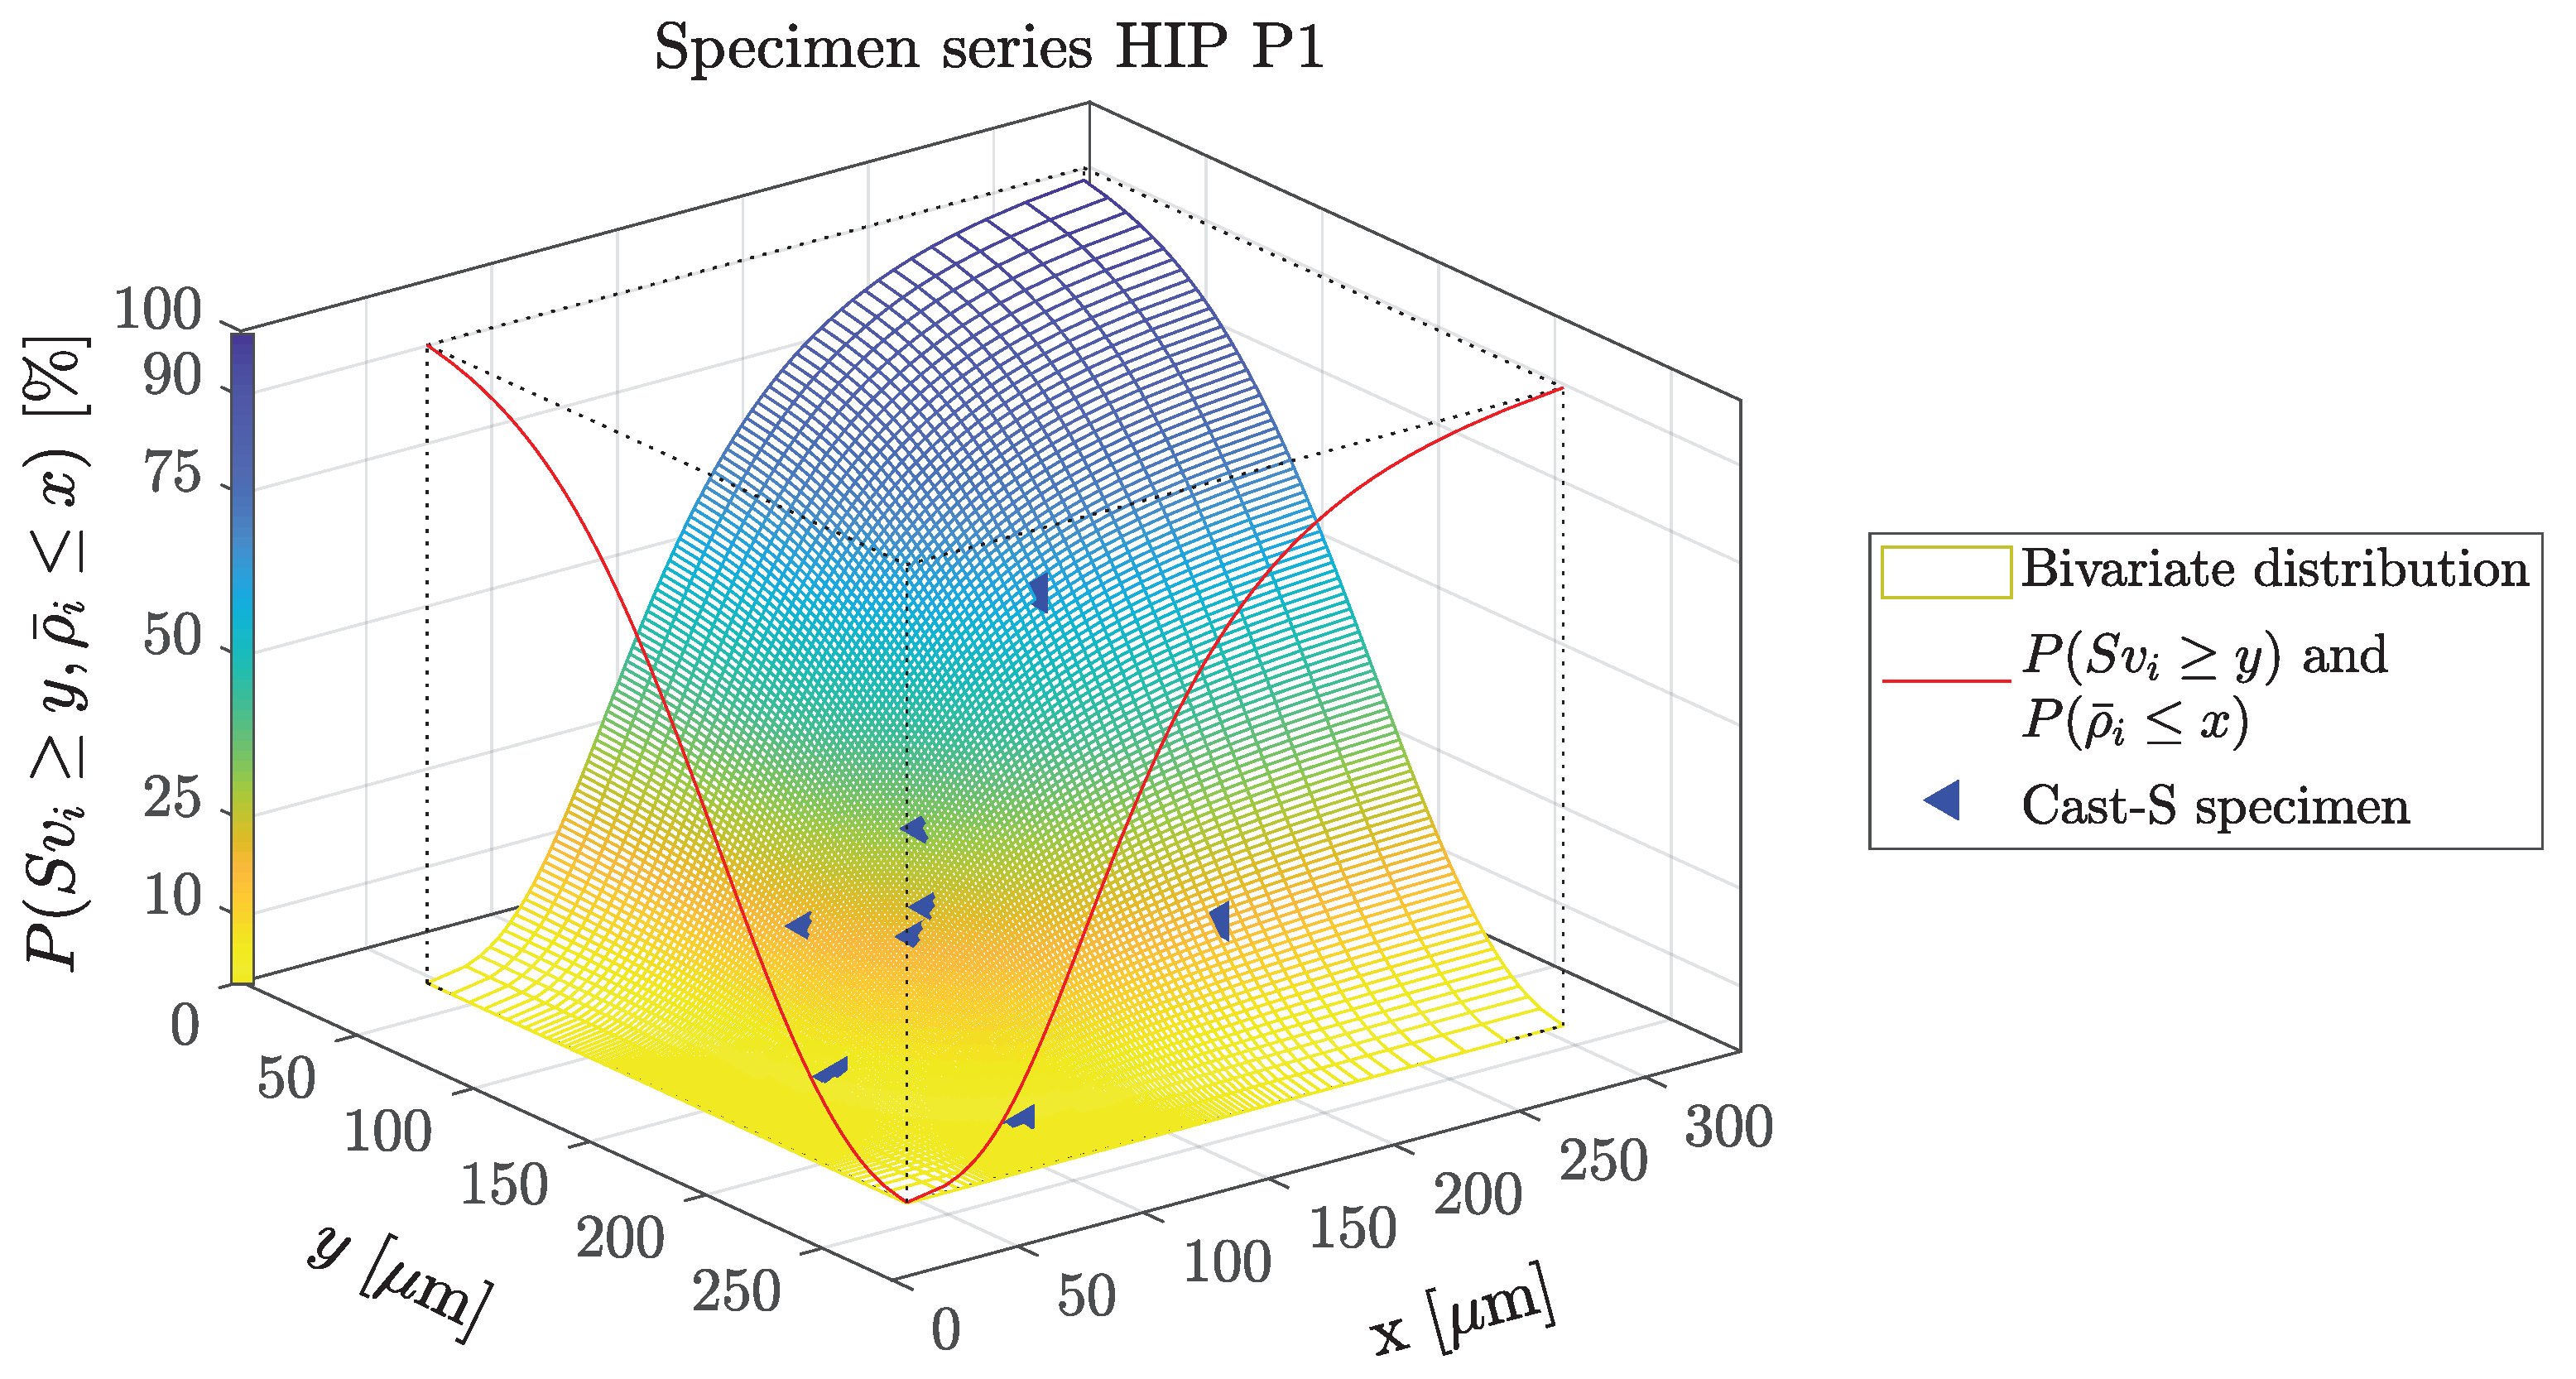
Figure 5 depicts the evaluated S/N-curve of the HIP specimen series at sampling position P1, which is similar to the original sampling position presented in [36]. The coloration of the markers is the same as in Figure 3. The accompanying fracture surface analysis revealed great similarity to those samples of the T6 P1 testing series in [36]. As the evaluation of the long life fatigue strength of the HIP P1 specimen series by means of the arcsin p method [54] would lead to a smaller scatter within the long life region compared to the finite life region, the normalisation process of S/N-curves was applied as proposed in [52,55], and also accordingly executed in [36]. The evaluated S/N-curve results are listed in Table 4 as well. Additionally, within Figure 5 the evaluated long life fatigue strength σ a , P s 50 of the T6 testing series with cast surface, as sketched in [36], is highlighted by the purple dash-dotted line for comparison.
At this point, it must be stated that the fact that Cast-M specimen fatigue results are similar to Cast-S specimens does not imply that surface layer porosity can be neglected. Both surface layer porosity and the cast surface texture showed similar fatigue results if the are evaluated independently. Thus, they both affect the fatigue strength in a comparable manner. However, if the cracks initiate combinatorial, as observed in Cast-M specimens, see Figure 4a,c, they lead to similar fatigue test results even if the defects are smaller. Summing up, smaller surface layer inhomogeneities and less detrimental surface texture combinatorial considered may be more crucial than a single, distinct surface pit. Therefore, they may be treated in a combined manner. For more information regarding the combinatorial failure mechanism see the work in [36].

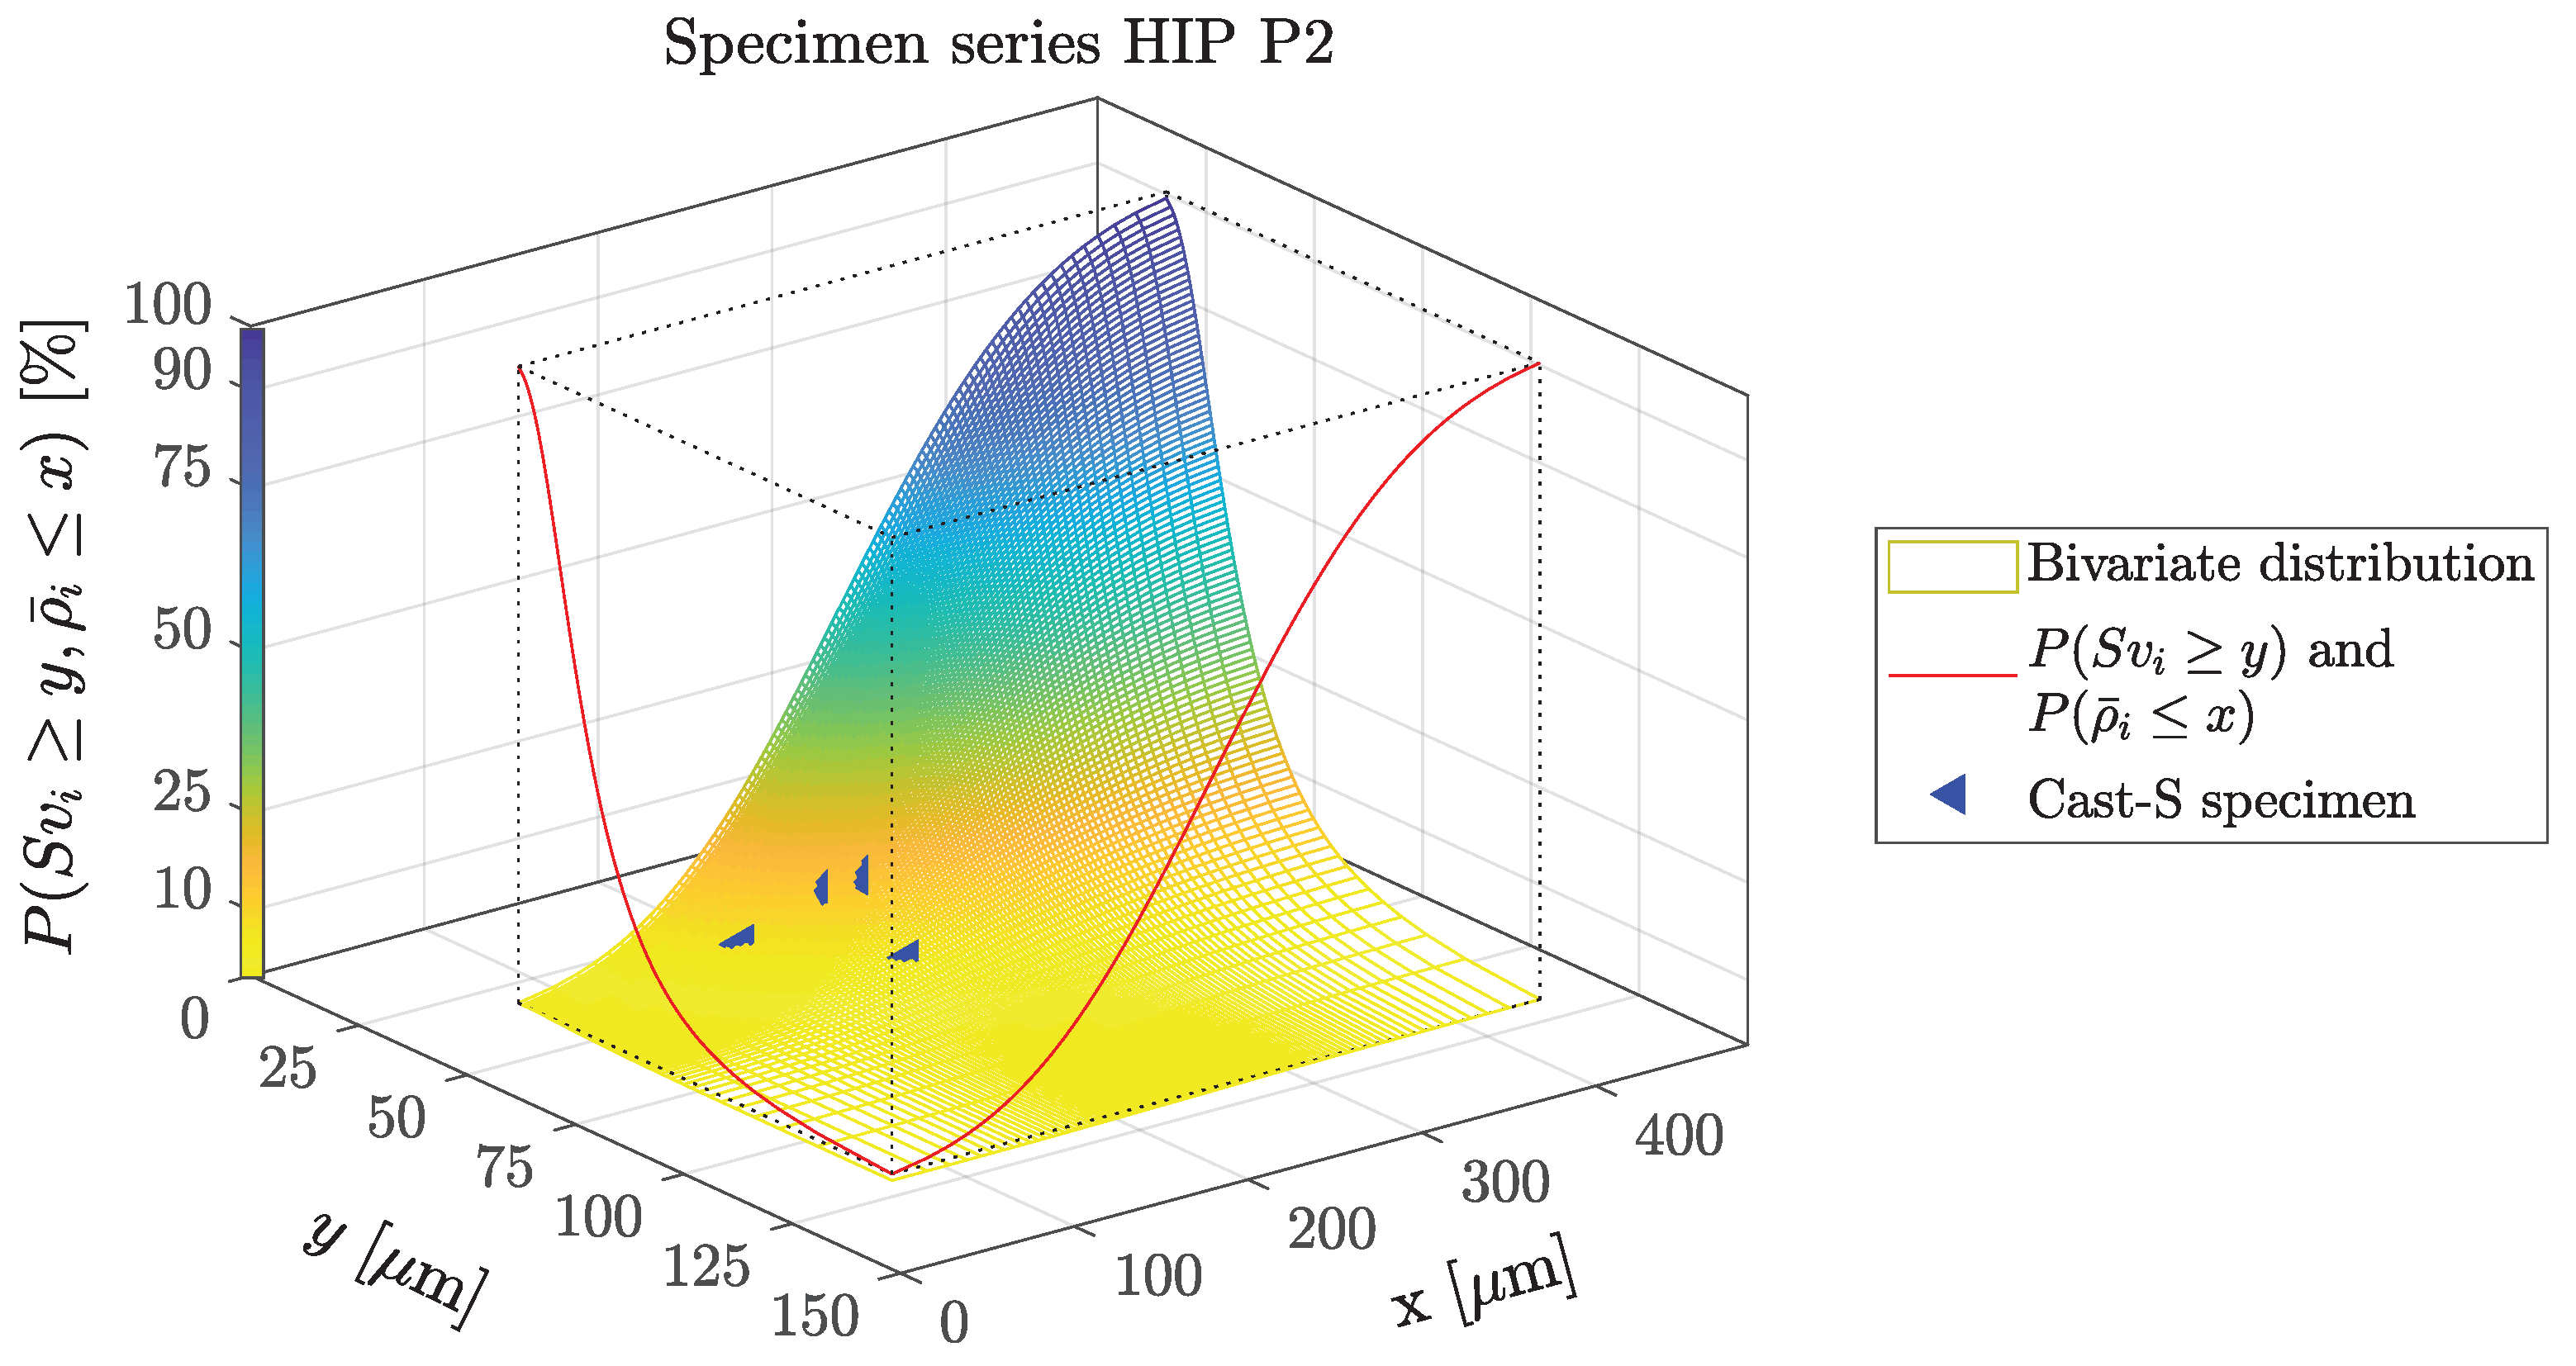
HIP Effect on the Cast Surface Layer

While the HIP process leads to significantly enhanced fatigue strength results in terms of bulk material testing [45,50,56,57,58,59], this effect was not present for any of the investigated HIP cast surface series. While for one HIP P1 testing series the evaluated long life fatigue strength σ a , P s 50 was above the T6 value (as presented in Figure 5), the other HIP P1(2) testing series the σ a , P s 50 was slightly lowered, but both within the 90% and 10% stress scatter band of HIPped samples. In terms of Cast-S specimens, it was found that the evaluated surface roughness values, and therefore the estimated fatigue strength by means of the introduced fatigue assessment model, was comparable to those of the cast T6 P1 series. Therefore, it is reasonable that the Cast-S points of the HIP P1 specimens in 
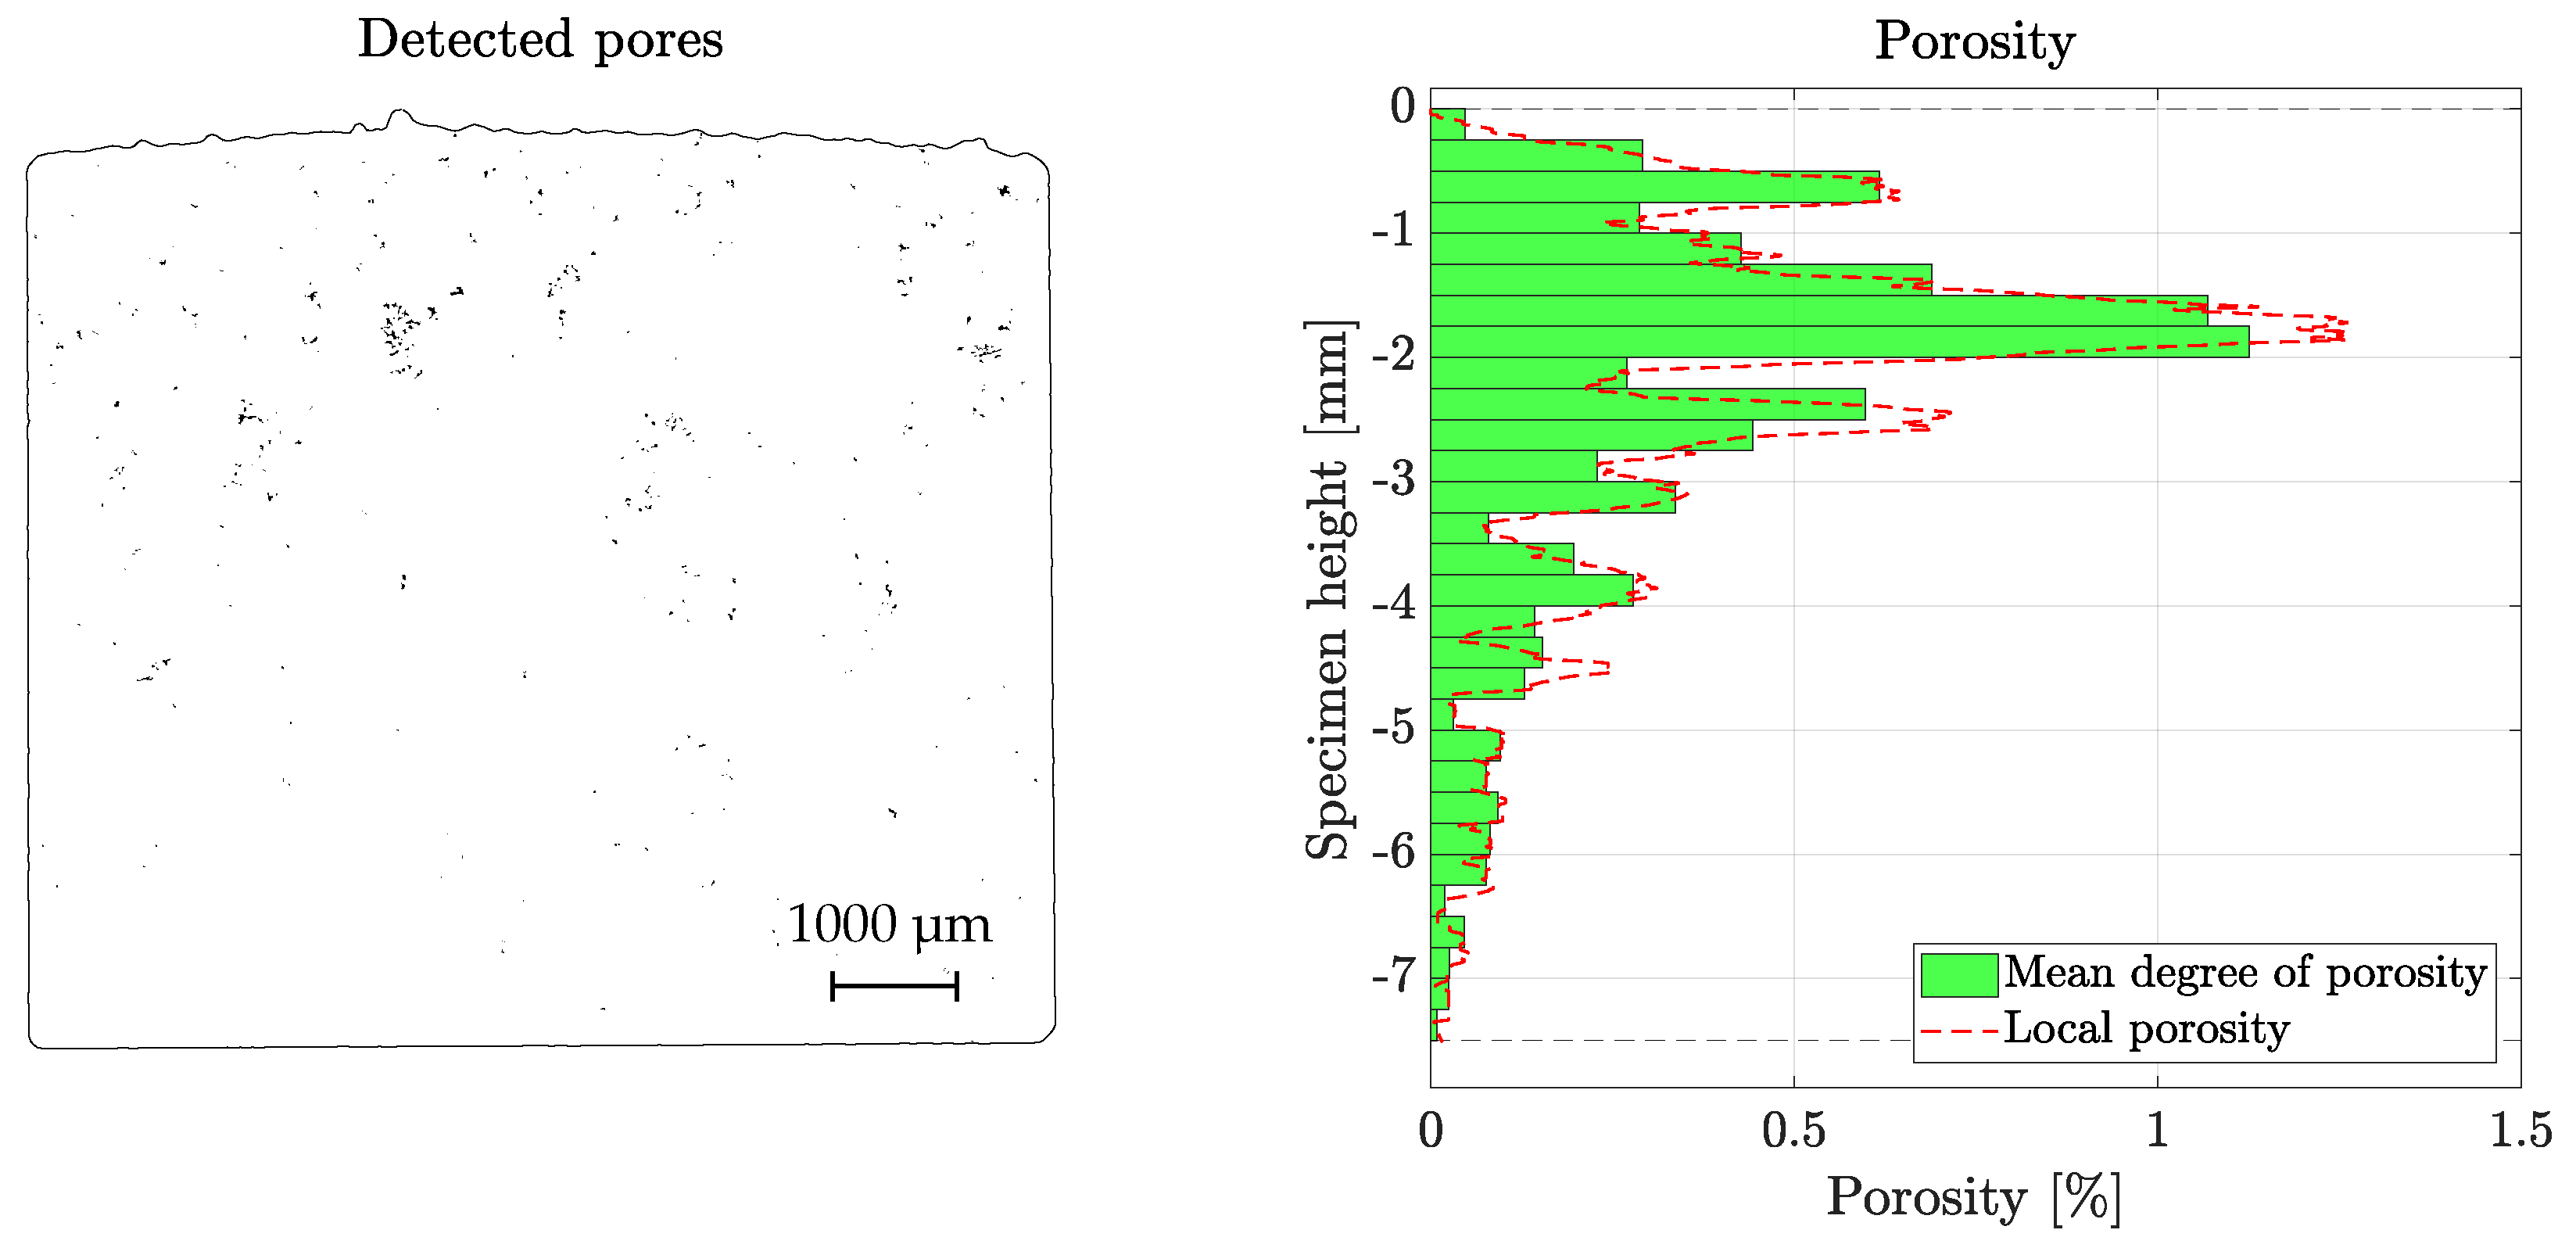
Figure 5 fit to the cast T6 P1 S/N-curve. However, regarding the Cast-M specimens, one may expect a significantly higher fatigue strength due to closed shrinkage porosity. Investigations on metallographic T6 specimens revealed a higher porosity within the surface layer, especially up to a certain depth, see 
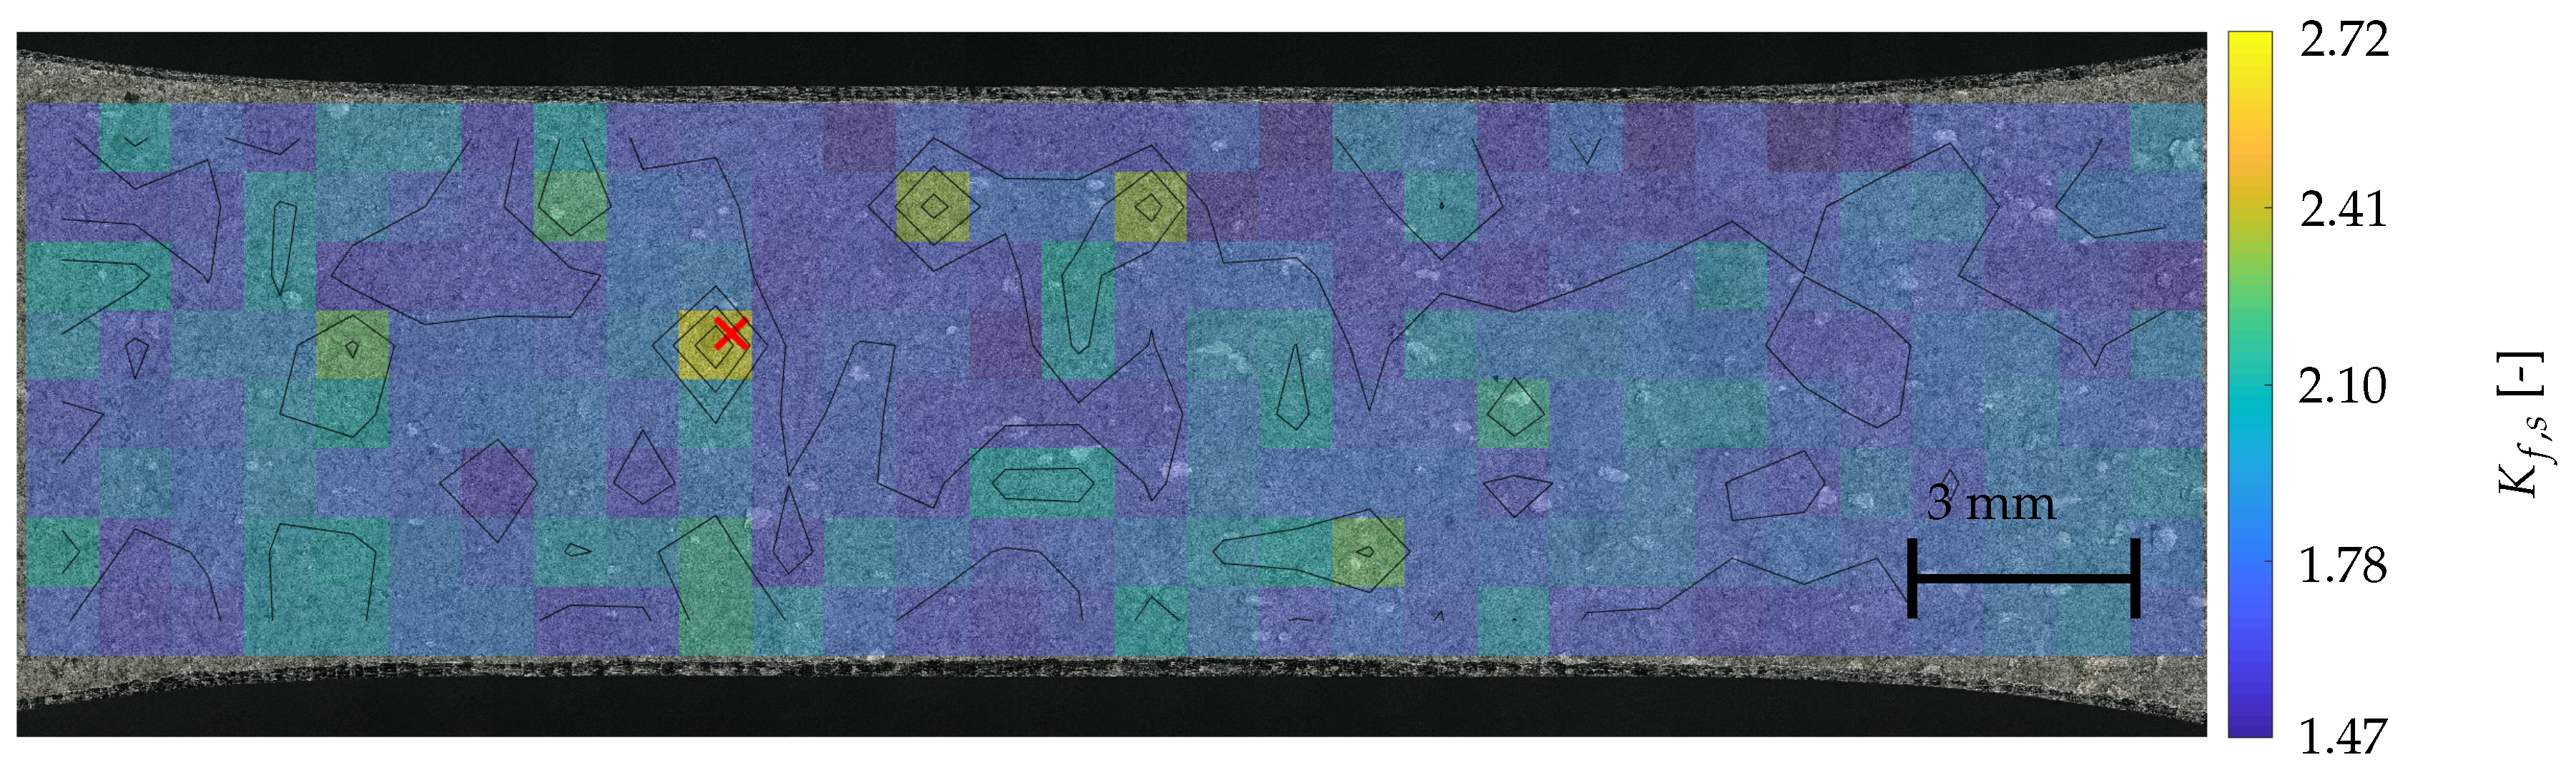
Figure 6. Almost without exception these were shrinkage pores evolving during the solidification process. The left sub-figure shows the detected micropores, while on the right diagram the evaluated degree of porosity is plotted. By means of a user defined routine, pores are detected on a metallographic specimen, which have been captured by means of a digital optical microscope. The degree of porosity was then evaluated by counting the black pixels of the picture, which have been determined as pores, in relation to the white pixels within the same horizontal line. Subsequently, mean values of the degree of porosity have been calculated within a vertical range of 250 µm. It is clearly recognisable that the highest degree of porosity occurs in about 1 mm to 2 mm depth measured from the cast surface. To achieve information about the spatial distribution of the micropores, the metallographic specimen was subsequently grinded, thereby removing about 100 µm, and subsequently evaluated again. This methodology hast been carried out several times for four T6 specimens, resulting in 140 metallographic analysis in total. It emerged that the trend of degree of porosity, as depicted in Figure 6, is representative for the T6 P1 specimens series. An increased degree of porosity near the cast surface of AlSi castings was also stated by Leitner et al. [60]. This increased porosity formation may be reasoned by the oxide entrainment mechanism as a result of turbulent mould filling, see [61,62,63]. However, a comprehensive insight in the degree of porosity can be more properly evaluated by means of XCT-scans [21,60].
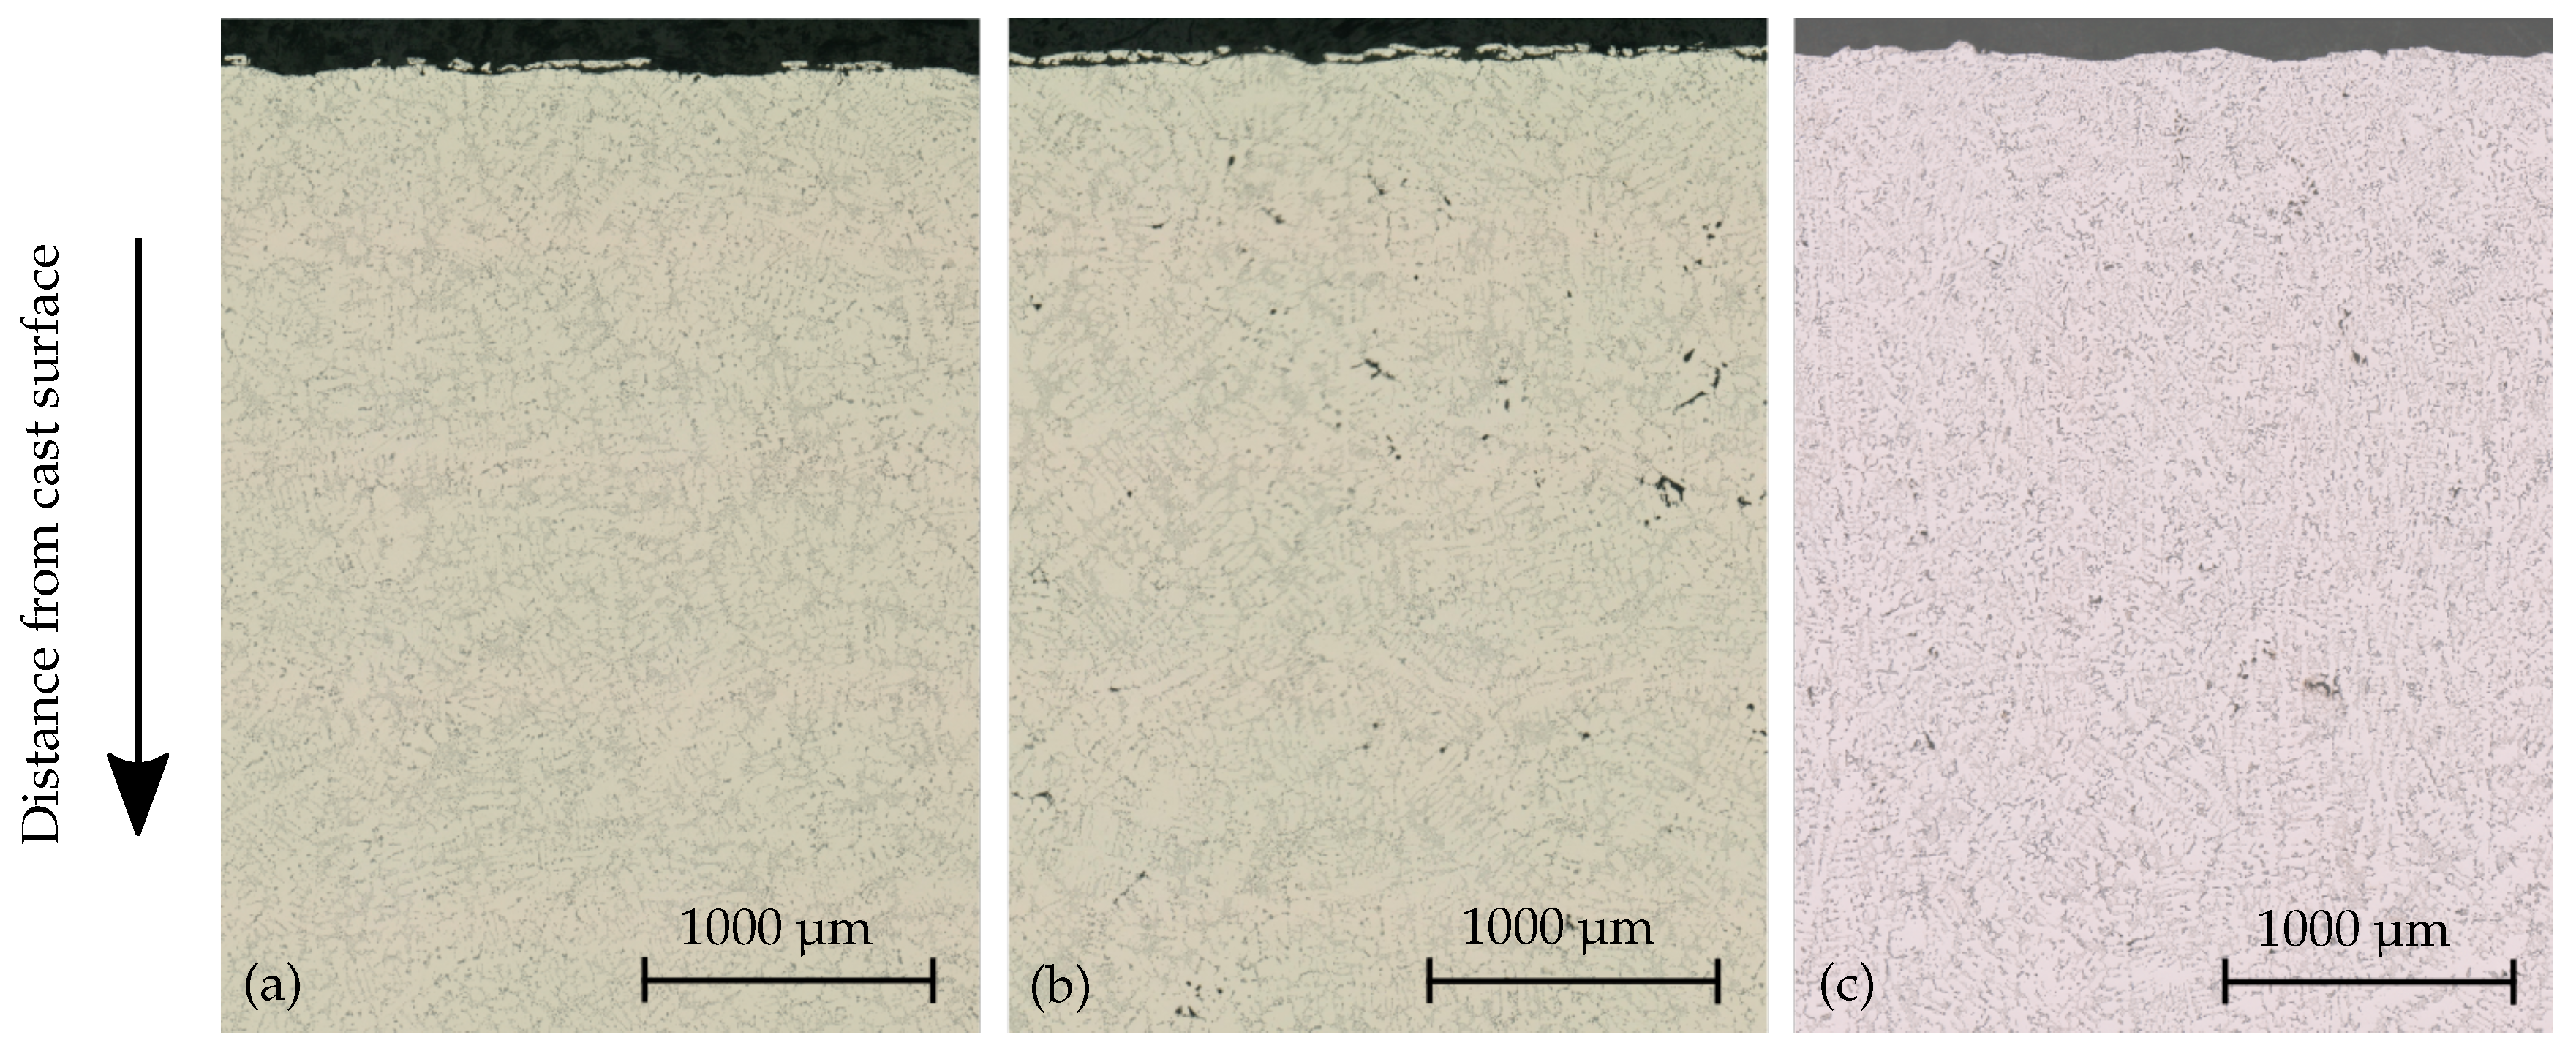
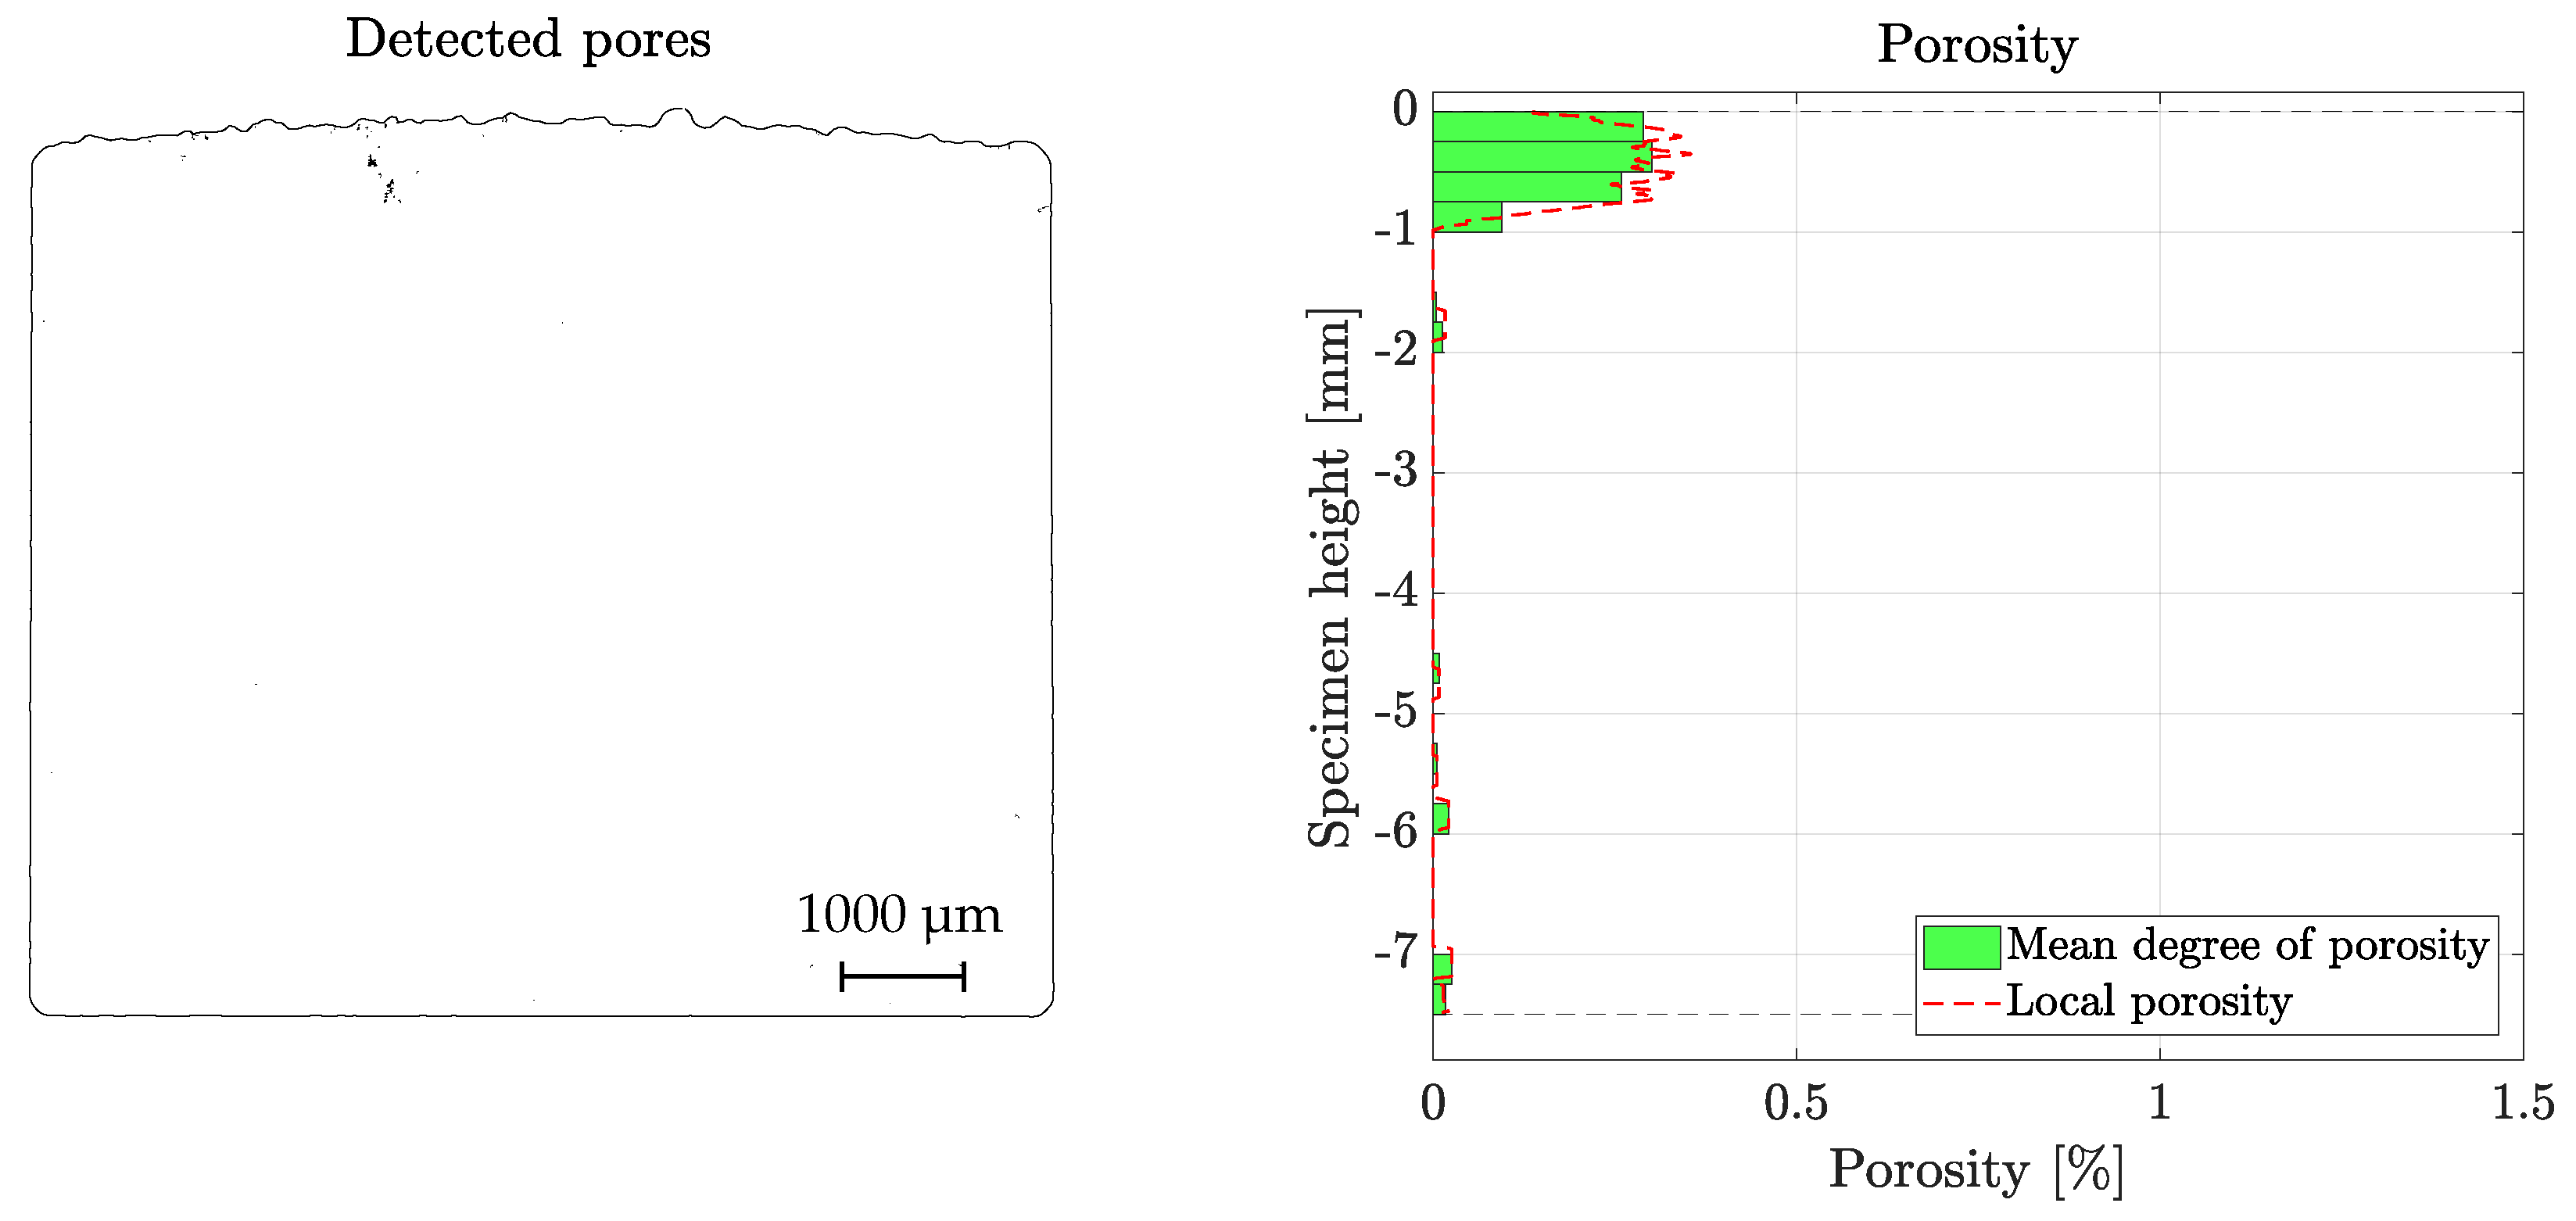
The same investigations and evaluation procedure have been conducted for four HIP specimens, again resulting in 140 metallographic analysis slices. A representative result is depicted in Figure 7. It is clearly recognisable, that the HIP process lead to significantly reduced, or even partially completely suppressed porosity within the bulk material. Only within the first mm in depth, porosity was still observable whereat the HIP process did not close these micropores. As this is within the highly stressed region of the specimen, crack initiation is still caused by those surface roughness and microporosity mixed cases (Cast-M), thus resulting in similar long life fatigue strength values as previously discussed.
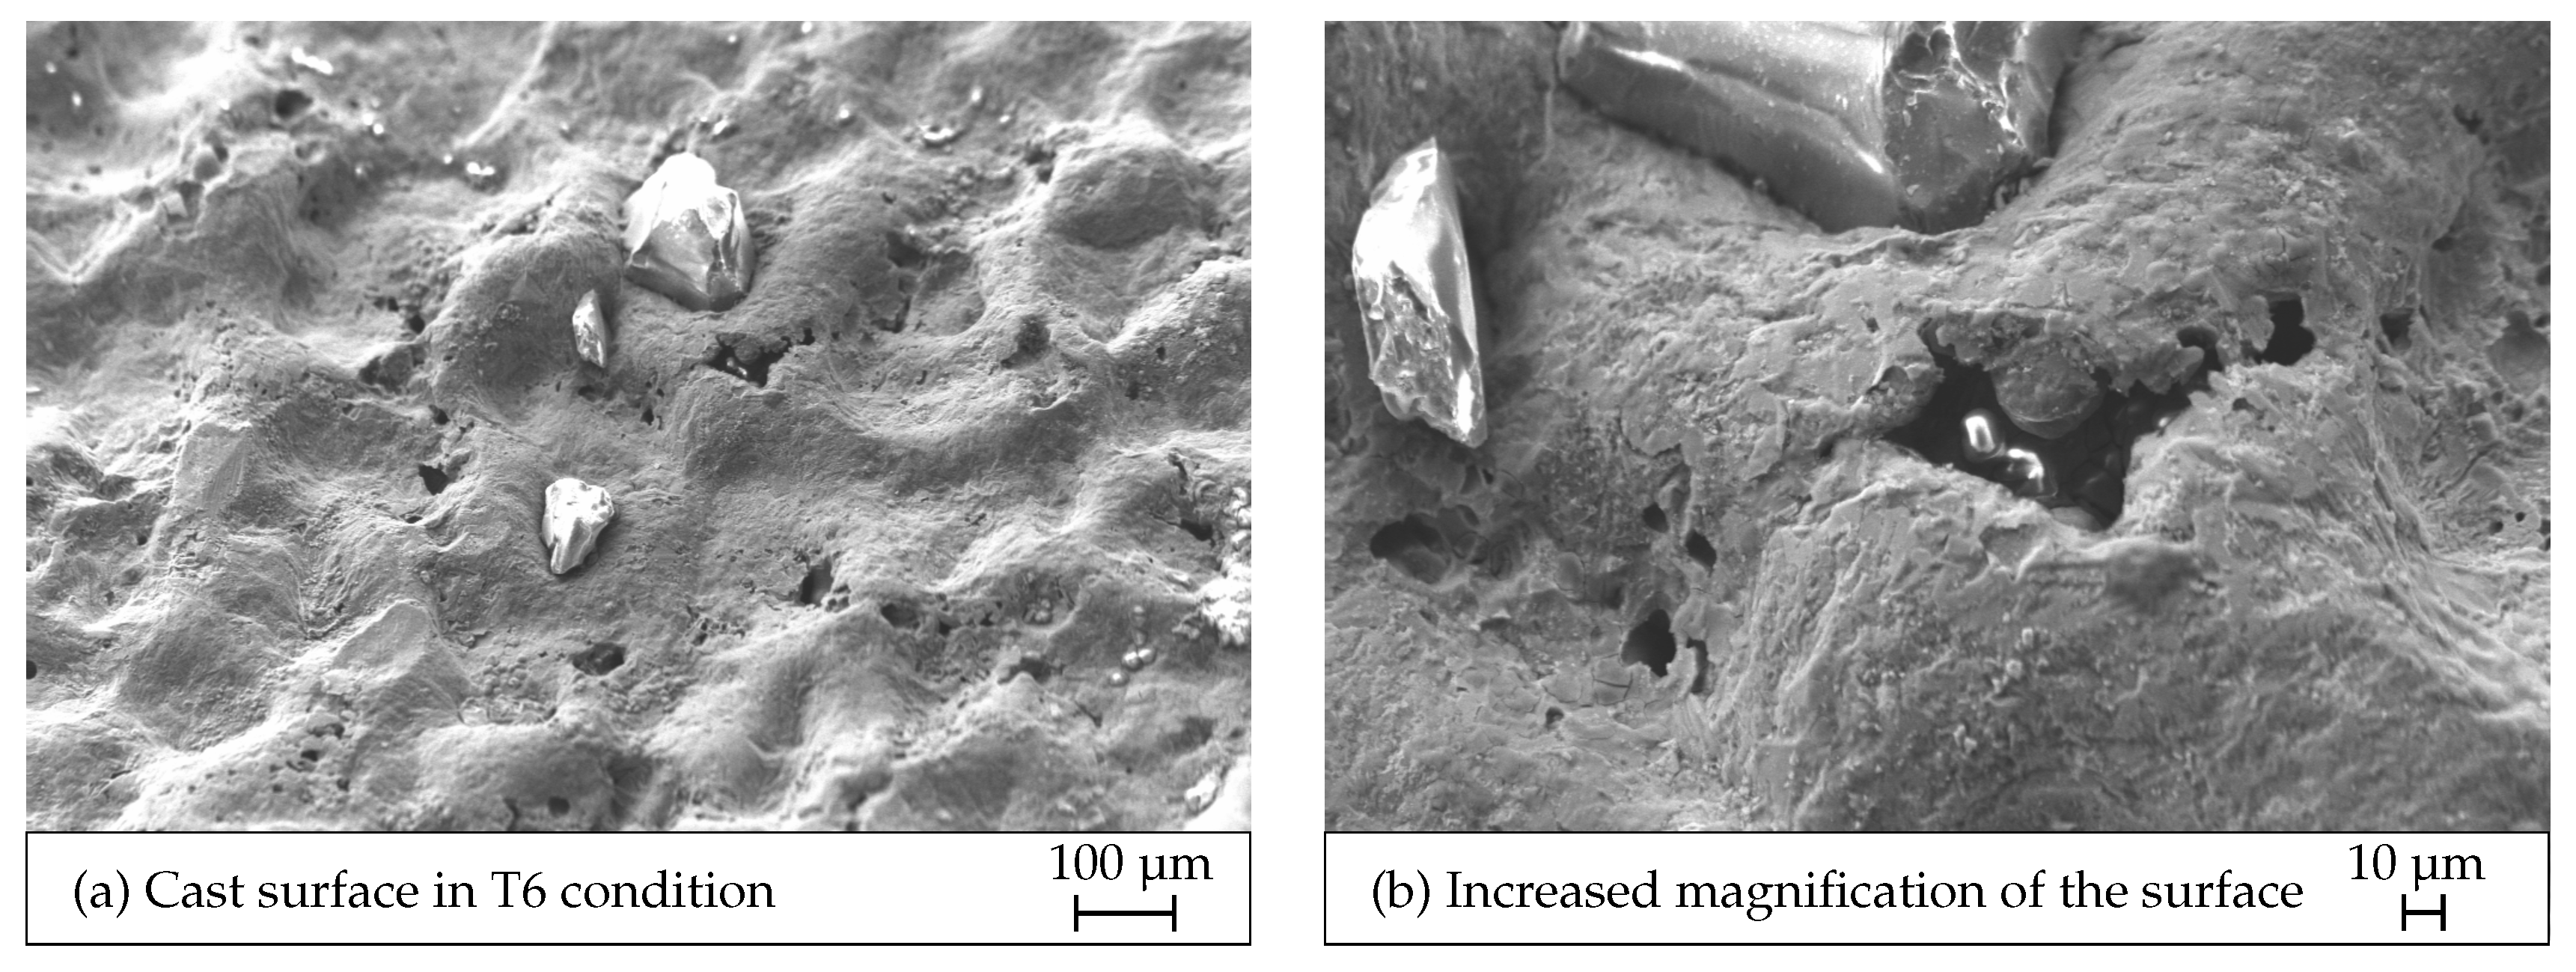
The comparably high possibility of observing a mixed (Cast-M) defect case becomes visible by a comparison of the cast surfaces in T6 and HIP condition by means of SEM. Figure 8a,b depicts SEM images of the cast T6 surface at sampling position P1. Both sub-figures show that the cast surface is frequently broached by cavities, or shrinkage pores. Those cavities can be found both within surface pits as well as at surface peaks. In Figure 8b, even the dendritic structure of the α -phase is observable. Thus, a relatively high chance of crack initiation occurring at a combination of both surface pits due to the surface roughness and surface layer porosity is present.
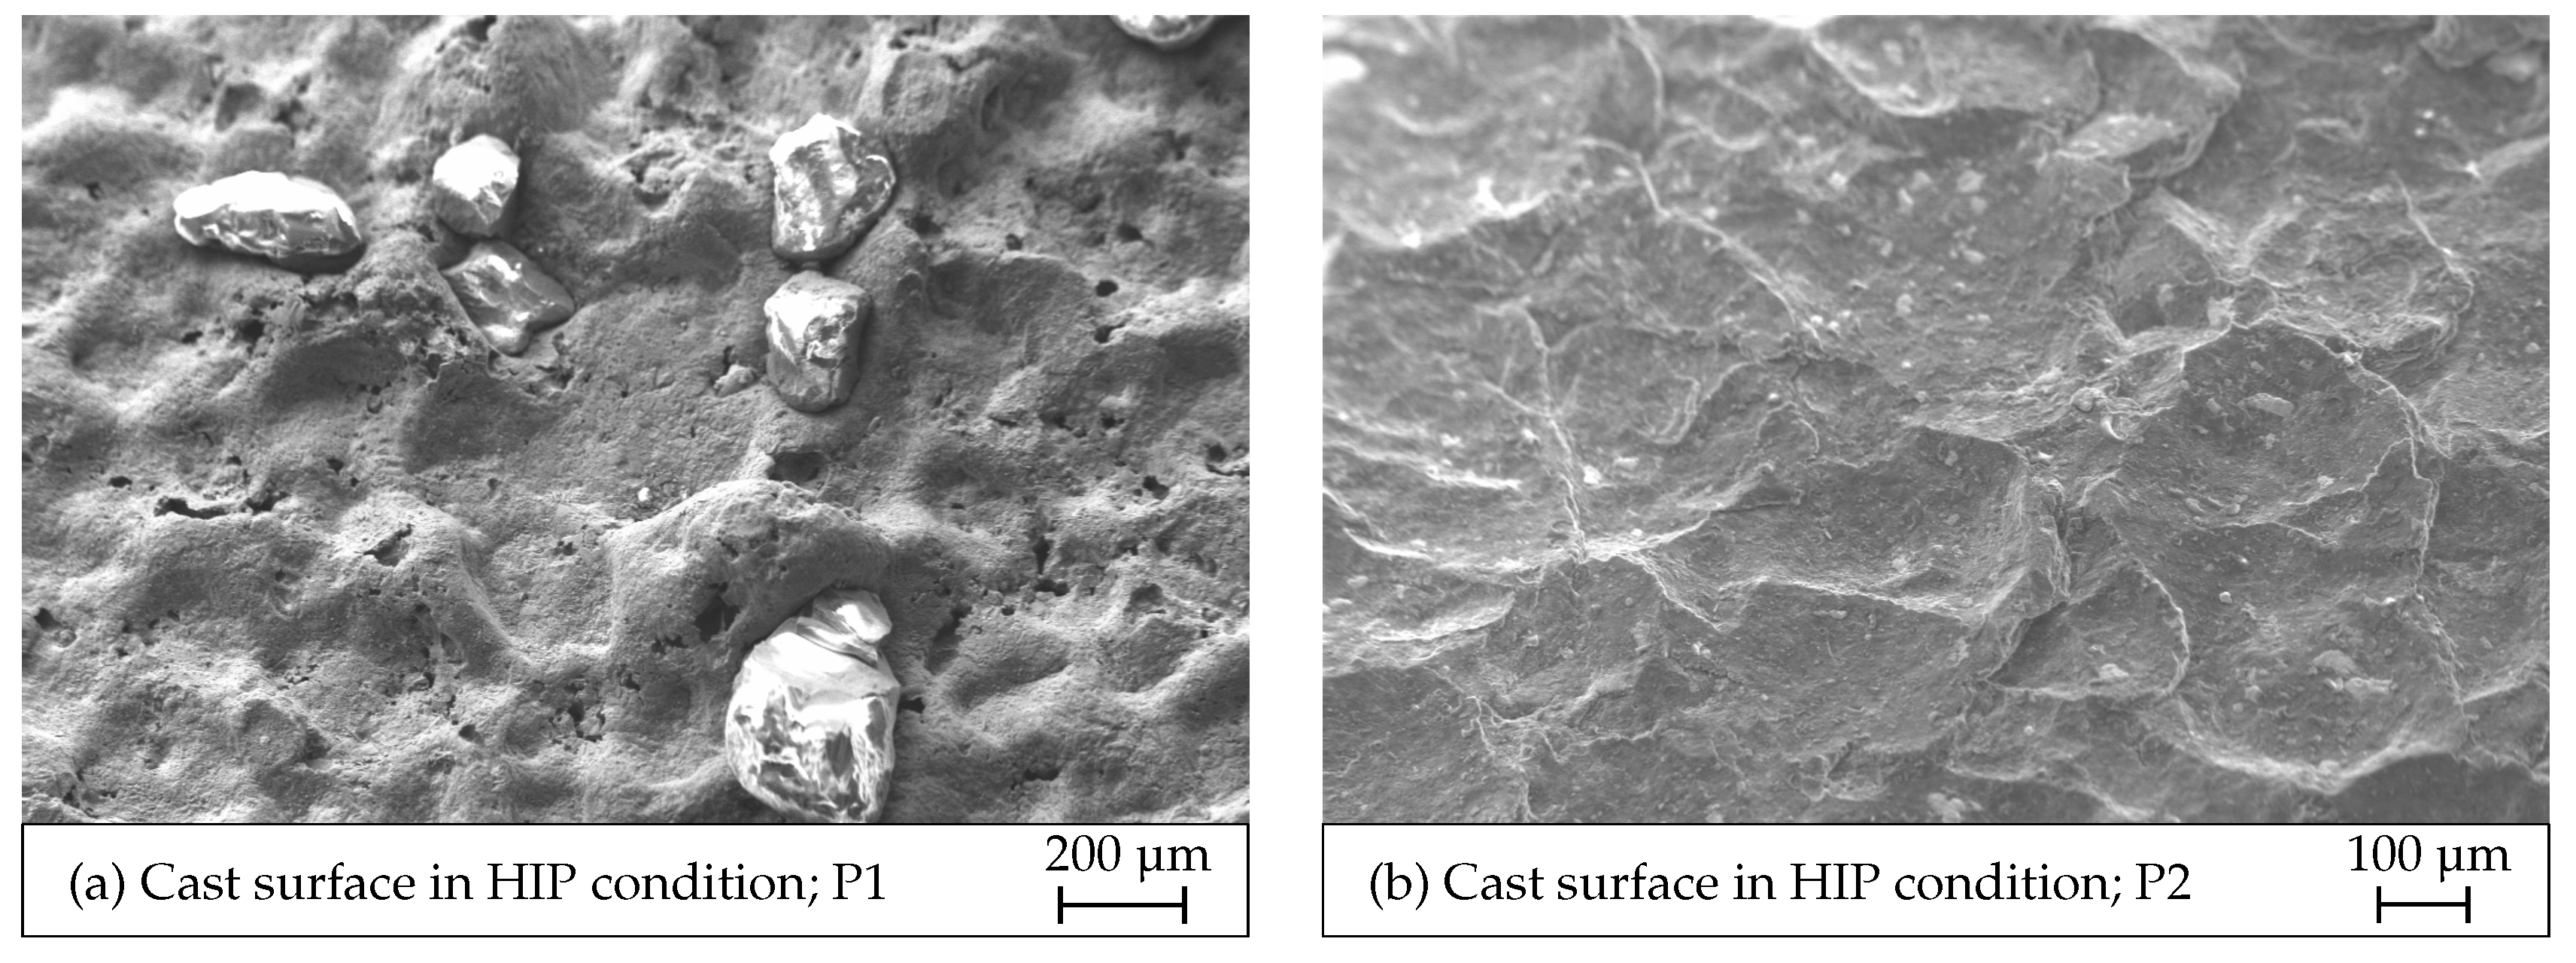
In Figure 9, the SEM images of the investigated cast surfaces in HIP condition are illustrated for both sampling position P1 and P2. For cast surface texture comparison purpose, Table 5 lists the mean values S a m e a n of the global S a roughness parameter of all specimens, in respect to the sampling position. Additionally, the 10–90% scatter values are given. The cast surface of P1 (Figure 9a) is basically identical to the cast surface in T6 heat treatment condition presented in Figure 8a. Especially broached pores are again observable in a similar amount. Those cavities and dendritic canals, created by the solidification process, can reach down to about 1 mm in depth in some cases, as those micropores can not be closed by the HIP process. This matches the statement of Atkinson [56] on surface connected porosity. Thus, it can be stated that if, subsequently to the casting process, the machined surface finish is conducted with the aim of removal of surface near porosity, the process has to cover a certain depth. For the exemplified case of Figure 7, removing only 0.5 mm of the cast surface would lead to a broached pore. As broached pores essentially decrease the local fatigue strength as well, such a machining process would not have the intended favourable fatigue effect and lead to similar fatigue strength results as those including cast surface, as presented in [36]. For the cast surface in HIP condition at sampling position P2, see Figure 9b, no broached pores were recognisable on the surface. This matches the results of the HIP P2 fracture surface analysis, where predominantly surface layer pores have been observed which are not broaching the cast surface, but are located about 10 µm to 30 µm beneath. As already mentioned, this might be caused by the significantly increased solidification rate at this sampling position P2 compared to P1.

4. Fatigue Assessment Model

This section contributes to the alteration of the fatigue assessment model as originally presented in [36] on HIP surfaces as well as on sampling position P2, which possesses a significantly different surface roughness. Thereby, the model‘s application range in terms of surface roughness parameter values is studied.

4.1. Modification of the Model

First, the local roughness values S v l o c a l and ρ ¯ at the crack initiation point as well as the modified parameter S v r e v were evaluated. Originally, S v r e v was introduced as the mean value of crack initiating surface pits and it has been substituted as a statistical parameter, based on the most critical surface pits. It represents the value with 50% probability of occurrence of the five biggest S v sub-area valley depth distribution ( S v i GEV), which is referenced in detail within Section 5. It was found, that the in [36] presented exponents of a 1 = 0.6 and a 2 = 2 caused too conservative results for Cast-S specimen failures taken from sampling position P2. Thus, these parameters have been adapted to a 1 = 0.4 and a 2 = 1.8 instead, to improve the range of applicability of the basic assessment concept.
For the Cast-M specimen failures, the introduced neural network (NN) in [36] has been adapted to only four neurons and four input variables. The pore location and elongation parameters e m i n , e m a x and α have been replaced by the statistical roughness value S v r e v . Thus, the overall condition of geometry dependent distinct roughness values is now considered by S v r e v . Therefore, only the defect size a r e a , the local maximum pit height S v l o c a l , the equivalent notch root radius ρ ¯ and the statistical pit depth with 50% probability of occurrence S v r e v act as input variables. The network was further trained by four specimens of the HIP P2 testing series in addition to the twenty-five T6 P1 specimens from [36]. The coefficient of determination for the training set was R 2 = 0.988, resulting in the interaction coefficients ψ , listed in Table 6. Therein, the mean values ψ m e a n as well as its standard deviation ψ s t d and the minimum ψ m i n and maximum ψ m a x values are listed in detail. The individual interaction coefficient ψ of each Cast-M specimen is subsequently used within Equation (4) for calculation of the mixed fatigue strength reduction factor K f , m by taking the fatigue strength reduction factor K f , p of surface layer microporosity and the surface fatigue notch factor K f , s of surface roughness-based notches as combinatorical defect case into account. K f , p is calculated by Equation (3), as introduced in [36].
K f , p = 1 . 6 · H V C 1 · H V + C 2 ( a r e a ) 1 / 6
K f , m = ( K f , s · K f , p ) ψ

4.2. Validation of the Model

After modification of the concept in order to improve the overall performance, the model was validated by means of the HIP P2 Cast-S data as well as the remaining two Cast-M specimens, which have not yet been taken into account for training of the modified neural network. The fatigue assessment result is depicted in Figure 10. The fatigue strength is normalised by the material‘s near defect-free long life fatigue strength σ L L F , 0 , which was evaluated at a load stress ratio of R = 0 under bending load at ten million load cycles. The black dashed line marks the long life fatigue strength with 50% probability of survival, taken from the fatigue testing, see Figure 3. The fatigue strength values for each specimen, received by the fatigue assessment model, are depicted in blue for Cast-S specimens and in red for Cast-M specimens. Additionally, for each specimen, the experimental fatigue test data point is extrapolated to one million load cycles and additional plotted into the Figure 10 and Figure 11 represented by σ a , 1 e 7 . Overall, the fatigue strength assessment is 7% conservative, regarding the fatigue strength σ L L F , , P s 50 with a probability of survival of 50% in respect to the experimental fatigue strength result σ a , P s 50 . The evaluated fatigue strength σ L L F , , P s 10 with a probability of survival of 10% is 6.1% conservative as well. The stress scatter index T S , 1 e 7 of the model results was evaluated by Equation (2). At this stage, only six specimens from the HIP P2 testing series were available for validation; however, the model lead to sound fatigue results so far for both, Cast-M specimens, as well as Cast-S specimen, where no neural network was involved for prior fatigue strength assessment. The experimental and model-based fatigue strength results of the validation series HIP P2 are compared in Table 7.
To prove the fatigue assessment model‘s applicability to HIP-treated cast surfaces even further, the specimen series HIP P1 was used for additional validation. Figure 11 shows the calculated fatigue assessment results. Again, Cast-S specimens with crack initiation at a surface pit due to the surface roughness are marked in blue, and Cast-M specimens representing a combinatorial defect case with surface roughness and surface layer porosity interaction are marked in red colour. The model‘s long life fatigue strength at 10%, 50% and 90% probability of survival as well as the evaluated stress scatter index T S , 1 e 7 and the experimental fatigue strength of the associated S/N-curve σ a , P s 50 represented by the dashed black line, are again diagrammed. Both Cast-S as well as Cast-M specimens are well assessed, resulting in an overall 9.3% conservative long life fatigue strength design with a probability of survival of 50%. The stress scatter index increased compared to HIP P2, but still shows sound results as it is below the value of the associated S/N-curve, see Figure 5. An overview of the validation results of the HIP P1 series is also given in Table 7.
Table 7 also lists the validation results of the specimens series HIP P1(2) utilising 16 specimens. Further, as the assessment of Cast-S as well as of Cast-M specimens has been adapted, the validation data set of [36] with 14 specimens has been re-evaluated and is also given in Table 7, labelled as T6 P1. Utilising the modified fatigue assessment model, the result of T6 P1 becomes slightly more conservative compared to the results in [36] and the stress scatter index increased. However, the overall applicability in terms of sand cast aluminium surface layers with different heat treatment conditions, possessing cast surface textures and surface layer porosity is confirmed by this comprehensive validations sets. Summing up, the results of the estimated fatigue strength are about 6% to 9% conservative. Therefore, the introduced model supports an engineering feasible local fatigue assessment concept, to assess distinctions in cast surface roughness structures and their effect on cyclic endurance limit.

5. Probabilistic Fatigue Strength Assessment

The proposed surface fatigue assessment model utilises local roughness values evaluated at crack initiation points, identified by means of fracture surface analyses after fatigue testing. However, in engineering design, no a priori knowledge about surface texture is available, instead probabilistic values of the surface layer act as link to the manufacturing process dependent surface layer properties. Moreover, the random variable S v r e v , a parameter based on the distribution of distinctive S v sub-area values, is an important factor for an appropriate long life fatigue strength calculation. S v r e v should be evaluated with accurateness, necessitating a statistically based recommendation about the sample size of surface measurements.
Thus, this section contributes to the probabilistic assessment of crack initiating surface roughness pits. Previously conducted experiments on Cast-S specimens revealed that for mostly all cases, crack initiation occurred at one of the five deepest surface pits, respectively, one of the five highest S v values. However, not strictly the maximum value S v m a x of all evaluated sub-areas initiates a crack, as the notch root radius interacts in terms of notch stress effect. Concluding, the authors suggest to consider the five highest S v values of each investigated surface to be representative for statistical surface roughness effect. Subsequently, these surface valley series of five deepest depths is denoted by S v i with 1 i 5 . The following sections discuss the effect of sub-area size, statistical distribution, recommendable sample size of surface measurements and demonstrate finally a fatigue strength assessment based on probabilistic surface values.

5.1. Sub-Area Size Effect

First, for statistical characterisation of cast surface textures based on sub-area values, the required sub-area size has to be chosen. The effect of the selectable sub-area size is depicted in Figure 12. It shows the course of the unified mean value of the five deepest surface pits S v i , m e a n over the sub-area size. The five deepest surface pits are normalised against the ultimate valley depth of the surface S v m a x . Four randomly selected surfaces have been investigated covering both T6 as well as in HIP heat treatment condition, subsequently labelled as specimens 1 to 4. To study the effect of sub-area size, the surface structures are evaluated for the same scope of each specimen. The three pictures (panels (a–c)) within Figure 12 all have the same dimensions and show the same region of the cast surface of specimen 1. In terms of 1 mm × 1 mm sub-area size (Figure 12c), the roughness pit is covered basically by a single patch. As originally published in [36], the S v value of a sub-area size A s u b is evaluated according to Equation (5).
S v = | min A s u b z ( x , y ) |
Thus, the five extremal S v i valley depth values characterise five different surface pits. Comparing the result to the 0.25 mm × 0.25 mm sized sub-area evaluation in Figure 12a, it is recognisable, that at least two or more of the five patches now capture the same surface roughness pit in an adjacent manner. Therefore, no independent statistical description is achieved as the chosen sub-area regions are related. This effect of increasing characterisation of the same surface pit is also indicated within the diagram in Figure 12, as the unified ratio suddenly increases from 0.5 mm sub-area side length to 0.25 mm sub-area side length. Following this trend of continuously decreasing sub-area size, one would end at a ratio of nearly one, when all five sub-areas reflect the deepest spot within the deepest pit of the surface by their value. Of course, this sub-area characterisation also depends on the location of the sub-areas based on the original definition of the surface measurement frame. On the other hand, if the sub-area size is too big, possible crack initiating pits may get neglected, for example, let us assume three critical surface pits are close to each and they may be covered by only one pattern instead. Thus, also not leading to sufficient extreme value characterisation.
Finally, the recommendable sub-area size can also be linked to the sand grain size used in the mould which are typically within the range of 100 µm to 300 µm according to Campbell et al. [40]. As the sand grain sizes, observable in Figure 8 and Figure 9, are up to several hundred µm, a sub-area side length of 0.25 mm would be too small to reliable characterise a single surface pit. Taking these findings into account, the applied sub-area size of 1 mm × 1 mm is an appropriate and recommendable choice for the investigation of the present sand cast surface textures. At this point it should be mentioned that the measured surface should cover a large area of the cast surface to obtain enough sub-area entries reflecting the casting manufacturing process itself. Based on the chosen sub-area size, an amount of at least 100 patches should be evaluated. Within this study, approximately 240 sub-areas are within the investigated cast surface area per cast T6 or HIP-treated specimen.

5.2. Distribution Parametrisation

For statistical analysis, fatigue-initiating defects can be characterised by means of an extreme value distribution [64]. In terms of limiting extreme value distributions, originally three types have been defined by Gnedenko [65]: the Gumbel distribution (type 1), the Fréchet distribution (type 2) and the Weibull distribution (type 3). The applicable type is thereby determined by the distribution of the basic population from which the extreme value sample has been taken. Jenkinson [66] introduced the General Extreme Value (GEV) distribution, which covers those three types, and is therefore suitable for extreme value statistics. The formulation of the cumulative distribution function of the GEV is given in Equation (6). Therein, δ is the standard deviation (scale parameter), μ is the mean value (location parameter) and ξ is the shape parameter of the distribution. They are often estimated by means of the maximum likelihood method [67,68]. Based on the value of ξ , the type of the distribution is assigned, as the most appropriate GEV type is given by the data itself. Thus, the GEV distribution is frequently used to statistically describe the crack initiating extremal defect size [7,8,14].
P ( X x ) = x exp 1 + ξ y μ δ 1 ξ d y
According, the probability of occurence of an assessment value greater than a chosen threshold value x. is denoted as.
P ( X x ) = 1 P ( X x )
As outlined before, the five highest surface pit depth values S v i are well suited for parametrisation of a GEV distribution. As both sampling positions as well as the heat treatment of the surface vary, GEV parameters are evaluated to characterise each manufacturing process-based surface texture. Within Figure 13, three examples of GEV distributions are depicted. The green dash-dotted line symbols the GEV distribution of the T6 P1 validation series, whereas the other two HIP series are marked as yellow dashed line for sampling position P1 and as black continuous line for sampling position P2. Additionally, the S v i values of each evaluated surface are plotted within the diagram. The HIP P2 series showed the lowest extremal values S v i . However, comparing the GEV distributions of the HIP P1 series and the T6 P1 series at the same sampling position, the HIP P1 series exhibited higher values of S v i instead. It was observed that the HIP post treatment may affect the extremal S v i distribution but keeps the basic population mostly unchanged. It should be noted that the population itself is dependent from the local casting condition and thus no general course of surface valley depth is feasible, but the extremal values can be well parametrised to reflect the local casting process. Table 8 lists the evaluated distribution parameters of the S v i GEV distribution as well as the statistical parameter S v r e v . The value S v r e v is based on the associated S v i GEV distribution and is calculated as the value with 50% probability of occurrence ( S v r e v = S v i ( P = 50 % ) ) . This characteristic value is subsequently used in the derived fatigue strength model and characterises the extremal surface pits in a probabilistic manner.
Moreover, for a probabilistic fatigue assessment, the distribution of the equivalent notch root radius ρ ¯ has to be evaluated as well. The ρ ¯ values are taken from the identical sub-areas as the S v i values, thus characterising the notch root radius of the five deepest, most critical surface pits, and thus subsequently denoted by ρ ¯ i . In order to check for a linear dependency of the population of S v i and associated ρ ¯ i , the coefficient of determination R 2 , which is the squared Pearson correlation coefficient (SPCC) [69], was calculated as a measure for the strength of an assumed linear relationship. It is defined as the ratio of the covariance of two random variables A and B to their standard deviations S A and S B , see Equation (8).
R 2 ( A , B ) = c o v 2 ( A , B ) S A 2 S B 2
The results in a coefficient of R 2 ( S v i , ρ ¯ i ) = 0.01, which deduces, almost no dependency between S v i and ρ ¯ i . Thus, they are treated as two independent random variables. The evaluated GEV distributions of ρ ¯ i are diagrammed in Figure 14 and the fitted distribution parameters are also listed in Table 8. As, in terms of targeted fatigue strength, small notch root radii values are more crucial, the probability of occurrence has to be plotted inversely. Thereby, the T6 P1 series shows the lowest, respectively most critical notch root radii, while the HIP P2 series seems to possess mostly shallow notch curvatures.

5.3. Impact of Sample Size

For engineering feasibility it is essential for the design engineer to know how many surfaces should be assessed in order to receive statistically reliable information about the cast surface texture. To evaluate an adequate sample size of surface measurements for an assumed basic population, the following methodical procedure is suggested by the authors. The overall workflow is depicted in Figure 15, exemplified for the S v i GEV distribution by means of the T6 P1 specimen series. The S v i GEV distribution of the T6 P1 specimen series, presented in Figure 13, has been already obtained by means of 34 cast surfaces resulting in 170 S v i values in total (five values for each specimen). The evaluated GEV distribution parameters ζ , μ and δ in Table 8 are subsequently treated as main population parameters and support the generation of synthetic, random sample sizes. The dataset S1 acts as reference set as it is based on the original distribution parameters, while the set S2 is randomly derived. Both datasets are parametrised as GEV distributions, implying a stepwise evaluation of probability of 0.5%, leading to 200 equally distanced values. The two datasets S 1 and S 2 are assessed by means of the coefficient of determination R 2 .
Exemplary, let the synthetic sample size be one, and thus five random S v i values will be generated. This synthetically generated random values simulate new samples and thus are applicable for comparison. In the next step, the five random S v i values are fitted by a GEV distribution resulting in another ζ 2 , μ 2 and δ 2 of the synthetic sample set. Based on that distribution, the synthetic dataset S 2 is computed by calculation of n = 200 S v i values at equally distanced, stepwise (0.5% per step) increased probability of occurrence ( 0 . 5 % P 99 . 5 % ). Finally, the two datasets S 1 and S 2 can be opposed and assessed by the value of R 2 ( S 1 , S 2 ) . If, in this exemplary case, the GEV distributions of S 1 (based on the originally evaluated basic population inheriting a quantity of 34 samples) and S 2 (based on only one sample) would match, the coefficient of determination would be one. To obtain statistically reliable correlation measures, the procedure of randomly calculating and subsequent evaluation of S 2 is repeated several times. In detail, this R 2 ( S 1 , S 2 ) evaluation procedure has been conducted 100 times for sample size one before the sample size is stepwise increased as well.
The result of the sample size effect is depicted in Figure 16a for the distribution of S v i of the T6 P1 specimen series. Therein, the mean values of the coefficient of determination R m e a n 2 ( S 1 , S 2 ) are given for each sample size. Furthermore, the area of R 2 ( S 1 , S 2 ) values with a probability of occurrence higher than 10% is highlighted by the red area. Once the user-defined criteria (R 2 ( S 1 , S 2 ) with P 0 . 1 ) 0 . 99 is fulfilled, a satisfying correlation between the sets S 1 and S 2 , respectively, between the GEV distributions of the original and the synthetic samples, is achieved. This area is marked in grey within Figure 16a and was reached for sample size of nineteen in this case. It is clearly visible that the scatter of the R 2 ( S 1 , S 2 ) value decreases as the sample size increases. Thus, the original sample size of 34 investigated specimens has most likely already lead to a basically stable distribution.
The confidence interval of the distribution can be evaluated as well as a measure for change in mean S v i values. As for probabilistic fatigue assessment, both S v r e v and S v i rely on the distribution, a tight confidence interval has to be aspired. As S v r e v is defined as S v i ( P = 0 . 5 ) , the 80% confidence interval at P = 0 . 5 has been studied. For each sample size the evaluation loop of 100 repetitions lead to a certain scattering of the S v i values. Figure 16b shows the confidence intervals behaviour of the distributions based on the synthetic sample sets. The mean values of the upper and lower S v i confidence bounds are marked as red triangles per sample size, as well as their overall 10–90% S v i ( P = 0 . 5 ) area bordered by the black dotted line. The S v r e v value of 114, as listed in Table 8, is represented by the bold continuous black line. The evaluated sample size threshold from Figure 16a is also drawn, as well as the grey highlighted area whereat the user defined criterion is fulfilled. This indicates that, at the current sample size threshold, the S v r e v value is within 100 µm ≤ S v r e v ≤ 128 µm. This refers to a scatter index of ± 12% for sample size nineteen, respectively T S v i = 1 : 1 . 28 . If a tighter confidence interval is aspired, the sample size of surface measurements has to be increased.

5.4. Fatigue Strength Assessment

Utilising both the S v i GEV distribution of the roughness parameter S v and the ρ ¯ i GEV distribution of the notch root radius, a bivariate distribution can be evaluated. As it has been proven that S v i and ρ ¯ i can be handled as independent random variables, the combined probability of occurrence P ( S v i y , ρ ¯ i x ) can be calculated by multiplication of the two single probability functions following Equation (9).
P ( S v i y , ρ ¯ i x ) = ( 1 P ( S v i y ) ) · P ( ρ ¯ i x )
The bivariate cumulative distribution function is exemplary diagrammed in Figure 17 for the T6 P1 specimen series. Figure A1, Figure A2 and Figure A3, depicting the bivariate cumulative distribution function of the other investigated specimens series, are added in the appendix. The projected GEV distributions of S v i and ρ ¯ i are additionally plotted as red lines and the surface mesh color depends on the value of P ( S v i y , ρ ¯ i x ) . The available Cast-S specimens of this series are marked in blue.
Concluding, the surface fatigue assessment model can be applied utilising this probabilistic surface texture values. The result is the probabilistic cast surface long life fatigue strength σ L L F , s ( P ( S v i y , ρ ¯ i x ) ) , which is normalised to the near defect-free long life fatigue strength σ L L F , 0 , as diagrammed in Figure 18. The mesh colour again highlights the combined probability of occurrence P ( S v i y , ρ ¯ i x ) . The 3D-view is additionally depicted from all three axis projections (Figure 18a–c) to show the model‘s fatigue life dependency. By comparison of the ρ ¯ i -plot (Figure 18a) with the S v i -plot (Figure 18b) it is recognisable that, although both parameters do have an effect on the fatigue strength result, the notch depth, respectively, surface pit depth S v , is more pronounced.
This probabilistic fatigue assessment procedure facilitates an engineering feasible fatigue design by providing reliable calculation of the long life fatigue strength, utilising the probability of occurrence of the two statistical model parameters S v i and ρ ¯ i . Based on the fatigue design safety requirements, the designer can obtain the long life fatigue strength by comparably low effort in surface measurements and surface texture evaluation.

6. Discussion

The presented fatigue strength assessment approach, reparametrising the model introduced by Pomberger et al. [36] for sand cast aluminium surface layers with T6 heat treatment, has been applied on two HIP-treated testing series at similar sampling positions (HIP P1 and HIP P1(2)). Furthermore, another cast surface with significantly reduced surface roughness has been investigated (HIP P2). By means of the reparametrised exponents a 1 and a 2 , the HIPped validation specimen series, refer to Table 7, as well as the validation series from [36] (T6 P1) showed sound results in terms of long life fatigue strength estimation. Due to the diversification of measured surface roughness data, this concept is now valid to a wider range of cast surfaces. Moreover, current research investigations apply the introduced method also on additively manufactures surface textures.
The HIP-treated cast surfaces revealed that the surface layer pores have partly not being closed. This is caused by the high amount of broached cavities, as depicted in Figure 8 and Figure 9. Metallographic analyses revealed shrinkage pores as cavities reaching depths of up to one millimetre. Therefore, when machining the cast surface, it should be considered that surface layer pores may be broached by the machining process and may result in similar long life fatigue strength reduction as observed for the cast surface texture.
To assess not only surface initiating cracks as in Cast-S specimens, but also surface layer porosity, the neural network has been retrained by means of four input variables on four neurons. The input variables are now the pore size a r e a , the local surface pit depth S v l o c a l , the equivalent notch root radius ρ ¯ and the statistical surface roughness parameter S v r e v . As this methodology may not be available to designers, and therefore is not easily engineering feasible, the authors study also on the simplified deduction of the interaction coefficient. The first results indicate that the application of the mean values presented in Table 6 for the whole associated sampling series leads to sufficient approximations.
Regarding a probabilistic Cast-S specimen fatigue assessment, the five biggest values S v i of the surface pit depth S v are valid for extreme value statistics. The evaluated distributions of the probabilistic fatigue model parameters S v i and ρ ¯ i depend on the selected sub-area size. As illustrated, a too small sub area sized may not contain sufficient information about the amount and depth of critical surface pits, but is increasingly characterising only the most critical one and would lead to more conservative assessment. Within this study, it was found that for the investigated sand cast surface textures, a sub-area size of 1 mm × 1 mm is valid. It should be noted that this recommended value is a multiple of the sand grain size. Manufacturing processes resulting in finer surface structures, such as additively manufacturing, may use 0.5 mm × 0.5 mm sub-areas instead. As the presented surface long life fatigue assessment model uses the statistical surface roughness parameter S v r e v , the population of the data for distribution fitting should be substantial enough in order to facilitate sound distribution conformity. Within this study, it was found that evaluating about twenty specimens, with five S v i values each, leads to stable distribution parameters of the extremal values. As both fatigue model parameters extremal notch valley depth and averaged notch root radius can be handled as independent random variables, their probabilities of both distributions can be multiplicatively combined, leading to a combined probability of occurrence P ( S v i y , ρ ¯ i x ) and subsequently to the probabilistic cast surface long life fatigue strength σ L L F , s ( P ( S v i y , ρ ¯ i x ) ) . Thus, the presented methodology provides a statistically applicable design tool to assess the cast surface effect on the local fatigue strength.

7. Conclusions

Based on the results presented in this paper, the following conclusions can be drawn.
  • The presented surface layer fatigue assessment model is valid for aluminium sand cast surfaces in T6 and HIP treatment condition within the investigated range of S v = 30 µm to 260 µm. Long life fatigue strength estimation results are approximately 6% to 9% conservative.
  • The HIP process does not reliably close surface layer pores within the first millimetre of surface layer depth. Therefore, in the investigated manufacturing showcase, the machining process has to remove at least one millimetre of the surface layer to increase the endurable long life fatigue strength by remove surface layer porosity.
  • Extremal surface roughness pits may become deeper, respectively, more critical, due to the HIP process. However, this is not compulsory for all investigated surfaces.
  • For probabilistic fatigue strength assessment, the sub-area size is meaningful. Sub-area side lengths have to be chosen properly according to the present cast surface texture. For the investigated sand cast aluminium surfaces, a sub-area size of 1 mm × 1 mm is valid. For statistical characterisation, the measured cast surface texture should cover about one-hundred sub-areas at least.
  • The statistically assessed surface texture parameters, used in the cast surface fatigue strength assessment model, S v i and ρ ¯ i are independent variables and can both be statistically described by a GEV distribution. To reliably fit the distribution, at least 20 specimens should be measured, resulting in 100 S v i and ρ ¯ i values. By means of a bivariate distribution, a probabilistic cast surface long life fatigue strength σ L L F , s ( P ( S v i y , ρ ¯ i x ) ) can be subsequently calculated and used in fatigue design applications.

Author Contributions

Conceptualisation, S.P., M.O. and M.L.; methodology, S.P., M.O. and M.S.; software, S.P. and M.S.; validation, S.P. and M.L.; formal analysis, S.P. and J.T.; investigation, S.P.; resources, M.S.; data curation, S.P.; writing—original draft preparation, S.P.; writing—review and editing, M.O., M.L., J.T. and M.S.; visualisation, S.P.; supervision, M.L. and M.S.; project administration, M.S.; funding acquisition, M.S.; All authors have read and agreed to the published version of the manuscript.

Funding

This research was funded by the Austrian Federal Ministry for Digital and Economic Affairs and the National Foundation for Research, Technology and Development.

Acknowledgments

The financial support by the Austrian Federal Ministry for Digital and Economic Affairs and the National Foundation for Research, Technology and Development is gratefully acknowledged. Furthermore, the authors would like to thank the industrial partners BMW AG and Nemak Dillingen GmbH for the excellent mutual scientific cooperation within the CD-laboratory framework. Special thanks go to Michael Simon Pegritz, coworker within the Christian Doppler Laboratory for Manufacturing Process based Component Design, for supporting the developement of the microstructural characterisation.

Conflicts of Interest

The authors declare no conflict of interest. The funders had no role in the design of the study; in the collection, analyses, or interpretation of data; in the writing of the manuscript; or in the decision to publish the results.

Abbreviations

The following abbreviations are used in this manuscript:
ρ ¯ Equivalent notch root radius of a sub-area A s u b
ρ ¯ i Notch root radii at extremal surface pit depths S v i with 1 i 5
a r e a Defect size of Murakami’s approach
σ a Stress amplitude
σ a , 1 e 7 Experimental SN-point extrapolated to 1e7 load cycles
σ L L F , 0 Near defect-free long life fatigue strength
σ a , P s Experimental long life fatigue strength with *% probability of survival
σ L L F , , P s Estimated long life fatigue strength with *% probability of survival
σ L L F , s ( P ( S v i y , ρ ¯ i x ) ) Probabilistic cast surface long life fatigue strength
ψ Interaction coefficient
ψ m e a n Mean value of the interaction coefficient
ψ s t d Standard deviation of the interaction coefficient
ψ m i n Minimum value of the interaction coefficient
ψ m a x Maximum value of the interaction coefficient
ζ Shape parameter of the GEV distribution
δ Scale parameter of the GEV distribution
μ Location parameter of the GEV distribution
AElongation at rupture
A s u b Sub-area size
a 1 , a 2 Exponents in modified stress concentration factor
EYoung‘s modulus
e m i n , e m a x , α Pore elongation and location parameters
H V 10 Vickers hardness
k 1 , k 2 Inverse slopes of the S/N-curve
K t , m o d Modified stress concentration factor
K f , s Surface fatigue notch factor
K f , p Fatigue strength reduction factor
K f , m Mixed fatigue strength reduction factor
N T Transition knee point of the S/N-curve
N r u p t u r e Load cycles at rupture
P ( S v i y ) ; P ( ρ ¯ i x ) Probability of occurrence
P ( S v i y , ρ ¯ i x ) Combined probability of occurrence
R m Ultimate tensile strength
R P 0 . 2 0.2% offset yield strength
S a m e a n Mean value of the global arithmetical mean height S a
S v Maximum pit height of the scale limited surface
S v l o c a l Local maximum pit height of the sub-area A s u b
S v m a x Maximum surface pit depth value of the investigated surface
S v i Extremal surface pit depth values of the investigated surface with 1 i 5
S v i , m e a n Mean value of S v i
S v r e v ( S v i ( P = 50 % ) ) S v i GEV distribution based value with 50% probability of occurrence
T S , 1 e 7 Stress scatter index
CPSCore Package System
DASSecondary dendrite arm spacing
GEVGeneralised Extreme Value
HIPHot isostatic pressing
NNNeural network
SPCCSquared Pearson correlation coefficient
RLoad stress ratio
R 2 ( A , B ) Coefficient of determination of two random variables A and B
R m e a n 2 ( A , B ) Mean value of R 2 ( A , B )
SGSSurface geometrical structure
SEMScanning electron microscopy

Appendix A

The following figures depict the bivariate distributions of the specimen series HIP P1 (Figure A1), HIP P1(2) (Figure A2) and HIP P2 (Figure A3).
Figure A1. HIP P1 bivariate distribution of S v i GEV distribution and ρ ¯ i GEV distribution.
Metals 10 00616 g0a1
Figure A2. HIP P1(2) bivariate distribution of S v i GEV distribution and ρ ¯ i GEV distribution.
Metals 10 00616 g0a2
Figure A3. HIP P2 bivariate distribution of S v i GEV distribution and ρ ¯ i GEV distribution.
Metals 10 00616 g0a3

References

  1. Hirsch, J. Aluminium in Innovative Light-Weight Car Design. Mater. Trans. 2011, 52, 818–824. [Google Scholar] [CrossRef] [Green Version]
  2. Ueno, A.; Miyakawa, S.; Yamada, K.; Sugiyama, T. Fatigue behavior of die casting aluminum alloys in air and vacuum. Procedia Eng. 2010, 2, 1937–1943. [Google Scholar] [CrossRef] [Green Version]
  3. Aigner, R.; Garb, C.; Leitner, M.; Stoschka, M.; Grün, F. Application of a area -Approach for Fatigue Assessment of Cast Aluminum Alloys at Elevated Temperature. Metals 2018, 8, 1033. [Google Scholar] [CrossRef] [Green Version]
  4. Li, P.; Lee, P.D.; Maijer, D.M.; Lindley, T.C. Quantification of the interaction within defect populations on fatigue behavior in an aluminum alloy. Acta Mater. 2009, 57, 3539–3548. [Google Scholar] [CrossRef]
  5. Hidalgo, R.; Esnaola, J.A.; Llavori, I.; Larrañaga, M.; Hurtado, I.; Herrero-Dorca, N. Fatigue life estimation of cast aluminium alloys considering the effect of porosity on initiation and propagation phases. Int. J. Fatigue 2019, 125, 468–478. [Google Scholar] [CrossRef]
  6. Sonsino, C.M.; Ziese, J. Fatigue strength and applications of cast aluminium alloys with different degrees of porosity. Int. J. Fatigue 1993, 15, 75–84. [Google Scholar] [CrossRef]
  7. Tiryakioğlu, M. Statistical distributions for the size of fatigue-initiating defects in Al–7%Si–0.3%Mg alloy castings: A comparative study. Mater. Sci. Eng. A 2008, 497, 119–125. [Google Scholar] [CrossRef]
  8. Tiryakioğlu, M. On the size distribution of fracture-initiating defects in Al- and Mg-alloy castings. Mater. Sci. Eng. A 2008, 476, 174–177. [Google Scholar] [CrossRef]
  9. Tiryakioğlu, M. Relationship between Defect Size and Fatigue Life Distributions in Al-7 Pct Si-Mg Alloy Castings. Metall. Mater. Trans. A 2009, 40, 1623–1630. [Google Scholar] [CrossRef]
  10. Tijani, Y.; Heinrietz, A.; Stets, W.; Voigt, P. Detection and Influence of Shrinkage Pores and Nonmetallic Inclusions on Fatigue Life of Cast Aluminum Alloys. Metall. Mater. Trans. A 2013, 44, 5408–5415. [Google Scholar] [CrossRef]
  11. Le, V.D.; Saintier, N.; Morel, F.; Bellett, D.; Osmond, P. Investigation of the effect of porosity on the high cycle fatigue behaviour of cast Al-Si alloy by X-ray micro-tomography. Int. J. Fatigue 2018, 106, 24–37. [Google Scholar] [CrossRef] [Green Version]
  12. Leitner, M.; Garb, C.; Remes, H.; Stoschka, M. Microporosity and statistical size effect on the fatigue strength of cast aluminium alloys EN AC-45500 and 46200. Mater. Sci. Eng. A 2017, 707, 567–575. [Google Scholar] [CrossRef]
  13. Aigner, R.; Leitner, M.; Stoschka, M. Fatigue strength characterization of Al-Si cast material incorporating statistical size effect. MATEC Web Conf. 2018, 165, 14002. [Google Scholar] [CrossRef]
  14. Aigner, R.; Pusterhofer, S.; Pomberger, S.; Leitner, M.; Stoschka, M. A probabilistic Kitagawa-Takahashi diagram for fatigue strength assessment of cast aluminium alloys. Mater. Sci. Eng. A 2019, 745, 326–334. [Google Scholar] [CrossRef]
  15. Buffiere, J.Y. Fatigue Crack Initiation And Propagation From Defects In Metals: Is 3D Characterization Important? Procedia Struct. Integr. 2017, 7, 27–32. [Google Scholar] [CrossRef]
  16. Serrano-Munoz, I.; Buffiere, J.Y.; Mokso, R.; Verdu, C.; Nadot, Y. Location, location &size: Defects close to surfaces dominate fatigue crack initiation. Sci. Rep. 2017, 7, 45239. [Google Scholar] [CrossRef] [PubMed] [Green Version]
  17. Tajiri, A.; Nozaki, T.; Uematsu, Y.; Kakiuchi, T.; Nakajima, M.; Nakamura, Y.; Tanaka, H. Fatigue Limit Prediction of Large Scale Cast Aluminum Alloy A356. Procedia Mater. Sci. 2014, 3, 924–929. [Google Scholar] [CrossRef] [Green Version]
  18. Aigner, R.; Leitner, M.; Stoschka, M.; Hannesschläger, C.; Wabro, T.; Ehart, R. Modification of a Defect-Based Fatigue Assessment Model for Al-Si-Cu Cast Alloys. Materials 2018, 11, 2546. [Google Scholar] [CrossRef] [Green Version]
  19. Murakami, Y. Material defects as the basis of fatigue design. Int. J. Fatigue 2012, 41, 2–10. [Google Scholar] [CrossRef]
  20. Aigner, R.; Leitner, M.; Stoschka, M. On the mean stress sensitivity of cast aluminium considering imperfections. Mater. Sci. Eng. A 2019, 758, 172–184. [Google Scholar] [CrossRef]
  21. Garb, C.; Leitner, M.; Tauscher, M.; Weidt, M.; Brunner, R. Statistical analysis of micropore size distributions in Al–Si castings evaluated by X-ray computed tomography. Int. J. Mater. Res. 2018, 109, 889–899. [Google Scholar] [CrossRef]
  22. Murakami, Y. Metal Fatigue: Effects of Small Defects and Nonmetallic Inclusions, 1st ed.; Elsevier: Amsterdam, The Netherlands, 2002. [Google Scholar]
  23. Kitagawa, H.; Takahashi, S. Applicability of fracture mechanics to very small cracks or the cracks in the early stage. In Proceedings of the Second International Conference on Mechanical Behavior of Materials, Boston, MA, USA, 16–20 August 1976; pp. 627–631. [Google Scholar]
  24. McKelvey, S.A.; Fatemi, A. Surface finish effect on fatigue behavior of forged steel. Int. J. Fatigue 2012, 36, 130–145. [Google Scholar] [CrossRef]
  25. McKelvey, S.A.; Lee, Y.L.; Barkey, M.E. Stress-Based Uniaxial Fatigue Analysis Using Methods Described in FKM-Guideline. J. Failure Anal. Prev. 2012, 12, 445–484. [Google Scholar] [CrossRef]
  26. Rennert, R.; Kullig, E.; Vormwald, M.; Esderts, A.; Siegele, D. Analytical Strength Assessment of Components Made of Steel, Cast Iron and Aluminium Materials in Mechanical Engineering, 6th ed.; FKM-Guideline; VDMA-Verl: Frankfurt am Main, Germany, 2012. [Google Scholar]
  27. Cheng, Z.; Liao, R.; Lu, W.; Wang, D. Fatigue notch factors prediction of rough specimen by the theory of critical distance. Int. J. Fatigue 2017, 104, 195–205. [Google Scholar] [CrossRef]
  28. Cheng, Z.; Liao, R.; Lu, W. Surface stress concentration factor via Fourier representation and its application for machined surfaces. Int. J. Solids Struct. 2017, 113–114, 108–117. [Google Scholar] [CrossRef]
  29. Abroug, F.; Pessard, E.; Germain, G.; Morel, F. A probabilistic approach to study the effect of machined surface states on HCF behavior of a AA7050 alloy. Int. J. Fatigue 2018, 116, 473–489. [Google Scholar] [CrossRef] [Green Version]
  30. Neuber, H. Kerbspannungslehre; Springer: Berlin/Heidelberg, Germany, 1958. [Google Scholar] [CrossRef]
  31. Pilkey, W.D.; Pilkey, D.F. Peterson’s Stress Concentration Factors, 3rd ed.; John Wiley & Sons Incorporated: Chichester, UK, 2008. [Google Scholar]
  32. Suraratchai, M.; Limido, J.; Mabru, C.; Chieragatti, R. Modelling the influence of machined surface roughness on the fatigue life of aluminium alloy. Int. J. Fatigue 2008, 30, 2119–2126. [Google Scholar] [CrossRef] [Green Version]
  33. Arola, D.; Ramulu, M. An Examination of the Effects from Surface Texture on the Strength of Fiber Reinforced Plastics. J. Compos. Mater. 1999, 33, 102–123. [Google Scholar] [CrossRef]
  34. Arola, D.; Williams, C. Estimating the fatigue stress concentration factor of machined surfaces. Int. J. Fatigue 2002, 24, 923–930. [Google Scholar] [CrossRef]
  35. Cheng, Z.; Liao, R. Effect of surface topography on stress concentration factor. Chinese J. Mech. Eng. 2015, 28, 1141–1148. [Google Scholar] [CrossRef]
  36. Pomberger, S.; Stoschka, M.; Aigner, R.; Leitner, M.; Ehart, R. Areal fatigue strength assessment of cast aluminium surface layers. Int. J. Fatigue 2020, 133, 105423. [Google Scholar] [CrossRef]
  37. Pomberger, S.; Stoschka, M.; Leitner, M. Cast surface texture characterisation via areal roughness. Precis. Eng. 2019, 60, 465–481. [Google Scholar] [CrossRef]
  38. Pomberger, S.; Leitner, M.; Stoschka, M. Evaluation of surface roughness parameters and their impact on fatigue strength of Al-Si cast material. Mater. Today Proc. 2019, 12, 225–234. [Google Scholar] [CrossRef]
  39. Schneller, W.; Leitner, M.; Springer, S.; Grün, F.; Taschauer, M. Effect of HIP Treatment on Microstructure and Fatigue Strength of Selectively Laser Melted AlSi10Mg. J. Manuf. Mate. Proc. 2019, 3, 16. [Google Scholar] [CrossRef] [Green Version]
  40. Campbell, J. Complete Casting Handbook: Metal Casting Processes, Techniques and Design; Elsevier Butterworth-Heinemann: Oxford, UK, 2011. [Google Scholar]
  41. Ostermann, F. Anwendungstechnologie Aluminium, 2nd ed.; Springer: Berlin/Heidelberg, Germany, 2007. [Google Scholar]
  42. Ernst, F.; Kube, D.; Klaus, G.; Nemak Dillingen GmbH. Al-Kurbelgehäuse mit thermisch gespritzter Eisenbasisbeschichtung: Gießtechnische Anforderungen. Giesserei 2013, 100, 44–51. [Google Scholar]
  43. Krause, G. Weiterentwicklungen bei Gehäusen von Elektromotoren: Weiterentwicklungen bei Gehäusen von Elektromotoren. Giesserei 2017, 104, 108–115. [Google Scholar]
  44. Lei, C.S.C.; Frazier, W.E.; Lee, E.W. The effect of hot isostatic pressing on cast aluminum. JOM 1997, 49, 38–39. [Google Scholar] [CrossRef]
  45. Lee, M.H.; Kim, J.J.; Kim, K.H.; Kim, N.J.; Lee, S.; Lee, E.W. Effects of HIPping on high-cycle fatigue properties of investment cast A356 aluminum alloys. Mater. Sci. Eng. A 2003, 340, 123–129. [Google Scholar] [CrossRef]
  46. Nayhumwa, C.; Green, N.R.; Campbell, J. Influence of casting technique and hot isostatic pressing on the fatigue of an Al-7Si-Mg alloy. Metall. Mater. Trans. A 2001, 32, 349–358. [Google Scholar] [CrossRef]
  47. Staley, J.T.; Tiryakioğlu, M.; Campbell, J. The effect of hot isostatic pressing (HIP) on the fatigue life of A206-T71 aluminum castings. Mater. Sci. Eng. A 2007, 465, 136–145. [Google Scholar] [CrossRef]
  48. Staley, J.T.; Tiryakioglu, M.; Campbell, J. Applicability of fracture mechanics to very small cracks or the cracks in the early stage. In Proceedings of the Effect of Various hip Conditions on Bifilms and Mechanical Properties in Aluminum Castings, Orlando, FL, USA, 25 February–1 March 2007; Crepeau, P.N., Tiryakioglu, M., Campbell, J., Eds.; TMS (The Minerals, Metals and Materials Society): Warrendale, PA, USA, 2007; pp. 159–166. [Google Scholar]
  49. Aigner, R. Characterising the Fatigue Strength of Alminium Castings by Applied Statistical Evaluation of Imperfections. Ph.D. Thesis, Montanuniversität Leoben, Leoben, Austria, 2019. [Google Scholar]
  50. Ceschini, L.; Morri, A.; Sambogna, G. The effect of hot isostatic pressing on the fatigue behaviour of sand cast A356-T6 and A204-T6 aluminum alloys. J. Mater. Proc. Technol. 2008, 204, 231–238. [Google Scholar] [CrossRef]
  51. Vandersluis, E.; Ravindran, C. Comparison of Measurement Methods for Secondary Dendrite Arm Spacing. Metall. Microst. Anal. 2017, 6, 89–94. [Google Scholar] [CrossRef]
  52. Haibach, E. Betriebsfestigkeit: Verfahren und Daten zur Bauteilberechnung; VDI-Buch; Springer: Berlin, Germany, 2006. [Google Scholar] [CrossRef]
  53. Leitner, H. Simulation of the Fatigue Behaviour of Aluminium Cast Alloys. Ph.D. Thesis, Montanuniversität Leoben, Leoben, Austria, 2001. [Google Scholar]
  54. Dengel, D.; Harig, H. Estimation of the fatigue limit by progressively-increasing load tests. Fatigue Fract. Eng. Mater. Struct. 1980, 3, 113–128. [Google Scholar] [CrossRef]
  55. Sonsino, C.M. Course of SN-curves especially in the high-cycle fatigue regime with regard to component design and safety. Int. J. Fatigue 2007, 29, 2246–2258. [Google Scholar] [CrossRef]
  56. Atkinson, H.V.; Davies, S. Fundamental aspects of hot isostatic pressing: An overview. Metall. Mater. Trans. A 2000, 31, 2981–3000. [Google Scholar] [CrossRef]
  57. Masuo, H.; Tanaka, Y.; Morokoshi, S.; Yagura, H.; Uchida, T.; Yamamoto, Y.; Murakami, Y. Effects of Defects, Surface Roughness and HIP on Fatigue Strength of Ti-6Al-4V manufactured by Additive Manufacturing. Procedia Struct. Integr. 2017, 7, 19–26. [Google Scholar] [CrossRef]
  58. Schneller, W.; Leitner, M.; Springer, S.; Beter, F.; Grün, F. Influencing factors on the fatigue strength of selectively laser melted structures. Procedia Struct. Integr. 2019, 19, 556–565. [Google Scholar] [CrossRef]
  59. Schneller, W.; Leitner, M.; Pomberger, S.; Springer, S.; Beter, F.; Grün, F. Effect of Post Treatment on the Microstructure, Surface Roughness and Residual Stress Regarding the Fatigue Strength of Selectively Laser Melted AlSi10Mg Structures. J. Manuf. Mater. Process. 2019, 3, 89. [Google Scholar] [CrossRef] [Green Version]
  60. Leitner, M.; Stoschka, M.; Fröschl, J.; Wiebesiek, J. Surface Topography Effects on the Fatigue Strength of Cast Aluminum Alloy AlSi8Cu3. Mater. Perform. Charact. 2018, 7, 20170127. [Google Scholar] [CrossRef]
  61. Campbell, J. Entrainment defects. Mater. Sci. Technol. 2013, 22, 127–145. [Google Scholar] [CrossRef]
  62. Wang, Q.G.; Crepeau, P.N.; Davidson, C.J.; Griffiths, J.R. Oxide films, pores and the fatigue lives of cast aluminum alloys. Metall. Mater. Trans. B 2006, 37, 887–895. [Google Scholar] [CrossRef]
  63. Yousefian, P.; Tiryakioğlu, M. Pore Formation During Solidification of Aluminum: Reconciliation of Experimental Observations, Modeling Assumptions, and Classical Nucleation Theory. Metall. Mater. Trans. A 2018, 49, 563–575. [Google Scholar] [CrossRef]
  64. Gumbel, E.J. Statistics of Extremes; Columbia University Press: New York, NY, USA, 1958. [Google Scholar]
  65. Gnedenko, B. Sur la distribution limite du terme maximum d’une serie aleatoire. Annals Math. 1943, 44, 423–453. [Google Scholar] [CrossRef]
  66. Jenkinson, A.F. The frequency distribution of the annual maximum (or minimum) values of meteorological elements. Q. J. R. Meteorol. Soc. 1955, 87, 145–158. [Google Scholar] [CrossRef]
  67. Beretta, S.; Murakami, Y. Statistical analysis of defects for fatigue strength prediction and quality control of materials. Fatigue Fract. Eng. Mater. Struct. 1998, 21, 1049–1065. [Google Scholar] [CrossRef]
  68. Raynal-Villasenor, J.A.; Raynal-Gutierrez, M.E. Estimation procedures for the GEV distribution for the minima. J. Hydrol. 2014, 519, 512–522. [Google Scholar] [CrossRef]
  69. Benesty, J.; Chen, J.; Huang, Y.; Cohen, I. Pearson Correlation Coefficient. In Noise Reduction in Speech Processing; Cohen, I., Huang, Y., Chen, J., Benesty, J., Eds.; Springer: New York, NY, USA, 2009; Volume 2, pp. 1–4. [Google Scholar] [CrossRef]
Figure 1. Exemplarily mapping of the surface fatigue notch factor K f , s with 1 mm × 1 mm sub-areas.
Metals 10 00616 g001
Figure 2. Microstructure of (a) HIP P1, (b) T6 P1 and (c) T6 P2.
Metals 10 00616 g002
Figure 3. Normalised S/N-curve of the specimen series HIP P2.
Metals 10 00616 g003
Figure 4. Defect cases: (a) HIP P1 cast-M, (b) HIP P1 Cast-S, (c) HIP P2 Cast-M and (d) HIP P2 Cast-S.
Metals 10 00616 g004
Figure 5. Normalised S/N-curve of the specimen series HIP P1.
Metals 10 00616 g005
Figure 6. Detected pores and degree of porosity of an exemplary cast surface T6 P1 cross section.
Metals 10 00616 g006
Figure 7. Detected pores and degree of porosity of an exemplarily cast surface HIP P1 cross section.
Metals 10 00616 g007
Figure 8. SEM image of the specimen series T6 P1 investigated in [36].
Metals 10 00616 g008
Figure 9. SEM image of the specimen series (a) HIP P1 and (b) HIP P2.
Metals 10 00616 g009
Figure 10. Long life fatigue strength assessment result of the validation series HIP P2.
Metals 10 00616 g010
Figure 11. Long life fatigue strength assessment result of the validation series HIP P1.
Metals 10 00616 g011
Figure 12. Size effect of (a) 0.25 mm, (b) 0.5 mm and (c) 1.0 mm sub-area side lengths.
Metals 10 00616 g012
Figure 13. Visualisation of the function P ( S v i y ) of the S v i GEV distributions.
Metals 10 00616 g013
Figure 14. Visualisation of the function P ( ρ ¯ i x ) of the ρ ¯ i General Extreme Value (GEV) distributions.
Metals 10 00616 g014
Figure 15. Workflow of the R 2 ( S 1 , S 2 ) evaluation exemplified for the T6 P1 S v i -GEV distribution.
Metals 10 00616 g015
Figure 16. Sample size effect on (a) S v i -GEV distribution. (b) Confidence interval.
Metals 10 00616 g016
Figure 17. T6 P1 bivariate distribtion of S v i GEV distribution and ρ ¯ i GEV distribution.
Metals 10 00616 g017
Figure 18. T6 P1 probabilistic cast surface long life fatigue strength σ L L F , s ( P ( S v i y , ρ ¯ i x ) ) with views: (a) ρ ¯ i - σ L L F , s (b) S v i - σ L L F , s (c) ρ ¯ i - S v i .
Metals 10 00616 g018
Table 1. Typical hot isostatic pressing (HIP) parameters for Al alloys [44,45,46,47,48].
T [ ° C]p [MPa]t [h]
510–5211032–6
Table 2. Evaluated mean dendrite arm spacing (DAS) for T6 and HIP at P1 and P2.
Measurement PositionT6 P1HIP P1HIP P2T6 P2 [49]HIP P2 [49]
surface DAS [µm]27.326.521.4--
bulk DAS [µm]26.125.128.827.527.2
Table 3. Tested material properties of EN AC-46200 with T6 and HIP heat treatment.
AlloyHV10 [-]E [MPa] R m [MPa] R P 0.2 [MPa]A [%]
EN AC-46200 T612374,3003002850.51
EN AC-46200 HIP12474,6003202601.78
Table 4. Evaluated results of the fatigue tests of the investigated specimen series.
Specimen Series k 1 [-] k 2 [-] σ a , Ps 50 [-] N T [-] T S , 1 e 7 [-]
T6 P1 [36]3.9719.850.435927.9601:1.290
HIP P14.1420.680.452779.3231:1.168
HIP P1(2)3.2916.480.411734.0941:1.150
HIP P25.1125.560.614641.7701:1.167
Table 5. Mean value S a m e a n of the global S a values with its 10–90% scatter.
Roughness ParameterT6 P1HIP P1HIP P2
S a m e a n [µm]17.9 ± 6.418.7 ± 8.09.3 ± 3.6
Table 6. Evaluated interaction coefficients of the NN training series of T6 P1 [36] and HIP P2.
Training Series ψ mean [-] ψ std [-] ψ min [-] ψ max [-]Sample Size [-]
T6 P1 [36]0.5980.0340.5470.67425
HIP P20.4200.0250.3840.4734
Table 7. Validation series results and re-evaluation of the T6 P1 validation series from [36].
Validation SeriesExperimentModelDifferenceModelSample Size
σ a , Ps 50 [-] σ LLF , , Ps 50 [-] Δ [%] T S , 1 e 7 [-][-]
T6 P1 [36] (re-evaluated)0.4160.336−7.91:1.18914
HIP P10.4520.360−9.21:1.15017
HIP P1(2)0.4110.353−5.81:1.15816
HIP P20.6140.544−7.01:1.0326
Table 8. Statistical parameter S v r e v and evaluated GEV distribution parameters of S v i and ρ ¯ i .
Specimen Series Sv i GEV Sv rev [µm] ρ ¯ i GEV
ζ [-] μ [µm] δ [µm] Sv i ( P = 50 % ) ζ [-] μ [µm] δ [µm]
T6 P1 [36]−0.2299.7843.041140.2779.2623.41
HIP P1−0.45128.1051.111450.07119.4340.91
HIP P1(2)−0.26126.1560.951480.0384.2329.90
HIP P20.2445.078.9448−0.28228.2082.94

