Abstract
The high-temperature oxidation behavior of selective laser melting (SLM) manufactured IN 625 was studied over 96 h of exposure at 900 °C and 1050 °C in air. An extensive analysis was performed to characterize the oxide scale formed and its evolution during the 96 h, including mass gain analysis, EDS, XRD, and morphological analysis of the oxide scale. The mass gain rate of the bare material increases rapidly during the first 8 h of temperature holding and diminishes at higher holding periods for both oxidation temperatures. High-temperature exposure for short periods (24 h) follows a parabolic law and promotes the precipitation of δ phase, Ni-rich intermetallics, and carbides. Within the first 24 h of exposure at 900 °C, a Cr2O3 and a (Ni, Fe)Cr2O4 spinel scale were formed, while at a higher temperature, a more complex oxide was registered, consisting of (Ni, Fe)Cr2O4, Cr2O3, and rutile-type oxides. Prolonged exposure of IN 625 at 900 °C induces the preservation of the Cr2O3 scale and the dissolution of carbides. Other phases and intermetallics, such as γ, δ phases, and MoNi4 are still present. The exposure for 96 h at 1050 °C led to the dissolution of all intermetallics, while the same complex oxide scale was formed.
1. Introduction
Nickel-based superalloys are metallic materials capable of withstanding high loading burdens during operation at high temperatures and in corrosive environments. Over the years, many chemical compositions were evaluated in order to obtain specific combinations that can ensure as many required properties as possible. Therefore, based on experimental studies, it was ascertained that superalloys designed for maximum strength do not provide the maximum oxidation resistance, and vice versa [1,2]. IN 625 is a Ni-Cr superalloy developed in the 1950s as a substitute for stainless steel used in power plant components [3]. Even though it was developed 70 years ago, it is still known for its outstanding properties in oxidative and corrosive environments, with the high Cr content providing corrosion resistance while Mo and Nb ensure the strengthening of the face-centered cubic (FCC) structure γ phase [4,5]. In oxidative environments, the base material is protected by chromium oxide (Cr2O3) or aluminum oxide (Al2O3) scale formation [6,7,8,9,10,11,12], with Al being the most effective alloying element used to enhance oxidation resistance, and Cr being an element that reduces the oxidation rate of superalloys without W [6].
Under different environmental conditions, several oxide types can develop on the surface of high Cr content Ni-based superalloys. In oxidative environments, even at temperatures below 800 °C, for Cr contents over 10 wt%, stable oxides nuclei of Ni and Cr can grow [7,13]. Prior to reaching a steady-state oxide scale development, a preliminary transient oxidation period was reported by some authors. During this transient period, NiO nuclei grow faster than the Cr2O3 nuclei. As a result, a continuous layer of NiO forms and incorporates the Cr2O3 nuclei. Further, Cr2O3 reacts with NiO, resulting in a fragmented or a compact layer of NiCr2O4 spinel. The transient period is completed as the initial Cr2O3 nuclei grow at the scale-base material interface and form a continuous layer [7,8,13,14]. Such a transient oxidation period was reported by some authors even at higher temperatures [15,16,17,18,19,20].
Many studies were conducted regarding the oxidation behavior of Ni-Cr superalloys, and from a kinetic point of view, three oxidation behaviors were reported: a parabolic, a logarithmic, and a linear oxidation behavior [21]. Moreover, the scale’s stability and temperature dependence can be explained by Ellingham diagrams. Staszewska et al. [22] studied the oxidation mechanism and kinetics for IN 617 and IN 625. For these materials, they obtained compact oxide scales composed of an exterior Cr2O3 and internal NiCr2O4 spinel along with other oxides. The NiCr2O4 spinel was observed also by Vesel et al. [23] for IN 625 and a similar spinel (NiAl2O4) was found by Zhang et al. [12] in the case of a Ni-Fe based superalloy. Molins et al. [24] studied the oxidation behavior of Ni superalloys at 650 °C, and they noticed a complex oxide scale consisting in an outer NiO containing Cr and Fe, followed by Cr2O3 and Cr(Nb,Ti)O4 near the baseline alloy. Thermodynamically, Cr2O3 is the main stable oxide until 900 °C, but different deleterious types (CrO2(OH)2,CrO3) can develop and promote Cr volatilization [17,21,25].
Although so many studies were realized regarding conventionally-produced superalloys, nowadays a particular area has to be addressed–the performances of additive-manufactured (AMed) metals. Within the next few years, the integration of additive manufacturing technology in the industrial field is very likely, so many studies are conducted regarding raw materials used for AM [26] and AMed alloy characterization [27,28]. Conventional manufactured IN 625 is an alloy extensively used for parts that operate in oxidative and corrosive environments, such as components for industrial and aerospace gas turbines, as well as components for nuclear and marine power plants. By means of additive manufacturing technology, new complex shape components can be further developed using the same alloy, following design concepts that cannot be put into practice by conventional technologies. Considering these aspects, the present study is focused on analyzing the oxidation behavior of IN 625, additively manufactured using selective laser melting.
2. Materials and Methods
Specimens for isothermal oxidation were manufactured using a selective laser melting Lasertec 30 SLM machine and IN 625 metal powder within the 15–45 μm particle range (UK81572 lot from LPW Technology Ltd., Runcorn, United Kingdom). The chemical composition of the metal powder is presented in Table 1.

Table 1.
Chemical composition of the IN 625 metal powder provided by LPW Technology Ltd.
The following process parameters were used: 80 °C temperature for the building plate, 50 µm layer thickness, 0.11 mm hatch distance, 250 W laser power, 750 mm/s laser speed, and 90° scanning strategy rotated with 90° between two successive layers. For isothermal oxidation, 11 mm in diameter and 80 mm long cylindrical rods were produced. All cylindrical rods were mechanically detached from the building plate and the support material was mechanically removed. They were machined and ground to a diameter of 9 mm. Also, 15 mm height cylindrical specimens were cut, and 18 specimens were obtained. Two specimens were kept as references and the others were used for the oxidation process. All specimens, as well as the Al2O3 crucibles, were degreased with ethanol and were weighted with and without the crucible using an analytic balance Pioneer PX224 (Ohaus, Shanghai, China). High-temperature oxidation influence was assessed by performing isothermal oxidation heat treatment at two different temperatures, 900 °C and 1050 °C, using a Nabertherm LH 30/14 furnace (Nabertherm GmbH, Lilienthal/Bremen, Germany) (P = 10 kW, Tmax = 1400 °C). Oxidation temperatures were selected corresponding to the working temperature of gas turbines parts (over 1000 °C) and the limitations of conventionally-manufactured IN 625 superalloy (900 °C for short periods of time). The oxidation process was realized over 12 cycles of 8 h each until 96 h of total exposure time was reached. Each oxidation cycle consisted of heating the specimens placed in crucibles from room temperature to 900 °C, and respectively 1050 °C, with a heating rate of 10 °C/min. and 8 h holding at temperature, followed by slow cooling with the furnace.
The mass gains of the specimens were assessed after completing each oxidation cycle by weighing the specimens along with the crucible. After every 24 h high-temperature exposure time, two crucibles were removed from the furnace for material microstructural characterization and oxide scale analysis. The oxide scale analysis consisted of microstructural and morphological analysis by scanning electron microscopy using a FEI F50 Inspect SEM (FEI Company, Brno, Czech Republic), equipped with an energy-dispersive X-ray spectrometer (EDS) EDAX APEX 2i with SDD Apollo X detector (EDAX Inc., Ametek MAD Mahwah, NJ, USA). The morphology of the oxide scale was investigated on secondary electron images (ETD detector—Everhart Thornley Detector, FEI Company), while to highlight the differences in the chemical composition of the phases, backscattered electron images (vCD detector—low voltage high contrast detector, FEI Company) were used.
Microcompositional analysis was performed by SEM-EDS on the specimen’s surface and in 4 different microareas in the specimen’s cross-section. The qualitative analysis was performed using an acceleration voltage of 30 kV, a take-off angle of 35.6°, and an acquisition time of 60 s. The semi-quantitative standardless analysis of the bulk oxide scale was made using indirect method ZAF correction, as implemented in the commercial EDAX Genesis software V6.29 (EDAX Inc. Ametek MAD Magwah, NJ, USA).
The natures of phases present in the oxide scale were investigated using X-ray diffraction (XRD) with a Bruker D8 Advance diffractometer (Bruker AXS GmbH, Karlsruhe, Germany) in Bragg-Brentano geometry, assisted by the Diffrac.Eva Bruker software (2019, version 5.1.0.5) and ICDD database (Newton Square, Pennsylvania), Powder Diffraction File, PDF4 + 2020. The diffractograms were acquired under the following conditions: X-ray source Cu Kα (λ = 1.54060 Å); 2θ angular range of 14–84°; 2θ step size of 0.03°; time/step of 5 s and graphite monochromator in the diffracted beam. Moreover, a dimensional evolution of the oxide scale’s thickness was realized in the cross-section on resin-mounted specimens by processing SEM images using the Scandium software (Olympus Soft Imaging Solutions GmbH, Münster, Germany). An average value of the oxide’s thickness was determined based on 13 measurements made on 3 different SEM images of each oxidized specimens.
3. Results
3.1. Mass Gain Analysis
The mass gain analysis of the high-temperature-exposed specimens was assessed as the difference between the weight of the specimen after exposure and the initial weight, relative to the initial outer surface of the specimen. The weight of specimens placed in crucibles was measured with an accuracy of 0.1 mg. Figure 1 presents the isothermal oxidation kinetic curves of the SLM-manufactured alloy for a total 96 h exposure time at 900 °C and 1050 °C, respectively. However, significant differences were highlighted for the two exposure temperatures. The mass gain of the specimens oxidized at 1050 °C is a few orders of magnitude higher than that of the specimens oxidized for the same period of time at 900 °C.
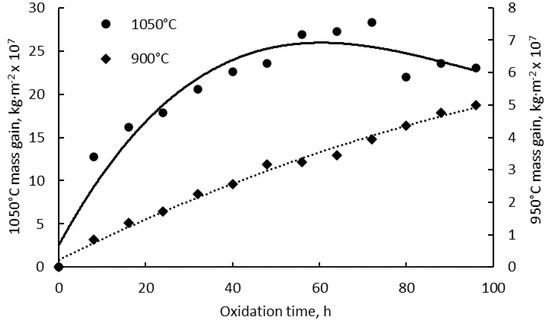
Figure 1.
Kinetic curves of isothermal oxidation of IN 625 superalloy at 900 °C and 1050 °C.
Although the mass gain of the oxidized specimens at 900 °C follows a parabolic law during the first 24 h, it appears to be more linear as a function of exposure time for the rest of the oxidation time. The oxidation process at 1050 °C follows a nearly-parabolic law. An increase of the mass gain was registered until the 10th exposure cycle followed by the specimens’ mass loss. Over the whole exposure period, the cumulative mass gain rate calculated for the specimens oxidized at the two temperatures as a function of time exhibits similar behavior, as shown in Figure 2. For both oxidation temperatures, the mass gain rate increases rapidly in the first 8 h of exposure time, after which the mass gain rate steadily diminishes.
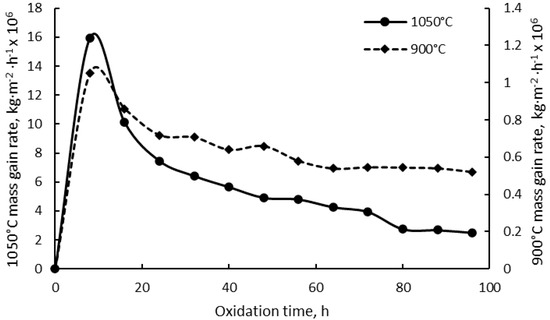
Figure 2.
Cumulative mass gain rates of the specimens oxidized at 900 °C and 1050 °C.
3.2. Oxide Scale Analysis
The EDS analysis of specimens’ top surfaces revealed that in both cases, after a total of 96 h of oxidation, the process led to the formation of mainly chromium oxide scales. Small traces of Mo, Nb, and Fe were observed in the case of the oxidized specimens at 900 °C, and only small traces of Nb and Fe were observed in the case of oxidized specimens at 1050 °C. Figure 3 presents the EDS spectrum realized on the top surfaces of oxidized specimens.
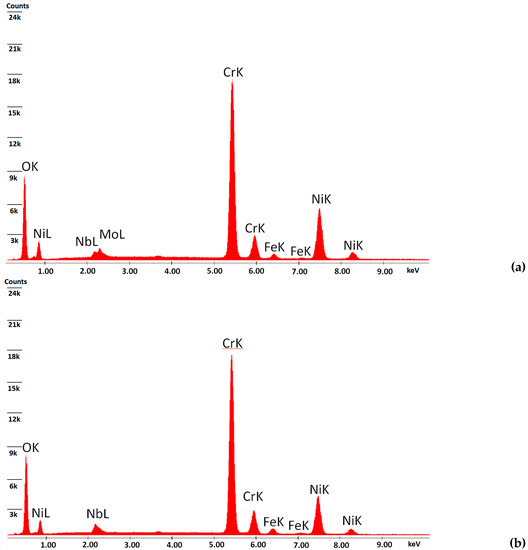
Figure 3.
EDS spectra on the top surfaces of oxidized specimens at 900 °C (a) and 1050 °C (b).
The EDS analysis performed in four microareas (three in the oxide scale and one in the base material under the interface with the oxide layer) in the specimen’s cross-section was realized in order to determine which chemical elements react with oxygen during its diffusion in the baseline material and whether a reduction in the overall metal at the specimen’s surface is registered. Table 2 and Table 3 present the result of the EDS analysis on four different microareas, as shown in Figure 4 for the specimen oxidized at 1050 °C, after 96 h of exposure, in an area where the oxide scale was unspalled.

Table 2.
Chemical composition evolution in the studied four microareas (oxidation at 900 °C).

Table 3.
Chemical composition evolution in the studied four microareas (oxidation at 1050 °C).
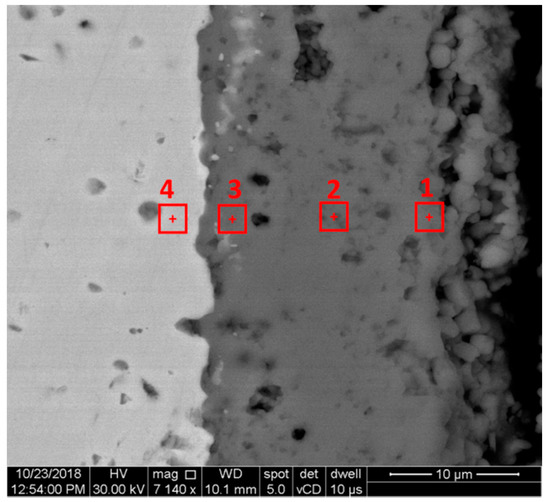
Figure 4.
EDS analysis microareas in specimen’s cross-section.
EDS quantitative chemical composition of the specimen surface shows that after the first 24 h of the oxidation process at 900 °C, the oxide scale contains, besides Cr, different amounts of other oxide-forming alloying elements, such as Ni, Nb, Mo, and Fe. Thus, it can be concluded that the oxide scale consists of chromium oxide and other spinels or oxides containing these elements. After 48 h of exposure, the chromium content in the oxide scale increases to the detriment of the other elements. However, after 96 h of exposure at 900 °C, apart from the high chromium content, all the other elements prone to forming intermetallics and/or other types of oxides, besides the predominant chromium oxide, are still present.
The chemical compositions presented in Table 3 show a different composition of the oxide scale for the specimens oxidized over the same duration at 1050 °C. The specimens’ surface is practically free of significant amounts Mo and Fe from the early stages, with small amounts of Nb and Ni being present apart of Cr, as compared with the specimens oxidized at 900 °C. The oxidation process at 1050 °C ensures the formation of mainly chromium oxide starting from the incipient high-temperature maintenance cycles.
A comparative analysis of the chemical composition of the oxide scales formed after 96 h of oxidation at the two temperatures was made by the ratio between the weight % of Cr content and the sum of all alloying elements (ƩAE) in the base material, i.e., Cr, Nb, Mo, and Fe. Figure 5 presents the wt% Cr/ƩAE wt% ratio calculated for the four EDS-analyzed microareas.
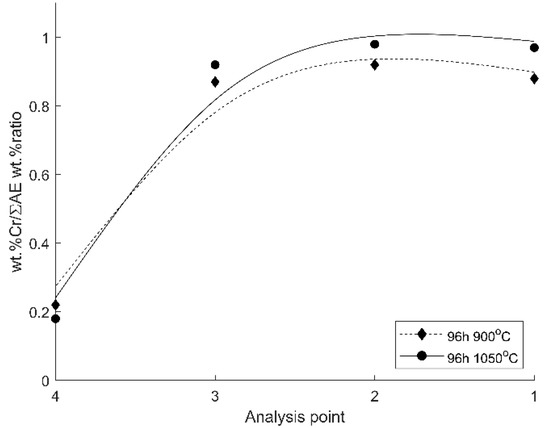
Figure 5.
The wt% Cr/ƩAE wt% ratio in the four analyzed microareas.
In the middle of the scale section (microarea 2) and the outer surface of the oxide scale (microarea 1), the specimens oxidized at 1050 °C exhibit a higher Cr/ƩAE ratio than those oxidized at 900 °C. For the specimens oxidized at 1050 °C, the Cr content in the total alloying elements represents 0.97–0.98 (Cr/ƩAE close to unity), as compared with the lower Cr/ƩAE ratio of 0.88–0.92 for the specimens oxidized at 900 °C.
In order to identify the repartition of the alloying elements in different oxides types and other phases formed in the scale, the oxidized specimens at both temperatures were subject to XRD phase analysis. Figure 6 presents the representative 2θ range (33–66°) of the diffractograms acquired from the specimens oxidized for 24 h at 900 °C and 1050 °C, respectively, while Figure 7 presents the similar range of the diffractograms acquired from the specimens oxidized for 96 h at the same temperatures.
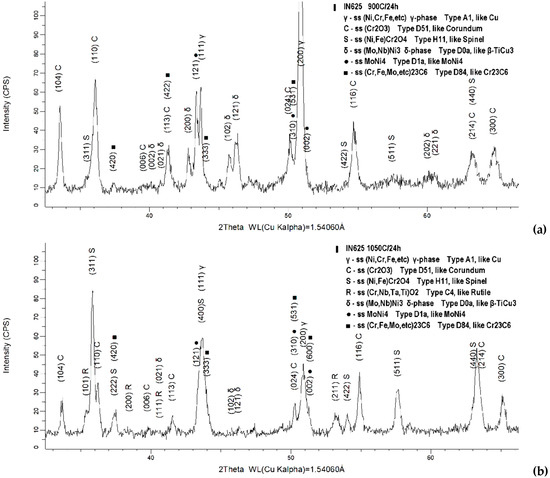
Figure 6.
Diffraction patterns of the specimens oxidized for 24 h at 900 °C (a) and 1050 °C (b).
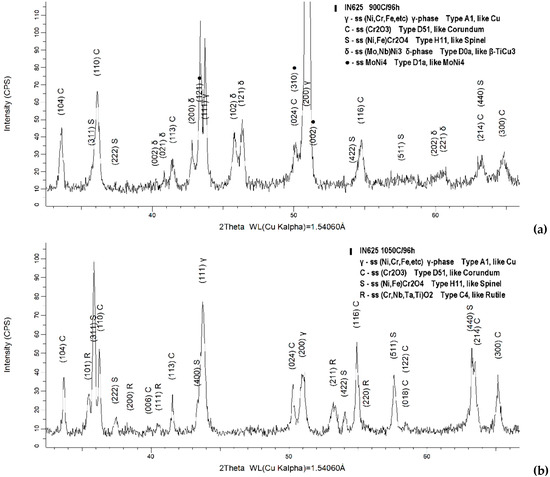
Figure 7.
Diffraction patterns of the specimens oxidized for 96 h at 900 °C (a) and 1050 °C (b).
The phases identified by XRD are practically substitutional solid solutions (ss). Their exact formulas cannot be identified by XRD; however, the type of structure of each phase can be determined. The description of the phases identified by XRD in the analyzed oxidized samples is summarized in Table A1, Appendix A.
The isothermal oxidation at 900 °C and 1050 °C for small periods of time (24 h) promotes the precipitation of δ phase ((Mo, Nb)Ni3), an Ni-rich intermetallic (MoNi4), and complex carbides ((Cr, Fe, Mo, etc.)23C6).
The oxide scale formed within 24 h at 900 °C consists mainly of Cr2O3 followed by the spinel (Ni, Fe)Cr2O4, while at 1050 °C it consists mainly in spinel (Ni, Fe)Cr2O4, followed by Cr2O3. Moreover, in case of oxidation at higher temperature (1050 °C) another oxide characterized by a rutile-like structure (((Cr+3(Nb, Ta)+5)(1−x)/2,(Ti+4)x)O−22) was identified.
After prolonged temperature exposure (96 h), in the case of specimens exposed at 900 °C, the γ-FCC and δ phases were still present along with the MoNi4 intermetallic, but no more traces of carbides were identified, and the oxide scale consists in a form of Cr2O3. Compared with the lower temperature oxidation process, a different evolution was noticed in the case of the oxide scale formed at 1050 °C. The prolonged exposure at a higher temperature led to the dissolution of the δ phase, MoNi4 intermetallic, and carbides, with only the γ phase being identified. This can be attributed to the fact that the oxidation temperature is in the range of the solutioning heat treatment window of the IN 625 alloy, which has the very purpose of dissolving them. The oxide scale identified in this particular case consists in the (Ni, Fe)Cr2O4 spinel, Cr2O3 and rutile-like phase (((Cr+3(Nb, Ta)+5)(1−x)/2,(Ti+4)x)O−22).
XRD is not able to distinguish between the spinel structures allowed by the elemental composition of this alloy (e.g., NiCr2O4-Nichromite, FeCr2O4-Chromite or NiFe2O4-Trevorite, etc.). One or more substitutional solid solutions (ss) with different compositions may be formed, possibly simultaneously in the oxide scale. The phase called S refers to this situation. We have assumed for the S phase the following approximate formula (Ni+2, Fe+2)(Cr+3, Fe+3)2O4.
The same observations apply to natural complex carbides: (Cr, Fe)23C6-Isovite, (Fe, Ni)23C6-Haxonite or synthetic Cr23C6, Mn23C6 and so on, also admitting some Mo, Nb, Ta contents. We assumed for this phase the approximate formula (Cr, Fe, Mo, etc.)23C6. A similar approach was justified by the proposal of the formulas of the corundum type oxide (Cr,Fe)2−2xMoxO3 and, respectively, rutile-type oxide ((Cr+3(Nb, Ta)+5)(1−x)/2(Ti+4)x)O−22 or ((Cr+3(Nb, Ta)+5)(1−x)(Ti+4)2x)O−24.
The morphological evolution over time of the oxide scales formed on specimens’ surface oxidized at 900 °C and 1050 °C, respectively, is presented in Figure 8. Comparing the SEM images, a different morphology of the developed oxide scales was noticed. The oxide scale formed at 900 °C presents an angular morphology compared with the rounder morphology observed in the case of the oxide scale formed at 1050 °C.
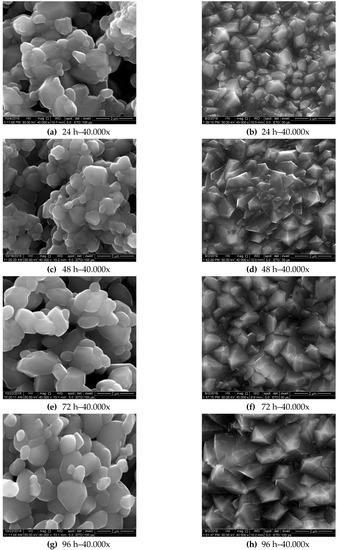
Figure 8.
Microstructural evolution of the oxide scale over 96 h of isothermal oxidation at 1050 °C (a,c,e,g) and 900 °C (b,d,f,h).
Moreover, the oxide scale formed during oxidation at 1050 °C looks more porous than the oxide scale formed at lower temperatures, which is more compact.
The evolution of oxide scale during the exposure time at the high temperature was assessed by thickness measurements on the specimen’s cross-section, as shown for the illustration in Figure 9. Figure 10 presents the oxide scale’s thickness evolution during the isothermal oxidation up to 96 h for both temperatures. The oxide scale thickness values are the average of 13 measurements done on 3 images for each exposure time. A parabolic evolution of the oxide scale thickness as a function of time was registered in both types of oxidation processes. A significant difference between the oxide scale’s thicknesses for the two temperatures was registered. The thickness of the oxide scale formed at 1050 °C is almost double when compared with the oxide scale formed at 900 °C. The oxide scale thickness increases fast during the first 24 h of exposure, then the increase is more moderate between 24–96 h at both temperatures. During the exposure between 24–96 h, the oxide scale thickness increases at 900 °C is lower than at 1050 °C.
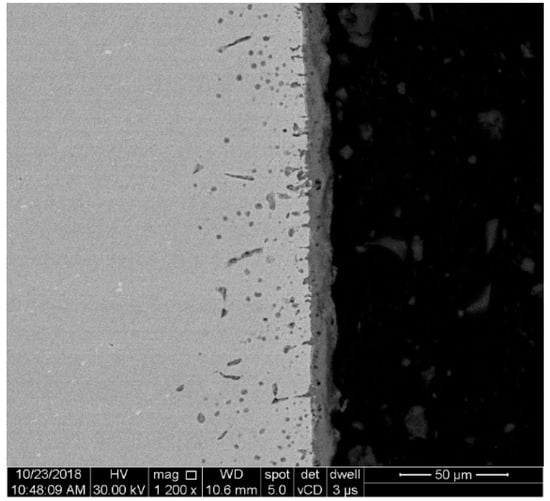
Figure 9.
SEM image of a specimen cross-section used for oxide scale thickness measurement.
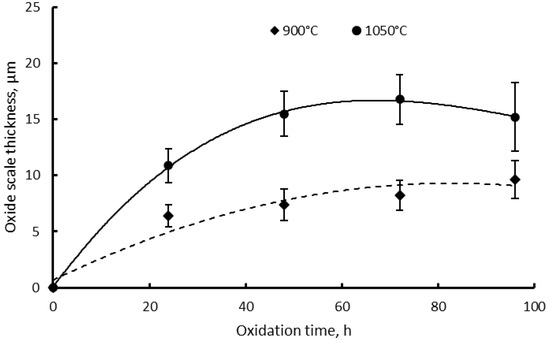
Figure 10.
Oxide scale thickness as a function of time and standard deviations after isothermal oxidation of IN 625 at 900 °C and 1050 °C.
The growth rate of the oxide scale thickness during the isothermal oxidation for 96 h is summarized in Figure 11. During the first 24 h of exposure, a high growth rate was registered for both oxidation temperatures, a lower rate being recorded in the case of oxidation at 900 °C. During the first few oxidation cycles until 24 h, the oxidation process is much faster at the higher temperature, whereupon the cumulative oxide scale growth rate gradually decreases. During the first cycles, the oxygen diffuses with a higher rate at the surface of the bare material, and as the oxide layer grows it becomes a barrier to oxygen diffusion.
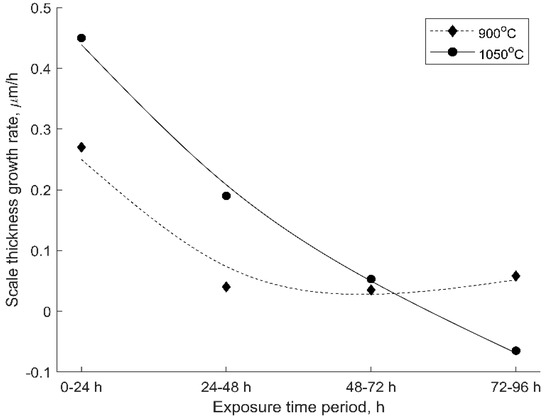
Figure 11.
The oxide scale thickness growth rate as a function of the exposure time period.
In the case of oxidation at 900 °C, the oxide scale growth rate stabilizes to a great extent between 48–64 h of exposure time. During this time period, the oxygen diffusion rate is slowed, but after the stabilization period, Cr2O3 continues to form, and an increase in the oxide scale growth rate was registered.
During the oxidation at 1050 °C, a significant steady decrease of the growth rate was registered after 24 h of exposure, reaching at 72 h a similar value as in case of the growth rate recorded at 900 °C oxidation.
As it was noticed in the case of mass gain and oxide thickness evolution analysis, oxidation for longer periods over 72 h at 1050 °C generates a decrease in the oxide’s thickness, along with a reduction of the specimen’s mass gain. This “negative” scale thickness growth rate recorded between 72–96 h of exposure time is caused by the oxide scale spallation. This was observed in different areas of the specimens oxidized at 1050 °C, starting from 72 h exposure, as shown in Figure 12. The oxide scale spallation was not observed in the case of specimens oxidized at 900 °C, the oxide scale formed in this case being denser and more even than the scale formed in the case of oxidized specimens at 1050 °C.
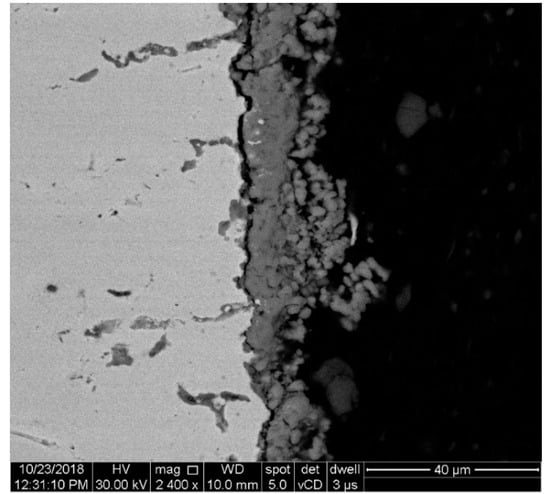
Figure 12.
SEM image of the scale oxide’s spallation at 1050 °C after 72 h exposure.
4. Discussion
The high-temperature oxidation behavior of SLM-manufactured IN 625 was studied over 96 h of exposure in air at 900 °C and 1050 °C, respectively. In both cases, the results of the mass gain analysis showed an increase of the specimens’ weight during exposure. For both oxidation temperatures, the mass gain rate of the bare material increases rapidly in the first 8 h of exposure time (from 0 to 1.05 × 10⁶ kg·m2·h−1 for specimens oxidized at 900 °C and from 0 to 15.96 × 10⁶ kg·m2·h−1 for specimens oxidized at 1050 °C), after which the mass gain rate steadily diminished.
The oxidation kinetic of the material during the first 8 h of exposure is consistent with the fast kinetic reported by Berthod et al. [17] during the first 10 h of oxidation of a conventional manufactured Ni-Cr (30 wt% Cr) alloy in the temperature range of 1000–1300 °C.
The kinetic curves show a parabolic behavior of the mass gain as a function of time at the two oxidation temperatures in air. Yet, at the lower temperature of 900 °C, after a parabolic behavior until the first 24 h of exposure, a steady mass gain was registered (with an almost linear dependence of the mass gain as a function of the exposure duration). This is consistent with other findings on Ni-based superalloys that show a sub-parabolic behavior at temperatures less than 900 °C and by following a parabolic law over 1000 °C [20,29,30,31]. No scale spallation was recorded for the 96 h oxidized samples at 900 °C. Similar behavior was reported by N’dah et al. [32] in the case of 50 h of oxidation of conventional manufactured IN 625 sheet at 900 °C. Based on the experimental results, the calculated parabolic rate constants after 96 h of oxidation are kp = 7.23 × 10⁻¹¹ kg2·m−4·s−1 at 900 °C and kp = 1.67 × 10⁻⁹ kg2·m−4·s−1 at 1050 °C. Different kp values were reported for conventional manufactured IN625 or other Ni-Cr superalloys as summarized in Table 4, while similar values were determined by Juillet et al. for AMed IN 718 [33] and by Colas et al. [34], E.N’dah et al. [32], Buscail et al. [30] and Whitney et al. [35] for conventional manufactured (rolled/cast) IN 625. Slightly higher parabolic rate constants were reported by Kang et al. [29] in the case of 24 h oxidized 2 mm thick AMed IN 718. The difference can be explained by the post-processing treatments (solution heat treatment followed by aging or hot isostatic pressing (HIP) followed by aging) applied by Kang et al. [29] before the oxidizing treatment, as well as by the slightly lower Cr content and the higher content of Al and Ti. Moreover, at a lower Cr content (11.1 wt%) compared with the Cr content of IN 625, a higher parabolic rate constant of 3.79 × 10⁻⁸ kg2·m−4·s−1 was reported by Lund et al. [2].

Table 4.
kp values registered for different oxidized Ni-based superalloys.
The oxidation activation energy (Q) calculated as the slope of the Arrhenius plot of kp as a function of 1/T, where T is the temperature in Kelvin, gives a value of Q = 269.9 kJ/mol for a cumulative 96 h of oxidation time at 900 °C and 1050 °C, respectively. Almost similar values of oxidation activation energy were reported by other authors for high Cr content conventional manufactured Ni-base alloys. Berthod et al. [17] obtained a slightly lower value, 242 kJ∙mol−1, for oxidized Ni-30 wt% Cr superalloy at 1000 °C, and Encinas-Opresa et al. [37] reported a value of 270 kJ∙mol−1 for the RR1000 Ni-based superalloy (15 wt% Cr) between 700–800 °C, while for the same alloy, Cruchley et al. [38] reported a higher value of 286 kJ∙mol−1 between 600–900 °C.
For the specimens oxidized at 1050 °C, after the first exposure cycle, an almost constant mass gain until the 9th cycle (72 h exposure) was recorded, the oxide scale formation being characterized by a parabolic law. Voids and cavities were observed in the porous scale formed at 1050 °C, consistent with the defects also found by N’dah et al. [32] and Gorman et al. [39] in the oxide scale of conventional manufactured IN 625.
After the 10th cycle, a different behavior was observed, with a weight decrease being recorded. This decrease in the specimen’s weight was caused by oxide scale spallation. Oxide scale spallation and mass gain decrease were also noticed by other authors [30,34,40]. However, after the 10th oxidation cycle of AMed IN 625, the oxygen diffusion continues, and an increase of the specimen’s weight was recorded during the following two oxidation cycles.
As it was observed in the case of mass gain analysis, a parabolic evolution was also registered for both oxide scale thicknesses after 96 h of exposure at 900 °C and 1050 °C. The thickness measurements showed a fast growth of the oxide scale during the first 24 h of exposure for both oxidation temperatures, followed by a moderate growth after this cycle. In the case of the experiment realized at 900 °C, a stabilization of the oxide scale growth rate was registered in the exposure range of 48–64 h. During this time period, the oxygen diffusion rate is slowed, consistent with the findings of Kitaguchi [14]. Due to a much faster oxidation rate, at 1050 °C, the oxide scale had an almost double thickness compared with the scale obtained at 900 °C. Moreover, the partial spallation of the oxide scale was observed by SEM after 72 h of exposure at 1050 °C, a phenomenon that was not observed for specimens oxidized at 900 °C.
The oxide spallation could be caused by the oxidation kinetic, but it could be also influenced by the oxide’s morphology. The SEM analysis performed on the specimen’s top surface revealed a more compact oxide scale formed at 900 °C than at 1050 °C, where a more porous scale was formed. Dense compact oxide scales were obtained also by Juillet et al. for AMed IN 718 [33]. The two scales developed on AMed IN 625 exhibit different morphologies. An angular morphology was observed at the lower temperature, and a rounder morphology was observed at the higher temperature.
The EDS analysis performed in the four different microareas, in the oxide scale, and in the base material under the interface with the oxide layer, showed a higher Cr content at the oxide scale’s level compared with the base material. The chemical composition of the base material under the interface with the oxide layer showed a partial depletion in Cr due to the formation of chromium oxide, which was observed for both high-temperature oxidation processes, followed by different other oxides or spinels. The surface of the base material depletion in Cr caused by the outward diffusion was observed also in case of AMed IN 718 [33]. Besides a depletion of Cr near the interface, a high content of Nb and Mo was registered, which is consistent with the findings of Chyrkin et al. [31,41] who reported that Cr influences the Nb and Mo activity causing an uphill diffusion to the Cr-depleted zones towards the interface between the oxide and the alloy. This behavior was reported to be more pronounced in IN 625 thick specimens than in thin foils [41]. A high Nb content was highlighted in the oxide scale, caused by the standard free energy change of Nb oxidation reaction. Among the oxidation reactions which occur at a high temperature of all alloying elements of IN 625, the oxidation of Nb has the highest negative standard free energy, followed by Cr, Mo, and Ni [22].
The EDS analysis in the oxide scale formed during the first 24 h of exposure at 900 °C showed the presence of different amounts of other alloying elements such as Ni, Nb, Mo, and Fe, which contribute more to the formation of other phases than oxides such as δ phase, intermetallics, and carbides. Further, the Cr content in the oxide scale increases to the detriment of the other elements.
A different chemical composition evolution was registered in the case of higher-temperature oxidation. During the incipient phase, it was observed that specimens’ surfaces were free of EDS quantitatively-measurable Mo and Fe contents, but reduced amounts of Nb and Ni were detected along with a higher content of Cr. Moreover, the specimens oxidized at 1050 °C exhibit a higher Cr/ƩAE ratio in the middle and external oxide layers than those oxidized at 900 °C (0.97–0.98 at 1050 °C compared with 0.88–0.92 at 900 °C).
The phase evolution and oxide scale crystallographic nature were determined using XRD. Based on XRD results, it was concluded that the isothermal oxidation at 900 °C and 1050 °C for small periods of time (24 h) lead to multiple phases development. Secondary phases such as δ phase ((Mo, Nb)Ni3), an Ni-rich intermetallic (MoNi4), and complex carbides ((Cr, Fe, Mo, etc.)23C6) were identified, with results consistent with the findings of other authors [29,30,40,42]. Longer exposure time at 900 °C resulted only in the dissolution of complex carbides, the γ-FCC and δ phases being still present along with MoNi4 intermetallic, while the exposure at the higher temperature for longer periods produced the dissolution of δ phase, MoNi4 intermetallic, and carbides.
Regarding the oxide scale’s nature, the XRD analysis strengthened the finding of EDS results with respect to the development of Cr2O3 at both temperatures. Oxidation for 24 h at 900 °C led to the formation of Cr2O3 and a spinel (Ni, Fe)Cr2O4, while at a higher temperature, a more complex scale was registered. During the first 24 h of exposure at 1050 °C, a higher ratio of (Ni, Fe)Cr2O4 spinel was developed, followed by Cr2O3 and also by another oxide characterized by a rutile-like structure (((Cr+3(Nb, Ta)+5)(1−x)/2,(Ti+4)x)O−22). Prolonged exposure at 900 °C ensured the preservation of only the Cr2O3 scale, while at 1050 °C the same complex oxide scale was recorded.
As it was stated before, in the last decade, an increased interest in additive manufacturing metallic materials was noticed, and the reliable integration of such materials in industrial applications might be soon a tangible fact. As for conventional materials, many studies were conducted regarding their behaviors in conditions that simulate the working environment, and therefore such studies still should be conducted for additive-manufactured materials. By their nature, AMed alloys are anisotropic materials from a microstructural and mechanical point of view as compared with the materials produced by conventional manufacturing technologies. Nevertheless, no significant differences were observed in the case of the oxidation behavior of additive-manufactured IN 625, as compared with the oxidation behavior of conventional manufactured material previously reported by other authors. The activation energy of the oxidative process, as well as the parabolic rate constants, are similar to the ones reported for conventional manufactured IN 625. The oxidation behavior of additive-manufactured IN 625 at high temperatures will be studied further, focusing on the oxidation impact on the material mechanical properties.
5. Conclusions
The high-temperature oxidation behavior of SLM-manufactured IN 625 was studied over 96 h at 900 °C and 1050 °C in air. Based on experimental results, it was concluded that the oxidative process is very fast during the first 24 h of exposure at both temperatures, slowing down after this holding period. Based on the mass gain analysis, it was found that the oxidation follows a parabolic law as a function of time during the first 24 h holding. For the specimens oxidized at 900 °C, a steady mass gain was registered after 24 h (an almost linear dependence of the mass gain as a function of the exposure duration). At 1050 °C, a rapid mass gain was recorded during the first holding cycle, followed by a constant mass gain until the 9th cycle. After the 10th exposure cycle at 1050 °C, a weight decrease was registered, caused by the oxide scale spallation. The parabolic rate constants calculated for a total 96 h oxidation duration are kp = 7.23 × 10⁻¹³ g2·cm−4·s−1 at 900 °C and kp = 1.67 × 10⁻¹¹ g2·cm−4·s−1 at 1050 °C, leading to an oxidation activation energy Q = 269.9 kJ∙mol−1.
The high-temperature exposure for short periods led to the precipitation of δ phase, Ni-rich intermetallics, and complex carbides. Long holding periods at 900 °C ensured only the dissolution of carbides, while at higher temperature (1050 °C) the dissolution of all secondary phases was registered.
It was determined that during the first 24 h of exposure at 900 °C a Cr2O3 and (Ni, Fe)Cr2O4 were formed, while at 1050 °C a complex oxide scale consisting in (Ni, Fe)Cr2O4, Cr2O3 and rutile-type oxides (((Cr+3(Nb, Ta)+5)(1−x)/2,(Ti+4)x)O−22) emerged. The same complex oxide was found out even after prolonged holding periods at 1050 °C, but at 900 °C only the Cr2O3 scale was still present.
No significant differences were noticed in the case of oxidation behavior of additive-manufactured IN 625 as compared with the existing reported behavior of the conventional manufactured material.
Author Contributions
Conceptualization, M.R.C. and G.M.; methodology, M.R.C., G.M. and A.P.; investigation M.R.C., A.P., T.B., V.B.; formal analysis M.R.C. and G.M., data curation G.M., writing—original draft preparation, M.R.C. and G.M. All authors have read and agreed to the published version of the manuscript.
Funding
This research was carried out under the “Nucleu” Program, Grant no. 2N/2019, Project PN 19.05.03.01, funded by Romanian Research and Innovation Ministry, and the APC was funded by the Romanian Research and Innovation Ministry through Program 1—Development of the National Research System-Subprogram 1.2—Institutional Performance—Projects for Excellence Financing in RDI, Grant no. 3PFE/2018.
Conflicts of Interest
The authors declare no conflict of interest.
Appendix A

Table A1.
Description of the phases identified using XRD in the analyzed oxidized samples.
Table A1.
Description of the phases identified using XRD in the analyzed oxidized samples.
| Empirical Formula from PDF # | Assumed Approximate Formula | Symbol Phase Name | Structure Type |
|---|---|---|---|
| Cr0.08Fe0.65Ni0.27–PDF 04-020-3001 | (Ni, Cr, Fe, etc.) | γ γ-phase | Type A1, like Cu |
| Cr1.776Mo0.112O3–PDF 01-070-4368 | (Cr, Fe)2−2xMoxO3 | C ss Cr2O3 | Type D51, like Corundum |
| NiCr2O4–PDF 01-075-0198 | (Ni+2, Fe+2)(Cr+3, Fe+3)2O4 | S | Type H11, like Spinel |
| CrNbO4–PDF 01-081-0909 | ((Cr+3(Nb, Ta)+5)(1−x)/2(Ti+4)x)O−22 ((Cr+3(Nb, Ta)+5)(1−x)(Ti+4)2x)O−24 | R ss (Cr, Nb, Ta, Ti)O2 | Type C4, like Rutile |
| (Mo0.5Nb0.5)Ni3–PDF 04-003-9867 | (Mo, Nb)Ni3 | δ δ-phase | Type D0a, like β-TiCu3 |
| MoNi4–PDF 04-019-2633 | MoNi4 | ● | Type D1a, like MoNi4 |
| Cr23C6–PDF 04-007-8810 | (Cr, Fe, Mo, etc.)23C6 | ▰ complex carbid | Type D84, like Cr23C6 |
References
- Reed, R.C. The Superalloys: Fundamentals and Applications; Cambridge University Press: New York, NY, USA, 2006. [Google Scholar]
- Lund, C.H.; Wagner, H.J. Oxidation of Nickel-and Cobalt-Base Superalloys; DMIC Report 214; Battelle Memorial Institute: Columbus, OH, USA, 1965. [Google Scholar]
- Eiselstein, H.L.; Tillack, D.J. The Invention and Definition of Alloy 625. In Superalloys 718, 625 and Various Derivatives; TMS: Pittsburgh, PA, USA, 1991; pp. 1–14. [Google Scholar]
- DuPont, J.N.; Lippold, J.C.; Kiser, S.D. Welding Metallurgy and Weldability of Nickel-based Alloys; John Wiley & Sons, Inc.: Hoboken, NJ, USA, 2019. [Google Scholar]
- Donachie, M.J.; Donachie, S.J. Superalloys: A Technical Guide, 2nd ed.; ASM International: Cleveland, OH, USA, 2002. [Google Scholar]
- Park, S.J.; Seo, S.M.; Yoo, Y.S.; Jeong, H.W.; Jang, H.J. Statistical Study of the Effects of the Composition on the Oxidation Resistance of Ni-Based Superalloys. J. Nanomater. 2015, 1–11. [Google Scholar] [CrossRef]
- Stott, F.H. Principles of Growth and Adhesion of Oxide Scales. In The role of Active Elements in the Oxidation Behaviour High Temperature Metals and Alloys; Lang, E., Ed.; Elsevier Science Publishers Ltd.: London, UK, 1989; pp. 3–22. [Google Scholar]
- Birks, N.; Meier, G.H.; Pettit, F.S. Oxidation of alloys. In Introduction to the High Temperature Oxidation of Metals, 2nd ed.; Cambridge University Press: New York, NY, USA, 2006; pp. 101–162. [Google Scholar]
- Sato, A.; Moverare, J.J.; Hasselqvist, M.; Reed, R.C. On the Oxidation Resistance of Nickel-Based Superalloys. Adv. Mater. Res. 2011, 278, 174–179. [Google Scholar]
- Darolia, R. Development of strong, oxidation and corrosion resistant nickel-based superalloys: Critical review of challenges, progress and prospects. Int. Mat. Rev. 2019, 64, 355–380. [Google Scholar] [CrossRef]
- Brenneman, J.; Wei, J.; Sun, Z.; Liu, L.; Zou, G.; Zhou, Y. Oxidation behavior of GTD111 Ni-based superalloy at 900 °C in air. Corros. Sci. 2015, 100, 267–274. [Google Scholar] [CrossRef]
- Zhang, H.; Yang, Z.; Wu, Z.; Hong, X.; Li, Z.; Xu, Y.; Li, J.; Ni, G.; Xiao, X. Oxide-Scale Evolution on a New Ni-Fe-Based Superalloy at High Temperature. Oxid. Met. 2019, 92, 49–65. [Google Scholar] [CrossRef]
- Chattopadhyay, B.; Wood, G.C. The transient oxidation of alloys. Oxid. Met. 1970, 2, 372–399. [Google Scholar] [CrossRef]
- Kitaguchi, H. Microstructure-Property Relationship in Advanced Ni-Based Superalloys. In Metallurgy–Advances in Materials and Processes; Pardhi, Y., Ed.; IntechOpen: Rijeka, Croatia, 2012; pp. 19–42. [Google Scholar]
- Lai, H. High Temperature Oxidation and Corrosion of Ni-Based Superalloy for industrial Gas Turbines. Ph.D. Thesis, Chalmers University of Technology, Gothenburg, Sweden, 2014. [Google Scholar]
- Pint, B.A.; Dryepondt, S.; Unocic, K.A. Oxidation of Superalloys in External Environments. In Proceedings of the 7th International Symposium on Superalloy 718 and Derivatives, Pittsburgh, PA, USA, 10–13 October 2010; Ott, E.A., Groh, J.R., Banik, A., Dempster, I., Gabb, T.P., Helmink, R., Liu, X., Michell, A., Sjoberg, G.P., Wusatowska-Sarnek, A., Eds.; TMS: Pittsburgh, PA, USA, 2010; pp. 861–875. [Google Scholar]
- Berthod, P. Kinetics of High Temperature Oxidation and Chromia Volatilization for a Binary Ni-Cr Alloy. Oxid. Met. 2005, 64, 235–252. [Google Scholar] [CrossRef]
- Huang, L.; Sun, X.F.; Guan, H.R.; Hu, Z.Q. Oxidation Behavior of a Single-Crystal Ni-base Superalloy in Air at 900, 1000 and 1100 °C. Oxid. Met. 2006, 65, 207–222. [Google Scholar] [CrossRef]
- Li, M.H.; Sun, X.F.; Jin, T.; Guan, H.R.; Hu, Z.Q. Oxidation Behavior of a Single-Crystal Ni-base Superalloy in Air–II: At 1000, 1100, and 1150 °C. Oxid. Met. 2003, 60, 195–210. [Google Scholar] [CrossRef]
- Li, M.H.; Sun, X.F.; Li, J.G.; Zhang, Z.Y.; Jin, T.; Guan, H.R.; Hu, Z.Q. Oxidation Behavior of a Single-Crystal Ni-Base Superalloy in Air I: At 800 and 900 °C. Oxid. Met. 2003, 59, 591–605. [Google Scholar] [CrossRef]
- Young, D.J. The Nature of High Temperature Oxidation. In High Temperature Oxidation and Corrosion of Metals; Burstein, T., Ed.; Elsevier: Cambridge, UK, 2008; Volume 1, pp. 1–27. [Google Scholar]
- Staszewska, K.; Scendo, M. Mechanism and Kinetics Oxidation of Inconel 617 and Inconel 625 Alloys. Tech. Issues 2016, 1, 82–89. [Google Scholar]
- Vesel, A.; Drenik, A.; Elersic, K.; Mozetic, M.; Kovac, J.; Gyergyek, T.; Stockel, J.; Varju, J.; Panek, R.; Balat-Pichelin, M. Oxidation of Inconel 625 superalloy upon treatment with oxygen or hydrogen plasma at high temperature. Appl. Surf. Sci. 2014, 305, 674–682. [Google Scholar] [CrossRef]
- Molins, R.; Andrieu, E. Analytical TEM study of the oxidation of nickel based superalloys. J. Phys. IV France 1993, 3, 469–475. [Google Scholar] [CrossRef][Green Version]
- Sand, T.; Geers, C.; Cao, Y.; Svensson, J.E.; Johansson, L.G. Effective Reduction of Chromium-oxy-hydroxide Evaporation from Ni-Base Alloy 690. Oxid. Met. 2019, 92, 259–279. [Google Scholar] [CrossRef]
- Santecchia, E.; Spigarelli, S.; Cabibbo, M. Materials Reuse in Laser Power Bed Fusion: Side Effects on the Laser-Metal Powder Interaction. Metals 2020, 10, 341. [Google Scholar] [CrossRef]
- Qin, H.; Xu, R.; Lan, P.; Wang, J.; Lu, W. Wear Performance of Metal Materials Fabricated by Powder Bed Fusion: A Literature Review. Metal 2020, 10, 304. [Google Scholar] [CrossRef]
- Nagahari, T.; Nagoya, T.; Kakehi, K.; Sato, N.; Nakano, S. Microstructure and Creep Properties of Ni-Base Superalloy IN718 Built up by Selective Laser Melting in a Vacuum Environment. Metals 2020, 10, 362. [Google Scholar] [CrossRef]
- Kang, Y.J.; Yang, S.; Kim, Y.K.; AlMangour, B.; Lee, K.A. Effect of post-treatment on the microstructure and high-temperature oxidation behaviour of additively manufactured Inconel 718 alloy. Corros. Sci. 2019, 158, 108082. [Google Scholar] [CrossRef]
- Buscail, H.; Rolland, R.; Issartel, C.; Rabaste, F.; Riffard, F.; Aranda, L.; Vilasi, M. Effects of water vapour on the oxidation of a nickel-base 625 alloy between 900 and 1100 °C. J. Mater. Sci. 2011, 46, 5903–5915. [Google Scholar] [CrossRef]
- Chyrkin, A.; Huczkowsiki, P.; Shemet, V.; Singheiser, L.; Quadakkers, W.J. Sub-Scale Depletion and Enrichment Process During High Temperature Oxidation of the Nickel Base Alloy 625 in the Temperature Range 900–1000 °C. Oxid. Met. 2011, 75, 143–166. [Google Scholar] [CrossRef]
- N’dah, E.; Hierro, M.P.; Borrero, K.; Perez, F.J. Study of the Cyclic Oxidation Resistance of Superalloy IN 625: Lifetime Predicted by COSP-Modelling Program. Oxid. Met. 2007, 68, 9–21. [Google Scholar] [CrossRef]
- Julliet, C.; Oudriss, A.; Balmain, J.; Feaugas, X.; Pedreza, F. Characterization and Oxidation resistance of additive manufactured and forged IN718 Ni-based superalloys. Corros. Sci. 2018, 142, 266–276. [Google Scholar] [CrossRef]
- Colas, J.; Charpentier, L.; Balat-Pichelin, M. Oxidation in Air at 1400 K and Optical Properties of Inconel 625, FeCrAlloy and Kanthal Super ER. Oxid. Met. 2020, 93, 355–370. [Google Scholar] [CrossRef]
- Whitney, E.; Simkovich, G.; Fink, J. High Temperature Oxidation of a Modified Alloy 625. In Superalloys 718, 625, 706 and Various Derivatives; Loria, E.A., Ed.; TMS: Pittsburg, PA, USA, 1997; pp. 695–704. [Google Scholar]
- Kumar, L.; Venkataramani, R.; Sundararaman, M.; Mukhopadhyay, P.; Garg, S.P. Studies on the Oxidation Behavior of Inconel 625 Between 873 and 1523 K. Oxid. Met. 1996, 45, 221–244. [Google Scholar] [CrossRef]
- Encinas-Orpesa, A.; Drew, G.L.; Hardy, M.C.; Leggett, A.J.; Nichollas, J.R.; Simms, N.J. Effects of Oxidation and Hot Corrosion in a Nickel Disc Alloy. In Superalloys 2018; Reed, R.C., Green, K.A., Caron, P., Gabb, T.P., Fahrmann, M.G., Huron, E.S., Woodard, S.A., Eds.; TMS: Pittsburg, PA, USA, 2008; pp. 609–618. [Google Scholar]
- Cruchley, S.; Evans, H.E.; Taylor, M.P.; Hardy, M.C.; Stekovic, S. Chromia layer growth on a Ni-based superalloy: Sub-parabolic kinetics and the role of titanium. J. Corr. Sci. 2013, 75, 58–66. [Google Scholar] [CrossRef]
- Gorman, D.M.; Higginson, R.L.; Du, H.; McColvin, G.; Fry, A.T.; Thomson, R.C. Microstructural Analysis of IN617 and IN 625 Oxidised in the Presence of Steam for use in Ultra-Supercritical Power Plant. Oxid. Met. 2013, 79, 553–566. [Google Scholar] [CrossRef]
- Mariano de Sousa Malafaia, A.; Brino de Oliveira, R.; Latu-Romain, L.; Wouters, Y.; Baldan, R. Isothermal oxidation of Inconel 625 superalloy at 800 and 1000 °C: Microstructure and oxide layer characterization. J. Mater. Char. 2020, 161, 110160. [Google Scholar] [CrossRef]
- Chyrkin, A.; Huczkowsiki, P.; Shemet, V.; Singheiser, L.; Quadakkers, W.J. Predicting Subsurface Enrichment/Depletion Processes During High-Temperature Oxidation of Alloy 625 Thin Foils. Australas. Corros. Assoc. 2012, 2, 1556. [Google Scholar]
- Garcia-Fresnillo, L.; Chyrkin, A.; Böhme, C.; Barnikel, J.; Schmitz, F.; Quadakkers, W.J. Oxidation behaviour and microstructural stability of alloy 625 during long-term exposure in steam. J. Mater. Sci. 2014, 49, 6127–6142. [Google Scholar] [CrossRef]
© 2020 by the authors. Licensee MDPI, Basel, Switzerland. This article is an open access article distributed under the terms and conditions of the Creative Commons Attribution (CC BY) license (http://creativecommons.org/licenses/by/4.0/).