Abstract
In this work, SiCp/7085 composites with a volume fraction of 10% were fabricated by ultrasonic stirring casting. The evolution of the microstructure and wear properties of SiCp/7085 composites, as well as the mechanism of ultrasonic action in the process of preparation, when the ultrasonic treatments last for 0 min, 5 min, 10 min, and 15 min, respectively, were studied using the optical effects (OM), scanning electron microscope (SEM), and X-ray diffraction (XRD). The experimental results show that the high temperature and high pressure formed by the cavitation of ultrasound can effectively eliminate the cluster of particles, improve the distribution of SiC particles, increase the interfacial wettability of the composites, and form MgAl2O4 and MgO on the particle surface, thereby ultimately improving the wear resistance of the composites. Because the particles in the melt are affected by the segregation effect of ultrasonic standing wave field, there exists an optimal value for the ultrasonic treatment time. When the melt is treated with the ultrasonic wave with an amplitude of 12 μm and a treatment duration of 10 min in the test conditions given in this paper, the composites have the most uniform distribution of particles, the best wear resistance, a large and stable friction coefficient, and the minimum weight loss of sample wear: 12 mg. The change of wear resistance is consistent with the variation of solidification structure and interface properties.
1. Introduction
Silicon carbide particle-reinforced aluminum-based (SiCp/Al) composites have outstanding advantages such as high specific strength, large specific stiffness, small thermal expansion coefficient, and good thermal conductivity. Therefore, they have attractive application prospects and development potential in clutches and braking devices used in key sectors including aerospace, weapons and equipment, automotive products, and engineering machinery [1,2]. Because differences in the physical properties of the SiC particles and the aluminum matrix exist, and the gases and impurities attached to the surface of the SiC particles severely hinder the combination of the particles and the melt, consequential defects such as voids and agglomerations have degraded the composites, which has extremely restricted their wide application [3,4]. Currently, there are several methods to improve the performance of the composites by enhancing the interface structure and particle distribution, such as adjusting the matrix composition, reinforcing the surface modification, optimizing the preparation process parameters, introducing physical external fields, etc. Among these methods, the ultrasonic treatment (UST) technique is an innovative process in the field of preparation of composites. This advanced technique can be used simultaneously with other processes, and has attracted much attention in recent years and achieved considerable development [5,6]. TJONG et al. [7] obtained SiC particles tightly bound to the substrate, with clear boundaries in ZA27/SiCp composites fabricated by high-energy ultrasound, and found that the wear resistance of 10% ZA27/SiCp was more than 10 times that of the substrate ZA alloy. By using TiO2 and Al-Mg alloys as raw materials, PAN et al. [8] prepared metal matrix composites with Al3Ti and MgAl2O4 as main reinforcements by high-energy ultrasound. These composites feature uniformly distributed reinforced particles and stable material properties [8]. The results show that ultrasound can improve the uniformity of particle distribution and interface bonding, and has a significant effect on the performance of composites. Two groups of SiCp/Al Si composites were prepared by Eskin et al. [9]. It was found that the particle space distribution of the composites was more uniform when ultrasonic was applied. It was thought that the ultrasonic cavitation effect promoted the wettability of the aluminum melt to the non-metallic particles and made them evenly distributed in the solidified structure. However, there has been little study on the wear resistance of the composites after the particle distribution is improved by ultrasonic vibration. Jiyu Ma et al. [5] prepared TiN/Al composites by ultrasonic vibration. It was found that ultrasonic vibration enhanced the bonding strength between TiN particles and Al matrix, which greatly improved its mechanical and wear properties. However, it still remains unclear of the law and mechanism of ultrasonic processing technology in metal matrix composites, namely, how does the ultrasonic field affect the particle distribution and interfacial bonding in SiCp/Al composites, thus improving the friction and wear properties of the composites? Therefore, in this paper, the 7085/SiCp composites were prepared by high-energy ultrasonic treatment, the effect of ultrasonic treatment time on particle distribution and interfacial bonding was analyzed during the preparation, and the relationship between microstructure evolution and wear behavior was studied to explore the mechanism of the UST.
2. Experiment
2.1. Materials
In the experiment, 7085/SiC metal matrix composites were prepared by combination of SiC particles and 7085 aluminum alloy. The commercially available 400-mesh SiC particles, with an average size no larger than 37 μm, are used as the reinforcement. The aerospace high-strength 7085 aluminum alloy is used as the matrix, and the material is taken from the industrially produced 7085 aluminum alloy round ingots, whose chemical compositions are shown in Table 1.

Table 1.
Components of 7085 aluminum alloy (mass fraction/%).
2.2. Experimental Equipment and Scheme
Figure 1 shows the schematic of ultrasonic stirring casting device made of 7085/SiC composites. The ultrasonic vibration system consists of a piezoelectric ceramic transducer, a ultrasonic amplitude transformer, and a φ50 mm × 110 mm titanium alloy sonotrode.
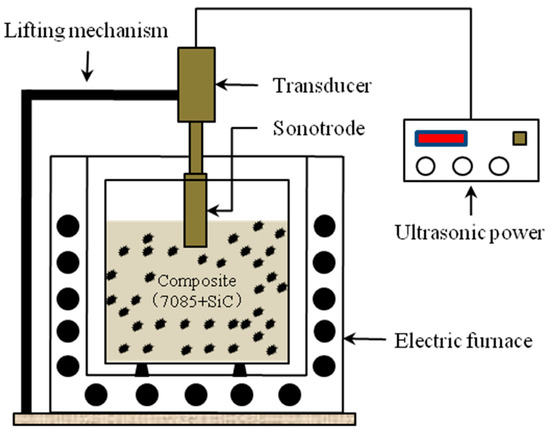
Figure 1.
Diagram of ultrasonic casting experimental apparatus.
The manufacturing process of SiCp/7085 composite is as follows.
(1) Pour the SiC particles into a beaker, wash with 5% hydrofluoric acid, ultrasonic in water, and collect SiC particles in the beaker, the SiC particles were calcined at 1000 °C to form a layer of SiO2 on the surface of the SiC particles and then sieved through a 400-mesh sieve. Finally, the SiC particles were screened as backup. The particles shall be preheated to 625 °C before the preparation of the composites.
(2) Put a certain amount of 7085 aluminum alloy into the crucible, heat it to 800 °C in a resistance furnace, add aluminum slagging agent to remove the slag after holding for a while. When the melt cools to 625 °C, add the pretreated SiC particles into the 7085 aluminum alloy melt for obtaining SiCp/7085 composites with a volume fraction of 10%, stirred the composites in semisolid state for 5 min and then heat them to 800°C using the furnace.
(3) The pre-heated sonotrode was inserted into the melt at a depth of 25 mm below the melt surface to prevent oxidation films from getting involved in melt. The ultrasonic amplitude and the frequency of vibration were 12 µm and 20 kHz, respectively, which represent the maximum equipment power and output frequency that the existing equipment can provide. After the ultrasonic treatment time was set to 0 min, 5 min, 10 min, and 15 min, respectively, the sample was cast with a 45 steel mold whose cavity has a size of 15 mm × 15 mm × 150 mm. The iron mold was preheated to 400 °C before casting and quenched immediately after casting. Then took a 20 mm block at the center section in the 20 mm and 50 mm thickness of the ingot, respectively. After the grinding, rough grinding, fine grinding, and polishing, the morphology interface of the sample was observed in TESCAN SEM (Tescan, Brno, Czech Republic) and the quantitatively analysis of it was conducted by an EDS-OXFORD spectrometer (OXFORD, Oxford, UK). The sample was chemically etched by electrochemical corrosion device for 5–20 min; the electrolyte is HNO3 with mass fraction of 50–60%, and the voltage and current density are 24 V and 20–80 A/dm2, respectively. The particles were exposed, the microscopic changes of the particle surface were observed under scanning electron microscope, and the composition of the particle surface was analyzed by energy dispersive spectroscopy (EDS). The phase composition of the composite is analyzed by Riga/Ku D/max 2500 X-ray (RIGAKV, Tokyo, Japan). The scanning range is 10 to 90°, and the scanning speed is 8°/min.
(4) The block-shaped sample was processed into a 6 mm × 7 mm × 31 mm section, and then deburred and polished with sandpaper (The sandpaper number is from 1000 to 1500). A MM-2000 dry friction tester (YINUO, Jinan, China), containing a GCr15 ring with a grinding ring of Φ40 mm and a rockwell hardness of 62HRC, was used to test the sample, as shown in Figure 2. The equipment is placed in a constant temperature and humidity environment, in which the ambient temperature is controlled at 18–26 °C and the relative humidity is controlled at 45–65%. The rotation speed of the friction ring and the friction distance are 200 r/min and 12000 r/min, respectively. The friction sample is taken down every 15 min, washed clean with alcohol and dried, then weighed to calculate the weight loss of sample friction. During the test, the friction torque is recorded once every 1000 cycles, and the friction coefficient is calculated through formula conversion after the test. The surface morphology of the tested sample was observed in SEM and EDS.
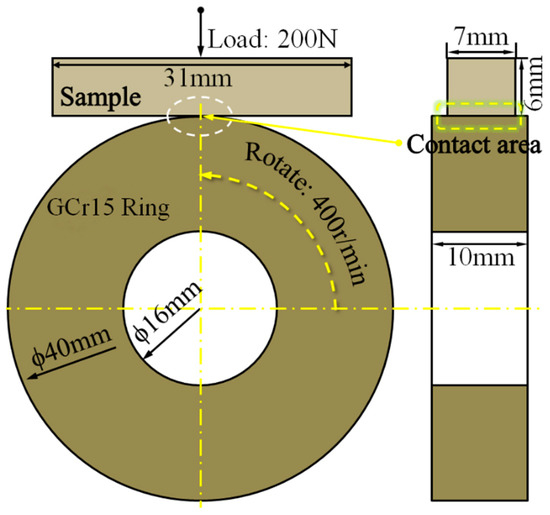
Figure 2.
Schematic diagram of friction wear test.
2.3. Experiment Characterization Methods
In order to accurately reflect the distribution of SiC particles in the composite structure, a comprehensive description of the distribution rules of SiC particles can be present in the following way.
First, we need to set the region S and photograph the region, in which the number of SiC particles should not be less than 200. We then should divide the area into 12 subareas and count the number of the SiC particles zi for each area, and calculate the average number of SiC particles in the area of micro. Thus, the relative standard deviation of SiC particle number can be calculated by Equation (1):
Clearly, the parameter can clearly indicate the distribution of the SiC particles in the different area. The smaller value of , the more uniform of the distribution of SiC particles in each area. However, it still cannot represent the agglomeration of SiC particles in this area, or within the whole region S. Figure 3 shows the schematic diagram of distribution about particles in micro zone under the same and different β particles with obvious deviation phenomenon in Figure 3b, so we still need to introduce another parameter to gather accurate quantitative analysis.
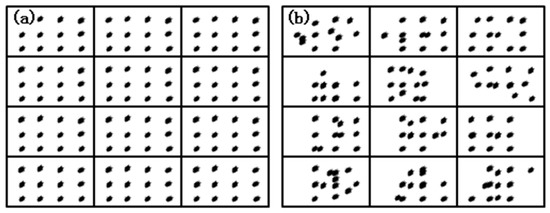
Figure 3.
Schematic diagram of distribution about particles in micro zone under the same and different β. (a) β = 0 and (b) β > 0).
First, the same region S was divided into 12 regions, the nearest neighbor for each of the SiC particles in the area was identified, and then the distance between two particles xi was measured. The average of the shortest distance can be calculated by Equation (2):
Then, the parameter of β is calculated as follows.
It can be seen that the smaller value of the β, the smaller the degree of agglomeration for SiC particles, and the better the uniformity of its distribution in the composite.
3. Results
3.1. Interface Morphology of Composites
Figure 4 shows the morphology of SiCp/7085 composites sample taken at the center section in the 20 mm and 50 mm thickness of the ingot. There are pores and clusters in the ingot structure without ultrasonic field applied into the melt, as shown in Figure 4A,E. The porosity levels of the samples treated with ultrasonic for 0 min, 5 min, 10 min are 13.21%, 6.33%, 5.46%, and 4.85%, respectively. There is a gas layer between the particles and the substrate and there is no complete contact between them; moreover, the wetting condition at the interface is poor, as shown in Figure 4a,e. After comparing Figure 4B–D, it can be found that the number of pores and particle segregation in the ingot was significantly improved after the ultrasonic field is applied; SiC particles were distributed most uniformly under ultrasonic vibration for 10 min, but the particles tend to agglomerate after 15 min. In Figure 4b–d, the gas layer between the particles and the matrix was broken, the wetting condition between the two was significantly improved, and the interface was the wetting of the composite; the interface bonding state at 15 min was basically the same as the interface bonding state at 10 min of ultrasonic vibration, which was better than the interface bonding state at 5 min of vibration. The distribution of particles and the interface of composite in the 50 mm thickness of the ingot is consistent with the thickness of 20 mm, as shown in Figure 4F–H and Figure 4f–h.
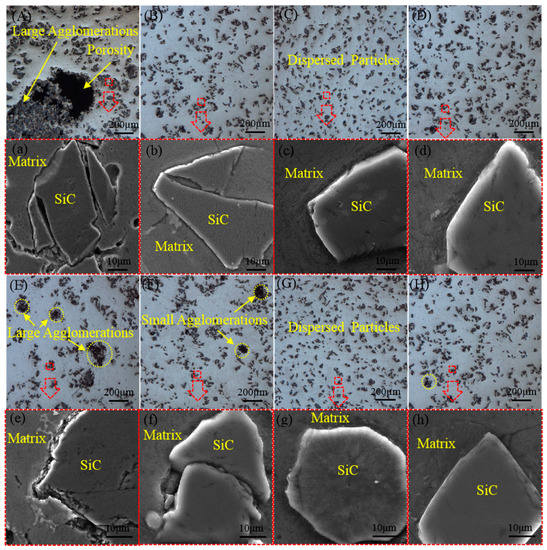
Figure 4.
Effect of ultrasonic treatment time on optical morphology of SiCp/7085 composites under certain amplitude of 12 µm: panels (A–D) show the distribution of particles and panels (a–d) show the interface of composite in the 20mm thickness of the ingot after 0min, 5 min, 10 min, and 15 min; panels (E–H) show the distribution of particles and panels (e–h) show the interface of composite in the 50 mm thickness of the ingot after 0 min, 5 min, 10 min, and 15 min.
Figure 5 shows the homogeneity parameter of and β of the composites under different ultrasonic vibration time. It is further confirmed that the particle uniformity will be improved with the increase of ultrasonic treatment time, but the value of is basically similar after ultrasonic vibration for 10 min. When the value of β increases, a certain degree of segregation of SiC particles has occurred in the local range.
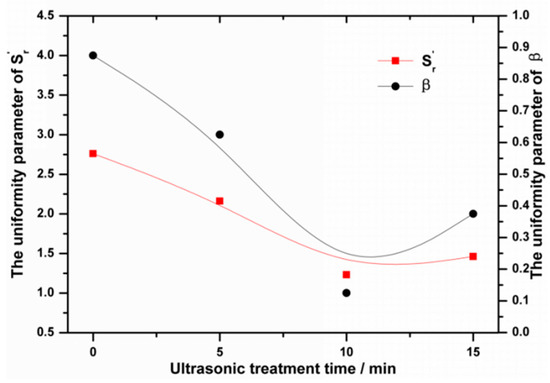
Figure 5.
Uniformity parameter of and β under different ultrasonic treatment times.
The interface products on the surface of the particles and their morphology during the preparation of SiCp/7085 composites are shown in Figure 6. Table 2 shows the average results of three random sample points of the energy spectrum of each particle. It can be known from Table 2 that the main elements on the surface of the particles in Figure 6A are C, O, Si, and Al. Matrix elements such as Mg, Zn, and Cu were not found, and the product was mainly Al4C3.The formation of Al4C3 is the result of discontinuous SiO2 layer on SiC particles surface. It is probably the result of the agglomeration of SiC during preheating and the destruction of some agglomerates during manufacturing. It indicates that the elements in the matrix do not diffuse to reinforcement particles, the melt does not directly contact the particles, and the interface bonding state is poor. When the ultrasonic vibrationin is introduced into the melt, the Mg element content on the surface of the particles increases with the go-up of ultrasonic vibration time, as shown in Figure 6B–D. The interface reaction products are arranged orderly on the surface of the particles to form a serrated and uniform interface reaction layer. A layer of reaction products with MgAl2O4 appear in the original Al4C3 gap after ultrasonic vibration application by EDS and XRD, which are staggered and uniformly distributed on the particle surface to form a dense protective layer, and the size is basically below 1 μm. The formation of MgAl2O4, covering the surface of SiC particles, is the result of SiO2 layer reacting with Al and Mg in the alloy, which can also prevent SiC particles from reacting with Al liquid to generate Al4C3. Figure 6D shows a layer of reaction products with MgO and MgAl2O4. The change of magnesium concentration in the matrix near the interface caused by matrix segregation and element migration will change the product and normally form MgAl2O4 first. However, ultrasound will change the Mg content distribution on the particle surface, causing Mg elements to form aggregates on the particle surface, thus forming MgO after a period of time.
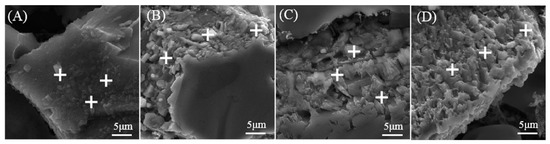
Figure 6.
SEM image of SiCp/7085 composites interface products under different ultrasonic treatment time: (A) 0 min; (B) 5 min; (C) 10 min; (D) 15 min.
Table 2.
Energy dispersive spectroscopy (EDS) and X-ray powder diffraction (XRD) results of SiCp/7085 composites in Figure 6 (mole fraction /%).
3.2. Wear Resistance of Composites
Figure 7 shows the wear surface of the SiCp/7085 composite under different ultrasonic treatment times. Figure 7A is a SEM image of the wear surface of the composites after semisolid stirring. There is a pore defect ~0.4 mm long on the friction surface. At the same time, the matrix with particles falls off in a large area, forming a large range of adhesive wear. Figure 7B shows the wear surface of the composite when ultrasonic vibration amplitude is 12 μm for 5 min. It can be seen from the figure that there are no pores on the wear surface and the adhesive wear area is reduced. After ultrasonic vibration for 10 min, the wear surface of the composite is as shown in Figure 7C. From the figure, it can be seen that there are no pores on the wear surface and the adhesive wear off area. At the same time, there are white spots on the wear surface; this is the debris formed by abrasive wear. There are also thin and shallow furrows on the wear surface formed by abrasive wear, which indicate that the wear of composite material has changed from adhesive wear to abrasive wear at this time. The wear surface of composite material after ultrasonic vibration for 15 min is shown in Figure 7D, abrasive wear and adhesive wear coexist, and the wear surface not only has white wear debris formed by abrasive wear, but also has adhesive wear The small area of damage formation falls off.
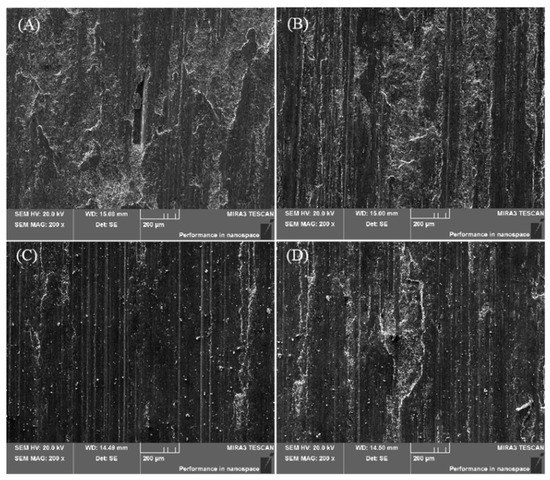
Figure 7.
SEM image of SiCp/7085 composites surface after friction-wear test under different ultrasonic treatment time: (A) 0 min; (B) 5 min; (C) 10 min; (D) 15 min.
Figure 8 shows the weight loss of sample wear and friction coefficient of SiCp/7085 composites under different ultrasonic times. It can be seen from the figure that the composites, treated with ultrasonic amplitude of 12 µm for 10 min, have the smallest mass loss under the same friction distance, and the value of friction coefficient is large and stable, indicating that the SiCp/7085 composites have good wear resistance in this process. According to statistics, the average and standard deviation of the friction coefficient of the composites without ultrasonic treatment are 0.462 and 0.059, respectively. The average and standard deviation of the friction coefficient of the composite after ultrasonic treatment for 5 min, 10 min, and 15 min are (0.495, 0.022), (0.557, 0.016), and (0.552, 0.039), respectively. The friction coefficient values are 7.1%, 19.5%, and 20.7% higher than those without ultrasonic treatment. The results show that the composites formed by ultrasonic for 10 min has not only large friction coefficient but also more stable. In addition, the evolution in the wear resistance of the composites in Figure 8 is consistent with the change in the solidified structure in Figure 4 and the change in the interface properties in Figure 6.
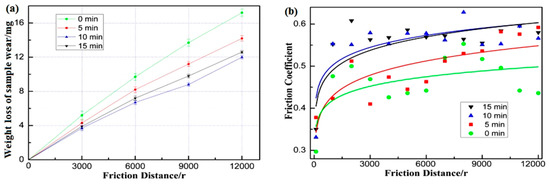
Figure 8.
Weight loss of sample wear (a) and friction coefficient (b) of SiCp/7085 composites after wear test.
4. Analysis and Discussion
4.1. Mechanism of Ultrasonic Wave
4.1.1. Mechanism of Eliminating Agglomeration by Ultrasonic
When ultrasound is not applied in aluminum melt, the SiC particles are difficult to wet. The particles are mainly affected by van der Waals force, capillary force, and electrostatic force in the melt, which generates agglomeration and pores. The electrostatic force on the surface of the pretreated particles can be ignored, and after the particles are agglomerated, the forces are mainly van der Waals force Fvw [10] and capillary force Fm [11]:
In Equation (4), the HamaKer constant A ≈ 8.86 × 10⁻²⁰ [12], the radius of the two particles r1 = r2 = 18.5 μm, h is the center distance between two spherical particles, the minimum distance between the particles l is ~0.5 nm [10], and the maximum Van der Waals force between the two particles is calculated to be ~39.9 mN. In Equation (5), the contact angle θ = 127 °; ∂ is the contact angle θ function, which is usually small; the surface tension and surface tension σ = 0.86N/m [10]; and the calculated capillary force is about 199.8 μN. It can be seen that the maximum force of particle aggregation is ~40,099.8 μN. The minimum pressure generated by the cavitation bubble to break the particle clusters can be expressed by Equation (6):
where Aeffective is the effective contact area of the particles.
Figure 9 shows the reunion particles influenced by ultrasonic in the melt. The ultrasonic cavitation effect is a series of non-linear acoustic phenomena generated by ultra-high frequency sound waves propagating in a metal melt. Alternating sound pressure causes some particles in the metal melt to be pulled to produce cavitation bubbles. Considerably large temperature gradients and pressure gradients can be produced instantly in extremely limited volumes. According to the Rayleigh–Plesset formula [13], a cavitation bubble growth collapse model for composite melts is described in Equation (7):
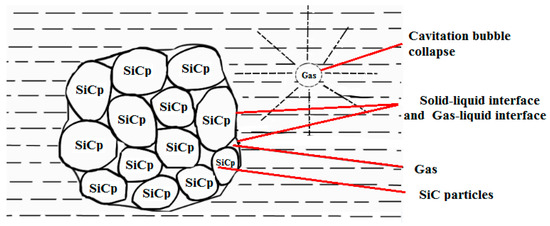
Figure 9.
Schematic diagram of reunion particles influenced by ultrasonic in the melt.
In Equation (7), the radius and initial radius of the cavitation bubble are R and R0, respectively; the initial pressure P0 is taken as 105 pa; the cavitation bubble vapor pressure and the ultrasonic sound pressure amplitude are Pv and Pm and σ = 0.86 N/m; and the gas multilateral index K, because the cavitation bubble collapse time is short, can be assumed as an adiabatic collapse process, with a value of 4/3 and an ultrasonic angular velocity of w. Bubbles or vapor bubbles with a radius of less than 100 μm in the liquid can form ultrasonic cavitation bubble nuclei, while bubbles with a radius greater than 100 μm will float up and escape due to buoyancy [14]. Using this model, the initial radius of cavitation bubbles is calculated as 1 μm and 100 μm, respectively, and the calculated cavitation bubble radius and pressure curves in the melt are shown in Figure 10. Cavitation bubbles with an initial radius of 1 μm and 100 μm can produce pressures as high as 1.53 × 10¹¹ pa and 7.86 × 10⁹ pa, respectively, which is much larger than the minimum pressure 5.6647 × 10⁷ pa that is required to break particles. In addition, because of the agitation of ultrasonic flow, the dispersed particles flow with the melt, which promotes the macroscopic distribution of the particles [13].
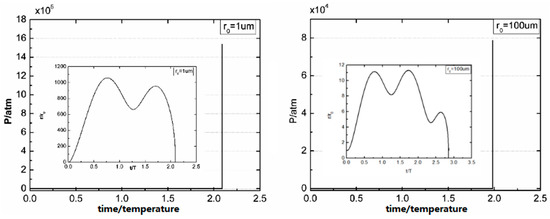
Figure 10.
Curves of cavitation bubble motion and cavitation pressure.
4.1.2. Mechanism of Ultrasound to Improve Interface Bonding
The high temperature and pressure generated by the cavitation effect of ultrasound will form a large number of micro-jets in the melt near the gas layer [14,15], which effectively breaks down the oxide film. The micro-turbulence formed will entangle the oxide film into the melt. The gas layer is continuously transformed into micro-bubbles that will escape into the melt. As a result, the pores between the particles in the composite sample and the matrix gradually disappear, and the interface bonding condition is significantly improved, as shown in Figure 11. Moreover, the degassing of the ultrasonic cavitation effect will greatly reduce the gas content in the melt, especially at the sharp corners of the particle surface, thereby greatly improving the wettability between the SiC particles and the melt, as shown in Figure 12. In the ultimate solidified microstructure, the number of pores is greatly reduced on the macro-scale, the particles are distributed uniformly, and the interfaces of the composites on the micro-scale are bonded more tightly and firmly.
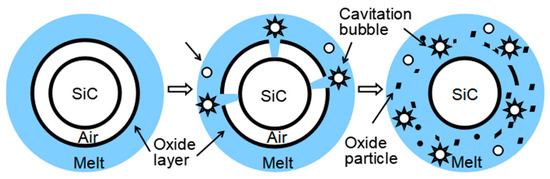
Figure 11.
Schematic of ultrasonic wetting.
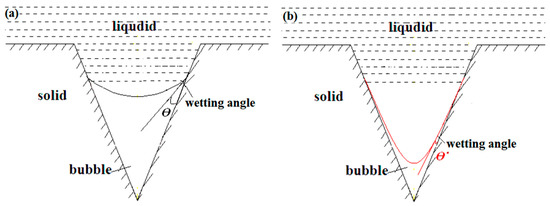
Figure 12.
Schematic model of wetting angle in (a) non-ultrasonic field and (b) ultrasonic field.
The interface bonding after sonication is shown in Figure 13. Due to the effect of periodic positive and negative pressure, the Mg element can escape with cavitation bubbles to the vicinity of the interface that the bubbles are attached, the wetting angle θ increases, and enrichment occurs near the interface, which promotes the generation of MgO and MgAl2O4, blocks the direct contact between SiC particles and the Al melt, and inhibits the production of Al4C3. Meanwhile, the ultrasound improves the interface bonding, so that the interface reaction fully expands laterally on the particle surface and the initial adhesion work of the wetting system increases. With the acceleration of nucleation of the reaction product, the product becomes smaller and tighter [16].
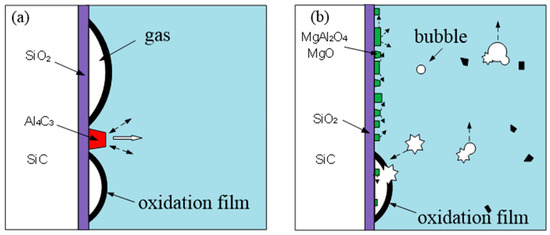
Figure 13.
Schematic of interfacial bonding in SiCp/7085 composites fabricated by ultrasound-assisting. (a) Treated by conventional stirring; (b) treated by ultrasonic agitation.
4.1.3. Agglomeration of the Ultrasonic Field on the SiC Particles
Because the SiC particles are insoluble in the aluminum melt, the particles agglomerate and disperse to form a suspension in the ultrasonic field. The fine SiC particles in the suspension will stand in the ultrasonic field. Subject to the effects of acoustic radiation force, Stokes resistance, and effective buoyancy, as shown in Figure 14, the equation of motion of particles can be expressed in Equation (8) [17]:
where , , , x, t, , , and are the density of the SiC particles, the volume of the SiC particles, the additional mass on the SiC particles, the distance from the SiC particles to the sound pressure node or sound pressure belly, time, the acoustic radiation force, effective floating lift, and Stokes resistance, respectively. The items in Equation (8) can be expressed in Equations (9)–(15).
where ρ, μ, c, , K, E, G, P, A, and f are density, viscosity, the propagation speed of sound waves, the diameter of the particles, number of waves, the average sound energy density in time, the acoustic ratio factor of the suspension, sound pressure, the amplitude of the radiation rod, and the frequency of the ultrasonic vibration, respectively. Additionally, the subscripts of l and p represent liquid and particles, respectively. Then, when the particle’s equation of motion is in equilibrium, the particle will be at the sound pressure knot or sound pressure belly of the ultrasound.
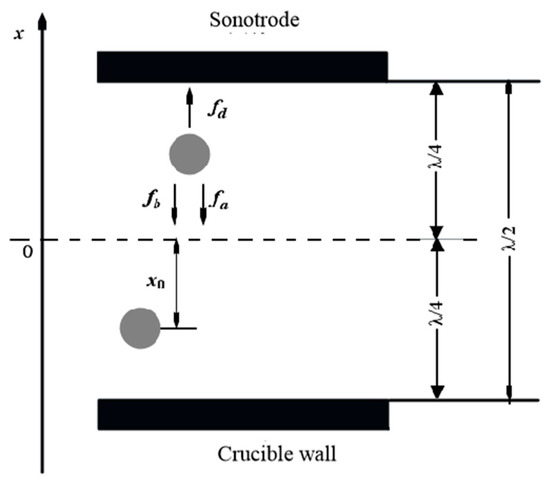
Figure 14.
Physical model of particles in ultrasonic field.
When and , the motion equation of SiC particles under equilibrium conditions can be calculated by Equation (16):
where represents the distance between the particle and the sound pressure node or the abdomen in the equilibrium state. It can be seen that the initial position of the particles does not affect its final agglomeration position, nor does it specify the specific sound pressure node or belly. As a result, when the particles reach an equilibrium state, the approximate solution of the time that the agglomeration requires can be calculated using Equation (17).
where and represent the distance between the particle and the sound pressure node in the equilibrium state, and the distance from the initial position of the particle to the sound pressure node. The SiC particles will agglomerate in ultrasonic field at some point, which is consistent with the experimental results of SiC particles agglomeration when the ultrasonic vibration treatment is performed for 10 min as shown in Figure 4.
4.2. Wear Resistance Analysis of Composites
In Figure 7A, the weight loss of sample wear is large and the friction coefficient is small and unstable, because the particles in the composite are agglomerated and the particles are not tightly bonded to the matrix. After the contact with the grinding ring, the composites will undergo significant plastic deformation. At the same time, the shearing force of the grinding ring on the composites is far greater than the bonding force between the particles and the matrix in the composites and the strength of the matrix. Many particles fall off, forming a large area of adhesive wear. Significant plastic rheology is formed at the edge of the composite peeling zone, which causes a large weight loss of sample wear. When the detached matrix is mixed with the particles and continuously accumulates into a large volume of abrasive debris between the frictional contact surfaces, the friction moment of the composites against the abrasive part instantly increases, and its increase causes its friction coefficient to go up. When the friction surface is extruded, the friction coefficient of the composites decreases rapidly. Therefore, the friction coefficient of the composites after stirring has the characteristics of small value, large fluctuation, and instability.
There are no large-scale pores in the solidified structure after ultrasonic treatment for 5 min, and the particles are closely bound to the matrix. However, the small-scale particles agglomeration phenomenon occurs. In the process of friction loss experiment, the area of particles agglomeration will fall off due to weak binding force, resulting in adhesive wear. Because the size of particles agglomeration in the solidified structure becomes smaller, the area of adhesive wear will be reduced, The wear quality of the sample formed by ultrasonic treatment for 5 min is smaller than that of the sample formed by mechanical agitation, and friction coefficient is smaller. In addition, some evenly dispersed particles have a high bonding strength with the matrix and will not break away. In the process of continuous friction, they gradually move to the friction surface and form some abrasive wear. However, adhesive wear plays a major role in the wear resistance of the composites.
In the solidification structure after ultrasonic treatment for 10 min, the SiC particles are uniformly dispersed and non-agglomerated, with tight interface bonding (as shown in Figure 4). The main component of the interface-enhancing phase is MgAl2O4 (as shown in Figure 6, Table 2). In the same load, the composite material is not easy to have elastic and plastic deformation. The interface between particles and matrix has a high bonding strength, which makes particles not easy to be extruded from the friction surface. The matrix and particles bear the friction load together, so the friction mass loss is small and the friction coefficient is stable. During the continuous friction process, debris is formed, and this debris remains in the friction surface. The friction load of the ring and the plowing of high hardness silicon carbide particles become smaller and smaller, finally forming a transfer layer containing grinding materials, aluminum alloy matrix, and SiC particles. The formation of transfer layer can protect the internal composite, reduce its wear quality and stabilize its friction coefficient. In addition, during the formation of the transfer layer, the size of the debris becomes smaller, so micro-cutting will occur on the composite surface, and the furrow on the composite surface becomes smaller and shallower. Due to the uniform distribution of particles, the properties of the composite materials are improved. Therefore, the wear resistance of the samples under this condition is the best in the friction and wear experiment, the friction coefficient is large and stable, and the weight loss of sample wear is the minimum of 12 mg. The wear resistance is better than SiCp/AZ91D nanocomposites obtained by LIU and Al-Si/SiCp composites obtained by Teng [18,19].
The uniformity of SiC particles in the composite structure after ultrasonic treatment for 15 min is worse than that after ultrasonic treatment for 10 min. Because of the agglomeration of particles caused by ultrasonic long-time action, abrasive wear and adhesive wear coexist. The wear surface not only has white debris formed by abrasive wear, but also has small area falling off due to adhesive wear.
5. Conclusions
(1) The high temperature and high pressure formed by the cavitation of ultrasound can effectively eliminate the cluster of particles, improve the distribution of SiC particles, and increase the interfacial wettability of the composites, thereby ultimately improving the wear resistance of the composites.
(2) Due to the cavitation effect of ultrasound, the Mg element can escape with cavitation bubbles to the vicinity of the interface where the bubbles are attached, and enrichment occurs near the interface, which promotes the generation of MgO and MgAl2O4. The formation of SiC particles also blocked the direct contact between SiC particles and the Al melt, and inhibited the production of Al4C3.
(3) When the melt is treated by the ultrasonic wave with the amplitude of 12 μm and treatment duration of 10 min, the composites have the most uniform distribution of particles, the best wear resistance, the large and stable friction coefficient, and the minimum weight loss of sample wear 12 mg. The change of wear resistance is consistent with the variation of solidification structure and interface properties.
Author Contributions
Conceptualization, R.J. and X.L.; Methodology, Z.L., R.J., and L.Z.; software, Z.L.; Validation, R.J., Z.L., and L.Z.; Formal analysis, R.J. and Z.L.; Investigation, Z.L. and X.J.; Resources, R.J. and X.L.; Data curation, Z.L.; Writing—original draft preparation, Z.L.; Writing—review and editing, R.J.; Visualization, Z.L.; Supervision, R.J.; Project administration, R.J. and X.L.; Funding acquisition, R.J. and X.L. All authors have read and agreed to the published version of the manuscript.
Funding
This research was funded by the Natural Science Foundation of China, grant number: 51805549 and U1637601.
Conflicts of Interest
The authors declare no conflict of interest.
References
- Du, S.; Guan, Z. Strategic considerations for development of advanced composite technology for large commercial aircraft in China. Acta Mater. Compsitae Sin. 2008, 1, 1–10. [Google Scholar]
- Yan, C.; Lifeng, W.; Jianyue, R. Multi-functional SiC/Al composites for Aerospace Applications. Chin. J. Aeronaut. 2008, 21, 578–584. [Google Scholar] [CrossRef]
- Kumar, K.A.; Viswanath, A.; Rajan, T.P.D.; Pillai, U.T.S.; Pai, B.C. Physical, Mechanical, and Tribological Attributes of Stir-Cast AZ91/SiCp Composite. Acta Metall. Sin. 2014, 27, 295–305. [Google Scholar] [CrossRef]
- Hashim, J.; Looney, L.; Hashmi, M.S.J. The enhancement of wettability of SiC particles in cast aluminium matrix composites. J. Mater. Process. Technol. 2001, 119, 329–335. [Google Scholar] [CrossRef]
- Ma, J.; Kang, J.; Huang, T. Novel application of ultrasonic cavitation for fabrication of TiN/Al composites. J. Alloys Compd. 2016, 661, 176–181. [Google Scholar] [CrossRef]
- Du, Y.; Zhang, P.; Zhang, J.; Yao, S. Radial Distribution of SiC Particles in Mechanical Stirring of A356–SiCp Liquid. J. Mater. Sci. Technol. 2012, 28, 951–955. [Google Scholar] [CrossRef]
- Tjong, S.C.; Chen, F. Wear behavior of as-cast Zn-A127/SiC particulate metal matrix composites under lubricated sliding condition. Metal. Mater. Trans. A 1997, 28, 1951–1955. [Google Scholar] [CrossRef]
- Pan, J.; Yoshida, M.; Sasaki, G. Ultrasonic insert casting of aluminum alloy. Scripta Materialia 2000, 44, 155–159. [Google Scholar] [CrossRef]
- Eskin, G.I.; Eskin, D.G. Production of natural and synthesized aluminum-based composite materials with the aid of ultrasonic (cavitation) treatment of the melt. Ultrason. Sonochem. 2003, 10, 297–301. [Google Scholar] [CrossRef]
- Chen, J.; Anandarajah, A. Van der Waals attraction between spherical particles. J. Colloid Interface Sci. 1996, 180, 519–523. [Google Scholar] [CrossRef]
- Yang, L.; Kong, L. Capillary Force between Microparticles. J. Guangxi Norm. Univ. Nat. Sci. Ed. 2012, 30, 1–4. [Google Scholar]
- Hu, Y.; Xu, J.; Qiu, G.; Wang, D. Fine particles in the flotation system of electrostatic and van der Waals interactions. Non-Ferr. Min. Metall. 1994, 2, 16–21. [Google Scholar]
- Ėskin, G.I.; Eskin, D.G. Ultrasonic Treatment of Light Alloy Melts; CRC Press/Taylor & Francis Group: London, UK, 1997. [Google Scholar]
- Rae, J.; Ashokkumar, M.; Eulaerts, O.; von Sonntag, C.; Reisse, J.; Grieser, F. Estimation of ultrasound induced cavitation bubble temperatures in aqueous solutions. Ultrason. Sonochem. 2005, 12, 325–329. [Google Scholar] [CrossRef] [PubMed]
- Xu, H.; Meek, T.T.; Han, Q. Effects of ultrasonic field and vacuum on degassing of molten aluminum alloy. Mater. Lett. 2007, 61, 1246–1250. [Google Scholar] [CrossRef]
- Li, C.; Zhang, L.; Li, X.; Li, Z.; Li, R.; Dong, F. Interface bonding mechanism of SiCp/7085 composite in ultrasonic field. J. Cent. South Univ. 2016, 47, 2968–2975. [Google Scholar]
- Hatanaka, S.I.; Taki, T.; Kuwabara, M.; Sano, M.; Asai, S. Effect of Process Parameters on Ultrasonic Separation of Dispersed Particles in Liquid. Jpn. J. Appl. Phys. 1999, 38, 3096–3100. [Google Scholar] [CrossRef]
- Liu, S.; Li, W.; Zhang, Q.; Zhu, X.; He, G.; Li, M. Research on friction and wear behavior of SiCp/AZ91D nanocomposites. Rare Metal Mater. Eng. 2012, 41, 110–113. [Google Scholar]
- Teng, J.; Li, H.; Chen, G. Wear mechanism for spray deposited Al-Si/SiCp composites under dry sliding condition. J. Cent. South Univ. 2015, 22, 2875–2882. [Google Scholar] [CrossRef]
© 2020 by the authors. Licensee MDPI, Basel, Switzerland. This article is an open access article distributed under the terms and conditions of the Creative Commons Attribution (CC BY) license (http://creativecommons.org/licenses/by/4.0/).