Article

Probable Maximum Sizes of Inclusions Predicted by SEV and PSD for BH Steels of Automobile Exposed Panel with Different Sulfur Contents

State Key Laboratory of Advanced Special Steel, School of Materials Science and Engineering, Shanghai University, Shanghai 200444, China
*
Author to whom correspondence should be addressed.
Metals 2020, 10(5), 637; https://doi.org/10.3390/met10050637
Submission received: 15 April 2020 / Revised: 9 May 2020 / Accepted: 12 May 2020 / Published: 14 May 2020

Abstract

:
This study attempted to estimate the maximum size of inclusions in the ultra-low carbon Bake Hardening (BH) steels of automobile exposed panel. The Probable Maximum Sizes (PMS) of inclusions at the different steelmaking stages for BH steel with different sulfur contents were predicted by two methods of Statistics of Extreme Values (SEV) and Particle Size Distribution (PSD). The S content does not show a relationship with the PMS prediction of inclusions in the molten steel in which Al2O3 is the main inclusion, while the higher content of S leads to a larger PMS value in the slab, due to more number of large-sized Al2O3-MnS inclusions formed during solidification. The PMS value in the slab is greater than that in the molten steel for BH steel. Thus, the PMS of inclusions in the slab cannot be estimated from the molten steel samples. The SEV can be used to predict well the PMS values at different steelmaking stages for BH steels. However, the PSD of exponential function cannot predict well the PMS value in the slab for BH steel when considering all kinds of inclusions due to the large influence of small-sized MnS with high number density on the PSD of exponential function. When only considering Al2O3-MnS inclusions, the PSD of exponential function can make a reasonable PMS prediction in the slab, because the size distribution of Al2O3-MnS with large size can follow the exponential function.

1. Introduction

The requirements on the surface quality of automobile exposed panel become stricter with the increasing demands of advanced automotive users. It is well known that large-sized inclusions are the key factors affecting the surface quality of steel products, especially for the ultra-low carbon steel of automobile exposed panel [1,2,3,4,5]. The quantitative characterization on the composition, size, quantity and distribution of large-sized inclusions in steel is necessary to control the surface defect. However, the large-sized inclusions with relatively low incidence are difficult to be detected by conventional analysis ways. If a method can be used to estimate the maximum size of inclusions in the steel, it will be of great significance to evaluate the property and quality of the steel for automobile exposed panel.
The Statistics of Extreme Values (SEV) is an effective method to predict the Probable Maximum Size (PMS) of inclusions in the steel, which was developed and standardized by Murakami and co-workers [6,7,8]. A series of randomly chosen areas with the same size are observed on a polished cross-section and the maximum inclusion in each area is identified and measured. A Gumbel distribution function is then used to predict the maximum size in a much larger area. Scholars have applied this method to several kinds of steels, mainly for Cr-containing high-strength steel [9,10,11], clean steel [12,13,14], stainless steel, [15,16] etc. Kanbe et al. [15,16,17,18] studied the inclusion distributions and predicted the PMS by Extreme Value Distribution (EVD) for Fe-10 mass% Ni alloy as well as analyzing the application of EVD in the molten steel, slab, and hot-rolled sheet for AISI304 Stainless Steel. They stated that the regression lines and PMS of inclusions determined by EVD in the molten steel, slab, and hot-rolled sheet are consistent. For improving the accuracy of the SEV prediction, several studies were carried out [19,20,21,22,23]. Beretta et al. [22] clarified that the Maximum Likelihood (ML) method is a reliable method to determine the accurate regression line from EVD. It was also proposed that the correlation coefficient of the regression line increases with an appropriate increase in the number of observed areas [16,23]. Besides, Zhang et al. [11] suggested that prediction accuracy can be improved by the combination of SEV and other statistical methods.
The PMS of inclusions in the steel can be also estimated by applying the Particle Size Distribution (PSD) of inclusions. Varieties of arithmetical functions (Mono-Dispersed, Exponential, Power-Low, Rayleigh, Log-Normal, and Pseudo-Normal, etc.) for inclusions have been used to approximate the PSD, which can be described arithmetically as probability distribution functions [24,25,26,27]. When the size distribution of inclusions is properly plotted by hypothesis, meaningful information can be obtained to estimate the largest size of inclusions [27,28]. Peaks Over Threshold (POT) method [29,30] makes it possible to predict the PMS by applying PSD with an appropriate inclusion size as the threshold for analysis. Kanbe et al. [15] compared the PMS of inclusions in AISI304 stainless steels with low (17 mass ppm) and high (28 mass ppm) oxygen contents by two methods of SEV and PSD. It showed that the PMS determined by SEV agrees with that by PSD in the steel with higher oxygen content.
The previous researches on inclusions in the ultra-low carbon steel of automobile exposed panel are mainly for Interstitial-Free (IF) steel, which mainly contains Al2O3, TiOx, and their complex inclusions [1,31,32,33]. There is little research on inclusions for ultra-low carbon Bake Hardening (BH) steel. It is a kind of automobile exposed panel steel with Mn (about 0.650%), P (about 0.035%), and S (0.010–0.015%) contents, which are much higher than those of conventional ultra-low carbon IF steel. Besides, the PMS of inclusions predicted by SEV and PSD for ultra-low carbon BH steel grade have not been studied, yet.
Therefore, the aim of this study was to predict the PMS of inclusions in RH, tundish and slab by both SEV and PSD methods for ultra-low carbon BH steels of automobile exposed panel and investigate the effect of sulfur content on the PMS of inclusions estimated at the different steelmaking stages. The PMS of inclusions in the molten steel and the slab was discussed and compared based on the analysis of inclusions on the type, size, quantity, and three-dimensional morphology in comparison with those in the conventional IF steels. The difference in PMS values of inclusions determined by SEV and PSD methods as well as the reasons was also clarified, and the optimized prediction method for the PMS values of inclusions was discussed for the ultra-low carbon BH steel.

2. Sampling and Statistical Analysis Methods

2.1. Production Operations and Sampling Methodology

Two ultra-low carbon BH steels of automobile exposed panel with the different S contents of 103 ppm (Steel A) and 150 ppm (Steel B) were selected. The contents of other elements for the two steels are similar except for S. The chemical compositions are presented in Table 1. The production process is the same for the two steels, which includes Kanbara Reactor (KR) desulphurization, Basic Oxygen Steelmaking (BOF), Ruhstahl Hausen (RH) degassing, and then Continuous Casting (CC).
The investigated samples of the two steels include the molten steel samples for inclusion analysis taken from RH ending, tundish inlet and outlet by vacuum suction with the molten steel sampler (ϕ 34 mm × 13 mm), as well as the slab samples with the size of ϕ 35 mm × 10 mm taken from the position of 2–4 cm near the inner surface in the thickness direction and 1/4 in the width direction of a slab. Besides, the molten steel samples were also obtained by vacuum suction with a cylindrical vessel, then the sampled cylindrical rods with a diameter of 5 mm were machined to measure total oxygen (T.O) content. All samples at the different steelmaking stages in Steels A or B were taken from the same heat, respectively.

2.2. Statistical Analysis Methods

The samples after grinding and polishing were analyzed automatically by Scanning Electron Microscope (SEM, VO 18, Carl Zeiss, Oberkochen, Germany)-Energy Dispersive Spectrometer (EDS, Oxford Instruments, Abingdon, UK) equipped with Inclusion Automatic Analysis Software (IAAS). The maximum inclusion in each unit area of samples was measured. The unit area (A0) and total observed area of each sample were 1 mm2 and 40 mm2, respectively.
For the SEV method, according to Murakami’s method [34], the largest values measured in 40 unit areas were ordered in the following increasing order, X1Xi ≤ … ≤ Xn (1 ≤ in), where Xi represents the largest inclusion size in the i-th unit area. The inclusion size is based on the maximum Feret’s diameter, which is obtained as the longest distance between any two points along the selection boundary. To obtain the EVD data, the reduced variate of each size value, yi, was determined by Equation (1) and plotted against a size parameter:
y i = ln [ ln ( i n + 1 ) ] ( 1     i     n )
where n is the number of investigated unit areas on the surface of each sample.
The definition of y in Equation (1) is based on the distribution function given by Gumbel [35] as shown in Equation (2):
G ( z ) = exp ( exp ( z λ α ) )
where G(z) is the probability that the size of the largest inclusion is not larger than z. λ and α are the scale and location parameters. If the reduced variate, y:
y = z λ α
is introduced, then from Equation (2), its distribution function is:
y = ln ( ln ( G ( z ) ) )
Besides, the cumulative probability of inclusion size can be simply calculated by:
G ( z ) = i n + 1
According to Equations (2)–(5), the y in Equation (1) can be obtained.
The regression line of EVD data was calculated as a linear function with the ML method, according to the ASTM E2283-03 standard [36]. Then, the obtained regression line was extrapolated to determine the PMS of inclusions in a reference area, Aref. The Aref was decided to be 1000 mm2 in the present study, which is 1000 times larger than A0. The y value for the Aref can be determined from the following Equations [34]:
y i = ln [ ln ( T 1 T ) ]
T = A r e f A 0
where T is the return period of the expected area (T = 1000 in this study). Accordingly, the PMS of inclusions in Aref can be predicted by introducing the y value for Aref of 1000 mm2 to the individual regression line of the EVD data.
For the PSD method, the specific distribution characteristic of inclusions with different sizes in the region of 40 mm2 was obtained by IAAS. All the inclusions with size larger than 0.2 μm were measured in this study. Each number density of inclusions, NA (mm−2), in the different size ranges of 0.2–1.0, 1.0–2.0 … 19.0–20.0 and > 20.0 μm was counted. These obtained data were plotted in the same figure to show their PSD by normalizing NA. Some studies [24,25,26,27] found that the PSD of inclusions follows arithmetical distribution functions, such as Exponential, Log-Normal, or Rayleigh distribution function. According to Kanbe et al.’s results [15,16,17,18], applying the exponential function was attempted to approximate the regression line of the PSD data in this study. The PMS in a larger area can be extrapolated from the obtained regression line according to Equation (8):
N A = a · e b · d
where NA is the number density of inclusions on the sample surface (mm−2), a and b are the regression parameters determined by the PSD, and d is the maximum Feret’s diameter of inclusions (μm). The inclusion population probability of NA (d) is 0.001 mm−2 for PSD corresponding to the Aref with a value of 1000 mm2 for SEV.
The PMS values of inclusions in the molten steel of RH ending, tundish inlet and outlet, as well as in the slab were predicted by the SEV and PSD methods. The SEV and PSD data at the different steelmaking stages were compared and analyzed in detail.

3. Results and Discussion

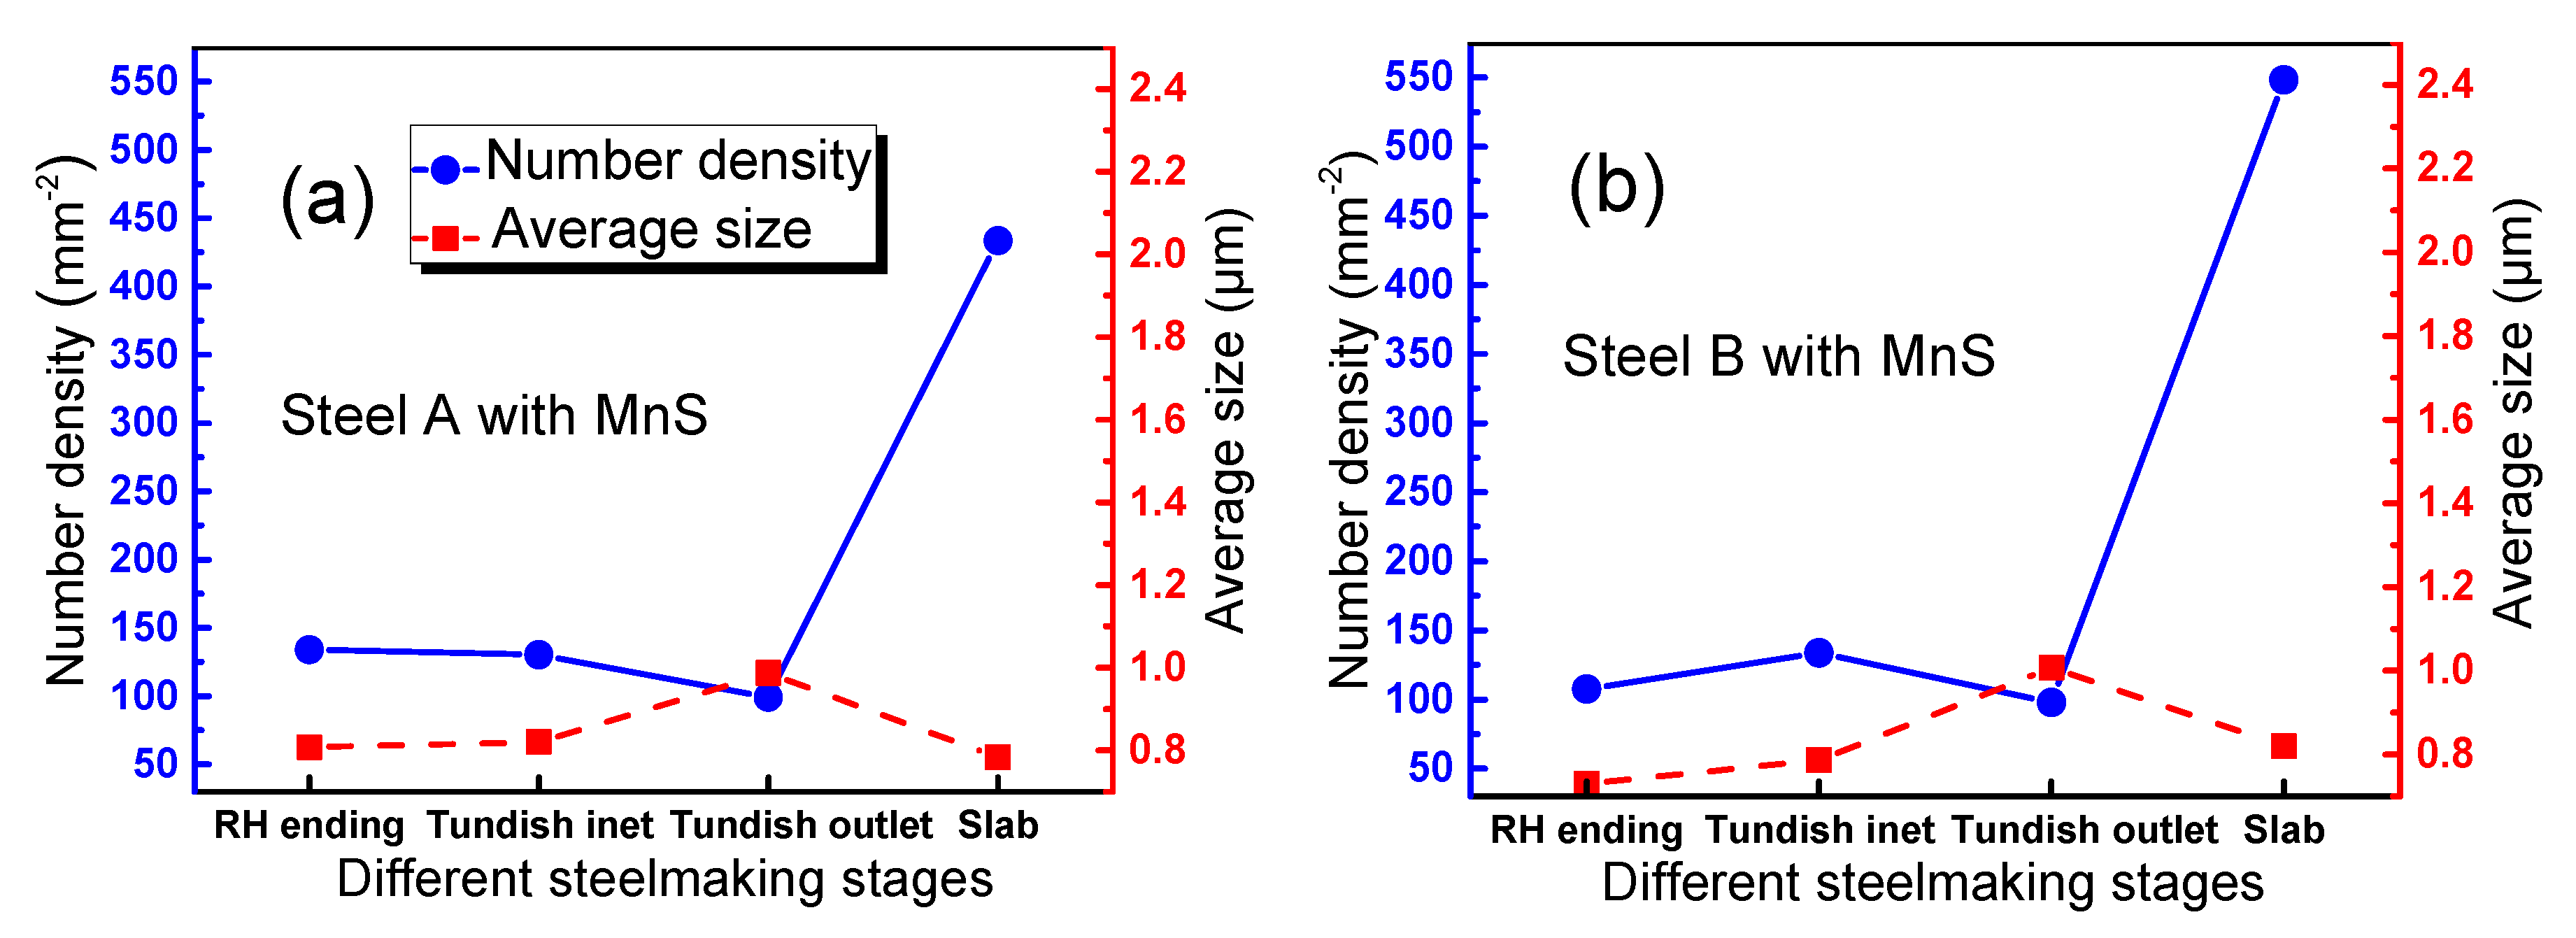
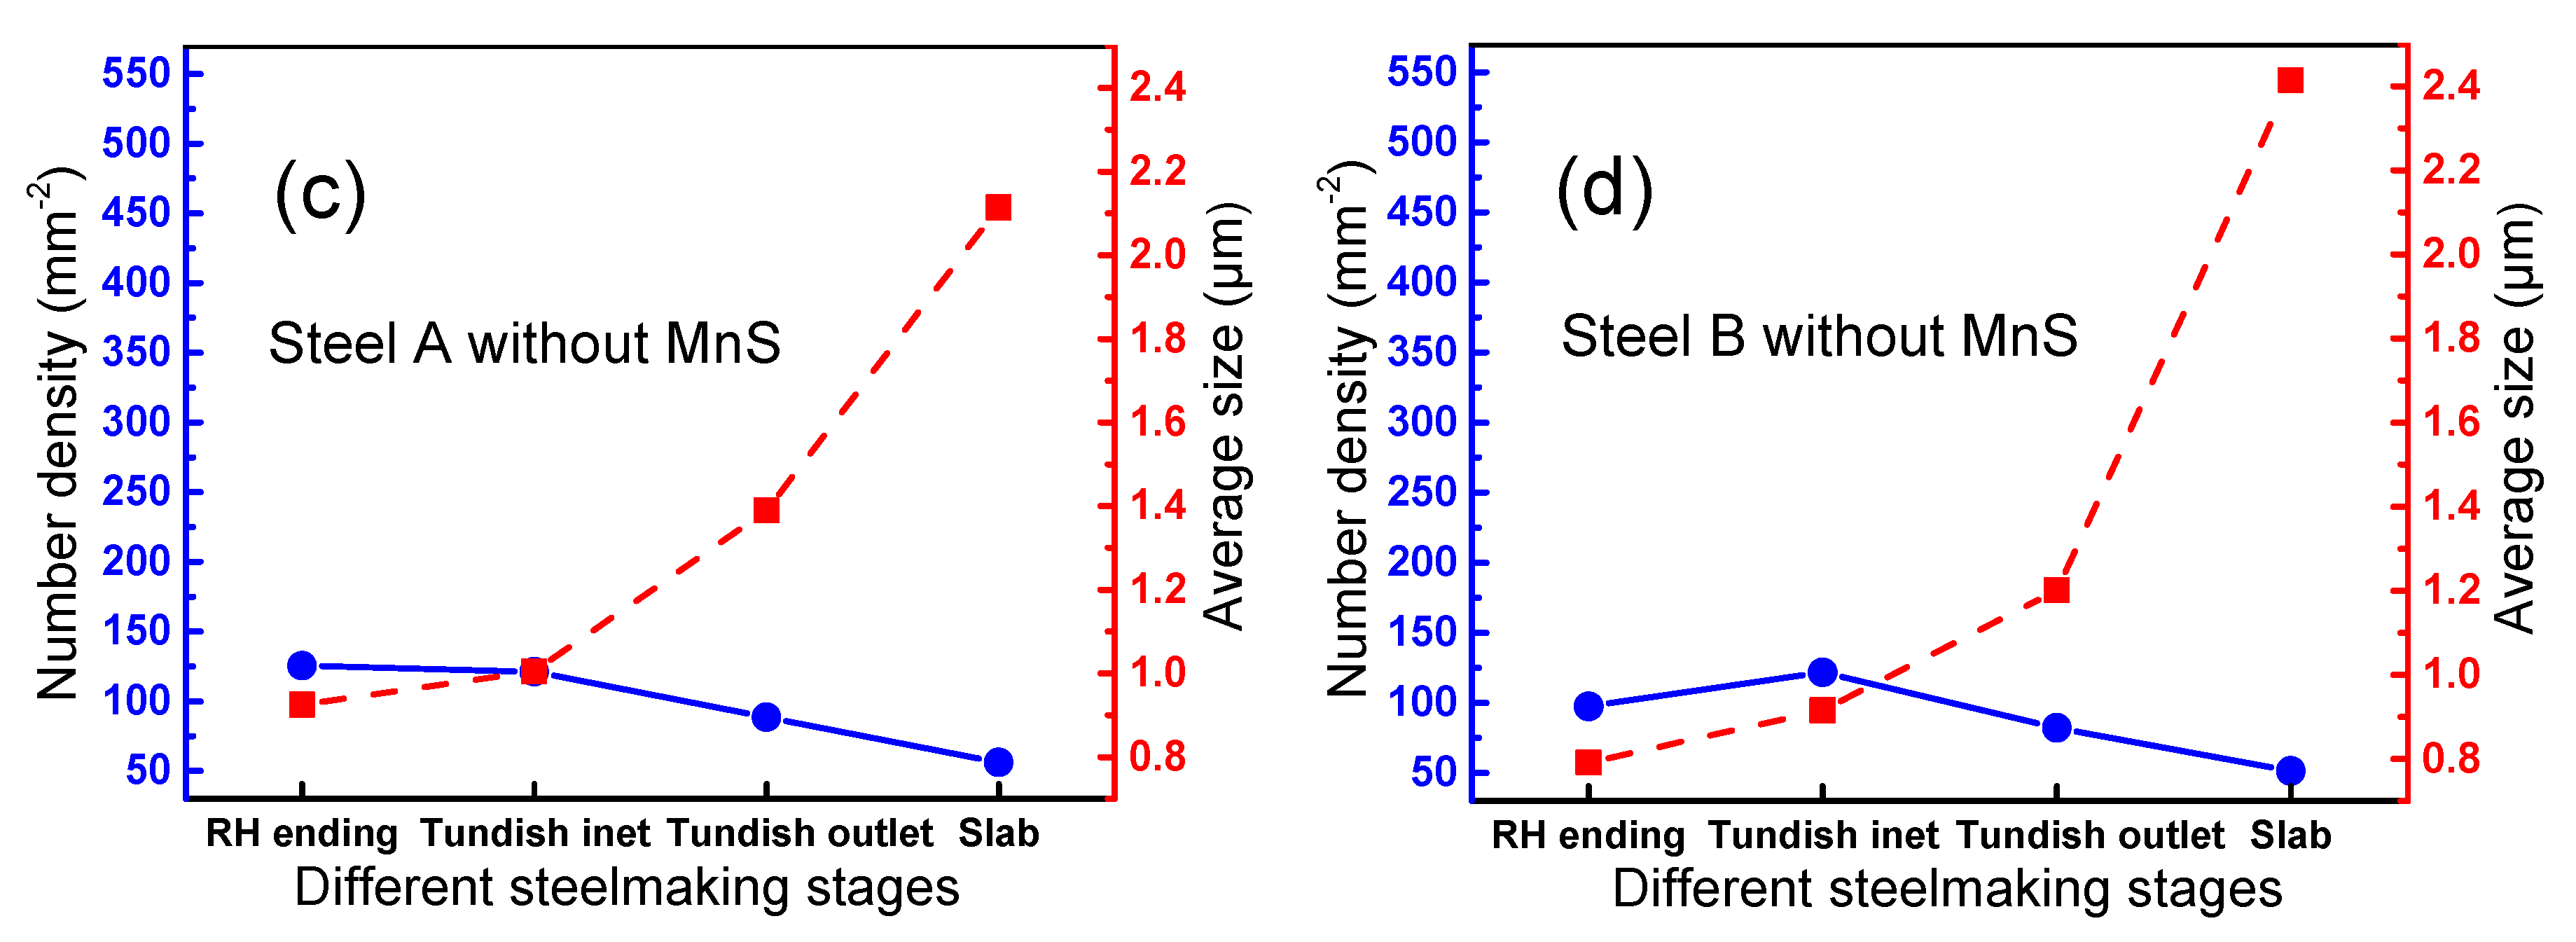
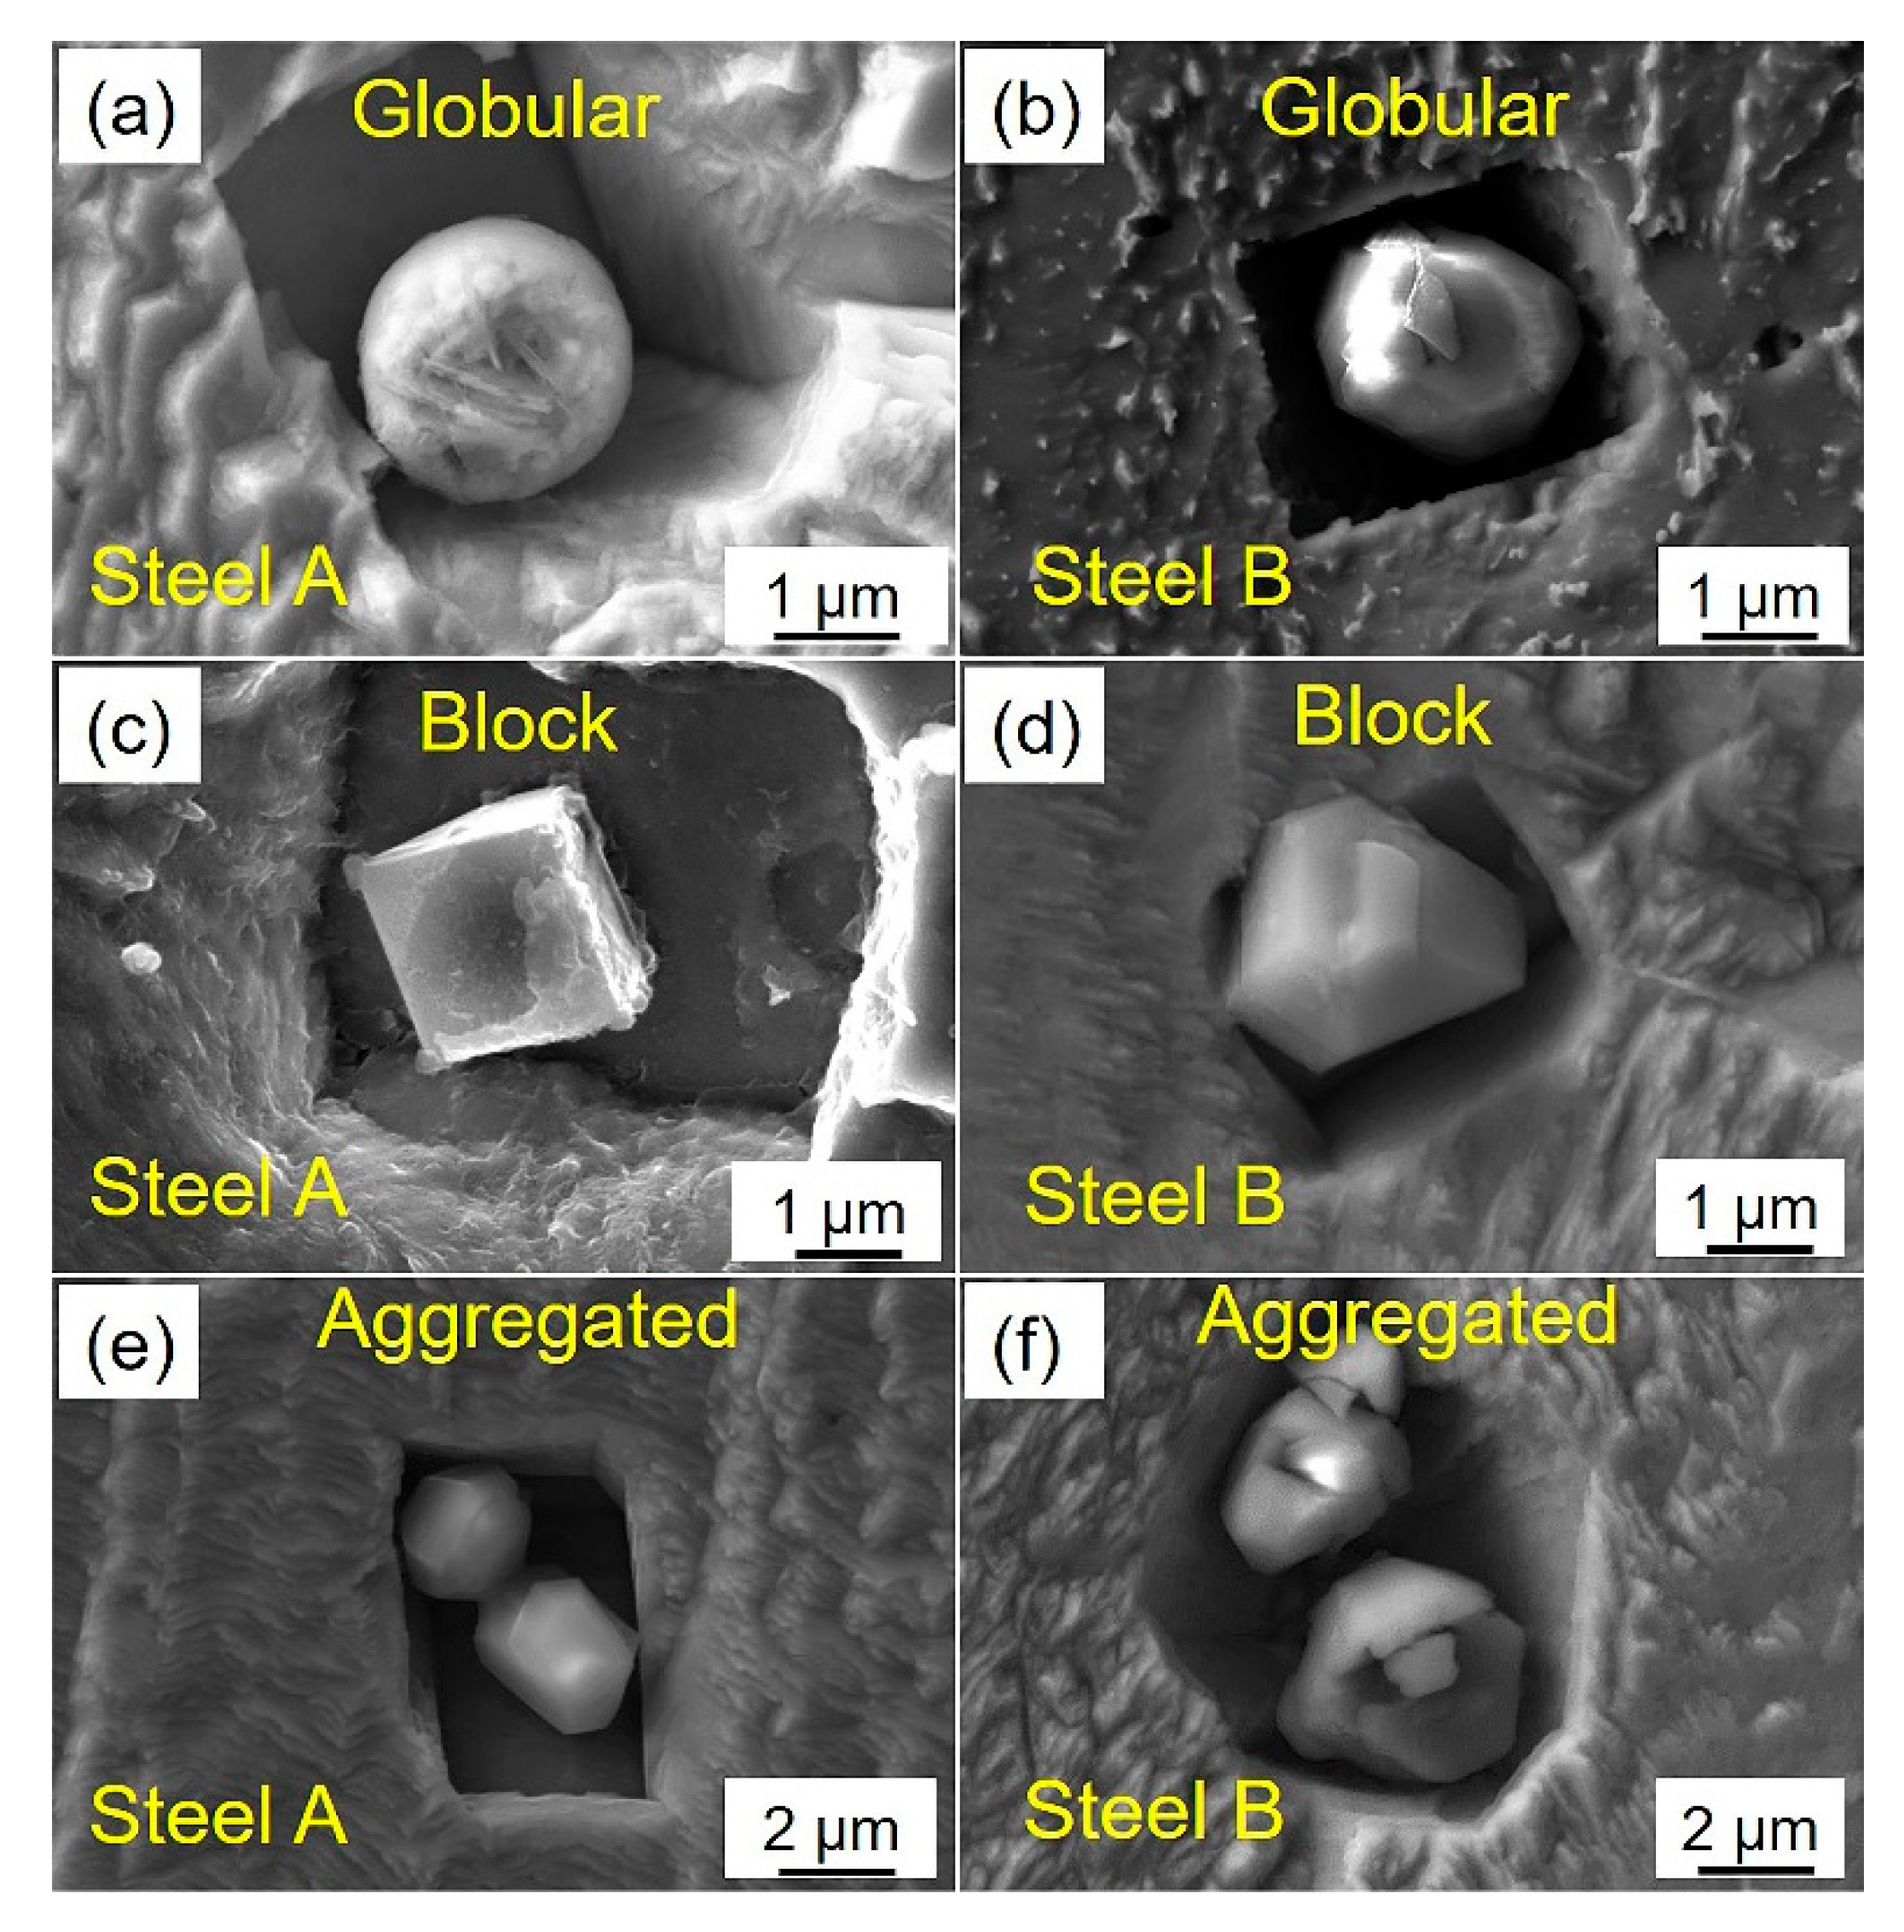
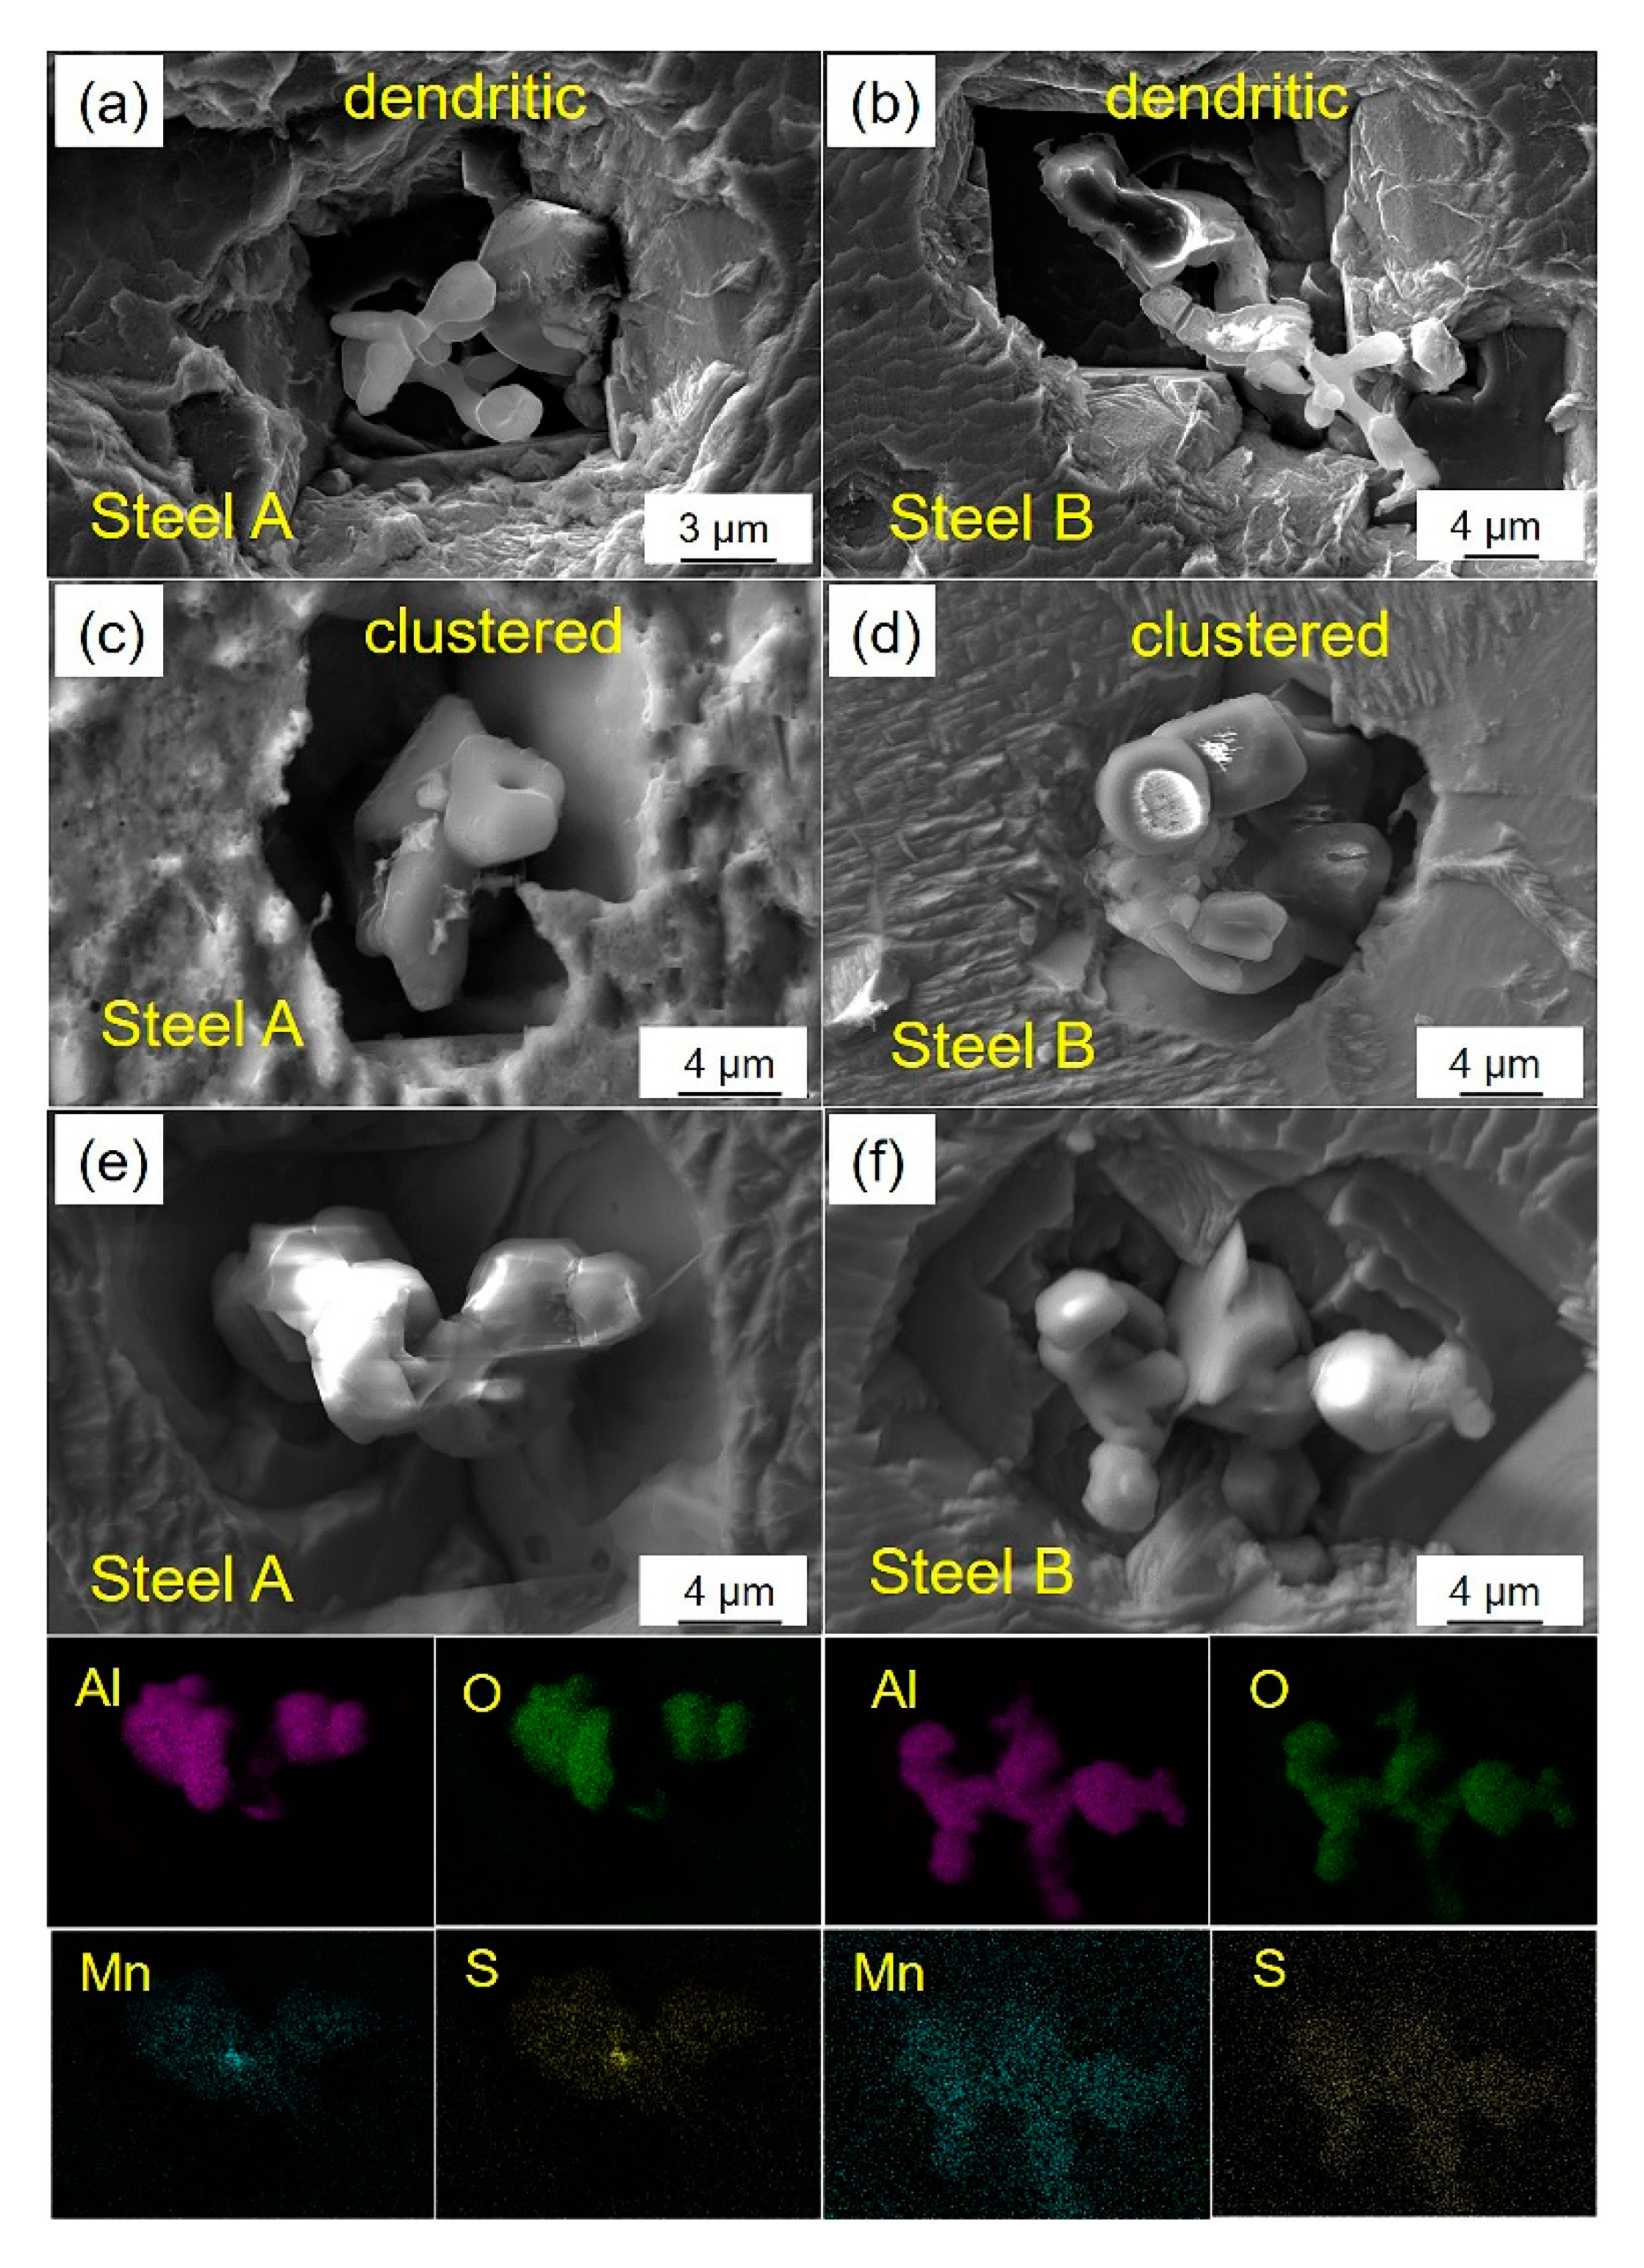
3.1. Observation of Inclusions at Different Steelmaking Stages

The simulation of inclusions formation in liquid, solidified, and solid Steels A and B was carried out by FactSage7.3 based on the compositions of steels in Table 1, which were calculated according to Sheil-Gulliver cooling in Equilib module with Ftoxide (for oxides) and FSStel (for liquid steel) solution databases. The result is shown in Figure 1. The main inclusions in the investigated steels are Al2O3 and MnS. A small number of Al2O3 inclusions are firstly formed in the molten steel. Since the precipitation temperature of MnS is between the solidus and liquidus temperatures, MnS will precipitate during the solidification of the molten steel. The content of MnS in Steel B is higher than that in Steel A due to the higher S content in Steel B. The quantity of MnS precipitates is significantly more than that of Al2O3 inclusions because of the much higher S content than the O content in BH steel. Besides, the sulfur segregation especially towards the end of solidification also plays an important role in the higher MnS precipitates in BH steel.
Figure 2 indicates the T.O contents at the different steelmaking stages of two steels measured by an O, N, and H analyzer (ONH 836, Leco Instruments Hk Limited, St. Joseph, OR, USA). The T.O content from RH ending to slab is well controlled to reach a low level almost below 20 ppm for two steels. It can be therefore considered that the process from RH ending to slab is stably controlled.
The inclusions at the different steelmaking stages for two steels were observed. There are mainly three kinds of inclusions, such as Al2O3, MnS, and Al2O3-MnS because of the high Mn, S and Al contents as well as the high affinity of Mn for S and Al for O. Other inclusions commonly found in IF steels such as TiOx are rarely observed due to the low content of Ti in the present steels. The number densities of different inclusions at the different steelmaking stages for two steels were measured as denoted in Figure 3. Al2O3 inclusions are the dominated inclusions in the molten steel, while MnS in the slab. The sharp rise in the number density of MnS inclusions in the slab comes from the abundant precipitation of MnS inclusions during solidification. Part of MnS would precipitate on the surface of Al2O3 inclusions, forming Al2O3-MnS complex inclusions. There is no significant difference of inclusions in the molten steel between Steels A and B. Because of the higher S content in Steel B, the number densities of MnS and Al2O3-MnS in the slab for Steel B are larger than those for Steel A. The above results are identical with the results of thermodynamic calculation in Figure 1. A small number of MnS inclusions observed in RH and tundish may be formed in the quick solidification during sampling.
The inclusions in the slab for two steels were further analyzed. The proportion of different inclusions with the size smaller or larger than 2 μm and their average size, d ˉ (μm), are shown in Figure 4. There is only a small quantity of pure MnS precipitates with size larger than 2 μm in the slab. The d ˉ of Al2O3-MnS is the largest among all kinds of inclusions with the NA of Al2O3-MnS inclusions larger than that of Al2O3 inclusions for two steels, as exhibited in Figure 3. Thus, it can be deduced that Al2O3-MnS inclusions play an important role in estimating the PMS of inclusions in the slab.
The changes in NA and d ˉ of the total inclusions during the process from RH to slab for two steels are presented in Figure 5a,b. The NA decreases and d ˉ increases slightly from RH to tundish for two steels, but the trend from tundish to slab is the opposite. The obviously elevated NA and declined d ˉ of inclusions in the slab are attributed to the substantial quantity of small-sized MnS precipitates in the slab, as demonstrated in Figure 3 and Figure 4. Therefore, similar analyses on the inclusions without pure MnS for two steels were carried out. As shown in Figure 5c,d, the NA and d ˉ of inclusions descends and ascends significantly from RH to slab, respectively, when MnS is not taken into consideration.
The morphologies of inclusions at the different steelmaking stages were observed. There are globular or block Al2O3 inclusions in the molten steel of RH ending and aggregated Al2O3 inclusions in the tundish outlet, as presented in Figure 6. A certain number of dendritic or clustered Al2O3 and Al2O3-MnS inclusions in the slab can be found in the slab, which are indicated in Figure 7. With the precipitation of MnS on the surface of Al2O3, the d ˉ of inclusions is increased. Figure 7e,f shows the typical morphology of Al2O3-MnS inclusions as well as the map scanning results of element distribution. The MnS content on the surface of Al2O3 inclusions in Steel B is greater than that in Steel A due to the larger S content in Steel B.

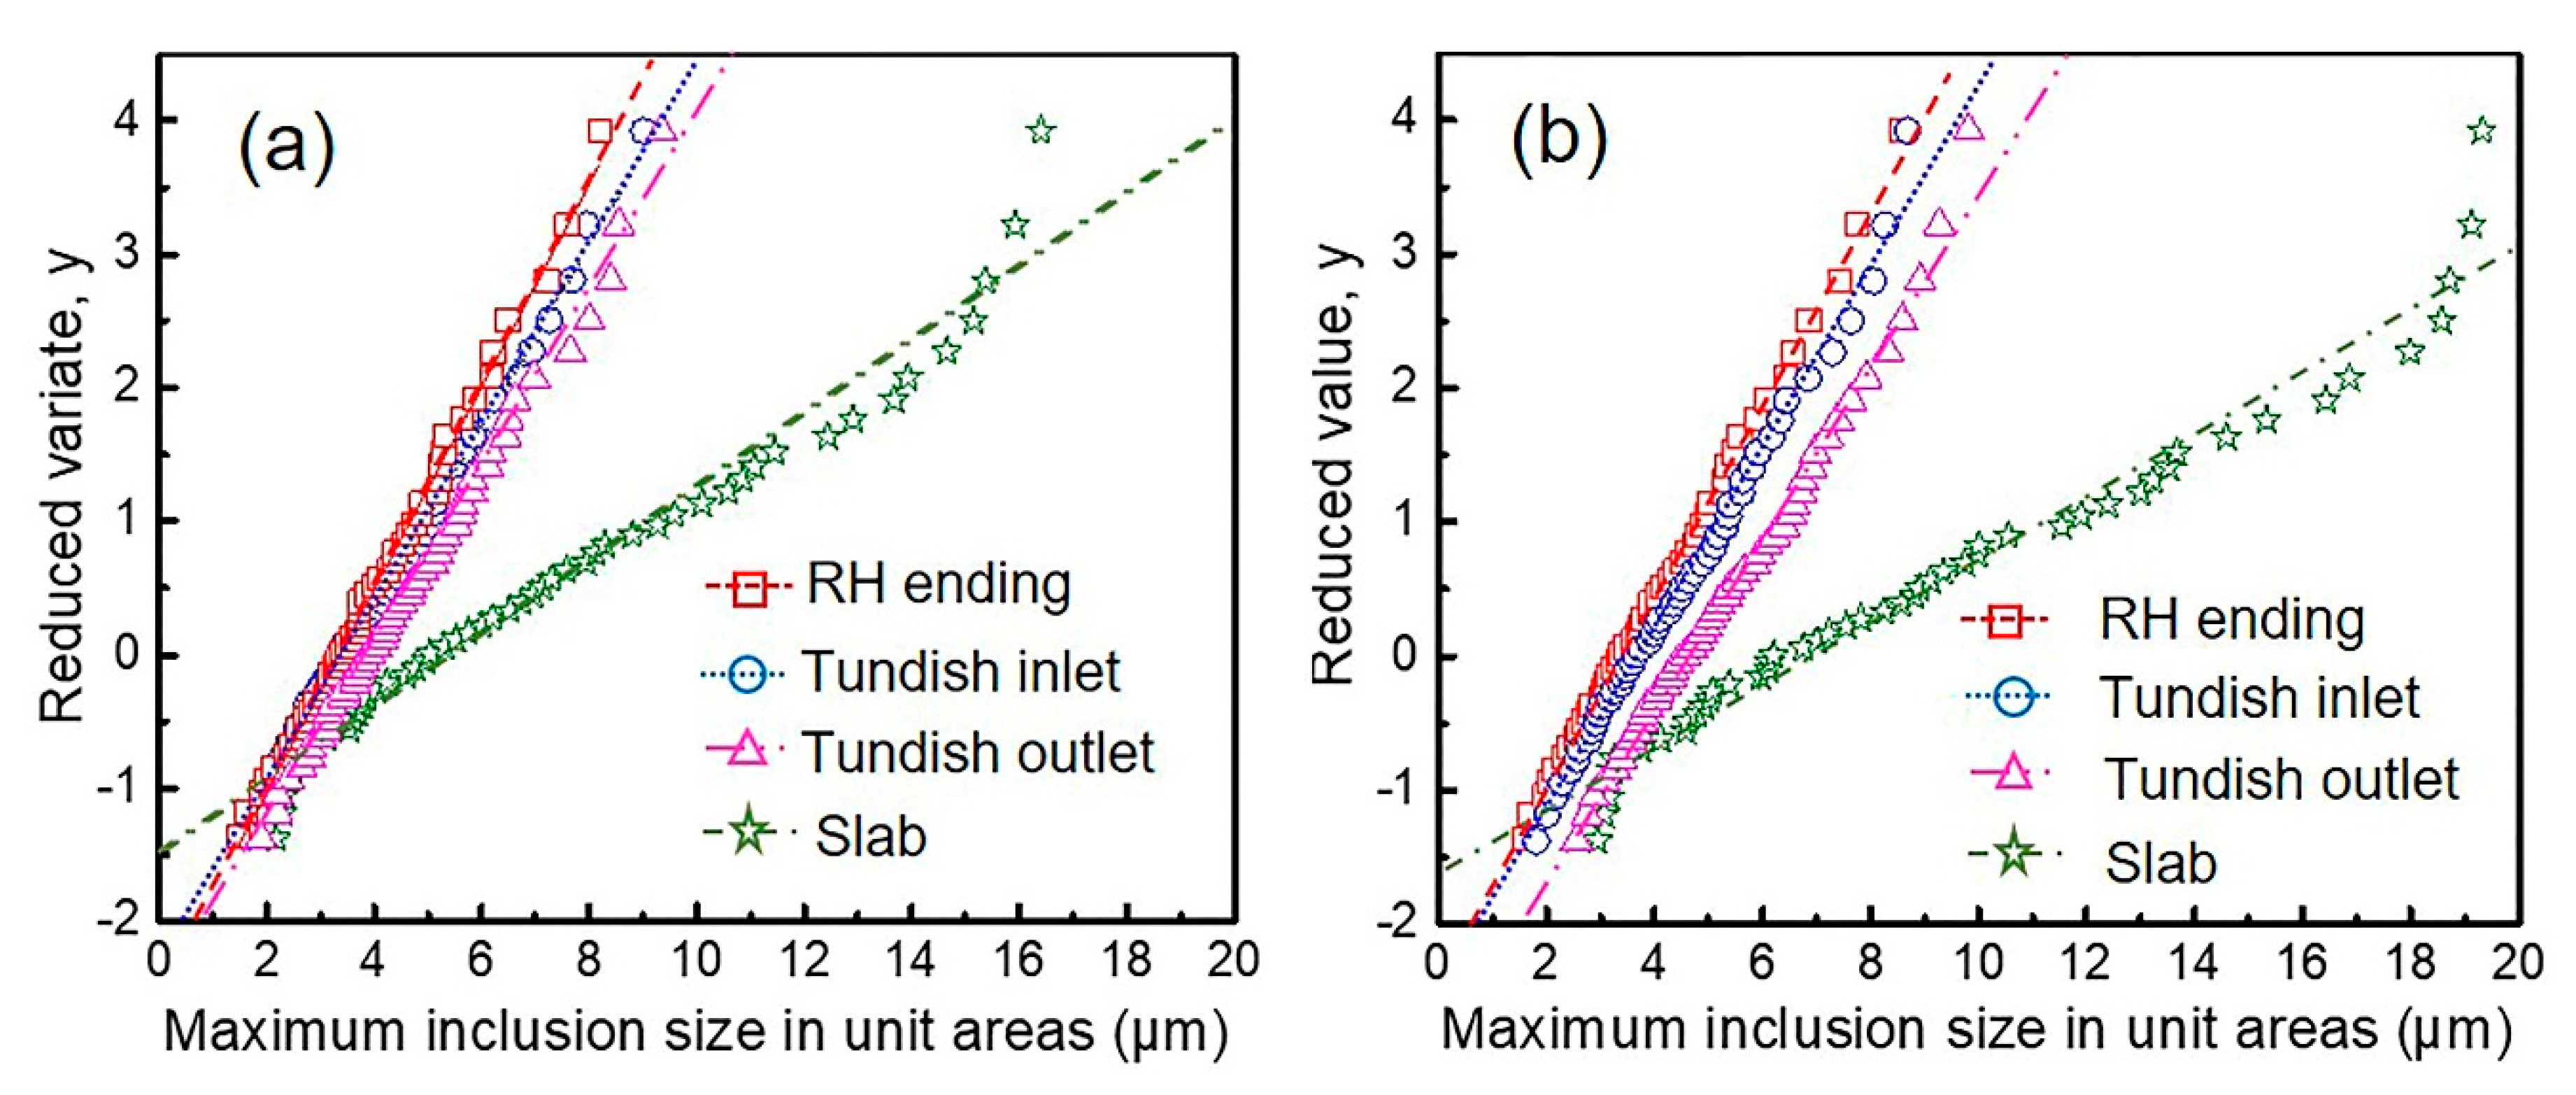
3.2. SEV (Statistics of Extreme Values) of Inclusions from RH Ending to Slab for Two Steels

The EVD data and corresponding regression lines for RH ending, tundish, and slab of two steels are noted in Figure 8 and Table 2. In the molten steel, the maximum size of inclusions observed in each unit area varies from 1 to 10 μm. The EVD data and PMS values at the different steelmaking stages of the molten steel for two steels are similar, as given in Table 2.
The maximum size of inclusions in the slab observed in the unit area varies from 2 to 19 μm. The slopes of regression lines by SEV in the slabs for two steels are considerably smaller than those in the molten steel. The PMS values in the slabs with an area of 1000 mm2 for Steels A and B determined by SEV are 30.50 and 36.42 μm, respectively, as shown in Table 2, which are larger than those in the molten steel with the size smaller than 20 μm. It is apparently different from the result of Kanbe et al.’s [15,16], they considered that the regression lines and PMS values in the molten steel calculated from SEV well agree with those in the slab. This diversity between the two studies is owing to the difference between the AISI304 stainless steel they studied and the ultra-low carbon BH steel in the present work. Due to the high S and Mn contents in BH steel, the Al2O3-MnS complex inclusions with the largest average size among all kinds of inclusions are numerously formed during solidification by MnS precipitating on the surface of Al2O3, which makes an obvious increment of the PMS in the slab for BH steel. As the S content increases, the PMS in the slab increases. The difference between the PMS in the molten steel and the slab also increases. But it is not the case with AISI304 stainless steel. So the possible reason for the disparity between the PMS data in the molten steel and the slab for the present study is considered to be that the PMS of inclusions is decided by the different types of inclusions, such as Al2O3 for the molten steel and Al2O3-MnS for the slab. Liu et al. [20] also revealed that the difference in inclusion types results in the diverse slopes of the regression lines by EVD. Kanbe et al. [16,18] further proposed that regression lines by EVD for different kinds of inclusions are with diverse slopes due to the different growth mechanisms and rates of inclusions.

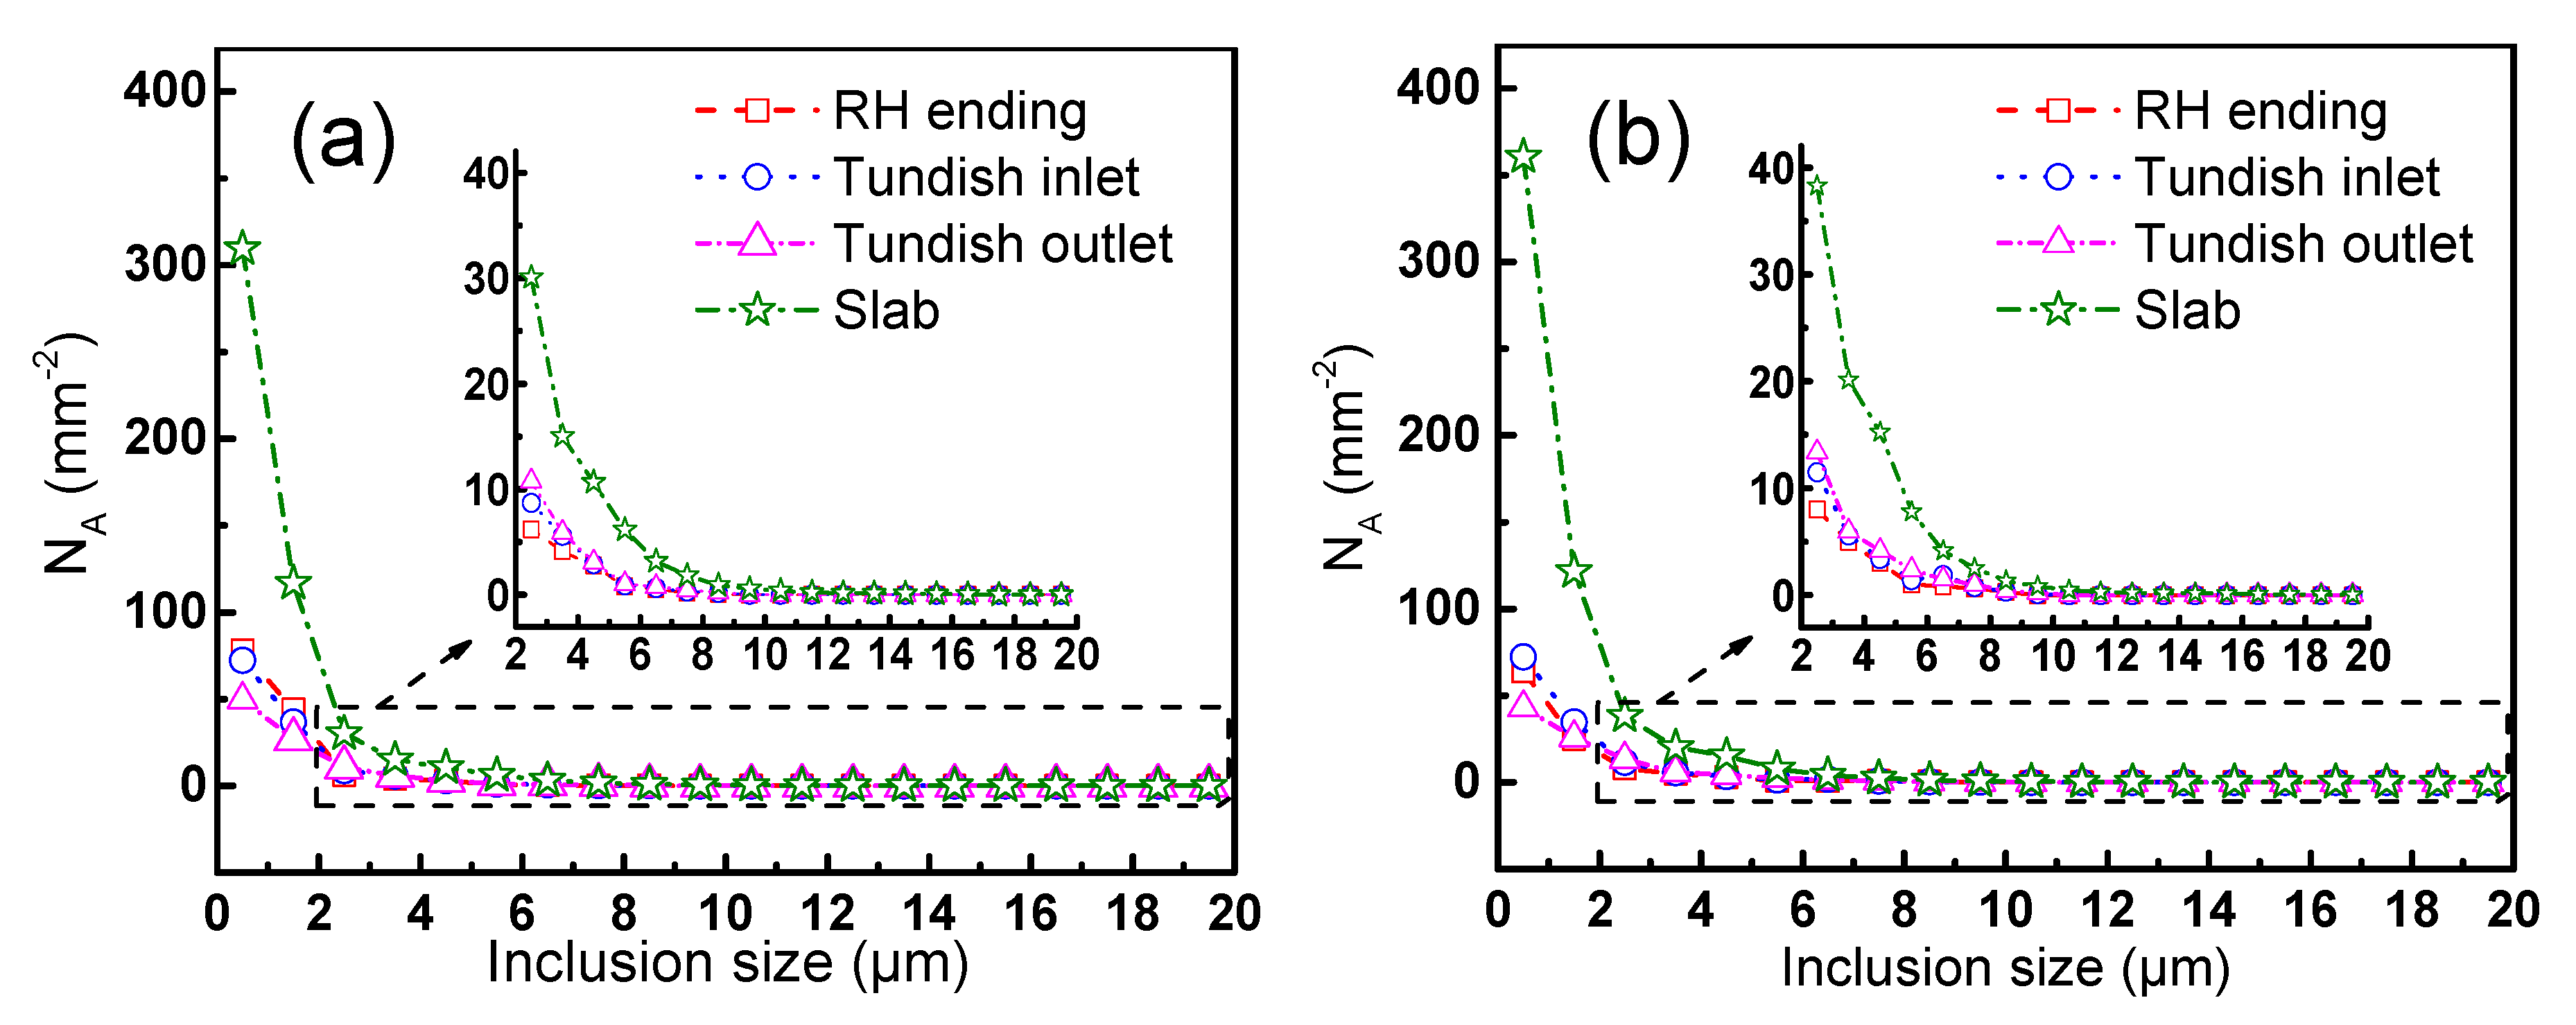
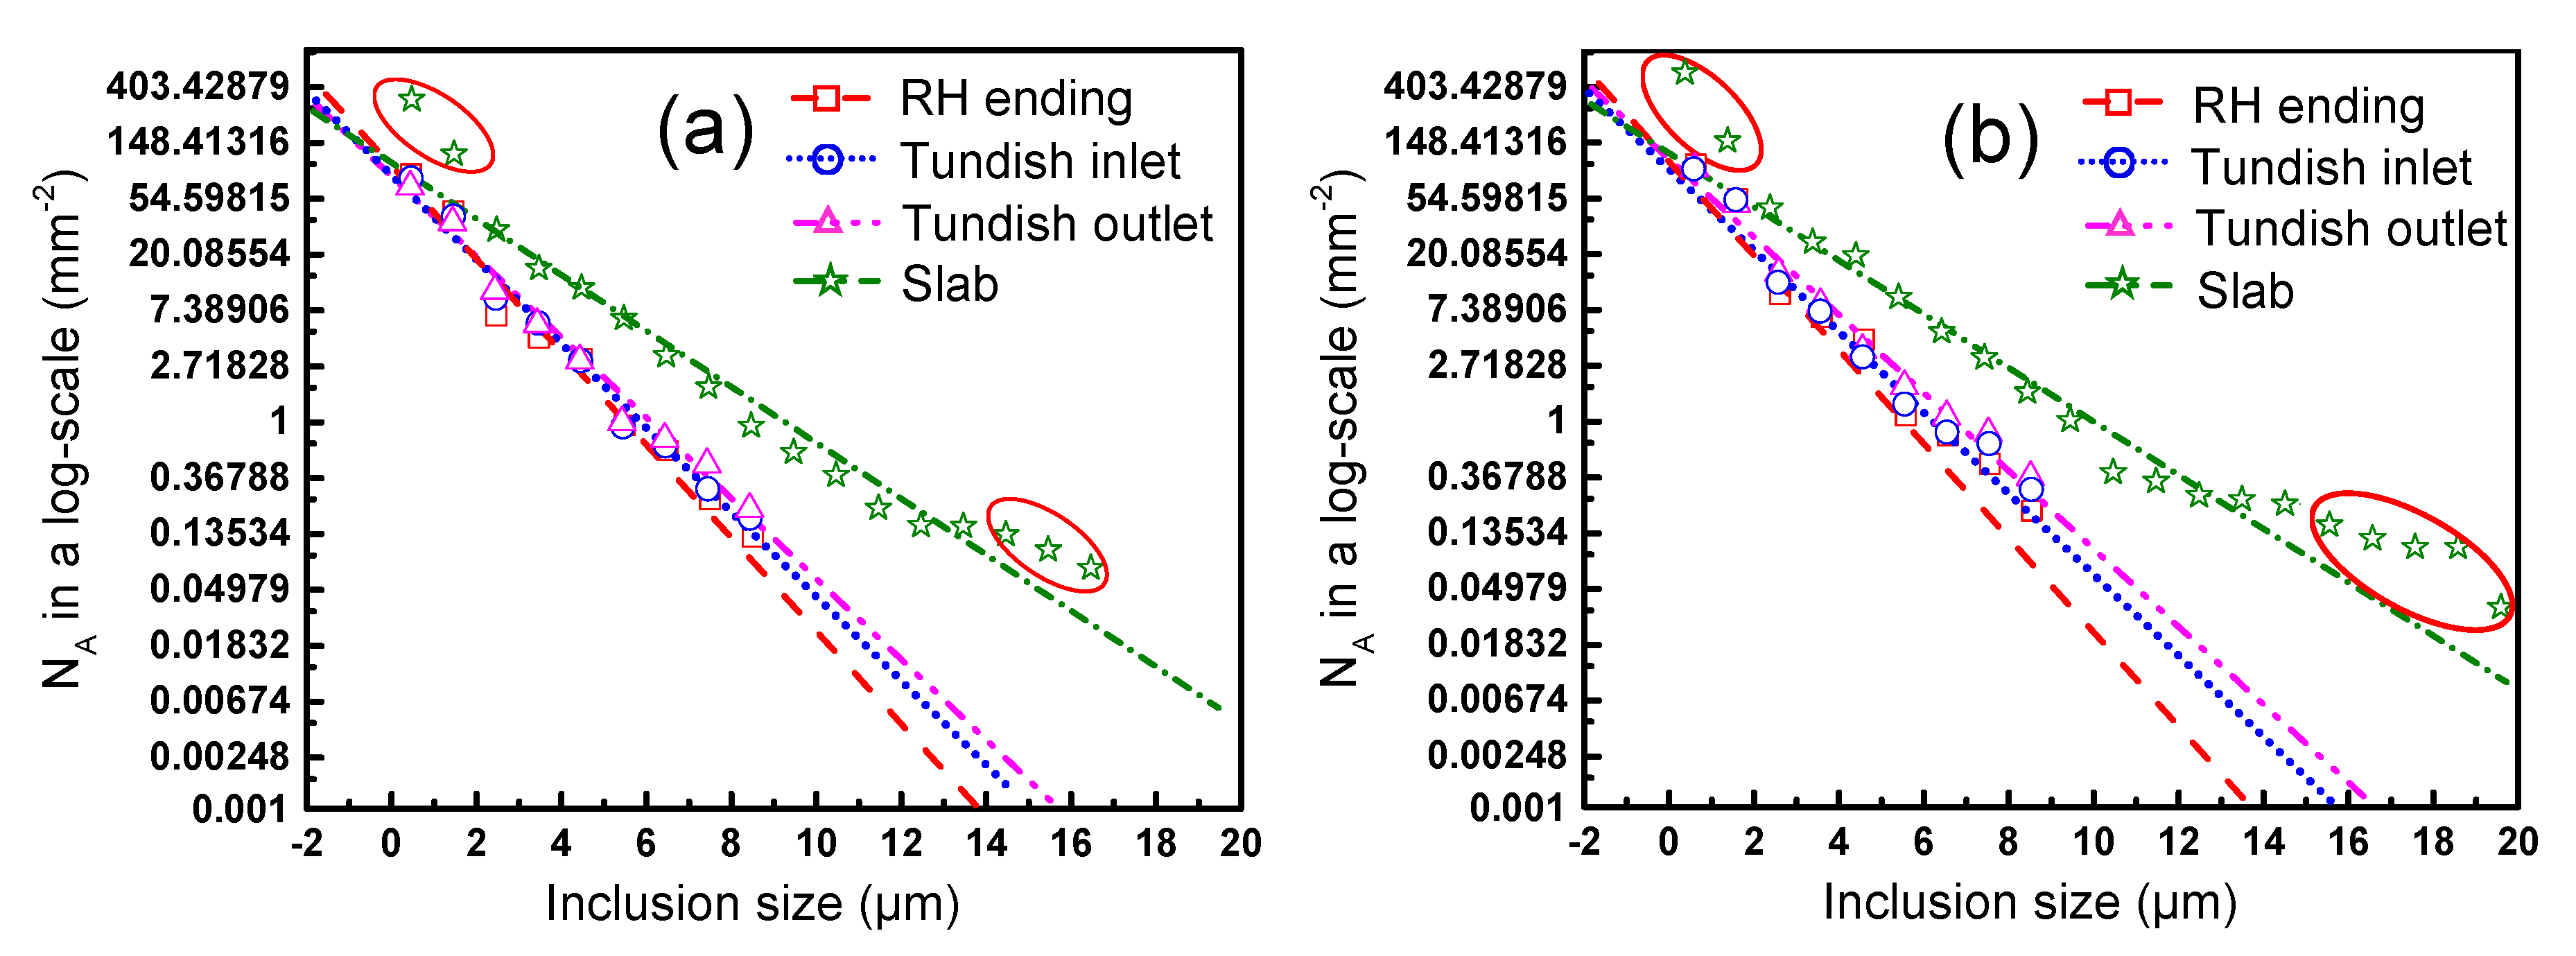
3.3. PSD (Particle Size Distribution) of Inclusions from RH Ending to Slab for Two Steels

The PSD of inclusions obtained experimentally at the different steelmaking stages for the two steels is illustrated in Figure 9. The obtained distribution shows a good continuity, especially for the different sizes of inclusions in the molten steel, which implies that each distribution in the whole size range of inclusions could be treated as a unified one. The highest population at the different steelmaking stages is obviously observed in the size range smaller than 2 μm. The NA shows a sequentially decreasing tendency with the increase of inclusion size.
The PSD of inclusions at the different steelmaking stages is plotted in a log-scale in Figure 10a,b, where the exponential regression lines are shown for Steels A and B, respectively. The parameters of a and b in Equation (8) as well as the PMS values determined by PSD are listed in Table 3. The wider distribution of inclusion sizes and the higher NA of relatively large-sized inclusions in the slab make the PMS in the slab greater than that in the molten steel. The distribution of inclusions in the molten steel almost shows a linear relationship. In the slab, however, the inclusions with the maximum Feret’s diameter smaller than 2 μm and larger than 14 μm deviate from the regression line of PSD as indicated by the red circles in Figure 10, which answers to the drop of the correlation coefficient, R, for the regression line of PSD in the slab noted in Table 3. Hence, it is indicated that the size distribution of inclusions for all data in the slab cannot strictly follow the hypothetical exponential relationship for PSD. In the previous studies, from the theoretical and numerical calculation on the PSD function, it was also known that the PSD can change with time during the steelmaking process [28,37,38]. The different PSD can be explained by the different growth mechanisms of inclusions, which are controlled by the physical collision or separation from the different interfacial energies of inclusions [28,37].

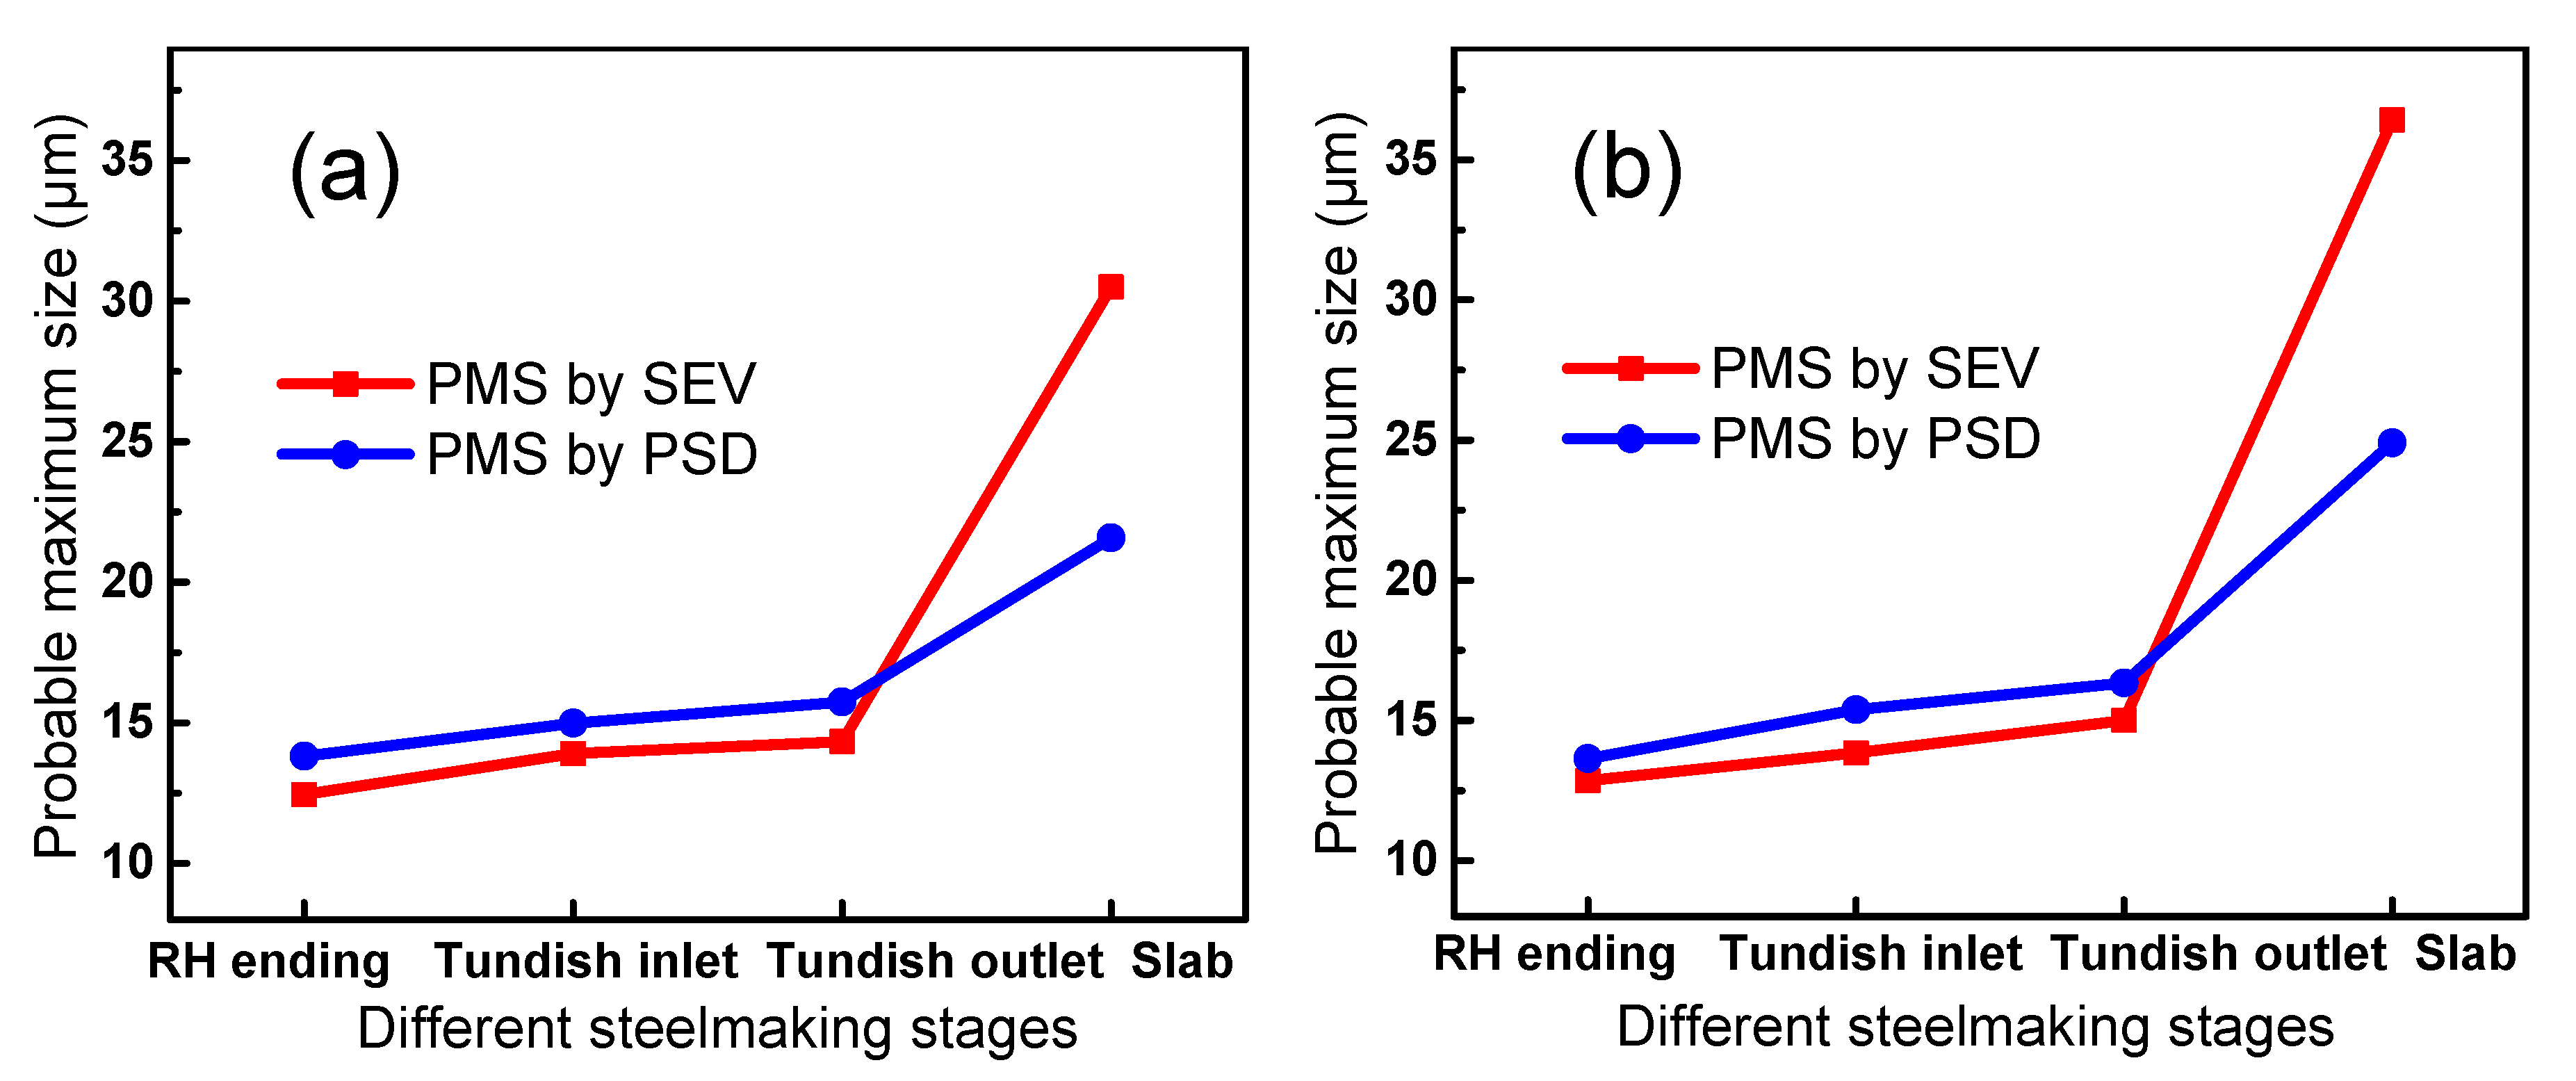
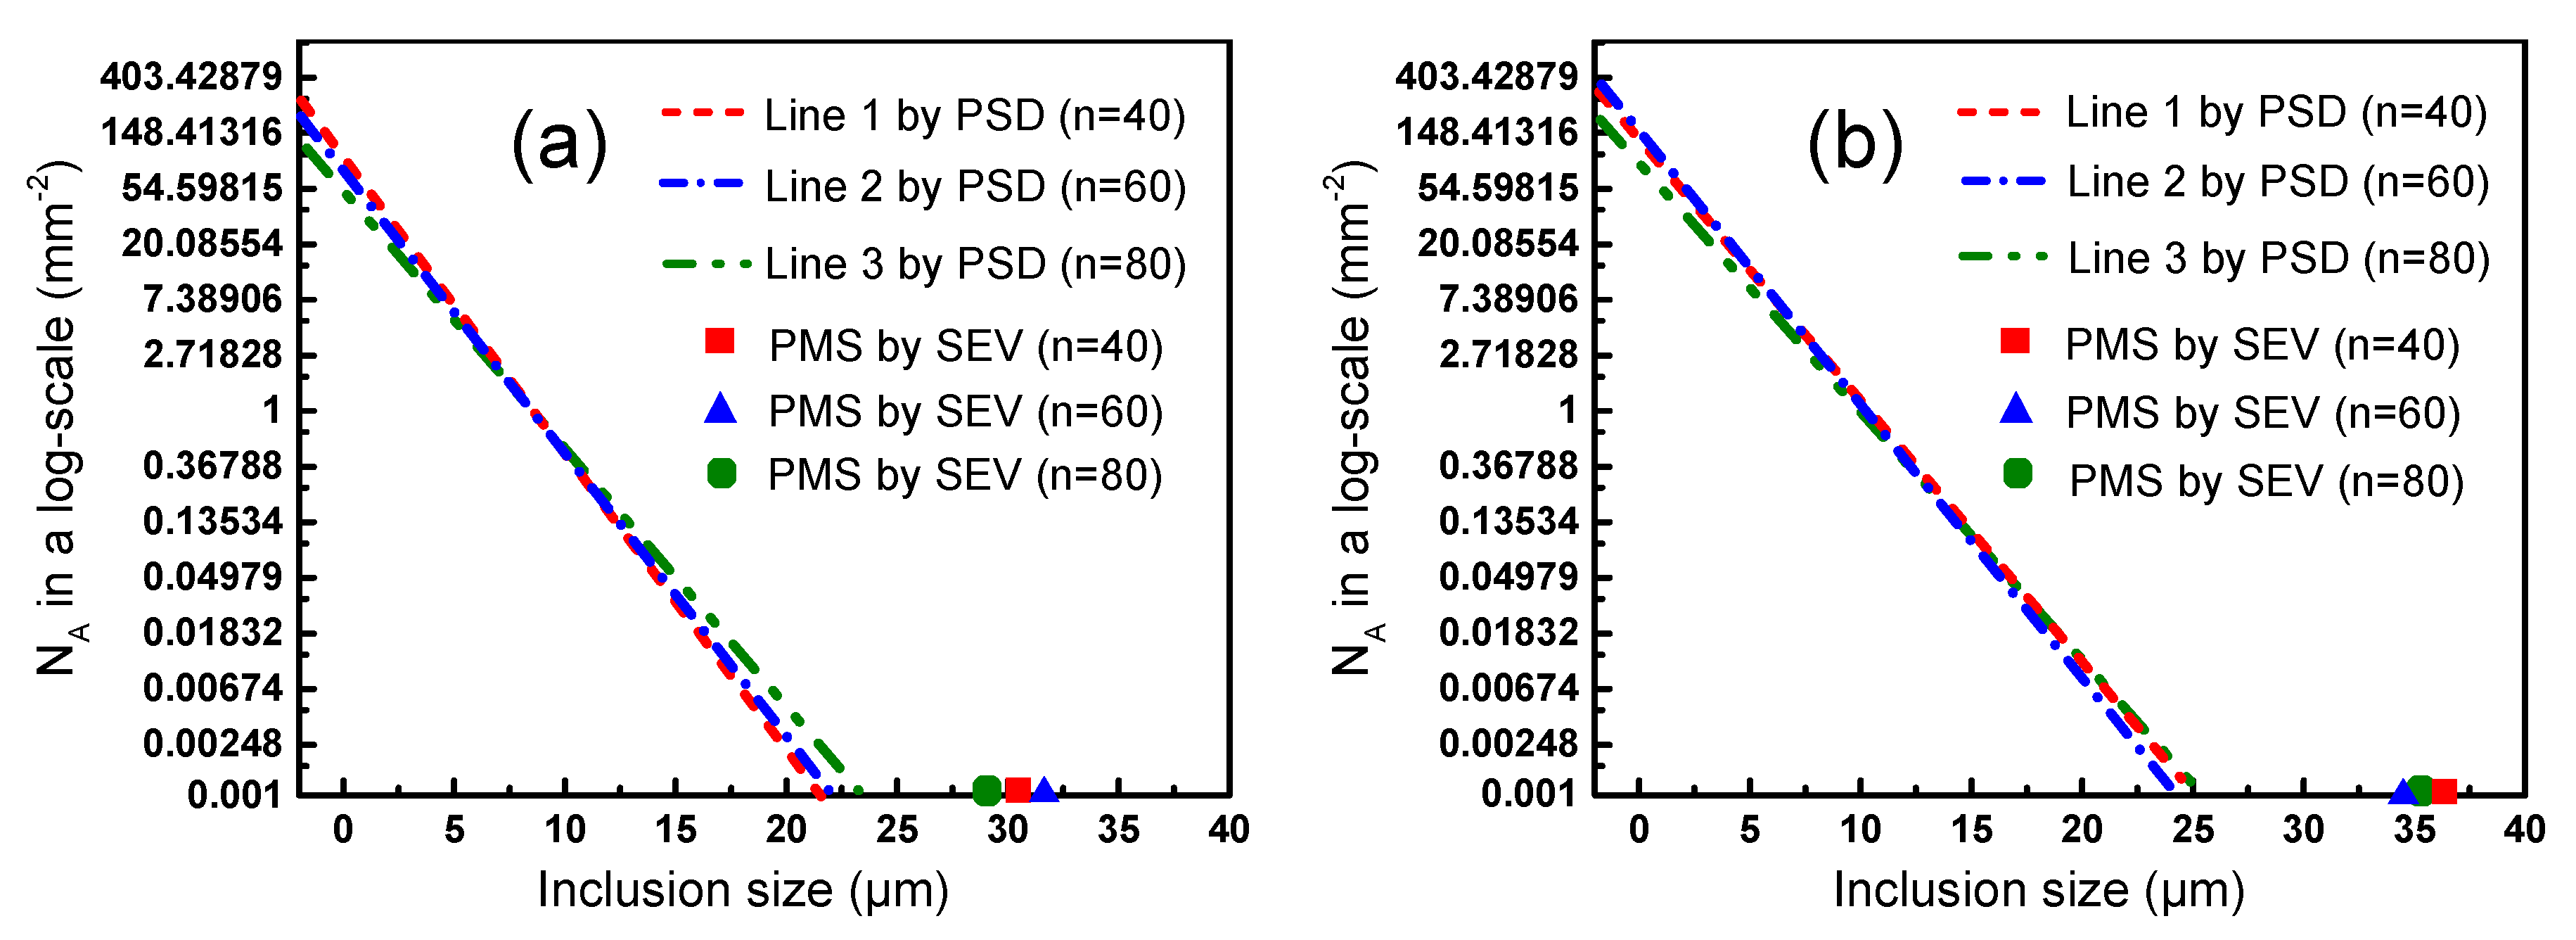
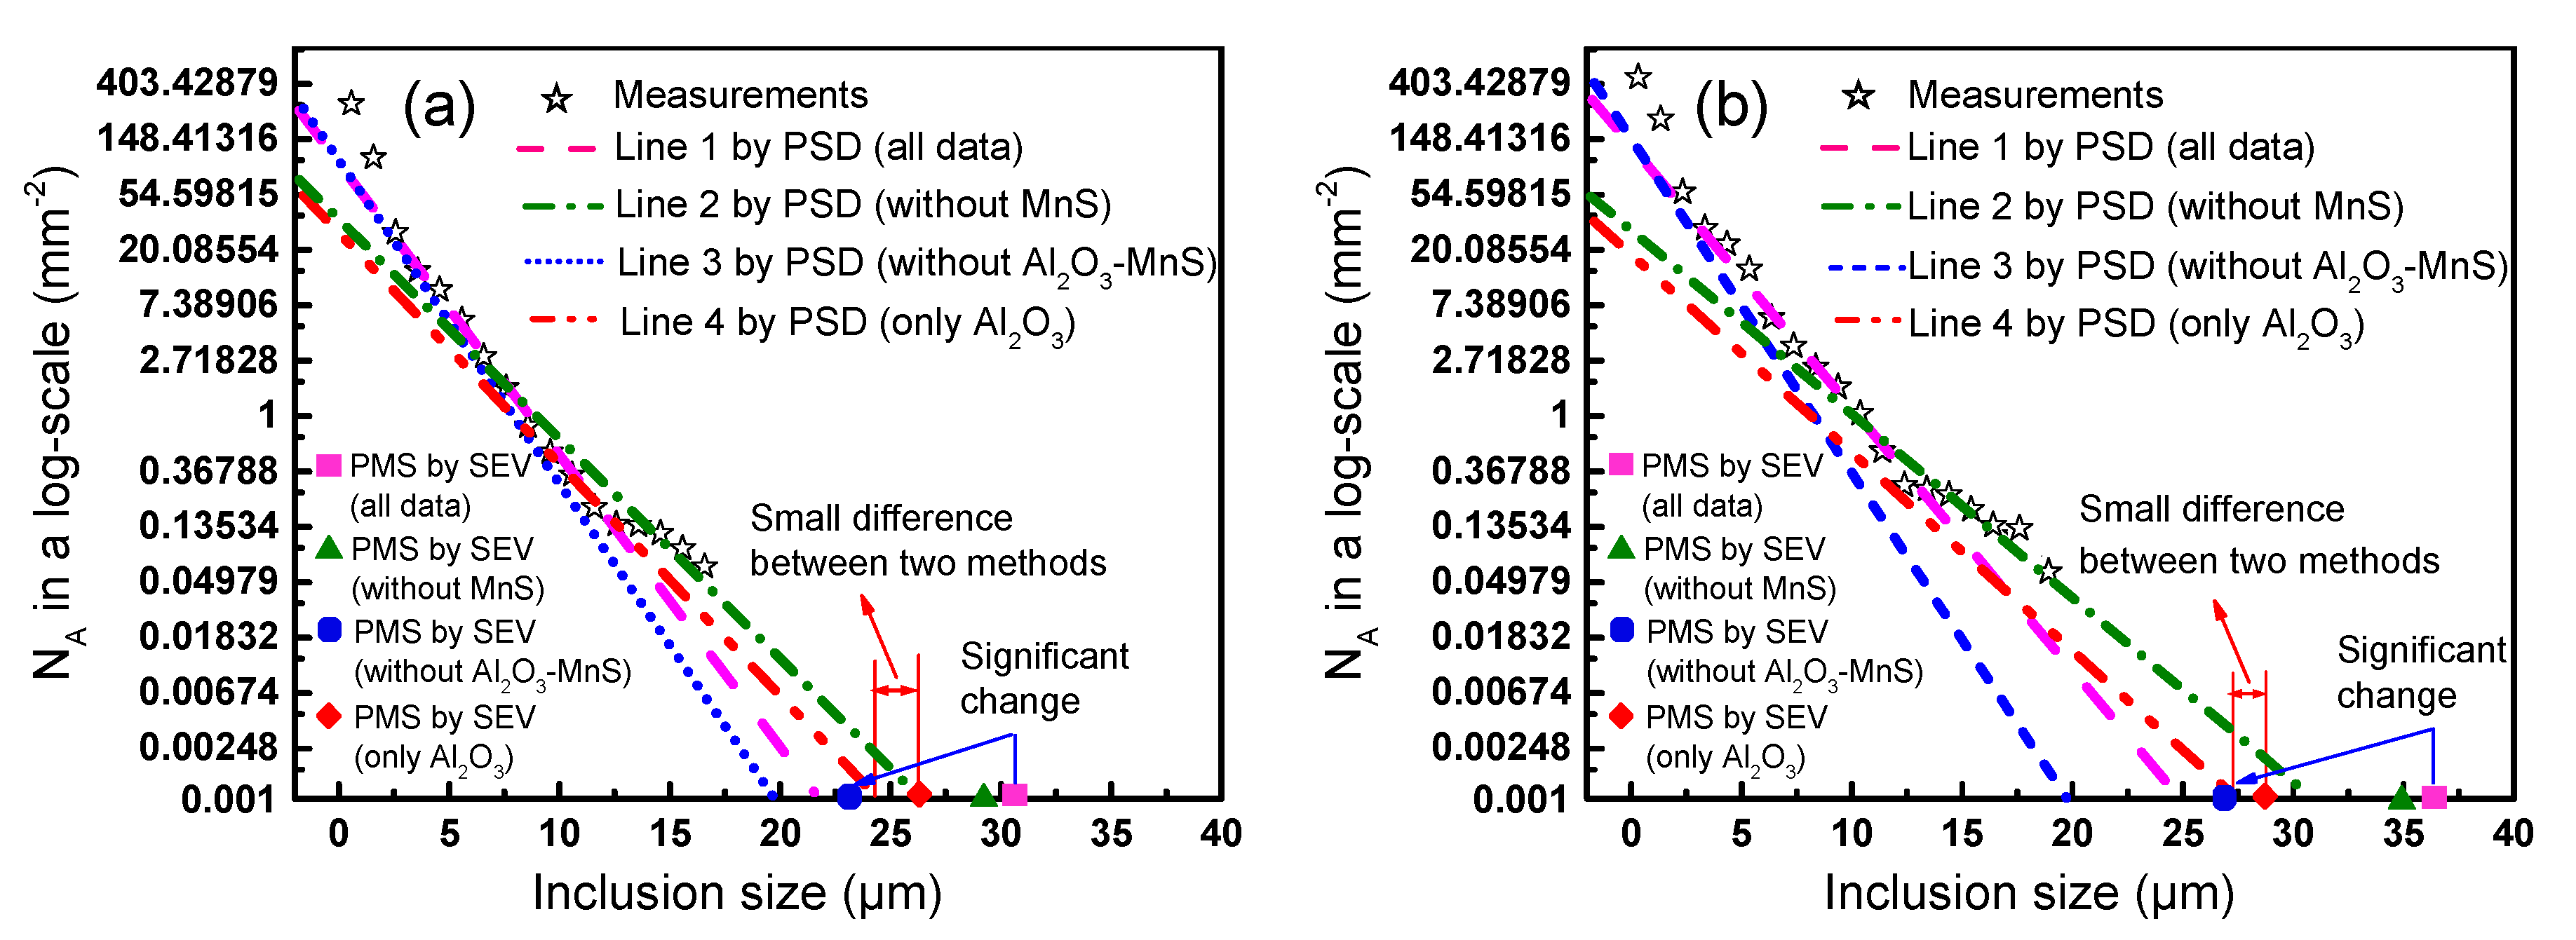
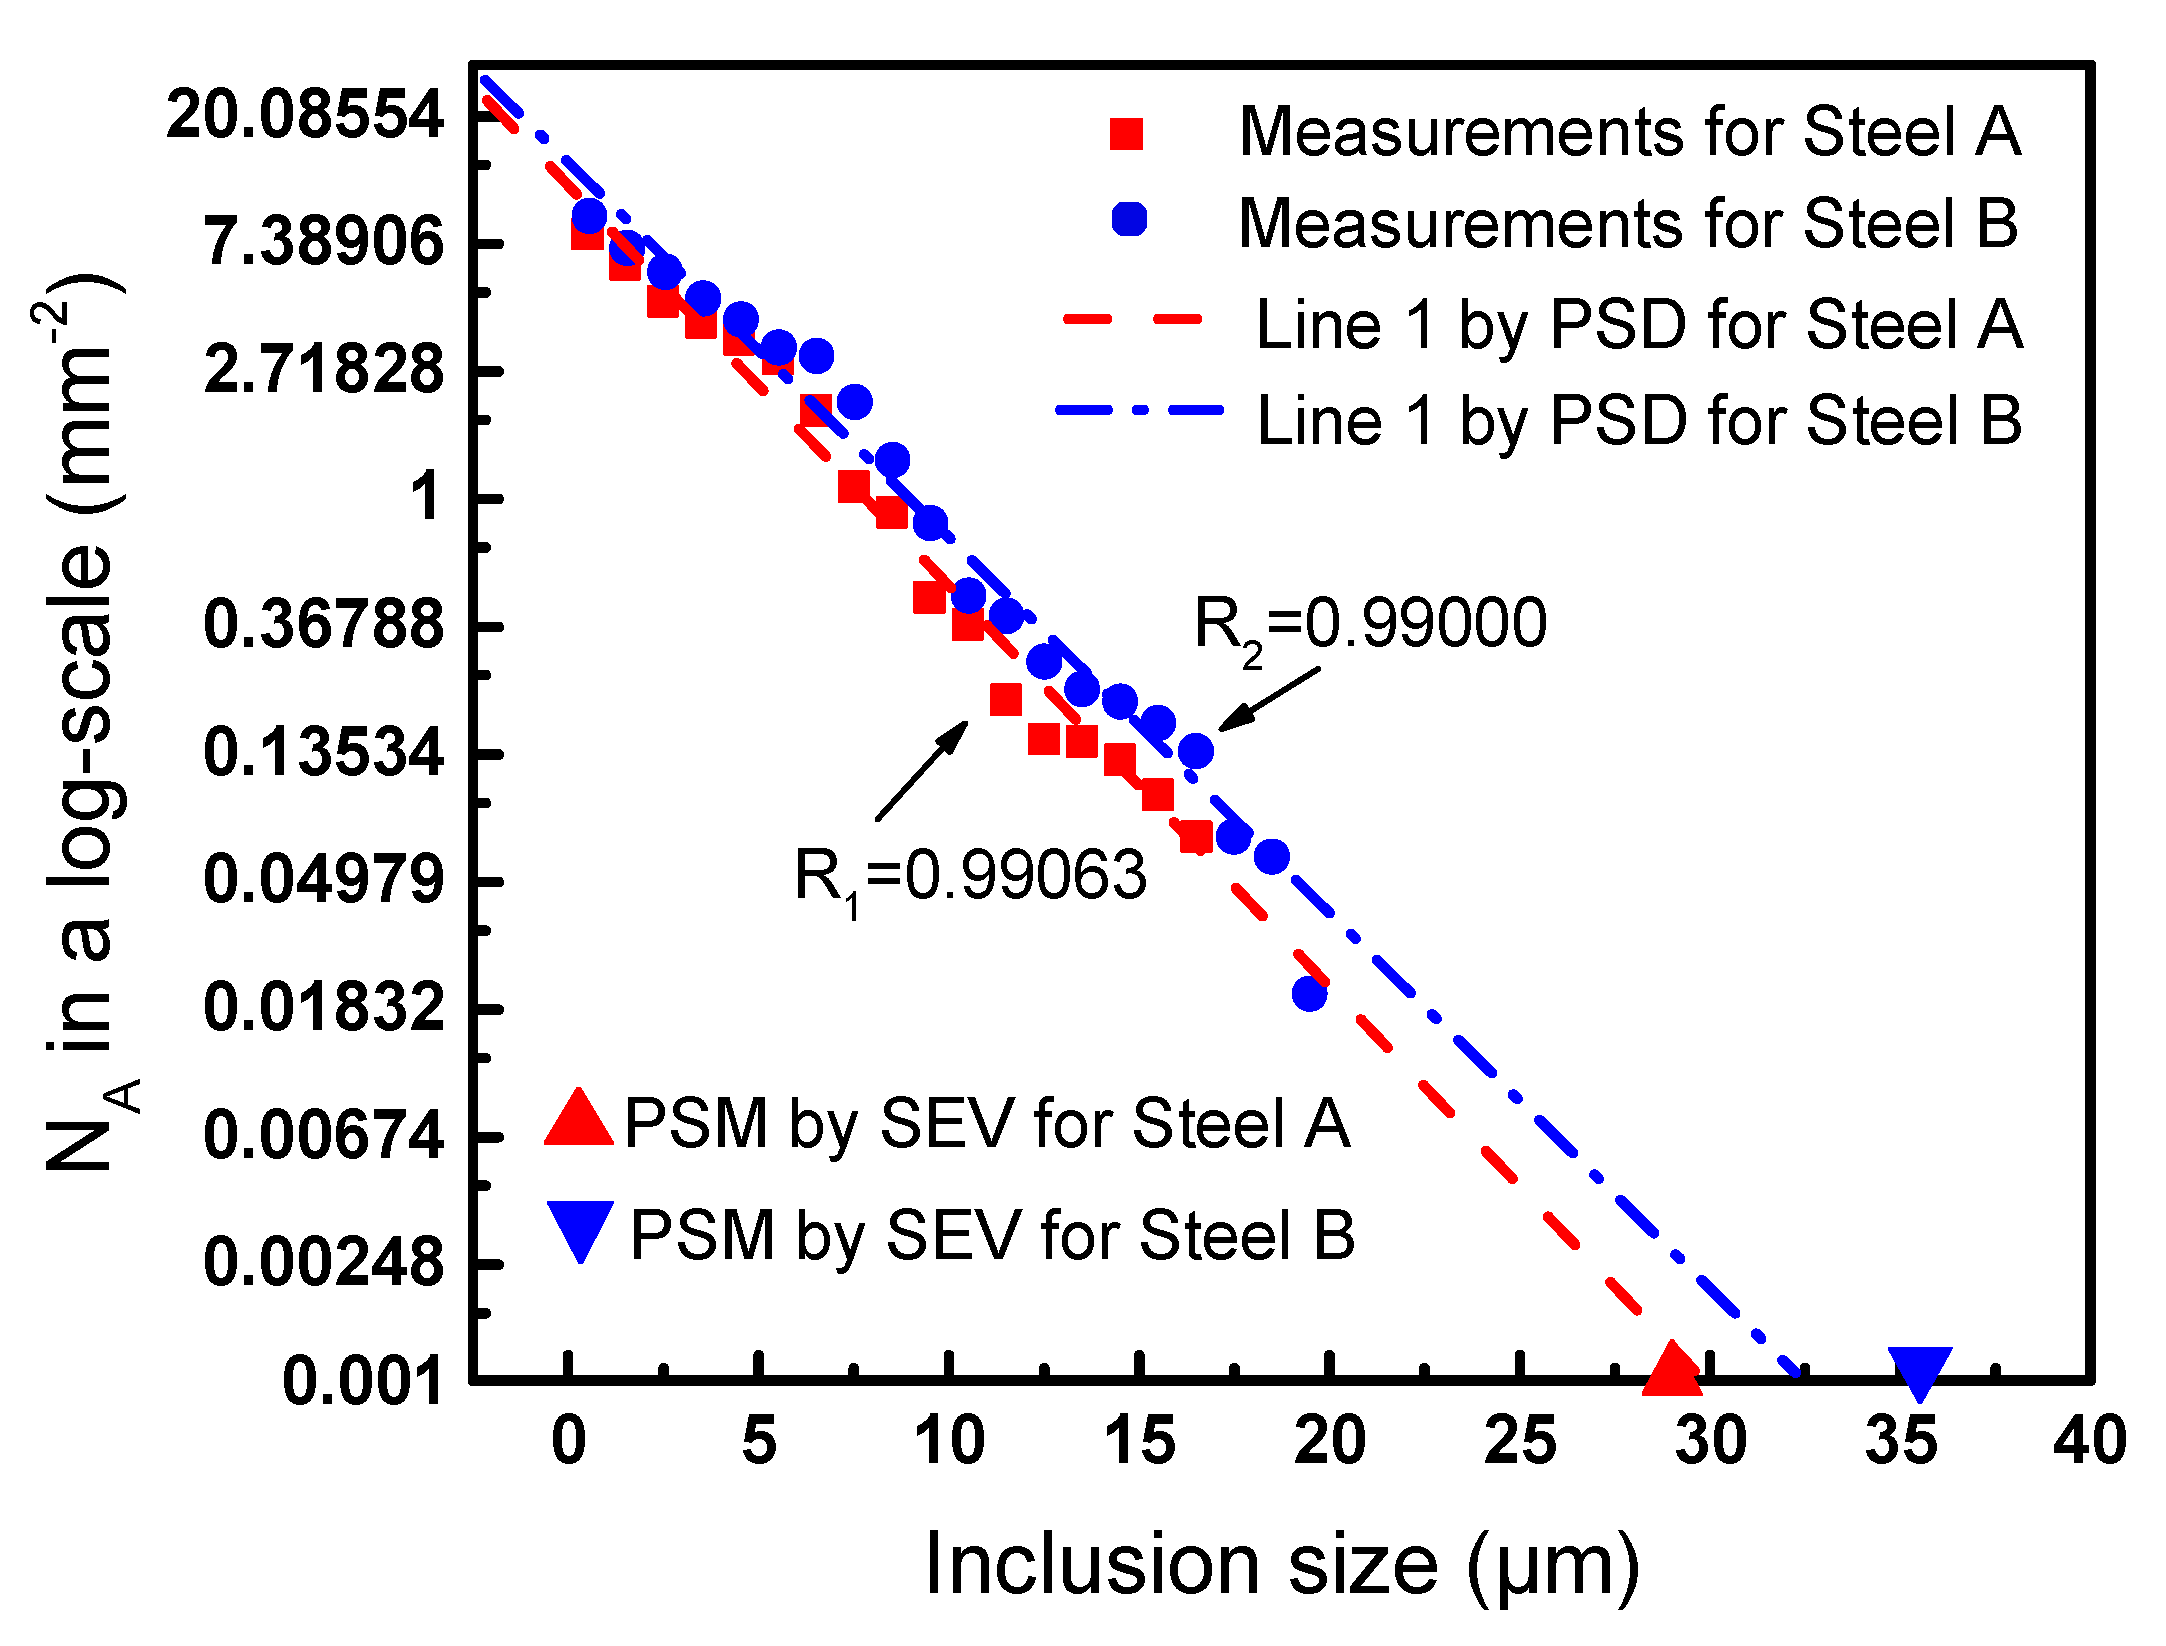
3.4. Comparison of the PMS (Probable Maximum Size) Values Determined by SEV and PSD Methods

Based on the above results, the PMS values in Aref of 1000 mm2 determined by the two methods at the different steelmaking stages for two steels are compared as plotted in Figure 11. It can been found that the PMS values in the molten steel can be predicted well and consistently by both SEV and PSD with high correlation coefficients of the regression lines. The PMS in the slab is larger than that in the molten steel. Thus, the PMS of inclusions in the slab cannot be predicted from the molten steel samples. The production processes are the same and are both stably controlled for the two steels. Besides, the contents of elements for the two steels are similar, except for S. Therefore, the effect of S content on the PMS of inclusions for two steels can be analyzed as follows. On the one hand, the Al2O3 inclusions are the dominating inclusions in the molten steel. Therefore, there is little influence of S content on the PMS values in the molten steel. The PMS values in the molten steel are consistent between the two steels because of the similar O and Al contents. On the other hand, the higher content of S in Steel B leads to the larger PMS value in the slab for Steel B than that for Steel A, which is attributed to the fact that the number density and average size of Al2O3-MnS inclusions are both increased in Steel B.
There is a significant discrepancy between the PMS values in the slab obtained by the two methods, which is different from Kanbe et al.’s finding [15]. They concluded that the PMS value determined by SEV agrees well with that of the exponential approximation of PSD. There are two possible following reasons for the difference between the PMS values in the slab by SEV and PSD in this study: (1) Measurement error due to the small number of observed unit areas. (2) Difference in inclusions to determine the PMS values by the two methods.
In order to clarify the assumption (1), the total observed area was increased by adding the number of observed unit areas, n, in each sample. The regression lines by PSD and PMS by SEV as a function of n (= 40, 60 and 80) for Steels A and B are illustrated in Figure 12. The PMS by PSD is treated as the value of the interception between the regression line and X-axis where the NA is 0.001 mm−2 and the PMS value by SEV is also plotted on the X-axis. This treatment enables it to equivalently compare the PMS by the two methods. As shown in Figure 12, the distinction of the PMS calculated from SEV and PSD is not diminished on increasing the number of observed unit areas. Thus, there is little effect of increasing the number of observed unit areas on narrowing the disparity between the PMS values by the two methods when the quantity of observed unit areas is large enough.
About assumption (2), due to large numbers of the small-sized MnS and large-sized Al2O3-MnS in the slab, the inclusions with maximum Feret’s diameter smaller than 2 μm and larger than 14 μm deviate from the regression lines of PSD, as demonstrated by the red circles in Figure 10. Therefore, three attempts were carried out to study how the results change with or without considering MnS or Al2O3-MnS, as denoted in Figure 13.
The PMS value obtained by SEV reduces most obviously when Al2O3-MnS is not taken into consideration, as marked by the blue circles in Figure 13. The reduction of PMS value by SEV is the smallest when without considering MnS, as shown by the triangle marks. The PMS value by SEV is also influenced when only for Al2O3 because the number density of Al2O3 in the slab is less than that of Al2O3-MnS although Al2O3 is also of large size. Then the role of Al2O3-MnS on SEV is greater than that of Al2O3. It is therefore proved that Al2O3-MnS is the most crucial factor on SEV, while there is little influence of MnS on SEV. Only the large-sized inclusions should be taken into account for SEV.
Besides, compared with line 1 for all data, all the regression lines of PSD are changed when without MnS or Al2O3-MnS and with only Al2O3 as noted by lines 2–4. It is implied that the PSD for the slab is influenced by kinds of inclusions with different sizes, as Al2O3-MnS and MnS. Unlike SEV, there is great influence of MnS on PSD.
In order to further clarify the role of Al2O3-MnS on the SEV and PSD, the SEV and PSD when only Al2O3-MnS inclusions are taken into consideration are investigated, as shown in Figure 14. The PMS values by SEV are 28.13 and 35.61 for Steels A and B, respectively, which are similar to the values by SEV for all data of 30.50 and 36.42 for Steels A and B, respectively. The PSM values by PSD when only considering Al2O3-MnS are largely increased compared with line 1 for all data in Figure 13. It can be also found that the PMS values by SEV and PSD are almost consistent. The correlation coefficients, R of the regression lines for PSD are both high about 0.99 for two steels, which proves that the size distribution of Al2O3-MnS inclusions can follow the hypothetical exponential relationship for PSD. Besides, Al2O3-MnS inclusions are of large size. Therefore, when only considering Al2O3-MnS, two methods of SEV and PSD can both predict the PMS values of Al2O3-MnS inclusions, which can reflect the PMS value for all data about all kinds of inclusions in the slab.
Accordingly, compared with Kanbe et al.’s results [15], the discrepancy between the PMS values by the two methods in the present study results from the difference in the inclusion types to determine the PMS values by the two methods. For the slab, SEV is mainly decided by the large-sized Al2O3-MnS inclusions, but PSD is also largely influenced by the numerous MnS precipitates with small size. Hence, because of the same inclusion type to determine SEV and PSD when only considering Al2O3-MnS or Al2O3, the difference in the PMS values by the two methods is minimal, which can also explain the similarity of PMS in the molten steel by the two methods, where Al2O3 is the decisive factor for the two methods.
For the application of SEV and PSD for the ultra-low carbon BH steel, the SEV is decided by large-sized inclusions and can be used to reasonably estimate the PMS in steels containing various kinds of inclusions. Thus, it is feasible to predict the PMS of inclusions in the slab for BH steel by SEV method, which can be also be proven by the high correlation coefficient in this study. However, the PSD of exponential function is affected by inclusions with various sizes. The considerable MnS inclusions with small size in the slab will largely influence the prediction accuracy of PSD but not SEV. Thus, it is not reasonable to use the PSD of exponential function to predict the PMS value in the slab for BH steel when considering MnS inclusions. But the PSD of exponential function can make a reasonable PMS prediction in the slab for BH steel when only Al2O3-MnS inclusions are taken into consideration. Besides, the SEV and optimized PSD methods are based on the inclusions observed in the slab with a small area to predict the maximum size of inclusions for a large area of the slab, which can provide a good reference value for evaluating the quality of the steel.
Based on the above investigation, it is believed that Al2O3-MnS inclusions are the key factor on PMS for ultra-low carbon BH steels of automobile exposed panel. The control of Al2O3-MnS inclusions is one of the keys to solve the surface defects. As high Mn (about 0.650%) and S (0.010–0.015%) contents, it is inevitable that a large amount of MnS will precipitate on the surface of Al2O3 inclusions during solidification. Therefore, when the external factors such as secondary oxidation and instability during the continuous casting process are not considered, in addition to the control of Mn and S content, the control of sulfur segregation, the reduction of large amount of MnS precipitation on Al2O3 inclusions during solidification, and the removal of large-sized Al2O3 inclusions in steel should also be paid much attention in future research.

4. Conclusions

The Probable Maximum Sizes (PMS) of inclusions in RH, tundish and slab were predicted by Statistics of Extreme Values (SEV) and Particle Size Distribution (PSD) methods for ultra-low carbon Bake Hardening (BH) steels of automobile exposed panel with Mn (about 0.650%), P (about 0.035%), and S (0.010–0.015%) contents, which are much higher than those of the conventional ultra-low carbon Interstitial-Free (IF) steel. The effect of S content on the PMS of inclusions estimated at the different steelmaking stages was studied. The difference in PMS values determined by SEV and PSD methods as well as the optimized prediction method for the PMS values was discussed for the ultra-low carbon BH steels. The conclusions for BH steel are as follows:
(1) The S content does not show a relationship with the PMS prediction of inclusions in the molten steel because Al2O3 inclusions are decisive inclusions. The higher S content leads to larger PMS of inclusions in the slab, because the large-sized Al2O3-MnS inclusions are formed during solidification and play a major role on the PMS value in the slab.
(2) Due to the considerable amount of Al2O3-MnS inclusions with large size in the slab, the predicated PMS of inclusions in the slab is much greater than that in molten steel. Thus, the PMS of inclusions in the slab cannot be predicted from the molten steel samples.
(3) The SEV can be well used to predict the PMS values at the different steelmaking stages for BH steels. However, it is not reasonable to use the PSD of exponential function to predict the PMS value in the slab for BH steel when considering all kinds of inclusions due to the large influence of small-sized MnS with high number density on the PSD of exponential function.
(4) When Al2O3-MnS inclusions are only considered, the PSD of exponential function can well predict the PMS values in the slab, because the size distribution of Al2O3-MnS inclusions with large size can follow the exponential function.

Author Contributions

Conceptualization, X.P. and J.Y.; methodology, X.P.; software, X.P.; validation, X.P.; J.Y.; formal analysis, X.P. and J.Y.; investigation, X.P. and J.Y.; resources, J.Y.; data curation, X.P. and J.Y.; writing—original draft preparation, X.P.; writing—review and editing, X.P. and J.Y.; supervision, J.Y.; project administration, J.Y.; funding acquisition, J.Y. All authors have read and agreed to the published version of the manuscript.

Funding

This research was funded by the Natural Science Foundation of China, No. U1960202 and the Science and Technology Commission of Shanghai Municipality (No. 19DZ2270200).

Conflicts of Interest

The authors declare no conflict of interest.

References

  1. Wang, M.; Bao, Y.-P. Source and negative effects of macro-inclusions in titanium stabilized ultra low carbon interstitial free (Ti-IF) steel. Met. Mater. Int. 2012, 18, 29–35. [Google Scholar] [CrossRef]
  2. Zhang, Q.; Wang, L.; Wang, X. Influence of Casting Speed Variation during Unsteady Continuous Casting on Non-metallic Inclusions in IF Steel Slabs. ISIJ Int. 2006, 46, 1421–1426. [Google Scholar] [CrossRef] [Green Version]
  3. Esaka, H.; Kuroda, Y.; Shinozuka, K.; Tamura, M. Interaction between Argon Gas Bubbles and Solidified Shell. ISIJ Int. 2004, 44, 682–690. [Google Scholar] [CrossRef]
  4. Yasunaka, H.; Yamanaka, R.; Inoue, T.; Saito, T. Pinhole and Inclusion Defects Formed at the Subsurface in Ultra Low Carbon Steel. Tetsu-to-Hagane 1995, 81, 529–534. [Google Scholar] [CrossRef] [Green Version]
  5. Deng, X.; Li, L.-P.; Wang, X.-H.; Ji, Y.-Q.; Ji, C.-X.; Zhu, G.-S. Subsurface macro-inclusions and solidified hook character in aluminum-killed deep-drawing steel slabs. Int. J. Miner. Met. Mater. 2014, 21, 531–543. [Google Scholar] [CrossRef]
  6. Murakami, Y.; Uemura, Y.; Kawakami, K. Some problems in the application of statistics of extreme values to estimation of the maximum size of nonmetallic inclusions in metals. Trans. Jpn. Soc. Mech. Eng. Ser. A 1989, 55, 58–62. [Google Scholar] [CrossRef] [Green Version]
  7. Murakami, Y.; Toriyama, T.; Coudert, E. Instructions for a New Method of Inclusion Rating and Correlations with the Fatigue Limit. J. Test. Eval. 1994, 22, 318. [Google Scholar] [CrossRef]
  8. Murakami, Y. Inclusion rating by statistics of extreme values and its application to fatigue strength prediction and quality control of materials. J. Res. Natl. Inst. Stand. Technol. 1994, 99, 345. [Google Scholar] [CrossRef]
  9. Choi, B.-H.; Song, S.-H. Prediction of fatigue limit of induction surface hardened 1.05Cr–0.23Mo steel alloy using extreme value statistics. J. Mater. Sci. 2005, 40, 5427–5433. [Google Scholar] [CrossRef]
  10. Kato, Y.; Masuda, T.; Kawakami, K.; Hashizume, K. Recent Improvements in Cleanliness in High Carbon Chromium Bearing Steel. ISIJ Int. 1996, 36, 89. [Google Scholar] [CrossRef] [Green Version]
  11. Zhang, J.; Yang, Z.; Li, G.; Yao, G.; Li, S.; Hui, W.; Weng, Y.; Zhang, J. Estimation of maximum inclusion size and fatigue strength in high-strength ADF1 steel. Mater. Sci. Eng. A 2005, 394, 126–131. [Google Scholar] [CrossRef]
  12. Beretta, S.; Anderson, C.; Murakami, Y. Extreme value models for the assessment of steels containing multiple types of inclusion. Acta Mater. 2006, 54, 2277–2289. [Google Scholar] [CrossRef]
  13. Atkinson, H.V.; Shi, G. Characterization of inclusions in clean steels: A review including the statistics of extremes methods. Prog. Mater. Sci. 2003, 48, 457–520. [Google Scholar] [CrossRef]
  14. Shi, G.; Atkinson, H.; Sellars, C.; Anderson, C. Application of the Generalized Pareto Distribution to the estimation of the size of the maximum inclusion in clean steels. Acta Mater. 1999, 47, 1455–1468. [Google Scholar] [CrossRef]
  15. Kanbe, Y.; Karasev, A.; Todoroki, H.; Jönsson, P.G. Determination of Size Distribution and Probable Maximum Size of Inclusions in AISI304 Stainless Steel. ISIJ Int. 2013, 53, 1968–1973. [Google Scholar] [CrossRef] [Green Version]
  16. Kanbe, Y.; Karasev, A.; Todoroki, H.; Jönsson, P.G. Application of Statistics of Extreme Values for Inclusions in Stainless Steel on Different Stages of Steel Making Proces. ISIJ Int. 2011, 51, 2056–2063. [Google Scholar] [CrossRef] [Green Version]
  17. Kanbe, Y.; Karasev, A.; Todoroki, H.; Jönsson, P.G. Analysis of Largest Sulfide Inclusions in Low Carbon Steel by Using Statistics of Extreme Values. Steel Res. Int. 2010, 82, 313–322. [Google Scholar] [CrossRef]
  18. Kanbe, Y.; Karasev, A.; Todoroki, H.; Jönsson, P.G. Application of Extreme Value Analysis for Two- and Three-Dimensional Determinations of the Largest Inclusion in Metal Samples. ISIJ Int. 2011, 51, 593–602. [Google Scholar] [CrossRef] [Green Version]
  19. Yang, Z.; Li, S.; Zhang, J.; Zhang, J.; Li, G.; Li, Z.; Hui, W.; Weng, Y. The fatigue behaviors of zero-inclusion and commercial 42CrMo steels in the super-long fatigue life regime. Acta Mater. 2004, 52, 5235–5241. [Google Scholar] [CrossRef]
  20. Liu, Q.; Jönsson, P.G.; Nakajima, K. Estimation of the Maximum Carbide Size in a Hypereutectic High Chromium Cast Iron Alloyed with Titanium. ISIJ Int. 2013, 53, 2176–2183. [Google Scholar] [CrossRef] [Green Version]
  21. Zhou, S.; Murakami, Y.; Fukushima, Y.; Beretta, S. Statistics of Extremes Analysis of Nonmetallic Inclusions Based on 3D Inspection. Tetsu-to-Hagane 2001, 87, 748–755. [Google Scholar] [CrossRef] [Green Version]
  22. Beretta, S.; Murakami, Y. Statistical analysis of defects for fatigue strength prediction and quality control of materials. Fatigue Fract. Eng. Mater. Struct. 1998, 21, 1049–1065. [Google Scholar] [CrossRef]
  23. Beretta, S.; Murakami, Y. Largest-extreme-value distribution analysis of multiple inclusion types in determining steel cleanliness. Met. Mater. Trans. A 2001, 32, 517–523. [Google Scholar] [CrossRef]
  24. Atkinson, H.; Shi, G.; Sellars, C.; Anderson, C. Statistical prediction of inclusion sizes in clean steels. Mater. Sci. Technol. 2000, 16, 1175–1180. [Google Scholar] [CrossRef]
  25. Takahashi, J. Simulation of the Estimation of the Maximum Inclusion Size from 2-Dimensional Observation Data on the Basis of the Extreme Value of Statistics. ISIJ Int. 2009, 49, 1030–1035. [Google Scholar] [CrossRef] [Green Version]
  26. Castro-Cedeño, E.-I.; Herrera-Trejo, M.; Castro-Roman, M.J.; Castro-Uresti, F.; López-Cornejo, M. Evaluation of Steel Cleanliness in a Steel Deoxidized Using Al. Met. Mater. Trans. A 2016, 47, 1613–1625. [Google Scholar] [CrossRef]
  27. Takahashi, J.; Suito, H. Random dispersion model of two-dimensional size distribution of second-phase particles. Acta Mater. 2001, 49, 711–719. [Google Scholar] [CrossRef]
  28. Zinngrebe, E.; Van Hoek, C.; Visser, H.; Westendorp, A.; Jung, I.-H. Inclusion Population Evolution in Ti-alloyed Al-killed Steel during Secondary Steelmaking Process. ISIJ Int. 2012, 52, 52–61. [Google Scholar] [CrossRef] [Green Version]
  29. Balkema, A.A.; De Haan, L. Residual Life Time at Great Age. Ann. Probab. 1974, 2, 792–804. [Google Scholar] [CrossRef]
  30. Pickands, J., III. Statistical inference using extreme order statistics. Ann. Stat. 1975, 3, 119–131. [Google Scholar]
  31. Deng, X.; Ji, C.; Cui, Y.; Tian, Z.; Yin, X.; Shao, X.; Yang, Y.; McLean, A. Formation and evolution of macro inclusions in IF steels during continuous casting. Ironmak. Steelmak. 2017, 44, 739–749. [Google Scholar] [CrossRef]
  32. Wang, M.; Bao, Y.-P.; Cui, H.; Wu, W.-S.; Wu, H.-J.; Chen, B.; Ji, C.-X.; Zhu, G.-S. Surface cleanliness evaluation in Ti stabilised ultralow carbon (Ti-IF) steel. Ironmak. Steelmak. 2011, 38, 386–390. [Google Scholar] [CrossRef]
  33. Wang, M.; Bao, Y.-P.; Cui, H.; Wu, H.-J.; Wu, W.-S. The Composition and Morphology Evolution of Oxide Inclusions in Ti-bearing Ultra Low-carbon Steel Melt Refined in the RH Process. ISIJ Int. 2010, 50, 1606–1611. [Google Scholar] [CrossRef] [Green Version]
  34. Murakami, Y. Effects of Small Defects and Nonmetallic Inclusions on the Fatigue Strength of Metals. Key Eng. Mater. 1991, 51, 37–42. [Google Scholar] [CrossRef]
  35. Brookes, B.C.; Gumbel, E.J. Statistical Theory of Extreme Values and Some Practical Applications. Math. Gaz. 1955, 39, 341. [Google Scholar] [CrossRef]
  36. ASTM E2283-03. Standard Practice for Extreme Value Analysis of Nonmetallic Inclusions in Steel and other Microstructural Features; American Society for Testing and Materials: Conshohocken, PA, USA, 2003. [Google Scholar]
  37. Zhang, L.; Pluschkell, W. Nucleation and growth kinetics of inclusions during liquid steel deoxidation. Ironmak. Steelmak. 2003, 30, 106–110. [Google Scholar] [CrossRef]
  38. Kwon, Y.-J.; Zhang, J.; Lee, H.-G. A CFD-based Nucleation-growth-removal Model for Inclusion Behavior in a Gas-agitated Ladle during Molten Steel Deoxidation. ISIJ Int. 2008, 48, 891–900. [Google Scholar] [CrossRef] [Green Version]
Figure 1. Simulation results of inclusions formation in liquid, solidified, and solid Steels A and B.
Metals 10 00637 g001
Figure 2. Changes in total oxygen content at different steelmaking stages.
Metals 10 00637 g002
Figure 3. Number density of different inclusions at different steelmaking stages for (a) Steel A and (b) Steel B.
Metals 10 00637 g003
Figure 4. Proportion of inclusions with different sizes for each kind of inclusion and individual average size in the slab for (a) Steel A and (b) Steel B.
Metals 10 00637 g004
Figure 5. Changes in the number density and average size of total inclusions from RH to slab with MnS for Steels (a) A and (b) B, without MnS for Steels (c) A and (d) B.
Metals 10 00637 g005aMetals 10 00637 g005b
Figure 6. Typical morphologies of Al2O3 inclusions with different shapes in the molten steel of (ad) RH ending; (e, f) tundish outlet for Steels A and B.
Metals 10 00637 g006
Figure 7. Typical morphologies of inclusions in the slab for Steels A and B: (ad) Al2O3 and (e,f) Al2O3-MnS, as well as the map scanning results of element distribution for (e) and (f).
Metals 10 00637 g007
Figure 8. Comparison of EVD (Extreme Value Distribution) data at the different steelmaking stages for (a) Steel A and (b) Steel B.
Metals 10 00637 g008
Figure 9. PSD (Particle Size Distribution) of inclusions at the different steelmaking stages for Steels (a) A and (b) B.
Metals 10 00637 g009
Figure 10. PSD of inclusions in a log-scale at the different steelmaking stages for Steels (a) A and (b) B.
Metals 10 00637 g010
Figure 11. PMS determined by SEV and PSD at the different steelmaking stages for (a) Steel A and (b) Steel B.
Metals 10 00637 g011
Figure 12. Comparison of regression lines by PSD (PMS by PSD noted as the intersection between line and X-axis) and PMS by SEV as a function of n (= 40, 60 and 80) for (a) Steel A and (b) Steel B.
Metals 10 00637 g012
Figure 13. Comparison of regression lines by PSD (PMS by PSD is represented as the intersection between the line and X-axis) and PMS by SEV in different cases for (a) Steel A and (b) Steel B.
Metals 10 00637 g013
Figure 14. Comparison of regression lines by PSD (PMS by PSD is represented as the intersection between the line and X-axis) and PMS by SEV when only Al2O3-MnS is taken into consideration for Steels A and B.
Metals 10 00637 g014
Table 1. Chemical compositions of the steels (mass%).
SteelsCSiMnPSAlAls 1TiONCa
A0.00200.00700.65500.03630.01030.05150.04250.00390.00190.00180.0002
B0.00210.00600.65800.03630.01520.05310.05040.00400.00180.00180.0001
1 Content of acidic soluble Al in steel.
Table 2. Parameters of regression lines by SEV (Statistics of Extreme Values) at the different steelmaking stages for Steels A and B.
SteelsStageSlopeInterceptR1PMS
ARH ending0.75903−2.547540.9975512.45
Tundish inlet0.66567−2.351540.9975213.91
Tundish outlet0.65190−2.580540.9974714.33
Slab0.27591−1.508670.9847430.50
BRH ending0.72763−2.450610.9986412.85
Tundish inlet0.67923−2.503510.9960513.84
Tundish outlet0.65061−2.872320.9952715.00
Slab0.23380−1.611200.9834136.42
1 Correlation coefficient.
Table 3. Parameters of regression lines by PSD at the different steelmaking stages for Steels A and B.
SteelsStageSlope (−b 1)Intercept (a 1)RPMS
ARH ending−0.832884.603670.9886013.82
Tundish inlet−0.757634.449690.9925714.99
Tundish outlet−0.719514.419050.9925615.74
Slab−0.513554.173050.9578521.58
BRH ending−0.836534.504990.9873113.64
Tundish inlet−0.736934.431990.9928115.39
Tundish outlet−0.698634.512020.9923816.34
Slab−0.453414.385080.9482424.90
1 N A = a · e b · d .

