Abstract
In the present work, the four-point bending loading fatigue properties of a heterogeneously distributed grain size microstructure consolidated from Ti-6Al-4V alloy powder are studied. The microstructure involved here, a so-called “harmonic structure”, possesses quasi-spherical large grain regions (“cores”) embedded in a continuous fine grain region (“shell”). Unlike the previous reports dealing with this issue, the effect of the specimen size on the fatigue characteristics is also probed, since two distinct specimen configurations are considered. Furthermore, the obtained experimental data are compared with the corresponding fatigue results derived from homogeneous coarse grain counterparts. Contrary to homogeneous structure material, discrepancies on both the fatigue strength and the fatigue crack initiation aspects are found for the harmonic structure material. Consequently, the present work aims to clarify the underlining phenomena involved in the specimen size effect detected for Ti-6Al-4V designed in the harmonic structure. A less active interface surface between the core and the shell combined with a wider critical volume in the large size specimen should be the main reasons of the fatigue strength discrepancy.
1. Introduction
As the mechanical properties of metallic materials are highly influenced by their microstructures, advanced material processes have been developed to acquire superior strengths. Among them, the grain refinement of polycrystalline metallic materials is an effective way to increase yield stress [1,2,3]. Nevertheless, fine-grained structural materials also lead to a critical loss of ductility. To reach both high strength and high ductility simultaneously, numerous microstructural designs have been proposed lately [4,5,6,7,8,9,10,11]. The most common strategy to achieve such superior mechanical properties consists in the design of bimodal grain size structures, possessing coarse and fine grains. Such structures are reported to enhance the back-stress hardening of metallic materials [11]. Fabrication of such heterogeneous microstructures can be controlled by several techniques, such as severe plastic deformation processes [8,11,12] or the recently developed cold spray additive manufacturing [13].
Another process for the creation of heterogeneous structure materials is given by the flexibility of the powder metallurgy route. Taking advantage of this characteristic, a peculiar bimodal structure having approximately spherical coarse grain regions (hereafter referred as the “cores”) surrounded by a continuous fine grain network (denoted as “shell”) has been developed [14,15,16,17,18,19]. This so-called “harmonic structure”, obtained from spark plasma sintering (SPS), enhances the tensile strength of Ti-based materials [14,15,16,17,18,19,20,21] compared with homogeneous grain size counterparts without significant loss of ductility. Nevertheless, tensile properties are not sufficient to assess the reliability of harmonic structured compounds for structural purposes. Indeed, the investigation of the fatigue behavior is one of the crucial aspects to probe before attempting any application as structural material. Therefore, several works have already been carried out to estimate the properties of materials tailored into harmonic structures under cyclic loading [20,21,22,23,24,25,26,27]. An increase of the fatigue endurance is reported, in line with the static tensile strength, despite the decrease of the fatigue stress intensity factor threshold. However, these reports involved miniature sized specimens (specimen thickness of 1 mm) due to the limited diameter of initial sintered compacts considered. Therefore, it is interesting to undertake investigation on the fatigue behavior of harmonic structured materials based on thicker specimens to acquire a refined image of its behavior from a macroscopic viewpoint, as examination of the specimen size effect on the fatigue properties of material presenting bimodal microstructure is very scarce.
In the present work, the four-point bending fatigue aspects of Ti-6Al-4V designed in a harmonic structure have been investigated using two specimen size configurations. In particular, the present report involves fatigue tests performed with the specimens’ size following the ISO 22214 Standard, which is significantly larger than the one accepted in our previous work [20]. The experimental results will be compared with the fatigue behavior derived from miniatured sized specimens, accepting a configuration similar to [20]. Furthermore, the effect of the harmonic structure itself is also examined, since homogeneous coarse grains microstructure material is involved in this work, for both specimen size configurations. The experimental results highlight a significant influence of the specimen size on the fatigue strength of Ti-6Al-4V designed in a harmonic structure, whereas homogeneous material shows a similar fatigue strength for both size configurations. In addition, noticeable differences on the fatigue crack initiation mechanisms are observed. Regardless of the size of the specimen, the fatigue crack propagation path in the harmonic structure material is indifferent of the location of the shell and core regions. In this study, a series of electron backscatter diffraction (EBSD) data acquisitions are undertaken to assess the geometrically necessary dislocations (GNDs) accumulation in the fatigued harmonic material, revealing an effect of the specimen size. Based on these experimental results, coupled to the introduction of a simplified model for comparison of the interface activity between the shell and the cores, the main reasons for the size effect arisen in the present report can be grasped.
2. Experimental Procedure
2.1. Material Processing
Even though the material processing is following the same procedure already described elsewhere [21], this section will sum up the main processing stages. Raw material is 186 µm-particle diameter Ti-6Al-4V powder, prepared by a plasma rotating electrode process (PREP). The material inside the initial powder presents an acicular microstructure, which is a typical characteristic of α’ martensitic transformation induced by PREP rapid cooling, with an average hardness of 326 Hv [17]. The chemical composition of this powder is introduced in Table 1. This powder is subjected to mechanical milling (MM) for 90 ks in an argon atmosphere, to generate a several tens micron-thick layer of fine grains from the powder surface, resulting in 397 and 369 Hv average hardness values inside the fine grain layer and powder center region, respectively [17]. The obtained powder is then consolidated by SPS at 1123 K for 1.8 ks in a vacuum to obtain the MM material. For the sake of comparison, sintered samples from the as-received initial powder (IP) are considered, leading to IP material. The sintered compacts of MM and IP materials consist of a cylindric geometry with a 50 mm diameter and a height of 11 mm. Post SPS examination indicates a relative density of 99.9% of the compacts, which suggests a limited number of pores inside the examined materials, as already reported [14]. The compacts are large enough to be able to cut off every needed specimen from the same compact for each material. In other words, only one compact for each material has been sintered to provide all required specimens.

Table 1.
Chemical composition of the Ti-6Al-4V plasma rotating electrode process (PREP) powder (mass %).
2.2. Mechanical Testing Procedure
The uniaxial tensile properties of both the MM and IP materials have been investigated through AG-X plus a tensile testing machine (Shimadzu Corp., Kyoto, Japan). To this end, tensile specimens accepting the dimensions depicted in Figure 1a are subjected to crosshead displacement control tests at an initial strain rate of 5.6 × 10⁻⁴ s−1. The strain measurement is assured by two strain gauges attached on opposite surfaces to each other to optimize the recording accuracy.
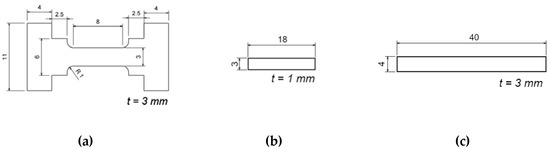
Figure 1.
Shapes and dimensions of the specimens. (a) Tensile specimen; (b) fatigue miniature size (MS) specimen; and (c) fatigue standard size (SS) specimen.
The fatigue characteristics of the investigated compounds are conducted as follows. Load-controlled fatigue tests under four-point bending loading have been performed using two distinct specimen sizes:
- The miniature size (hereafter denoted MS) specimen with length, width and thickness dimensions of 18, 3 and 1 mm, respectively (see Figure 1b). To this end, an electro-dynamic fatigue testing machine using a 9514-AN/SD actuator (EMIC Corp., Tokyo, Japan), operating at a loading frequency of 10 Hz, is considered. The frame geometry of the four-point bending loading adopts an inner span of 5 mm and an outer span of 15 mm. Such a configuration is identical to the one accepted in our previous work [20].
- The standard size (SS) specimen, presenting the length, width and thickness values of 40, 4 and 3mm, respectively (see Figure 1c). The dedicated frame possesses inner and outer spans of 10 and 30 mm, respectively, in accordance with the ISO 22214 Standard. To this end, a servo-hydraulic fatigue testing machine (SMH201, SAGINOMIYA, Tokyo, Japan), accepting a loading frequency of 20 Hz, has been used.
Regardless of the specimen size, small chamfers have been introduced by #2000 grinding paper on the edges of every fatigue specimen to relieve the stress concentration there. The tensile surface of the fatigue specimens is finished by 1 μm alumina suspension buffing. All fatigue tests have been carried out in air and at room temperature environment, considering a stress ratio R (= σmin/σmax) of 0.1. Fatigue tests were terminated at 107 cycles for unbroken specimens.
2.3. Analysis Tools
Observations of the fracture and the tensile surfaces of the failed specimens were carried out using a SU6600 SEM (Hitachi, Tokyo, Japan), equipped with an HKL NordlyF camera for EBSD acquisition, with AZtec 3.1 software (Oxford Instrument, Abington, UK) for data processing. A critical angle of 5° has been accepted to define grain boundaries in the present work. Some investigations included in this work involve kernel average misorientation (KAM) analysis to determine the local lattice rotation, based on the orientation of the fifth nearest neighbor pixels, with a distance between two neighbors (i.e. step size) of 0.25 μm. The same microscope is also equipped with an energy dispersive X-ray spectrometry (EDS) device for chemical composition analysis. Every fatigue strength regression showed in S-N diagrams in the present work is obtained by the JSMS-SD-11-08 standard [28].
3. Experimental Results
3.1. Characterization of the Materials’ Microstructure
The microstructures of the obtained compacts were investigated prior to the mechanical testing campaign by the EBSD technique, over a surface of 500 µm × 400 µm regions. The experimental results are displayed through grain size (GS) maps in Figure 2, where the black lines highlight high angle boundaries having a misorientation angle higher than 15°. One example of the microstructure found from the IP material is shown in Figure 2a, where a large predominance (approximately 80%) of acicular large grains, appearing in red color, is found. The remaining consists of some fine grains, presumably induced by a thin layer of such grain at the initial powder surface. According to these experimental results, the average grain size in the IP material is 11.6 μm.
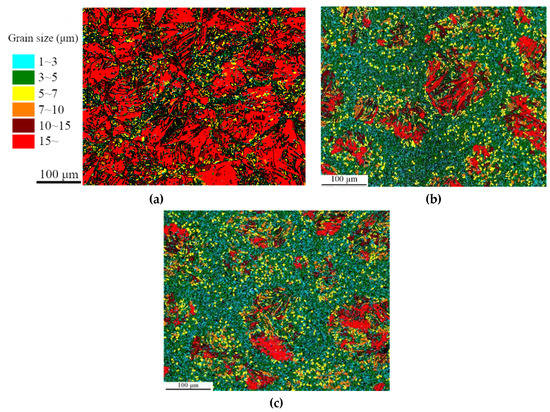
Figure 2.
Microstructure characterization of the investigated materials displayed in the form of grain size and high angle boundaries maps. (a) IP material; (b) MM material in the inner region; and (c) MM material in the outer region of the sintered compact. Step size of 0.25 μm.
The corresponding microstructure characterization for the MM material has been undertaken at two different spots of the sintered compact. Indeed, since the present report manipulates a sintered compact having larger dimensions than the previous reports [20,21], a temperature gradient throughout the compact may arise in the SPS process. In such a case, the microstructure of the MM material should reveal significant discrepancies depending on its relative position in the compact. Therefore, Figure 2b,c present examples of the microstructures found in the MM material in the inner and outer regions of the sintered compact. These regions are located at a maximum distance of 3 mm from the center and the edge of the sintered compact, respectively. For both GS maps, MM material consists of coarse grains regions accepting mainly acicular geometry, surrounded by a continuous network of fine equiaxed grains. Consequently, the MM material highlights a harmonic structure.
In addition, the Figure 2b,c outlines the absence of significant microstructure differences. Grain possessing an equivalent diameter larger than 5 µm is denoted as “coarse” (and referred to as “fine” in the opposite case), and a refined analysis of the MM material’s microstructures in the inner and outer regions is given in Table 2, based on two distinct EBSD acquisitions. The numerical results highlight very close figures, in both regions, which assure similar microstructures of the MM material throughout the entire compact.
Table 2.
Microstructure of mechanical milling (MM) material in the inner and outer regions of the sintered compact.
3.2. Tensile Tests Results
Static mechanical properties on average values, based on nominal stress calculation, are listed in Table 3. One can note that MM material highlights both a larger ultimate tensile strength σUTS and elongation at fracture δ than IP counterpart. This trend, which has been reported for material designed in a harmonic structure [14,15,16,17,18,19], is usually induced by the ability to reach larger elongation before emergence of necking phenomenon. To reconfirm this feature, an example of the true stress–true strain curve is presented in Figure 3 for each material investigated. The MM material shows both superior yield stress and enhanced capability to deform uniformly. This combination results in a higher tensile strength than the IP counterpart, in addition with a postponed necking phenomenon.
Table 3.
Average mechanical properties of the MM and initial powder (IP) materials based on nominal stress–strain curve.
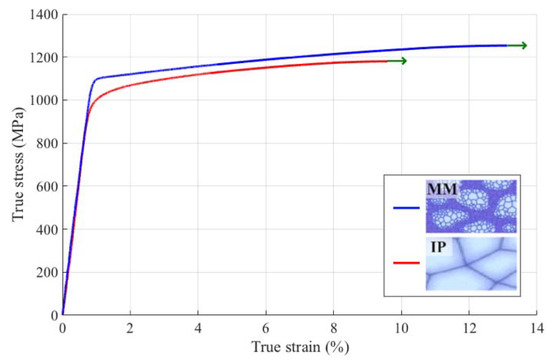
Figure 3.
Example of the true stress–true strain curves from the IP and MM materials. Green arrows underline the beginning of necking phenomenon.
It is noteworthy that the tensile strength levels obtained in the present investigation from both the IP and MM materials are significantly larger than in our previous study [20], outlining a gap of approximately 150 MPa. Indeed, the microstructure observed in this previous report revealed significantly larger grain sizes, with an overall average grain size of 26.3 and 16.9 µm for IP and MM materials, respectively. Thus, the higher tensile strength reported in the present work is likely caused by the finer microstructures.
3.3. Fatigue Tests Results
3.3.1. Fundamental Fatigue Strength from the MS Configuration
Firstly, let us focus on the fatigue test results related to the MS configuration only. The corresponding fatigue strength results are depicted in the form of an S-N curve, in Figure 4a. According to the S-N diagram, IP and MM compounds show equivalent strength in the Nf < 106 cycles region, whereas the MM material highlights a slight increase of fatigue strength compared to its IP counterpart for the Nf > 106 cycles region. Therefore, the fatigue endurance at 107 cycles of the MM material (738 ± 15 MPa) is higher than the IP one (683 ± 14 MPa). A similar trend has been reported in our previous work dedicated to Ti-6Al-4V alloy [20], as emphasized in Figure 4a. The fatigue strength offset between data from [20] and reported in the present study is caused by the tensile strength discrepancy of the investigated materials, as mentioned in Section 3.2.
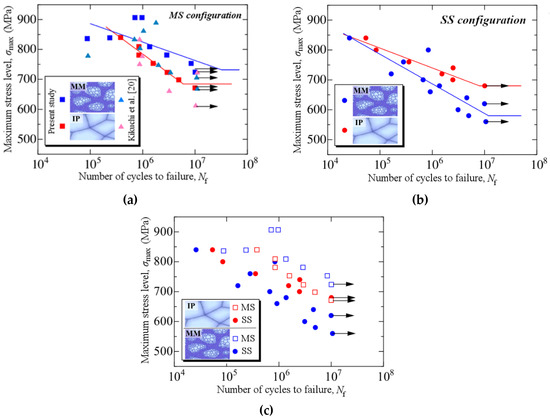
Figure 4.
Fatigue data obtained from IP and MM materials in the form of S-N diagrams. (a) Case of MS configuration only and comparison with experimental results from our previous work, data from [20]; (b) case of SS configuration only; and (c) entire collected data in the same diagram. Arrows indicate run-out tests.
3.3.2. S-N Characteristics from SS Specimens
The S-N diagram comparing the fatigue strength measured in the SS configuration for both the IP and MM materials is presented in Figure 4b. One can note that the fatigue strength is almost equivalent in the Nf < 2 × 10⁵ cycles region, in a way rather similar to the results found in Section 3.3.1 for the MS configuration. However, in a clearly opposite trend to the MS configuration, the MM compound shows a distinct decrease of fatigue strength in the Nf > 2 × 10⁵ cycles region, compared to its IP counterpart. This decrease is particularly visible in the region of the 106 < Nf < 107 cycles, where several specimens made of the MM material highlight fatigue failure at low stress levels ranging from 580 to 640 MPa. It results in a 570 ± 10 MPa fatigue endurance for the MM material, significantly lower than the 680 ± 20 MPa one found for the IP counterpart. Therefore, the experimental data obtained from the SS configuration are in discrepancy with the data collected from the MS configuration.
In order to better grasp the situation here from a strictly fatigue strength viewpoint, Figure 4c gathers the S-N data obtained in the present study from both specimen size configurations in the same diagram. On the one hand, even though a slight discrepancy is found from the IP material fatigue strengths from the MS and SS configurations in the limited fatigue region, the fatigue endurances at 107 cycles are similar. Thus, no significant specimen size effect on the fatigue properties of Ti-6Al-4V in the IP structure is detected here. On the other hand, the MM material highlights a clear specimen size effect, where the fatigue endurance decreased from 738 ± 15 to 570 ± 10 MPa for the MS to SS configurations, respectively.
3.3.3. Fatigue Crack Initiation Features
In the case of the MS configuration, the typical features of micrographs focused on the fatigue crack initiation region are depicted in Figure 5. In a way similar to the observations carried out in our previous work [20] involving only experiments on the MS configuration, the IP compound showed a crack initiation at the specimen’s tensile surface revealing clear facets, as depicted in Figure 5a. Due to the size of facets observed, the crack nucleated from acicular coarse grains of the structure. For the MM material, the fatigue crack initiation has occurred at three different possible positions underlined by white ellipses in Figure 5b–d: (i) at the tensile surface (Figure 5b); (ii) showing facets in contact with the surface (Figure 5c); and (iii) inside the specimen body (Figure 5d). In accordance to the related micrographs, regardless the position of the crack initiation region, one can detect clear facets. According to our previous work, such facets are certainly caused by the basal slip in the α-phase grain [20]. Due to the size of the formed facets at the initiation site, cracks are certainly nucleated inside a core of the harmonic structure, in agreement with our previous work [20]. An analysis of the occurrences of these three nucleation patterns is depicted in the form of an S-N diagram, in Figure 5e. Clearly, the distinct patterns are well distributed over the S-N diagram. Thus, rather than an effect of the fatigue loading level or fatigue life region, the pattern occurrence is presumably governed by the intrinsic local resistance against fatigue crack nucleation of the specimen. Several literature reports [29,30,31,32] have underlined similar fatigue strengths from interior and surface-induced crack mechanisms in Ti-6Al-4V alloy, in line with the experimental results found in the present work.
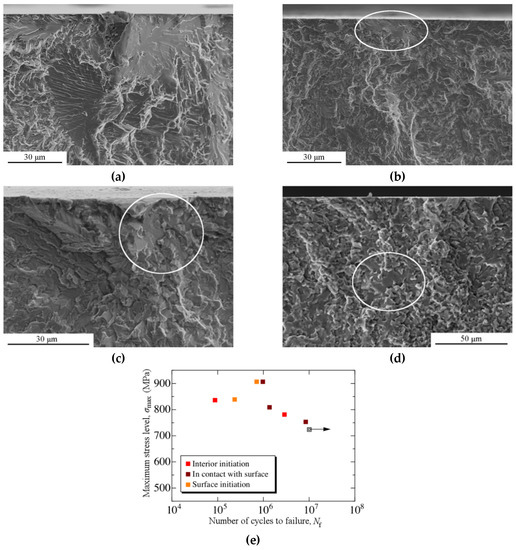
Figure 5.
Typical fatigue crack initiation features in the MS configuration. The white ellipse highlights the crack initiation site. (a) Intragranular facets at the tensile surface for IP material (σmax = 753 MPa, Nf = 1.59 × 10⁶ cycles); (b) facets at the tensile surface for MM material (σmax = 907 MPa, Nf = 7.14 × 10⁵ cycles); (c) facets in contact with the tensile surface for MM material (σmax = 907 MPa, Nf = 9.71 × 10⁵ cycles); (d) interior-induced initiation feature with formation of facets for MM material (σmax = 836 MPa, Nf = 8.76 × 10⁴ cycles); and (e) fatigue crack initiation phenomenon occurrence for MM material in the form of an S-N diagram.
Let us now introduce the fatigue crack initiation features observed in the SS configuration. Two nucleation patterns were found for the IP material, as depicted in Figure 6a,b. In Figure 6a, the nucleation site takes place at the specimen’s tensile surface, whereas the interior induced initiation is shown in Figure 6b. Regardless of the position of the initiation, similar facets to the one depicted in Figure 5 can be observed, thus reasonably induced by the same basal slip mechanism discussed earlier in this section. In the case of the MM material, four distinct fatigue crack initiation modes have been identified and relevant micrographs are presented in Figure 6c–f. In Figure 6c, the crack initiation takes place close to the chamfer of the specimen. However, an orthogonal viewpoint of the fracture surface is not suitable to observe the nucleation site. Thus, a tilted micrograph taken in the orientation highlighted by the black arrow is introduced as an inset of Figure 6c, where facets similar to Figure 5d are found. The size of the facets, probably induced by the basal slip mechanism, suggests that the initiation is nucleated from the core of the harmonic structure, in a way similar to the MM material in the MS configuration. On the other hand, Figure 6d underlines intergranular crack initiation, which occurred from a core in regard to the size of the intergranular facets thus formed. For a unique specimen case, the crack was nucleated far from the tensile surface, as depicted in Figure 6e, where pores can be observed (see inset). These kinds of defects are certainly induced by SPS processing, leading to the fatigue crack nucleation. Furthermore, occurrences of cracks induced by inclusions, located certainly in the shell of the MM material, were found. Indeed, Figure 6f shows a typical example of a fatigue crack initiation site, where an inclusion has been detected by the means of an EDS analysis carried out in the white-squared region highlighted on the micrograph. Local high concentrations of Ca, Mg and O chemical elements are detected, in this particular case. Some other inclusions also present Si atoms. Since titanium alloys are known to be relatively clean compounds [30,33], such foreign atoms in Ti-6Al-4V alloy are certainly induced by a contamination of the powder previous to SPS processing. Furthermore, the IP counterpart is not prone to such a fatigue crack initiation phenomenon, leading to the suggestion that the mechanical milling process likely causes this contamination.
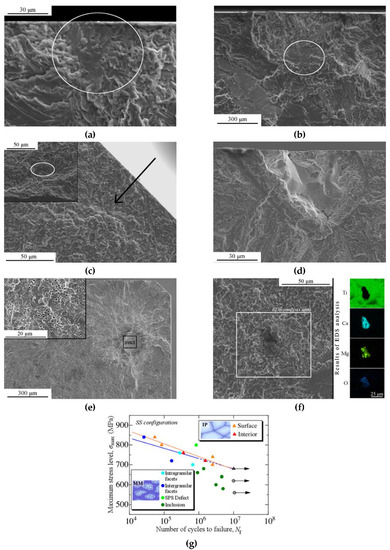
Figure 6.
Typical fatigue crack initiation features found in SS configuration, for IP material (a,b) and MM material (c–f). The white ellipse highlights the initiation site. (a) Initiation at the tensile surface with facets (σmax = 700 MPa, Nf = 2.48 × 10⁶ cycles); and (b) interior-induced initiation with facets (σmax = 720 MPa, Nf = 1.54 × 10⁶ cycles); (c) intragranular initiation mechanism from a core forming facets (σmax = 700 MPa, Nf = 6.65 × 10⁵ cycles); (d) intergranular initiation from a core (σmax = 840 MPa, Nf = 2.61 × 10⁴ cycles); (e) initiation from pore defects (σmax = 800 MPa, Nf = 8.40 × 10⁵ cycles); (f) initiation from an inclusion detected by EDS analysis (σmax = 660 MPa, Nf = 9.18 × 10⁵ cycles); and (g) fatigue crack initiation phenomenon occurrence in the form of an S-N diagram, where the regression in blue excludes fatigue data from inclusion-induced nucleation phenomenon.
3.3.4. Fatigue Crack Propagation Aspects in the MM Material
In the case of the MM material, typical features of the fatigue crack propagation zone are depicted in Figure 7a,b, corresponding to the MS and SS specimen configurations, respectively. One can notice formation of apparent dark zones in the fatigue crack propagation region, regardless of the specimen size. The most preeminent zones are highlighted by white-dotted ellipses in Figure 7a,b. In order to clarify the nature of these zones, a refined analysis of the region highlighted by a solid ellipse in Figure 7b will be carried out. A high magnification micrograph of the corresponding zone is shown in Figure 7c.
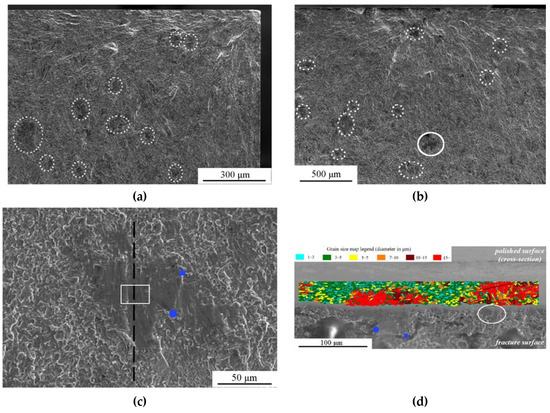
Figure 7.
Analysis of the fatigue crack propagation features in MM material. (a) Overview of the fatigue crack propagation region, MS configuration (σmax = 781 MPa, Nf = 2.89 × 10⁶ cycles); (b) overview of the fatigue crack propagation region, SS configuration (σmax = 680 MPa, Nf = 1.38 × 10⁶ cycles); (c) high magnification micrograph of the dark zone highlighted by a solid white ellipse in (b); and (d) after 90° clockwise rotation, acquisition results from the electron backscatter diffraction (EBSD) technique in the form of a grain size map showing the microstructure beneath the dark zone analyzed. Blue dots in (c,d) indicate the same locations before and after rotation.
The specimen has been grinded along the vertical black broken line displayed in Figure 7c, and then the newly created surface was finished by oxide polishing suspension (OPS). The prepared surface is then subjected to an EBSD analysis to monitor the microstructure beneath the dark zone pattern. Acquisition results thus obtained are depicted in Figure 7d, where the specimen orientation has been rotated to 90° clockwise and tilted at an angle of 70°, showing the prepared cross-section surface and the fracture surface on the upper and lower sides of the micrograph, respectively. In order to understand more easily the respective locations on the fracture surfaces depicted in Figure 7c,d, two distinct location spots in both photographs have been highlighted by two reference points appearing in blue color.
The results from the EBSD analysis conducted on the prepared surface are presented in the form of a GS map, in Figure 7d. This map underlines the presence of the coarse grain structure beneath the investigated dark zone. This analysis demonstrates that the dark zone is induced by the fatigue crack propagation through the core of the MM material. Furthermore, on the right-hand side of the same map, one can also point out another coarse grain region beneath the fracture surface. Even though a dark zone as large as the initially investigated one cannot be observed on the fracture surface, a tiny region that depicts similar features is also highlighted by a white ellipse. The reason for the size discrepancy between these two zones observed on the fracture surface results from the relative locations of the crack path and the two cores. Indeed, the crack path almost gets through the center of the core in the initial studied region, whereas the crack path propagates only close to the outer region of the core located at the right-hand side of the EBSD analyzed region. Therefore, these experimental results demonstrate that the fatigue crack path is unaffected by the microstructure features of the harmonic structure, at least in locations far from the fatigue crack initiation site. Similar behaviors for Ti-based materials designed in a harmonic structure have been recently reported in [34,35].
3.3.5. Characterization of the Fatigue Behavior of MM Material by Local Misorientation Analysis
The Section 3.3.2 emphasized distinct fatigue resistance levels of the MM material depending on its specimen size configuration, i.e., MS or SS specimens. This fatigue behavior discrepancy is mandatory to clarify. To this end, this section aims at identifying possible divergences between one individual specimen of each size (MS and SS) prone to the same stress level σmax = 780 MPa. According to the S-N regression curves introduced in Figure 4a,b, the respective fatigue lives Nf for the MS and SS configurations are 5.0 × 10⁶ and 9.0 × 10⁴ cycles, respectively. Since both values are remarkably distinct to each other, the present discussion will consider four arbitrary fatigue stages of 0% (initial state), 5%, 20% and 60% of the respective fatigue lives Nf.
For each specimen considered, prior to testing, the tensile surface was finished by OPS to obtain an observation condition suitable for EBSD data acquisition. Then, EBSD analyses were performed at every fatigue stage described earlier in this section at the same peculiar location prone to the maximum bending moment. To ensure meaningful data processing, the lattice rotation over a region covering roughly ten cores and its surrounding shell network has been probed. EBSD data results are presented in the form of KAM maps in Figure 8. Figure 8a–d depicts the KAM maps for the SS specimen at 0%, 5%, 20% and 60% of Nf, respectively. In a similar trend to the results observed from harmonic materials prone to uniaxial tension tests, the lattice misorientation increases in the shell network [22,36,37]. Furthermore, Figure 8e,f displays the corresponding KAM maps for the MS specimen at the initial stage and at 60% of Nf, respectively. Even though the lattice rotation shows a similar trend to the SS specimen, the shell network in Figure 8f presents a KAM value at 60% of Nf significantly larger in the MS configuration than the SS one, in accordance with the color scale.
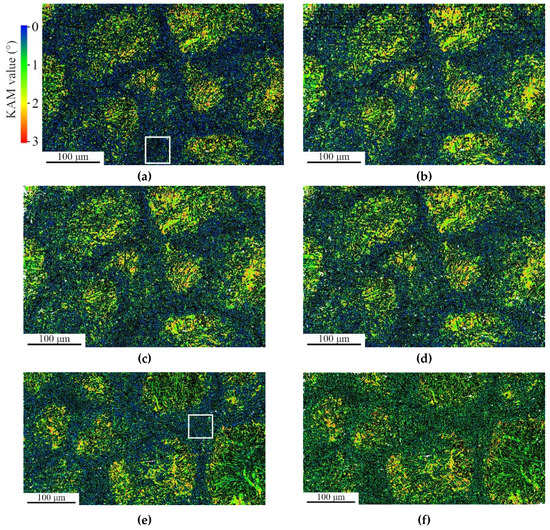
Figure 8.
Kernel average misorientation (KAM) maps obtained from the fatigue specimen on the tensile surface, MM material. Results from the SS configuration at initial state (0% Nf) and 5% Nf, 20% Nf and 60% Nf are displayed in (a–d), respectively. Results from MS configuration at initial state and 60% Nf are included in (e,f), respectively. Step size of 0.25 μm. Color range from blue (0°) to red (3° and higher).
To further discuss these collected data, the present analysis considers the KAM average value, as a hint of the concentration of GNDs [38,39,40,41]. The average KAM value is calculated on the basis of KAM distribution considering classes width of 0.05° over the 0° to 5° range. The obtained values, for both the MS and SS specimen size configurations, are presented through bar diagrams in Figure 9. First, let us introduce in Figure 9a the KAM average values obtained from the whole analyzed surface (i.e., the entire surface shown in Figure 8). Whereas the SS specimen shows a slight increase of the KAM average value at approximately 0.86° after 5% Nf and then keeps almost constant up to 60% Nf, the analyzed surface from the MS specimen emphasized a steady increase of the KAM average value from approximately 0.85° to 0.99°. Since the core regions are concentrating high KAM values, such data processing is obviously dependent on the core fraction in the considered areas. Furthermore, in accordance with Figure 8, a change of lattice misorientation occurs essentially in the shell of the harmonic structure. Thus, KAM average values were also investigated in one selected shell location for each specimen size configuration, highlighted by a white square in Figure 8a,e, for the SS and MS configuration, respectively. The corresponding results are shown in a bar diagram in Figure 9b. In an analogous trend to Figure 9a, the collected data from the shell location emphasized a clear increase of the KAM average value in the MS specimen, whereas the increasing trend in the SS configuration is rather limited, reaching a saturation level after only 5% Nf stage. This discrepancy suggests that the MM material designed in a harmonic structure does not undergo the same hardening behavior under cyclic loading in the MS and SS configurations. Further discussions will be elaborated in Section 4.4.
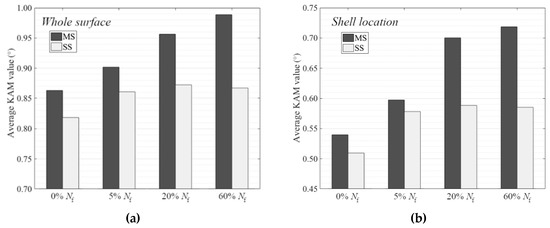
Figure 9.
Comparison of the KAM average values in both MS and SS specimen configurations on the whole surface and in the shell location, in (a,b), respectively. “Whole surface” is dealing with the analysis of the entire surface shown in Figure 8; “shell location” is corresponding to the data inside the white-squared zone outlined in Figure 8a,e.
4. Discussion
The present discussion will further analyze some remaining interrogations relative to the fatigue behavior of Ti-6Al-4V designed in a harmonic structure. Therefore, these questions will be addressed in the following Section 4.1, Section 4.2, Section 4.3 and Section 4.4.
4.1. Why the Inclusion Induced Initiation Mechanism Occurs Exclusively in the 106~107 Cycles Region?
In order to answer to this question, a refined analysis of the inclusion-induced fatigue fracture needs to be carried out, from fracture surface observations. Consequently, several critical aspects relating to these inclusions, such as its depth from the tensile surface dinc or its projected size on the fracture surface area1/2 have been listed in Table 4. In this table, the stress range at the inclusion site Δσat takes into consideration the bending stress gradient. According to the numerical values introduced in Table 4, one can undertake the calculation of the stress intensity factor induced by the inclusion ΔKinc, accepting the following Equation (1), proposed by Murakami and Endo [42].
Table 4.
Characteristics of inclusions generating fatigue crack initiation phenomenon (MM material, SS configuration).
The obtained results are displayed in Figure 10, where ΔKinc is represented in the y-axis, as a function of the number of cycles to failure, with Nf as the x-axis. One can see that the fatigue life tends to increase when the stress intensity factor range induced by the inclusion decreases. In accordance with the experimental results from [21,24], this diagram also indicates the values of the effective stress intensity factor range threshold ΔKeff,th = 2.9 MPam1/2 for long cracks in the MM material prone to the same stress ratio of R = 0.1. Obviously, the stress intensity factor range induced by inclusions ΔKinc takes place in the region lower than the threshold one for long cracks. Fatigue failure induced by small-size inclusion requires numerous stressing cycles to generate a propagating crack, as usually discussed in literature reports dealing with very high cycle fatigue regime [43,44]. In particular, experimental results similar to Figure 10 have been highlighted for high strength steels investigated in very high cycle regime [45,46]. Thus, due to the size of the involved inclusions, the related fatigue crack nucleation can reasonably occur only in the vicinity of the high cycle fatigue region limit (Nf ~ 107 cycles).
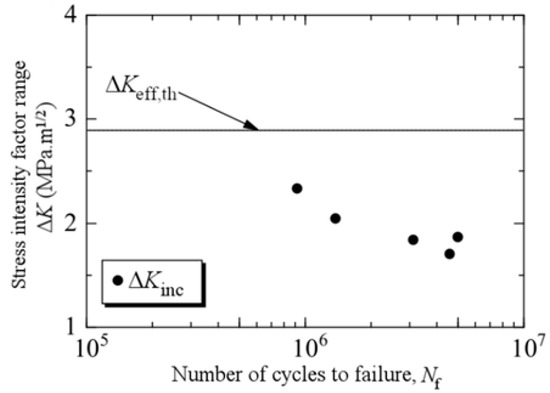
Figure 10.
Relationship between stress intensity factor ranges induced by inclusions ΔKinc and fatigue life, in comparison with effective threshold value for long cracks ΔKeff,th of MM material.
4.2. Why the MS Configuration did not Show Any Inclusion-Induced Fatigue Rupture?
Unlike the SS configuration, none of the MM material specimen fatigued in the MS one was prone to inclusion-induced crack nucleation. This observation is certainly induced by the difference of critical volume between the specimen size configurations investigated here.
Indeed, it is well known that defects in the microstructure of a metallic part have a higher probability to be found in large size specimens than in small size ones. According to Table 4, the inclusion-induced crack nucleation happened at a maximum depth of approximately 150 µm in the SS configuration. Considering the nominal specimen thickness of 3 mm, the local stress level at 150 μm depth corresponds to 90% of the maximum one. Therefore, let us consider a specimen critical volume with a threshold level of 90% of the maximum stress in the rest of the present report. Denoting the critical volume height of the SS configuration hSS = 150 μm, the reciprocal critical volume height for MS configuration becomes hMS = 50 μm. In regard to the inclusion projected size area1/2 ranging from 12.4 to 22.6 μm (see Table 4), it seems unlikely that such inclusions were formed in a 50 μm thick layer. Besides, one can note the limited number of MS specimens ruptured in the Nf = 106~107 cycles region, decreasing statistically the probability of the occurrence of inclusion-induced initiation in the present work. From these viewpoints, the absence of inclusion-induced fatigue crack initiations can be reasonably grasped.
4.3. Why the Fatigue Nucleation Site Tends to Move from a Surface-Induced to an Interior-Induced Pattern When Transitioning from the MS to SS Configuration?
According to the literature, the transition of the surface- to interior-induced fatigue crack initiation pattern in Ti-alloys depends on various parameters, such as the material microstructure [30] or the stress ratio [32,33,47]. In addition to these parameters, the type of fatigue loading has undoubtedly an influence on the fatigue crack initiation site, since bending loading induces a stress gradient with a maximum value at the tensile surface, whereas no-stress gradient axial loading should favor the interior-induced mechanism.
The transition from the MS to SS configuration goes hand in hand with a notable change of the stress gradient exerted on the specimen, leading to an increase of the critical volume’s height, as already discussed in Section 4.2. Thus, it is reasonable to observe more interior-induced nucleation occurrences in the SS configuration, regardless of the microstructure of the studied materials. Furthermore, the surface to interior transition is more distinct in the case of the MM material, since the critical volume’s height hSS becomes larger than the core diameter value. Therefore, the crack is way more likely to initiate from the “second row” of the core regions from the tensile surface, as schematically illustrated in Figure 11. This second row of cores offers a significantly larger number of potential fatigue crack initiation sites inside the specimen, resulting in the heavy interior-induced fatigue crack nucleation trend observed for the MM material in SS configuration.
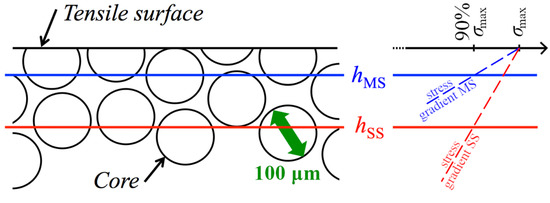
Figure 11.
Schematic 2D illustration of the harmonic structure prone to two different critical volume heights hMS and hSS, corresponding to the MS and SS configurations, respectively.
In addition to the stress gradient induced by the fatigue loading type, Adachi et al. [29] have proposed a mechanism taking into consideration the influence of compressive residual stress induced by the localized plastic deformation due to the tension-tension fatigue loading for Ti-alloys. Similar discussions have been evocated in [33,48] to discuss the transition from surface- to interior-induced crack initiation trend. Even though the authors cannot assure that this phenomenon is at stake here, it may contribute to the interior-induced initiation pattern observed in the present report.
4.4. Putting Aside the Inclusion-Induced Ruptures, Why MM Material did not Show Equivalent Fatigue Strength in MS and SS Configurations?
Since contamination of the powder during the mechanical milling process generates the inclusions found in the MM material, this feature is not intrinsically caused by the harmonic structure itself. However, even though fatigue failure data induced by inclusions is taken aside, Figure 12 underlines a fatigue strength in the MS configuration 100 MPa higher than the SS configuration’s one. As a consequence, the present work demonstrated an effect of the specimen size on the fatigue strength of the Ti-6Al-4V material designed in a harmonic structure.
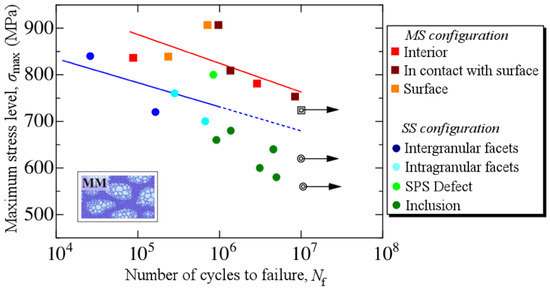
Figure 12.
Occurrences of the different fatigue crack initiation features for MM material in MS and SS configurations. The red line denotes the regression for the MS configuration, whereas the corresponding regression for the SS configuration in blue excludes fatigue data from inclusion-induced crack nucleation phenomenon.
Further investigations on the behavior of the MM material have been undertaken through KAM analysis from a series of EBSD data acquisitions, as introduced in Section 3.3.5. Both configurations underlined an increase of the KAM values in the shell network of the harmonic structure. Nevertheless, the increasing trend was notably more distinct in the MS configuration compared with the SS one. This significant increase of the average KAM value in the shell network in the MS configuration is interpreted as an intense accumulation of GNDs there, i.e., a hint of back-stress hardening.
Indeed, heterogenous structured materials in general are usually said to enhance the back-stress hardening in comparison with homogeneous counterparts. This feature of heterogeneous materials was noted a long time ago in a study by Ashby [49], which pointed out the essential role of GNDs to mitigate the voids and overlaps between neighboring grains having different mechanical properties. Such a trend has been experimentally reported lately for harmonic structured materials. Park et al. [50] compared the back-stress levels in homogeneous and harmonic structured SUS 304L stainless steel derived from the strain partitioning method. The heterogeneous harmonic material showed a significantly larger back-stress component than the homogeneous counterpart. From another viewpoint, several analyses based on the finite element method (FEM) have been conducted. Yu et al. [51] reported that most of the stress is distributed on the shell, whereas most of the strain is concentrated in the core of the harmonic structure. Similar conclusions have been drawn from another FEM analysis conducted by Wang et al. [52] simulating monotonic and cyclic shear loading, leading to the conclusion that “the shell regions form a thin but hard skeleton enveloping the multicrytalline soft core region.” Mompiou et al. [37] have performed TEM observations on harmonic β-titanium alloy, leading to the following behavior: (i) at low strain, the soft core tends to yield first, resulting in formation of slip bands there; (ii) these slip bands eventually extend up to the hard shell, which activate dislocation sources from GBs in highly constrained grains in the shell; (iii) such sources generate an accumulation of dislocations in the form of piles-up or tangles, inducing an increase of the GND density in the shell. It should be noted that similar dislocation nucleation in the hard phase of an heterogeneous Ti-6242Si alloy has been reported [53]. This mechanism hardens the shell network of the harmonic structure, allowing it to bear the majority of the external load in the process. Analogous behavior is reported more generally in the heterogeneous structure materials [9].
As pointed out in Section 3.3.5, experimental results from the average KAM values suggest that the size of the specimen impacts the ability of the MM material to generate GNDs in the shell. Which feature could reasonably suppress the GNDs accumulation in the SS configuration? According to the previous TEM observations [37], the interface between the hard and soft regions fundamentally contributes in the back-stress hardening of harmonic materials. Therefore, the present work proposes a simplified model for assessment of the active interface in both the MS and SS configurations. This model is based on the following assumptions:
- MM material consists of an “assembly” of u = 150 μm edge length cubic pattern, where the core takes place in a rc = 50 μm-radius spherical region at its center (i.e., the region outside the sphere corresponds to the shell region). It leads to a harmonic structured material having a core areal fraction of 35%, close to the actual value in the MM material investigated here, as written in Table 2.
- The active interface takes place only inside the critical volume region, i.e., for a depth lower than hMS and hSS for the MS and SS configurations, respectively. Since the bending stress is maximum in this region, core grains inside the critical volume are very likely to yield there, generating the GNDs accumulation at the core interface.
- A core region generates an active interface only if its center is inside the critical volume region. Indeed, it is reasonable to consider that a sufficient volume of the core region is needed to cause dislocation pile-ups and tangles at the interface between the core and shell regions. For the sake of simplicity, the authors propose that this sufficient core volume threshold is half of the total core region, resulting in this third assumption.
Based on these assumptions, a 2D illustration of the model is displayed in Figure 13, where the active interface is highlighted in purple color. Accordingly, the active interface length Li depends on the relative locations of the core region and the tensile surface. Therefore, let us consider that c is the distance between the tensile surface and the center of the core region. Furthermore, introduce α, β and β’ angles defined as sin α = c/rc, sin β = (hSS-c)/rc and sin β’ = (hMS-c)/rc, as shown in Figure 13a,b. As hSS is larger than the diameter of the core region, the active interface length is (Li)SS = rc(π + 2α) for 0 < c ≤ rc, (Li)SS = 2πrc for rc ≤ c ≤ 2rc and (Li)SS = rc(π + 2β) for 2rc ≤ c < 3rc. In the case of the MS configuration, (Li)MS = 2rc(α + β’) for 0 ≤ c ≤ rc. After noticing that critical volume heights hSS and hMS correspond to 3rc and rc values respectively, the collected interface length function traces are plotted in Figure 13c,d for the SS and MS configurations, respectively. Comparing the average values of the obtained functions and , and taking into consideration the critical volume discrepancy between the MS and SS configurations, the active length interface indexes, denoted (iL)MS and (iL)SS, are defined by Equations (2) and (3) for the MS and SS configurations, respectively.
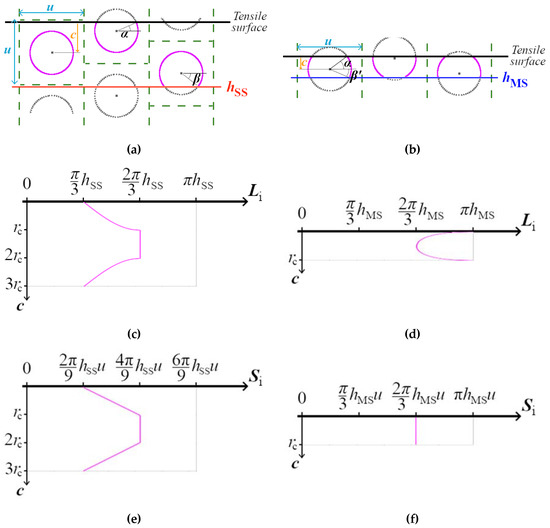
Figure 13.
Schematic illustration for active interface calculation based on the proposed model. The active interface between the shell and cores is highlighted in purple color for the SS and MS configurations in (a,b), respectively. Corresponding active interface length functions Li are represented in (c,d), whereas active interface surface functions Si are depicted in (e,f), for the SS and MS configurations, respectively.
Developing the Equations (2) and (3) results in the following numerical values: (iL)MS = 2 (π – 2) and (iL)SS = 2 (3π − 2)/9. Therefore, the active length interface index in MS configuration is nearly 40% higher than the one derived from SS configuration. One can also carry out a similar approach involving the spherical interface surface in a 3D viewpoint, in substitution to the length in the 2D one. The corresponding activated interface surface Si functions are represented in Figure 13e,f for the MS and SS configurations, respectively. In a way comparable to Equations (2) and (3), let us define the active surface interface indexes (iS)MS and (iS)SS by the ratios of the activated surface average values over the critical surfaces in both configurations involved, i.e., u × hMS and u × hSS for MS and SS, respectively. Numerical applications of these two surface indexes gives (iS)MS = 2π/3 and (iS)SS = 10π/27, which emphasize a value 80% larger for MS configuration. The index gaps reported from activated lengths and surfaces viewpoints are induced by two features: (i) the very narrow critical volume height hMS, which tends to maximize the active interface fraction for MS configuration, and (ii) the low fraction of the core region in the investigated MM material, which increases the distance between each core region and decreases the active interface index for the SS configuration.
Even though this model consists in a simplified overview of the interaction at the interface between the core and shell regions, it draws the main reasons for the lower ability of the shell region at the specimen surface to generate GNDs in the SS configuration, in agreement with the experimental results discussed in Section 3.3.5 outlining a low saturation level value of KAM in shell region. As reported for other heterogeneous structure materials [54,55], and in accordance with theoretical discussion by Ashby [49], insufficient GNDs accumulation leads to strain localization phenomenon. In the case of the harmonic structure, Park et al. [50] outlined that strain localization may take place inside grains of the core region, in line with the fatigue crack initiation site observed in Figure 6. Such strain localization phenomenon is very likely to generate early fatigue crack nucleation.
Lastly, as discussed in Section 4.3, the larger critical height in the SS configuration than the MS one results in a subsequent larger amount of core region locations in the critical volume. Since accumulation of GNDs is very limited in the SS configuration, each new core region inside the critical volume can be considered as a “weak point”, where the crack can potentially initiate, due to strain localization phenomenon. Therefore, the decreasing fatigue strength of the MM material in the SS configuration, highlighted by the S-N curves in Figure 12, is caused by the combination of two features: (i) the limited GNDs accumulation resulting in possible strain localization phenomenon inside the core regions, and (ii) the larger amount of core regions inside the critical volume, which highly increases the probability of an early fatigue crack nucleation.
5. Conclusions
In the present investigation, the four-point bending fatigue properties of Ti-6Al-4V alloy designed in a bimodal harmonic structure (MM material) have been investigated. Unlike the previous reports dealing with this issue, the present work investigates the fatigue properties using the standard specimen (SS) configuration to better grasp the reliability of macroscopic parts. Furthermore, fatigue properties of the miniature specimen (MS) size configuration were also carried out, for the sake of comparison with previous experimental results. Lastly, fatigue data from homogeneous coarse grain IP material were collected to assess the impact of the harmonic microstructure on the mechanical characteristics. The main findings of the present report are summarized below:
- Analysis of the microstructure of 50 mm diameter sintered compact made from powder prone to mechanical milling revealed a harmonic microstructure, without significant discrepancies throughout the entire compact.
- Fatigue test results obtained from the MS configuration underlined fatigue endurance at 107 cycles of 738 ± 15 MPa, distinctly higher than the IP one of 683 ± 14 MPa. This trend is similar to results found in our previous work. An opposite situation is reported for fatigue tests accepting the SS configuration, where fatigue endurances at 107 cycles are 570 ± 10 and 680 ± 20 MPa, for the MM and IP materials, respectively.
- Excepting the case of the MM material in the SS configuration, fatigue crack nucleation of both IP and MM materials revealed facets, presumably induced by the basal slip of α-Ti grains. More particularly, the crack nucleates at the core region of the MM material in the MS configuration. However, the MM material highlighted other initiation features in the SS configuration, since inclusion-induced nucleation from the shell is found exclusively in the Nf > 106 region. According to the chemical compositions of the involved inclusions, they are likely caused by powder contamination during the mechanical milling process.
- A simplified model has been proposed to assess the activity between the core and shell regions, which outlined a significantly larger active interface fraction in the MS configuration than the SS one. Such a trend is in line with the more distinct increase of GNDs accumulation in the shell in the MS configuration, according to KAM analysis. GNDs accumulation mechanism mitigated, heterogeneous structure materials cannot keep their cohesion, leading to the generation of a local zone prone to considerable strain concentration, usually referred to as strain localization phenomenon.
- The fatigue strength loss observed in the MM material for the SS configuration, in comparison with the MS one, should be induced by two main reasons: mitigated GNDs accumulation resulting in strain localization in core regions; coupled to a larger critical volume increasing notably the number of cores vulnerable to generate early fatigue crack nucleation.
Even though further analyses should be undertaken to refine our comprehension on the effect of the specimen size on the fatigue properties of harmonic structure materials, experimental results of the present work urge us to consider possible effects of the specimen size on various mechanical properties of such heterogeneous structure materials. In accordance with the simplified model, fatigue performance from harmonic structure materials with a large shell areal fraction should be altered, if the smallest dimension of the critical volume is out of the same order as the core/shell unit size. On the contrary, the fatigue strength of harmonic structure materials possessing a low shell areal fraction should hardly be affected, due to the limited influence of the critical volume size on the active interface between the core and shell regions. Lastly, it should be noted that future investigations on harmonic structured materials should pay additional attention on the material fabrication processing in order to keep such compounds as clean as possible. Refined examinations dealing with the fatigue behavior on such advanced tailored materials are at this cost.
Author Contributions
Conceptualization, K.A. and A.U.; methodology, B.G., S.K. and A.U.; software, B.G.; validation, B.G. and A.U.; formal analysis, B.G.; investigation, T.I., B.G., S.K. and A.U.; resources, K.A. and M.O.K.; data curation, B.G.; writing—original draft preparation, B.G.; writing—review and editing, S.K., A.U. and K.A.; visualization, B.G.; supervision, A.U., S.K. and B.G.; project administration, A.U., S.K. and B.G.; funding acquisition, K.A. All authors have read and agreed to the published version of the manuscript.
Funding
This work was supported by the French national research agency in the framework of ANR 14-CE07-0003 “HighS-Ti” program. This study is carried out with the aid of JSPS Grant-in-Aid for Scientific Research JP18H05256 and JP19H02024, along with The Light Metal Educational Foundation, Inc.
Acknowledgments
Authors would like to thank Takuya Nobori and Hirotaka Kuwahara (Graduate school of Mechanical Science and Engineering, Ritsumeikan University) for their kind helps in mechanical testing operations. A warm thank is dedicated to Guy Dirras (Université Paris 13, France) for our communications on various subjects dealing with this manuscript.
Conflicts of Interest
The authors declare no conflict of interest.
References
- Hall, E.O. The deformation and ageing of mild steel: III Discussion of results. Proc. Phys. Soc. B 1951, 64, 747–752. [Google Scholar] [CrossRef]
- Petch, N.J. The cleavage strength of polycrystals. J. Iron Steel Inst. 1953, 174, 25–28. [Google Scholar]
- Tsuji, N.; Ito, Y.; Saito, Y.; Minamino, Y. Strength and ductility of ultrafine grained aluminum and iron produced by ARB and annealing. Scr. Mater. 2002, 47, 893. [Google Scholar] [CrossRef]
- Ma, E. Instabilities and ductility of nanocrystalline and ultrafine-grained metals. Scr. Mater. 2003, 49, 663–668. [Google Scholar] [CrossRef]
- Morita, T.; Hatsuoka, K.; Iizuka, T.; Kawasaki, K. Straightening of Ti-6Al-4V by short-time duplex heat treatment. Mater. Trans. 2005, 46, 1681–1686. [Google Scholar] [CrossRef]
- Szabo, P.J.; Field, D.P.; Joni, B.; Horky, J.; Ungar, T. Bimodal grain size distribution enhances strength and ductility simultaneously in a low-carbon low alloy steel. Metall. Mater. Trans. A 2015, 46, 1948–1957. [Google Scholar] [CrossRef]
- Terada, D.; Inoue, M.; Kitahara, H.; Tsuji, N. Change in mechanical and microstructure of ARB processed Ti during annealing. Mater. Trans. 2008, 49, 41–46. [Google Scholar] [CrossRef]
- Wang, Y.; Chen, M.; Zhou, F.; Ma, E. High tensile ductility in a nanostructured metal. Nature 2002, 419, 912–915. [Google Scholar] [CrossRef]
- Ma, E.; Zhu, T. Towards strength-ductility synergy through the design of heterogeneous nanostructures in metals. Mater. Today 2017, 20, 323–331. [Google Scholar] [CrossRef]
- Fang, T.H.; Li, W.L.; Tao, N.R.; Lu, K. Revealing extraordinary intrinsic tensile plasticity in gradient nano-grained copper. Science 2011, 331, 1587–1590. [Google Scholar] [CrossRef]
- Wu, X.; Yang, M.; Yuan, F.; Wu, G.; Wei, Y.; Huang, X.; Zhu, Y. Heterogeneous lamella structure unites ultrafine-grain strength with coarse-grain ductility. Proc. Natl. Acad. Sci. USA 2015, 112, 14501–14505. [Google Scholar] [CrossRef] [PubMed]
- Wu, X.; Jiang, P.; Chen, L.; Yuan, F.; Zhu, Y. Extraordinary strain hardening by gradient structure. Proc. Natl. Acad. Sci. USA 2014, 111, 7197–7201. [Google Scholar] [CrossRef] [PubMed]
- Bagherifiard, S.; Astaraee, A.H.; Locati, M.; Nawaz, A.; Monti, S.; Kodas, J.; Singh, R.; Guagliano, M. Design and analysis of additive manufactures bimodal structures obtained by cold spray deposition. Addit. Manuf. 2020, 33, 101131. [Google Scholar]
- Sekiguchi, T.; Ono, K.; Fujiwara, H.; Ameyama, K. New microstructure design for commercially pure titanium with outstanding mechanical properties by mechanical milling and hot roll sintering. Mater. Trans. 2010, 51, 39–45. [Google Scholar] [CrossRef]
- Fujiwara, H.; Sekiguchi, T.; Ameyama, K. Mechanical properties of pure titanium and Ti-6Al-4V alloys with a new tailored nano/meso hybrid microstructure. Int. J. Mater. Res. 2009, 100, 796. [Google Scholar] [CrossRef]
- Kikuchi, S.; Nakamura, Y.; Ueno, A.; Ameyama, K. Low temperature nitring of commercially pure titanium with harmonic structure. Mater. Trans. 2015, 56, 1807–1813. [Google Scholar] [CrossRef]
- Vajpai, S.K.; Ota, M.; Watanabe, T.; Maeda, R.; Sekiguchi, T.; Kusaka, T.; Ameyama, K. The development of high performance Ti-6Al-4V alloy via a unique microstructural design with bimodal grain size distribution. Mater. Metall. Mater. Trans. A 2015, 46, 903–914. [Google Scholar] [CrossRef]
- Ota, M.; Vajpai, S.K.; Imao, R.; Kurokawa, K.; Ameyama, K. Application of high pressure gas jet mill process to fabricate high performance harmonic structure designed pure titanium. Mater. Trans. 2015, 56, 154–159. [Google Scholar] [CrossRef]
- Vajpai, S.K.; Ota, M.; Zhang, Z.; Ameyama, K. Three-dimensionally gradient harmonic structure design: An integrated approach for high performance structural materials. Mater. Res. Lett. 2016, 4, 191–197. [Google Scholar] [CrossRef]
- Kikuchi, S.; Hayami, Y.; Ishiguri, T.; Guennec, B.; Ueno, A.; Ota, M.; Ameyama, K. Effect of bimodal grain size distribution on fatigue properties of Ti-6Al-4V alloy with harmonic structure under four-point bending. Mater. Sci. Eng. A 2017, 687, 269–275. [Google Scholar] [CrossRef]
- Kikuchi, S.; Imai, T.; Kubozono, H.; Nakai, Y.; Ota, M.; Ueno, A.; Ameyama, K. Effect of harmonic structure design with bimodal grain size distribution on near-threshold fatigue crack propagation in Ti-6Al-4V alloy. Int. J. Fatigue 2016, 92, 616–622. [Google Scholar] [CrossRef]
- Zhang, Z.; Ma, H.; Zheng, R.; Hu, Q.; Nakatani, M.; Ota, M.; Chen, G.; Chen, X.; Ma, C.; Ameyama, K. Fatigue behavior of a harmonic structure designed austenitic stainless steel under uniaxial stress loading. Mater. Sci. Eng. A 2017, 707, 287–294. [Google Scholar] [CrossRef]
- Kikuchi, S.; Mori, T.; Kubozono, H.; Nakai, Y.; Kawabata, M.; Ameyama, K. Evaluation of near-threshold fatigue crack propagation in harmonic-structured CP Titanium with a bimodal grain size distribution. Eng. Fract. Mech. 2017, 181, 77–86. [Google Scholar] [CrossRef]
- Kikuchi, S.; Imai, T.; Kubozono, H.; Nakai, Y.; Ueno, A.; Ameyama, K. Evaluation of near-threshold fatigue crack propagation in Ti-6Al-4V alloy with harmonic structure created by mechanical milling and spark plasma sintering. Frat. Ed Integr. Strutt. 2015, 34, 261–270. [Google Scholar] [CrossRef]
- Kikuchi, S.; Nakatsuka, Y.; Nakai, Y.; Nakatani, M.; Kawabata, M.; Ameyama, K. Evaluation of fatigue properties under four-point bending and fatigue crack propagation in austenitic stainless steel with a bimodal harmonic structure. Frat. Ed Integr. Strutt. 2019, 48, 545–553. [Google Scholar] [CrossRef]
- Kikuchi, S.; Nukui, Y.; Nakatsuka, Y.; Nakai, Y.; Nakatani, M.; Kawabata, M.; Ameyama, K. Effect of bimodal harmonic structure on fatigue properties of austenitic stainless steel under axial loading. Int. J. Fatigue 2019, 127, 222–228. [Google Scholar] [CrossRef]
- Osaki, K.; Kikuchi, S.; Nakai, Y.; Kawabata, M.; Ameyama, K. The effects of thermo-mechanical processing on fatigue crack propagation in commercially pure titanium with a harmonic structure. Mater. Sci. Eng. A 2020, 773, 13892. [Google Scholar] [CrossRef]
- JSMS Committee on Fatigue of Materials; JSMS Committee on Reliability Engineering. Standard Evaluation Method of Fatigue Reliability for Metallic Materials—Standard Regression Method of S-N Curves. JSMS-SD-11-08. J. Soc. Mater. Sci. Jpn. 2005. [Google Scholar] [CrossRef]
- Adachi, S.; Wagner, L.; Lutjering, G. Influence of microstructure and mean stress on fatigue strength of Ti-6Al4V. In Proceedings of the Fifth International Conference on Titanium, Munich, Germany, 10–14 September 1984; pp. 2139–2146. [Google Scholar]
- Zuo, J.H.; Wang, Z.G.; Han, E.H. Effect of microstructure on ultra-high cycle fatigue behavior of Ti-6Al-4V. Mater. Sci. Eng. A 2008, 473, 147–152. [Google Scholar] [CrossRef]
- Golden, P.J.; John, R.; Porter, W.J., III. Variability in room temperature fatigue life of alpha + beta processed Ti-6Al-4V. Int. J. Fatigue 2009, 31, 1764–1770. [Google Scholar] [CrossRef]
- Liu, X.; Sun, C.; Hong, Y. Effects of stress ratio on high-cycle and very-high-cycle fatigue behavior of a Ti-6Al-4V. Mater. Sci. Eng. A 2015, 622, 228–235. [Google Scholar] [CrossRef]
- Tokaji, K.; Kariya, H. Mean stress dependence of fatigue strength and subsurface crack initiation in Ti-15Mo5Zr-3Al. Mater. Sci. Eng. A 2000, 281, 268–274. [Google Scholar] [CrossRef]
- Kikuchi, S.; Kubozono, H.; Nukui, Y.; Nakai, Y.; Ueno, A.; Kawabata, M.; Ameyama, K. Statistical fatigue properties and small fatigue crack propagation in bimodal harmonic structured Ti-6Al-4V alloy under four point bending. Mater. Sci. Eng. A 2018, 711, 29–36. [Google Scholar] [CrossRef]
- Nukui, Y.; Kubozono, H.; Kikuchi, S.; Nakai, Y.; Ueno, A.; Kawabata, M.; Ameyama, K. Fractographic analysis of fatigue crack initiation and propagation in CP titanium with a bimodal harmonic structure. Mater. Sci. Eng. A 2018, 716, 228–234. [Google Scholar] [CrossRef]
- Dirras, G.; Ueda, D.; Hocini, A.; Tingaud, D.; Ameyama, K. Cyclic shear behavior of conventional and harmonic structure-designed Ti-25Nb-25Zr β-titanium alloy: Back-stress hardening and twinning inhibition. Scr. Mater. 2017, 138, 44–47. [Google Scholar] [CrossRef]
- Mompiou, F.; Tingaud, D.; Chang, Y.; Gault, B.; Dirras, G. Conventional vs Harmonic-structured β-Ti-25Nb-25Zr alloys: A comparative study of deformation mechanisms. Acta Mater. 2018, 161, 420–430. [Google Scholar] [CrossRef]
- Calcagnotto, M.; Ponge, D.; Demir, E.; Raabe, D. Orientation gradients and geometrically necessary dislocations in ultrafine grained dual-phase steels studied by 2D and 3D EBSD. Mater. Sci. Eng. A 2010, 527, 2738–2746. [Google Scholar] [CrossRef]
- Allain-Bonasso, N.; Wagner, F.; Berbenni, S.; Field, D.P. A study of the heterogeneity of plastic deformation in IF steel by EBSD. Mater. Sci. Eng. A 2010, 548, 56–63. [Google Scholar] [CrossRef]
- He, W.; Ma, W.; Pantleon, W. Microstructure of individual grains in cold-rolled aluminum from orientation inhomogeneities resolved by electron backscattering diffraction. Mater. Sci. Eng. A 2008, 494, 21–27. [Google Scholar] [CrossRef]
- Britton, T.B.; Birosca, S.; Preuss, M.; Wilkinson, A.J. Electron backscatter diffraction study of dislocation content of a macrozone in hot-rolled Ti-6Al-4V alloy. Scr. Mater. 2010, 62, 639. [Google Scholar] [CrossRef]
- Murakami, Y.; Endo, M. Effects of defects, inclusions and inhomogeneities on fatigue strength. Int. J. Fatigue 1994, 16, 163–182. [Google Scholar] [CrossRef]
- Chapetti, M.D.; Tagawa, T.; Miyata, T. Ultra-long cycle fatigue of high-strength carbon steels part I: Review and analysis of the mechanism of failure. Mater. Sci. Eng. A 2003, 356, 227–235. [Google Scholar] [CrossRef]
- Sakai, T.; Nakagawa, A.; Oguma, N.; Nakamura, Y.; Ueno, A.; Kikuchi, S.; Sakaida, A. A review on fatigue fracture modes of structural metallic materials in very high cycle regime. Int. J. Fatigue 2016, 93, 339–351. [Google Scholar] [CrossRef]
- Sakai, T.; Takeda, M.; Tanaka, N.; Kanemitsu, M.; Oguma, N.; Shiozawa, K. S-N property and fractography of high carbon chromium bearing steel over ultra wide life region under rotating bending. Trans. Jpn. Soc. Mech. Eng. Ser. A 2001, 67, 1805–1812. (In Japanese) [Google Scholar] [CrossRef]
- Shiozawa, K.; Morii, Y.; Nishino, S.; Lu, L. Subsurface crack initiation and propagation mechanism in high-strength steel in a very high cycle fatigue regime. Int. J. Fatigue 2006, 28, 1521–1532. [Google Scholar] [CrossRef]
- Shiozawa, K.; Kuroda, Y.; Nishino, S. Effect of the stress ratio on subsurface fatigue crack initiation behavior of beta-type titanium alloy. Trans. Jpn. Soc. Mech. Eng. A 1998, 64, 2528–2535. (In Japanese) [Google Scholar] [CrossRef][Green Version]
- Li, S.; Xiong, B.; Hui, S.; Ye, W.; Yu, Y. Comparison of the fatigue and fracture of Ti-6Al-2Zr-1Mo-1V with lamellar and bimodal microstructures. Mater. Sci. Eng. A 2007, 460, 140–145. [Google Scholar] [CrossRef]
- Ashby, M.F. The deformation of plastically non-homogeneous materials. Philos. Mag. Ser. 1970, 21, 399–424. [Google Scholar] [CrossRef]
- Park, H.K.; Ameyama, K.; Yoo, J.; Hwang, H.; Kim, H.S. Additional hardening in harmonic structured materials by strain partitioning and back stress. Mater. Res. Lett. 2018, 6, 261–267. [Google Scholar] [CrossRef]
- Yu, H.; Watanabe, I.; Ameyama, K. Deformation behavior analysis of harmonic structure materials by multi-scale finite element analysis. Adv. Mater. Res. 2015, 108, 853–857. [Google Scholar] [CrossRef]
- Wang, X.; Cazes, F.; Li, J.; Hocini, A.; Ameyama, K.; Dirras, G. A 3D crystal plasticity model of monotonic and cyclic simple shear deformation for commercial-purity Ti with a harmonic structure. Mech. Mater. 2019, 128, 117–128. [Google Scholar] [CrossRef]
- Joseph, S.; Bantounas, I.; Lindley, T.C.; Dye, D. Slip transfer and deformation structures resulting from the low cycle fatigue of near-alpha titanium alloy Ti-6242Si. Int. J. Plast. 2018, 100, 90–103. [Google Scholar] [CrossRef]
- Zhang, Y.; Topping, T.D.; Yang, H.; Lavernia, E.J.; Schoenung, J.M.; Nutt, S.R. Micro-strain evolution and toughening mechanisms in a trimodal Al-based metal matrix composite. Metall. Mater. Trans. A 2015, 46, 1196–1204. [Google Scholar] [CrossRef]
- Zan, Y.N.; Zhou, Y.T.; Liu, Z.Y.; Ma, G.N.; Wang, D.; Wang, Q.Z.; Wang, W.G.; Xiao, B.L.; Ma, Z.Y. Enhancing strength and ductility synergy through heterogeneous structure design in nanoscale Al2O3 particulate reinforced Al composites. Mater. Des. 2019, 166, 10762–10769. [Google Scholar] [CrossRef]
© 2020 by the authors. Licensee MDPI, Basel, Switzerland. This article is an open access article distributed under the terms and conditions of the Creative Commons Attribution (CC BY) license (http://creativecommons.org/licenses/by/4.0/).