Abstract
This paper presents a new model that relates thermal aspects with process kinematics in face grinding applications with straight wheels. Changes in chip thickness along the contact area were considered in the model, which allows for taking into account local thermal effects. The model was validated through grinding tests conducted with conventional alumina wheels. Power signals were used as input for the model. Thermal damage on the ground surface was detected using eddy current technology and revealed by acid etching. Both the model and experimental findings provide the basis for developing an approach for process optimization.
1. Introduction
Face grinding is a critical process in manufacturing, and is employed in the production of several types of workpieces for the automotive, aerospace, and energy generation sectors. Motor and transmission shafts of hardened steel are typical workpieces for which this operation is used. Depending on the workpiece geometry, face heights can vary from less than 1 mm to more than 200 mm. In addition, CBN (cubic boron nitride), diamond or conventional abrasive wheels can be used for face grinding. Some applications require the grinding of three distinct areas at the same time, i.e., diameter and corner radius, as well as the face. Some workpieces have a relief rather than a corner radius and only require the grinding of the face [1,2].
Two main techniques are currently used to carry out this operation: grinding with angular wheels, and grinding with straight wheels (Figure 1).
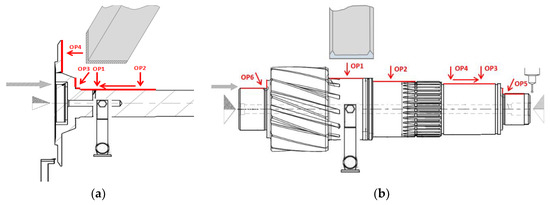
Figure 1.
Face grinding with (a) an angular wheel and (b) a straight wheel.
Face grinding with straight wheels enables grinding of opposite workpiece faces using a single fixture, thereby increasing the flexibility of the process. However, the use of this technique could lead to grinding burn and uneven wear on the wheel profile, as demonstrated in [3,4], where crankpin grinding with straight CBN wheels was thoroughly investigated. A classification and description of the different feed variants or strategies (radial or angle plunge, single-step axial and multi-step axial feed) is presented in [5], which summarizes the basic kinematics and flexibility offered by each strategy. Radial plunge is tested by Walsh in [1] and Oliveira in [3], consisting of grinding the total of the axial infeed starting from the outer diameter of the workpiece to the inner. Axial strategies on the other hand, grind the entire surface of the workpiece at once trough axial infeed. The single-step axial plunge would take the entire face height leading to a much higher contact area. On the other hand, the multi-step strategy consists of achieving the same overall productivity as in the single-step strategy dividing the face height in separate axial plunges. In this manner, the axial infeed speed needed in a three step multi-step strategy would be three times higher.
In [3], Oliveira conducted the most accurate analysis to date of the removal mechanism of this process, describing the various contact and removal areas in the face for the three different strategies. Oliveira describes the local high material removal rate conditions in the corner radius and compares radial and axial approaches using a single to multi-step strategy. Based on a given wheel G-ratio, macro geometrical wheel profile wear was simulated for the different strategies. Finally, the different strategies were compared experimentally. When setting thermal damage and grinding wheel wear as the main limiting factors, multi-step face grinding was found to be the most productive mechanism of all.
In [4], Drazumerik focused on optimizing the process through a combination of axial and radial feeds by establishing a maximum temperature limit for each of the three studied grinding zones (the diameter, the radius, and the face). For this purpose, a temperature simulation model was developed based on the estimation of an aggressiveness-driven specific energy.
Based on the findings of these previous studies, this paper delves deeper into the characterization of the removal mechanism, using a more precise temperature simulation model. A thorough kinematic analysis has been made in which an analytical point of view based on the geometrical analysis in [6] has been used. Linking the kinematics to a specific energy expression based on the aggressiveness concept developed by Badger in [7], and in [8] a thermal model for face grinding with straight wheels has been developed. This allows for further analysis and a better understanding of the influence of contact geometry and process kinematics on thermal behavior and grinding wheel wear.
2. Thermo-Kinematic Model
A point on the workpiece surface will meet the wheel on two occasions per revolution and thus, the removal of the material is divided into two main areas, shaded in red and identified in Figure 2 as (lc1) and (lc2). The total feed per revolution is divided into these two areas as the feed per revolution at each point (ae) is a function of the turned angle (γ) (Equation (2)). Moreover, the (γ1) and (γ2) ratio will be different as the workpiece radius changes from (rw1) to (rw2). To get a better idea of this concept attention has to be put in the extremes. In (rw2), (γ1) and (γ2) have the size equal to the one shown in Figure 2 but their sizes change progressively as we reach (rw1). At this point (γ2) is zero while (γ1) is equal to the whole turn angle (360°). Most of the removal occurs in the half of the contact arc (lc1) where the feed per revolution is (ae1). In this area the removal is made by a section of the wheel radius (b1) proportional to the corresponding feed per revolution at each point. The rest of the removal occurs in the half-length of the contact arc (lc2) where the feed per revolution is smaller (ae2). In this area the removal is carried out by a section of the chamfer of the grinding wheel (b2) proportional to the corresponding feed. Finally, in the area of the flat face (h) the wheel and the workpiece will be in contact but the depth of cut is negligible, and therefore practically no removal occurs although friction and wheel clogging could appear in this area, as pointed out in [3].
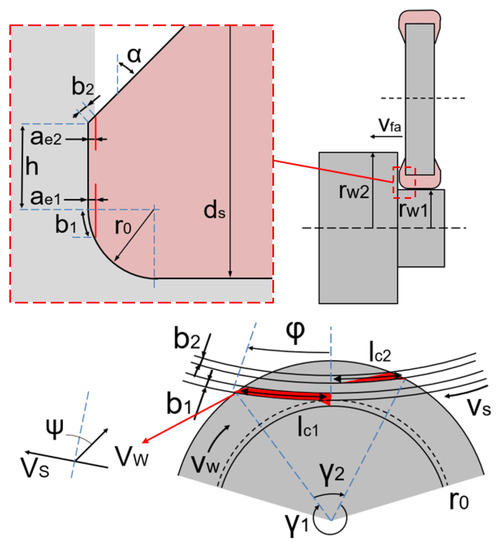
Figure 2.
Geometrical configuration and main dimensions of face grinding with straight wheels.
The developed model considers the contact width (b) at each point of these areas, allowing to simulate and analyse the influence of wheel and workpiece geometry-as well as the process kinematics-on the removal rate distribution.
Figure 3 shows the contact width (b) over the whole workpiece contact length (lc) providing an overall view of the contact area in five different grinding situations. The simulated grinding parameters are specified in Table 1. The right-hand side of the graph represents (lc2) where the contact area is located in the chamfer of the wheel and the left-hand side represents (lc1) and thus, the corner radius. The contact area difference in (lc2) between S2 and S3 in Figure 3 reveals the influence of the chamfer angle (α) as the contact area is widened. An increase in corner radius will have a similar effect on the contact width.
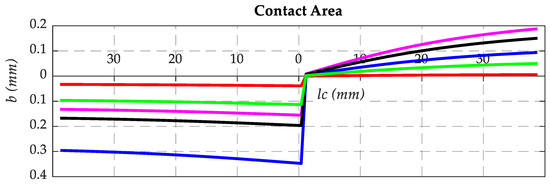
Figure 3.
Contact width (b) over workpiece contact length (lc).

Table 1.
Simulated grinding conditions.
Once the contact area has been defined, it is evident that abrasive grits in the wheel profile will have different contact lengths. For instance, an abrasive grit located in (lc2) at (b2 = 0.15 mm) will have a contact length of approximately 15 mm while in the corner of the chamfer (b2 = 0 mm) the contact will be almost 40 mm. Figure 4a represents the removal rate in the wheel profile (Q’s), which is the amount of material removed per unit length of the profile of the wheel. This wheel removal rate is closely linked to the contact area shown in Figure 3, as the material removed at each point of the workpiece surface, that is, the workpiece removal rate (Q’w), is divided into the contact width (b) and then integrated throughout the contact length corresponding to each point of the wheel profile (Equation (7)). The right-hand side of Figure 4a represents the wheel removal rate in the wheel chamfer while the left-hand side represents the corner radius.
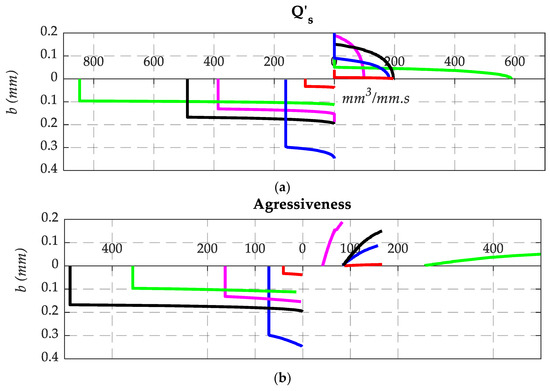
Figure 4.
(a) Material removal rate in the wheel profile (Q’s), (b) aggressiveness in the wheel profile.
Equation (8) is a modified expression for the aggressiveness concept proposed in [7] as an equivalent of the maximum chip thickness. This expression can be used to calculate an aggressiveness value for each point of the wheel profile, as shown in Figure 4.
The purpose of calculating the aggressiveness distribution in the wheel profile is two-fold. First, it allows for evaluating the wheel’s macro geometric wear considering material removal and a given G-ratio, as in [3]. Second, it allows for assessing the influence of the kinematic conditions, as previously demonstrated in other works [7]. In the approach presented in the present model both the removal rate and the contact length affecting the aggressiveness are calculated from the perspective of the wheel. This approach is considered to correctly represent the aggressiveness concept.
On the other hand, as in [4], the aim here is to develop an expression for estimating the specific energy based on Equation (9). Experimental adjustment of this expression will serve as an input for estimating the total power and heat generated in future processes.
Finally, in order to calculate the maximum surface temperature in the workpiece, the moving-heat-source model in [9,10] is adapted to face grinding using the presented parameters as input.
In each point of the contact area, the width of the contact area (b) is considered to be the length of the heat source and the heat generated in the surface of the workpiece by the grinding action will be proportional to the workpiece removal rate (Q’w). Figure 5 shows the removal rate distribution in the contact length in the grinding situations mentioned in Table 1.
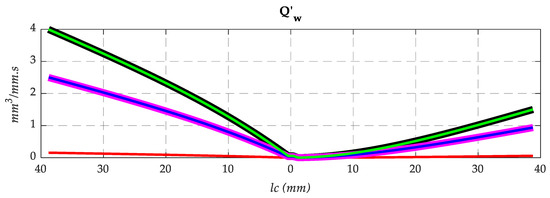
Figure 5.
Material removal rate in the workpiece contact length (Q’w).
The surface temperature distribution simulation in the different grinding situations over the contact length is shown in Figure 6. Finally, the energy partition (ε) was calculated, implementing the theory and partition functions developed in [11] where local and global scale thermal effects are considered. The developed model is also capable of simulating the temperature distribution in the workpiece diameter and corner radius, as in [4]. As predicted, there is a local maximum temperature in the radius, but the full simulation shows that maximum temperature with axial approximation is always reached in the outermost diameter of the face.
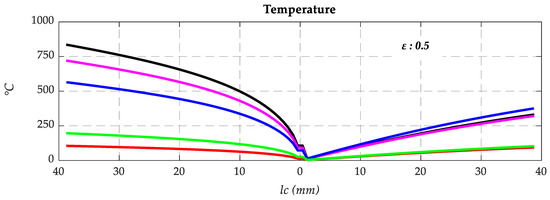
Figure 6.
Temperature distribution over the contact length.
3. Experimental Analysis and Model Validation
3.1. Experiemntal Setup
Experimental tests were conducted using the setup displayed in Figure 7, which clearly shows the used wheel, the workpiece, and the eddy current detector. The description of the system along with the technical details used can be found in Table 2. These experiments employed alumina wheels and relatively high workpiece faces (22 mm). For the experimental procedure, three phases of trials have been designed in which different grinding procedures have been used in order to achieve different objectives.
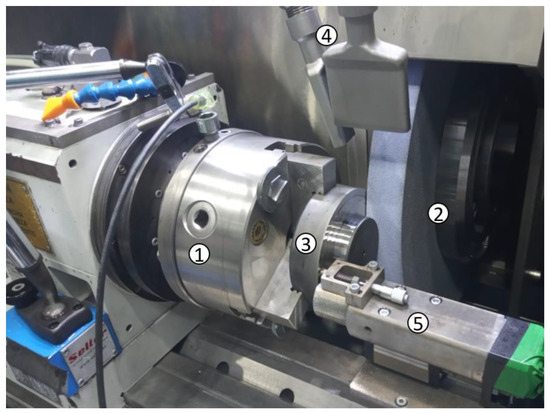
Figure 7.
Machine and in-process eddy current inspection set-up.
Table 2.
System components and process conditions for experimental analysis and model validation.
In the first phase of the experiments a broad aggressiveness condition range was tested in which several combinations of the main kinematic parameters have been used. The main goal was to acquire general knowledge on the energetic behavior of this particular strategy. The composition of the wheel, the cooling conditions and the dressing conditions are not being changed throughout all the experimental phases of this work. The technical details of this setup are described in Table 2.
The second phase of the experimental study specific aggressiveness conditions has been selected to validate the thermal results of the model. The result of the model being a temperature distribution over the face of the workpiece. The experimental procedure is to make successive grinding passes to study the progressive behavior of the selected conditions that will eventually lead to thermal damage. To control the level of thermal damage in the workpiece in-process eddy current inspections will be made. In addition, the results of the eddy current inspections will be contrasted with post-process acid etching inspections. The obtained results of the model will be compared to the experimental results of the surface inspections.
The third phase of the experiments consists of different combinations of grinding conditions to which progressive grinding tests have been applied until thermal damage has been detected trough eddy current inspection. The objective is to analyse the influence of the aggressiveness over the temperature of the ground surface at the point of thermal damage appearance.
3.2. Specific Energy Tests
The first phase of the trials was focused on validating the proposed model of energetic behavior. The objective was to test the aggressiveness driven specific energy expression adjustment proposed in Equation (9). For this purpose, a wide range of grinding conditions were selected to generate 48 different aggressiveness situations that range from an aggressiveness value of 30 up to 345. The values of the combined grinding wheel speeds (vs), infeed speeds (Q’w) and workpiece speed (qs) are detailed in Figure 8. A single axial plunge of 0.2 mm total infeed will be implemented in each condition and the consumed power will be monitored in order to estimate the overall specific energy.
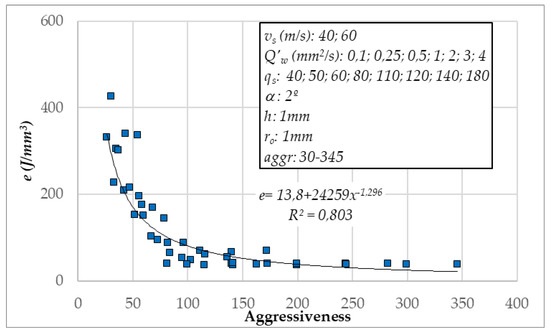
Figure 8.
Specific energy vs. aggressiveness in different grinding conditions and the adjusting equation to Equation (9).
The expression of the specific energy is provided in Figure 8 to validate the theoretical proposal that aggressiveness influences energetic behaviour.
3.3. Thermal Model Validation
In this second phase of the experimental work, successive axial grinding passes were made until the generation of thermal damage was detected by the eddy current. Thermal damage on the ground surface was controlled by in-process eddy current technology and revealed by inspecting the acid etching following each test. Table 3 presents the grinding conditions used in the test.
Table 3.
Grinding conditions of the progressive grinding tests.
Figure 9a shows the power consumption during the grinding process in which in-process eddy current signal was measured. Figure 9b shows the development of the eddy current signal during the grinding process. A signal gap exceeding 1 in the eddy current inspection is taken to indicate thermal damage. Figure 9 shows the four different situations that were detected. The first pass produced no thermal damage. On the second pass thermal damage was produced during the grinding but the signal dropped in the last instant. Acid etching inspection confirmed that the workpiece had suffered no thermal damage. At the end of the third pass, thermal damage was detected and the acid etching inspection in Figure 9c reveals a 5 mm wide shaded area in the outer diameter. This provides preliminary validation of the proposed model, which suggests that the outer diameter (rw2) is the area of the workpiece where thermal damage is most likely to appear. Further, a fourth grinding pass was made to confirm this behavior indicated by the shaded area, and in this case the eddy current detector indicated a higher level of thermal damage. Eddy current technology has been confirmed as a promising tool for detecting in-process thermal damage due the fact that its measurements have shown a good correlation with the results of acid etching inspections in over 100 tests.

Figure 9.
(a) Experimental power measurement in the four grinding passes; (b) in-process eddy current signal measurement; (c) acid etching post-process inspection; (d) surface temperature simulation in the face (ε = 0.5).
Moreover, the acid etching inspections have proved to be an excellent way of uncovering the removal kinematics that occur in face grinding with straight wheels. As can be seen in Figure 9c, the shape, orientation and dimension of the thermal damage strips correlate with the temperature distribution of the simulations along the contact arc (lc). The dimension of the damaged strips extended from the outside to the inner diameter in consecutive passes as the power increased, which was exactly as the model predicted.
Figure 9d shows the simulation values of maximum surface temperature along the contact arc (lc) using the final measured power of Figure 9a as input. The outer point of the workpiece in the second pass shows the same temperature (655 °C) as a point at 29 mm (lc1) (5 mm from the external radius) in the third pass and a point at 18 mm (lc1) (11 mm from the external radius) in the fourth pass. Temperature simulations of the last non damaged radial point at each pass show correlation.
3.4. Influence of Process Kinematics
Further progressive grinding tests were conducted in which consecutive 0.1 mm grinding axial plunges are made to the same workpiece until the detection of grinding burn. The same test procedure was followed in order to analyse the influence of process kinematics on wheel wear and thermal behavior. To this end, 16 grinding conditions were tested. Table 4 shows the grinding conditions along with the results obtained. In this case, in-process inspection of eddy current thermal damage was used as the limiting factor to end the test. The number of grinding passes that could be applied in each test until the appearance of thermal damage is indicated by (n). Power measurement at this point was used to simulate the temperature in the outer diameter of the workpiece. The initial and final specific energy of each test is also displayed in Table 4 (ei/ef). In these tests a wheel speed of (vs = 60 m/s) was used whilst the wheel profile dimensions were a face height (h) of 1 mm, with a 2° angle and a 1 mm corner radius.
Table 4.
Results from the tests to evaluate the influence of grinding conditions.
Figure 10 shows that the simulated temperature, which experimentally generates thermal damage is in the range of 560–780 °C whilst in general a higher temperature is required to damage the workpiece at higher values of aggressiveness. This result is what might be expected for a given set of removal rate conditions, where greater aggressiveness means a higher rotation speed of the workpiece and thus, less contact time, which reduces the risk of damage [10,12].
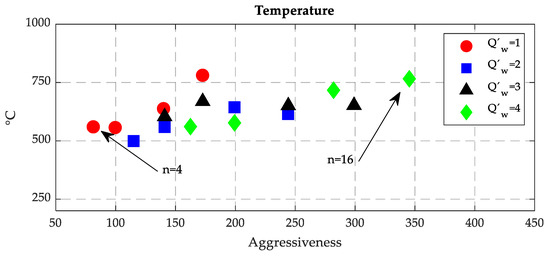
Figure 10.
Simulated temperatures in the moment of thermal damage appearance based on the power measurement.
It is important to note that it was also possible to observe a higher number of passes without generating thermal damage in the higher removal rate and aggressiveness condition (Q’w = 4, qs = 40). This condition is 16 times more productive than the lower removal rate and aggressiveness condition (Q’w = 1, qs = 180). This behavior can be explained by the association between higher macro geometric wear and less attrition wear or dulling at higher values of aggressiveness [13].
The use of more aggressive conditions appears to have a positive impact on both the stability of the process and the temperature limit for the appearance of thermal damage, resulting in a more productive process.
4. Conclusions
The present study aimed to provide both a thorough characterization of kinematics removal mechanisms and a detailed temperature simulation of face grinding applications with straight wheels. A model for face grinding with straight wheels was provided in which all kinematic parameters are considered as well as the specific removal mechanisms that characterize this process. In the proposed model, the influence of the kinematic parameters is linked to thermal behavior trough the aggressiveness concept. A successful correlation between the experimental thermal damage inspections and the proposed thermo-kinematic model was achieved thus validating it and allowing better understanding and optimization of grinding processes in which this operation is used. In addition, several aggressiveness conditions were tested in order to acquire broad experimental knowledge of the energetic and wear behavior of the process.
In future work there is a need for more in-depth experimental validation focused on the influence of the already characterized corner radius and chamfer angle, along with more advanced wheel wear modelling. The wear and thermal behavior under the use of CBN wheels as well as a comparison between single step and multi-step feed strategies are also of interest and expected to be analysed in future investigations.
Experimental analysis of the influence of grinding wheel face height (h) is also necessary for a complete understanding of its influence on the behavior of the process, which could also be integrated into a more advanced model.
Author Contributions
Conceptualization, L.U. and D.B.; methodology, L.U. and D.B.; software, L.U.; validation, L.U., D.B. and J.L.L.; formal analysis, L.U; D.B. and J.A.S. investigation, L.U..; resources, D.B.; writing—original draft preparation, L.U.; writing—review and editing, L.U. and D.B. visualization, L.U.; supervision, D.B., J.A.S.; project administration, D.B. and J.A.S.; funding acquisition, D.B. and J.A.S. All authors have read and agreed to the published version of the manuscript.
Funding
The authors gratefully acknowledge the funding support received from: Spanish Ministry of Economy and Competitiveness and the FEDER operation program for funding the project “Scientific models and machine-tool advanced sensing techniques for efficient machining of precision components of Low-Pressure Turbines” (DPI2017-82239-P). The Basque Government and ELKARTEK program for funding the project “Data and knowledge-based high value processes” (KK-2019/00004). CDTI-Ayudas Cervera para Centros Tecnológicos for funding the project "MIRAGED: POSICIONAMIENTO ESTRATÉGICO EN MODELOS VIRTUALES Y GEMELOS DIGITALES PARA UNA INDUSTRIA 4.0”.
Conflicts of Interest
The authors declare no conflict of interest.
Nomenclature
| Variable | Unit | Description |
| ad | (mm) | Dressing infeed |
| ae | (mm) | Feed per revolution at each point of the contact arc |
| ae1 | (mm) | Feed per revolution corresponding to the points in the corner radius |
| ae2 | (mm) | Feed per revolution corresponding to the points in the chamfer |
| Aggr | - | Aggressiveness |
| atotal | (mm) | Total infeed per grinding pass |
| b1 | (mm) | Contact width of the points in the corner radius |
| b2 | (mm) | Contact width of the points in the chamfer |
| ds | (mm) | Wheel diameter |
| e | (J/mm3) | Specific energy |
| e0 | (J/mm3) | Minimum specific energy |
| ef | (J/mm3) | Specific energy at the end of the test |
| ei | (J/mm3) | Specific energy at the beginning of the test |
| h | (mm) | Flat face of the wheel |
| K | - | Adjusting parameter 1 |
| lc | (mm) | Contact arc length |
| lc1 | (mm) | Half contact arc length corresponding to the corner radius |
| lc2 | (mm) | Half contact arc length corresponding to the chamfer |
| m | - | Adjusting parameter 2 |
| n | - | Number of grinding passes until thermal damage was detected |
| nw | (rpm) | Wheel rotational speed |
| P | (W) | Measured power |
| Pf | (bar) | Coolant pressure at the nozzle |
| Q’s | (mm3/mm.s) | Wheel removal rate |
| Q’w | (mm3/mm.s) | Workpiece removal rate |
| Qf | (L/min) | Coolant flow |
| qs | - | Wheel workpiece speed ratio |
| Qw | (mm3/s) | Total removed chip flow |
| r0 | (mm) | Corner radius of workpiece and/or wheel |
| rw1 | (mm) | Inner radius of the workpiece |
| rw2 | (mm) | Outer radius of the workpiece |
| T | (°C) | Temperature |
| vfa | (mm/min) | Axial infeed speed |
| vfd | (mm/min) | Dressing infeed speed |
| vs | (m/s) | Wheel peripheral speed |
| vw | (mm/s) | Workpiece speed |
| α | (°) | Angle of the wheel chamfer |
| γ | (°) | Turned angle at each point of the contact arc |
| γ1 | (°) | Turned angle corresponding to the points of the corner radius |
| γ2 | (°) | Turned angle corresponding to the points of the chamfer |
| ε | - | Heat partition to the workpiece |
| φ | (°) | Half contact arc |
| ψ | (°) | Relative angle between workpiece and wheel speed |
References
- Walsh, A.P.; Baliga, B.; Hodgson, P. Force modelling of the crankshaft pin grinding process. Proc. Inst. Mech. Eng. Part D J. Automob. Eng. 2004, 218, 219–228. [Google Scholar] [CrossRef]
- Zhang, M.; Yao, Z. Force characteristics in continuous path controlled crankpin grinding. Chin. J. Mech. Eng. 2015, 28, 331–337. [Google Scholar] [CrossRef]
- Oliveira, J.F.G.; Silva, E.J.; Gomes, J.J.F.; Klocke, F.; Friedrich, D. Analysis of Grinding Strategies Applied to Crankshaft Manufacturing. CIRP Ann. 2005, 54, 269–272. [Google Scholar] [CrossRef]
- Dražumerič, R.; Roininen, R.; Badger, J.; Krajnik, P. Temperature-based method for determination of feed increments in crankshaft grinding. J. Mater. Process. Technol. 2018, 259, 228–234. [Google Scholar] [CrossRef]
- Urgoiti, L.; Sánchez, J.A.; Barrenetxea, D.; Álvarez, J. State of the art of different industrial approaches for face grinding applications. Procedia Manuf. 2017, 13, 94–101. [Google Scholar] [CrossRef]
- Shiha, A.J.; Lee, N.L. Precision cylindrical face grinding. Precis. Eng. 1999, 23, 177–184. [Google Scholar] [CrossRef]
- Badger, J. Grinding of sub-micron-grade carbide: Contact and wear mechanisms, loading, conditioning, scrubbing and resin-bond degradation. CIRP Ann. 2015, 64, 341–344. [Google Scholar] [CrossRef]
- Badger, J. Practical Application of Aggressiveness and Chip Thickness in Grinding. In Proceedings of the J. Badger. Annals of the CIRP 3rd International Conference High Performance Cutting (HPC), Dublin, Ireland, 12–13 June 2008; pp. 599–606. [Google Scholar]
- Jaeger, J.C. Moving Sources of Heat and the Temperature at Sliding Contacts. J. Proc. 1942, 76, 203–224. [Google Scholar]
- Malkin, S.; Guo, C. Thermal Analysis of Grinding. CIRP Annals 2007, 56, 760–782. [Google Scholar] [CrossRef]
- Ju, Y. Thermal aspects of grinding for surface integrity. Ph.D. Thesis, Purdue University, West Lafayette, IN, USA, 1997; pp. 1–152. [Google Scholar]
- Jermolajev, S.; Brinksmeier, E.; Heinzel, C. Surface layer modification charts for gear grinding. CIRP Ann. 2018, 67, 333–336. [Google Scholar] [CrossRef]
- Badger, J. Factors affecting wheel collapse in grinding. CIRP Ann. 2009, 58, 307–310. [Google Scholar] [CrossRef]


© 2020 by the authors. Licensee MDPI, Basel, Switzerland. This article is an open access article distributed under the terms and conditions of the Creative Commons Attribution (CC BY) license (http://creativecommons.org/licenses/by/4.0/).