Stabilization Mechanism of Semi-Solid Film Simulating the Cell Wall during Fabrication of Aluminum Foam

Abstract
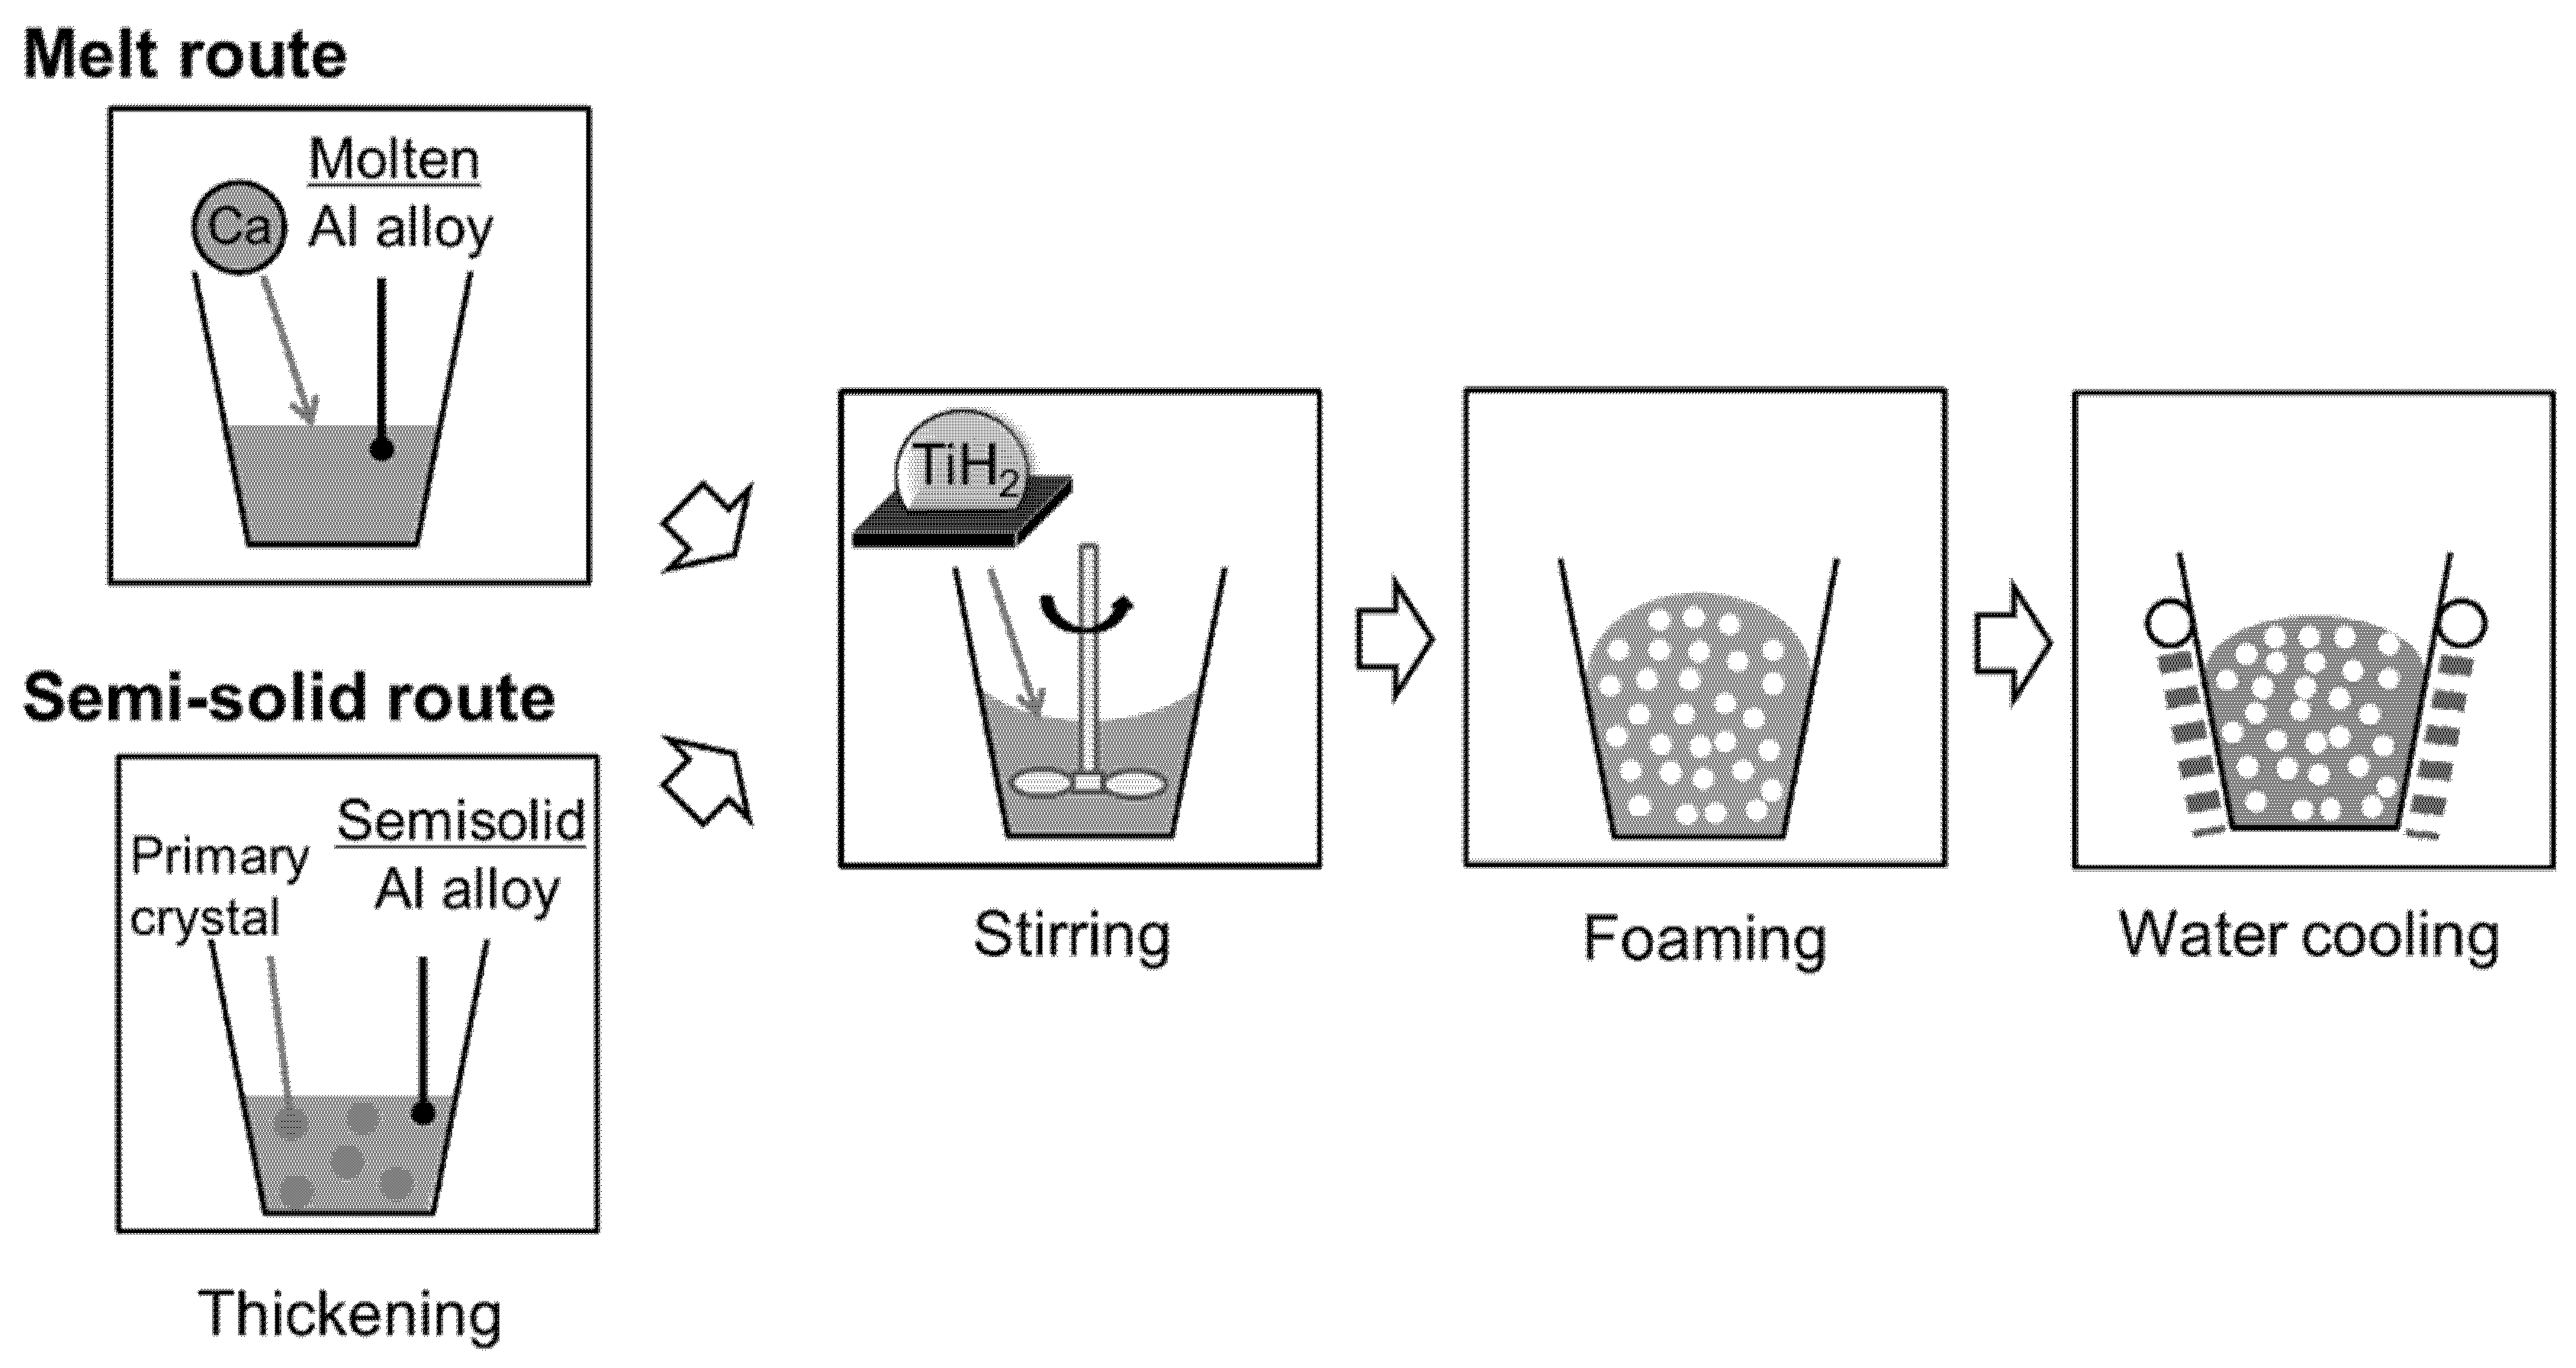
1. Introduction
2. Materials and Methods
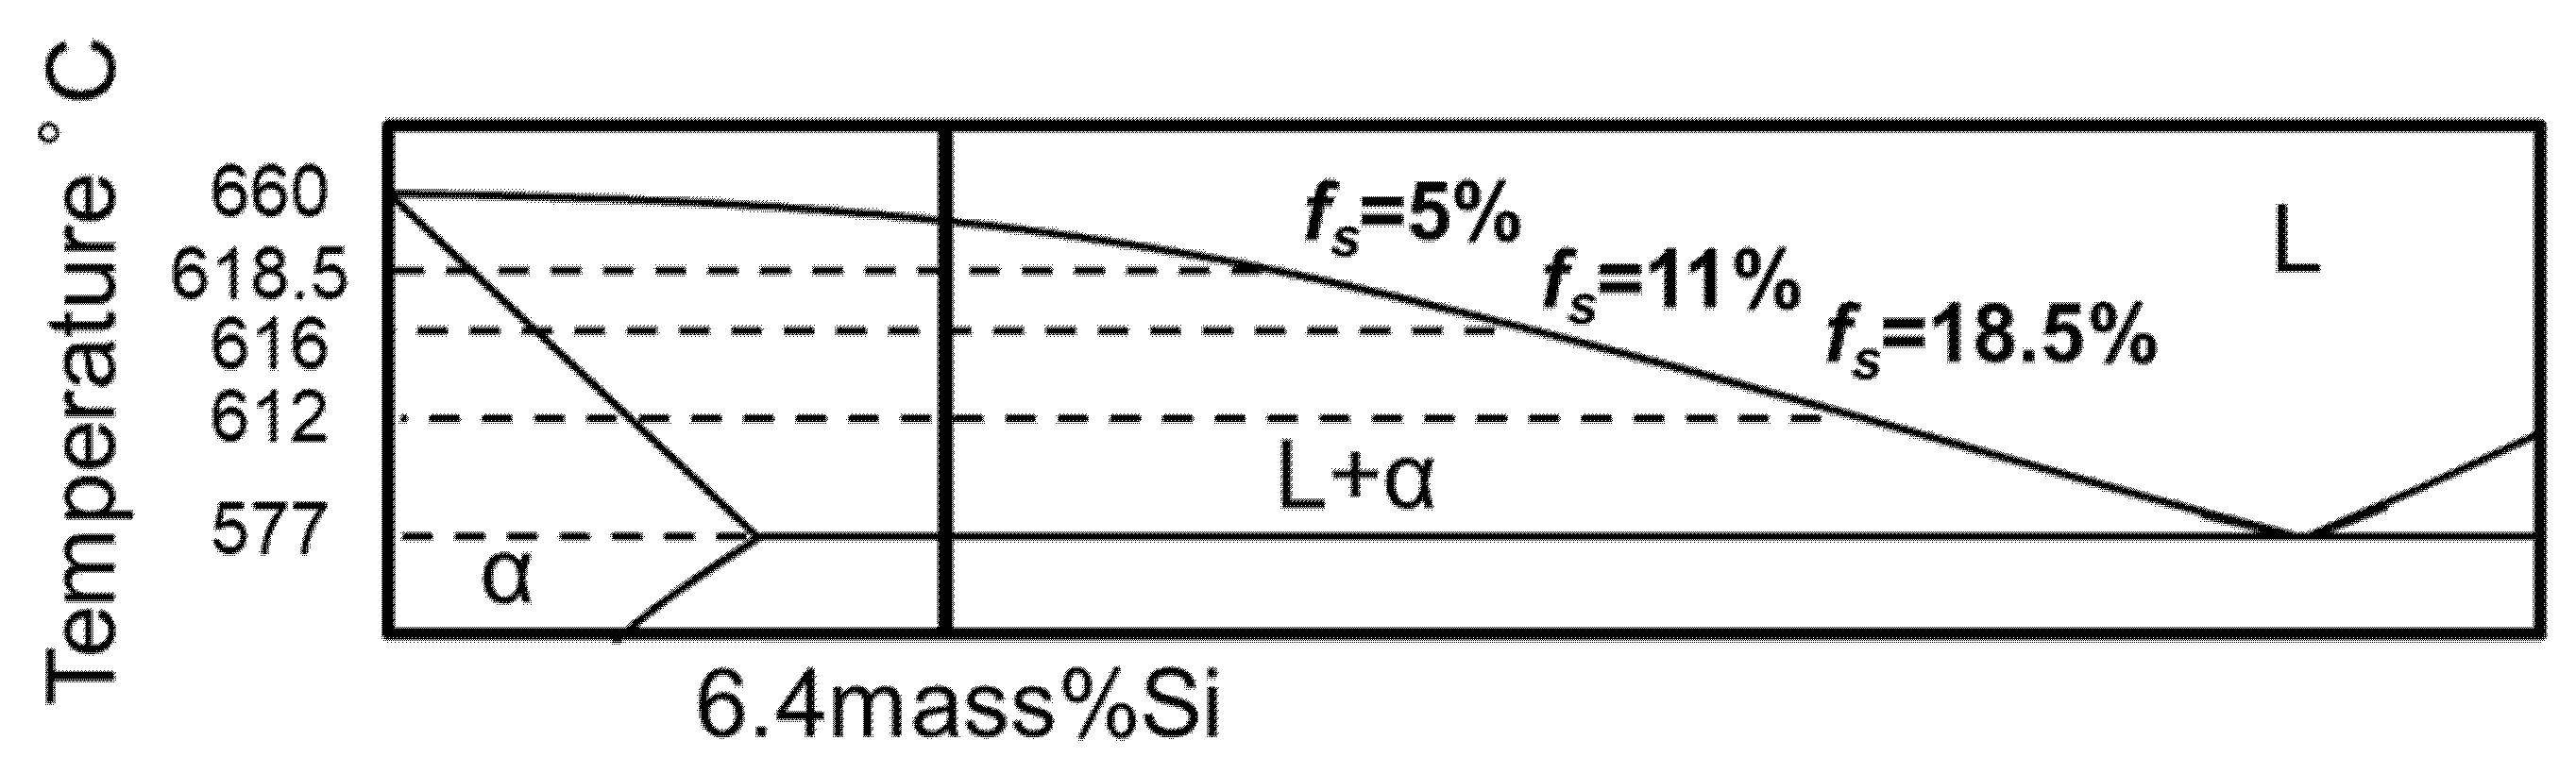
2.1. Sample Material
2.2. Forming of Aluminum Alloy Film
2.3. Observation of Aluminum Alloy Film
3. Results
3.1. Temporal Change of Cross Sectional Area
3.2. Observation of Primary Crystals
4. Discussion
4.1. Suppression of Drainage by Thickening
4.1.1. Derivation of Model Formula
4.1.2. Comparing Cross Sectional Areas Obtained from the Model with Experimental Results
4.2. Suppression of Drainage by Clogging of Primary Crystals
4.3. Fluid Flow and Clogging of Primary Crystals
5. Conclusions
- Pulled-up film drainages as a thickened melt. Since this could be explained as Poiseuille flow, drainage rate becomes slower with increasing solid fraction.
- At a certain timing clogging occurs and drainage is largely suppressed. Clogging is occurring in the range of solid fraction of 20–45% under the thinnest part of the film.
- The clogging occurs earlier as the solid fraction increases. For solid fraction fs = 18.5% clogging seems to be already occurring in holding time t = 0 s.
Author Contributions
Funding
Acknowledgments
Conflicts of Interest
Appendix A

References
- Baumeister, J.; Banhart, J.; Weber, M. Aluminium foams for transport industry. Mater. Des. 1997, 18, 217–220. [Google Scholar] [CrossRef]
- Banhart, J. Manufacture, characterisation and application of cellular metals and metal foams. Prog. Mater Sci. 2001, 46, 559–632. [Google Scholar] [CrossRef]
- Miyoshi, T.; Itoh, M.; Akiyama, S.; Kitahara, A. ALPORAS aluminum foam: production process, properties, and applications. Adv. Eng. Mater. 2000, 2, 179–183. [Google Scholar] [CrossRef]
- Lu, T.J.; Hess, A.; Ashby, M.F. Sound absorption in metallic foams. J. Appl. Phys. 1999, 85, 7528–7539. [Google Scholar] [CrossRef]
- Kitazono, K. Superplastic forming and foaming of cellular aluminum components. Mater. Trans. 2006, 47, 2223–2228. [Google Scholar] [CrossRef]
- Banhart, J.; Vinod-Kumar, G.S.; Kamm, P.H.; Neu, T.R.; García-Moreno, F. Light metal foams—Some recent developments. Cienc. Tecnol. Mater. 2015, 27, 1–80. [Google Scholar] [CrossRef]
- Kuwahara, T.; Saito, M.; Osaka, T.; Suzuki, S. Effect of primary crystals on pore morphology during semi-solid foaming of A2024 alloys. Metals 2019, 9, 88. [Google Scholar] [CrossRef]
- Hanafusa, T.; Ohishi, K. Making of Porous Metallic Material by the Semi-Solid Aluminum Alloy. Available online: https://www.pref.hiroshima.lg.jp/uploaded/life/206737_384148_misc.pdf (accessed on 23 January 2020).
- Kuwahara, T.; Osaka, T.; Saito, M.; Suzuki, S. Compressive properties of A2024 alloy foam fabricated through a Melt route and a Semi-solid route. Metals 2019, 9, 153. [Google Scholar] [CrossRef]
- Jin, I.; Kenny, L.D.; Sang, H. Method of producing lightweight foamed metal. U.S. Patent 4,973,358, 27 November 1990. [Google Scholar]
- Heim, K.; García-Moreno, F.; Banhart, J. Particle size and fraction required to stabilize aluminum alloy foams created by gas injection. Script. Mater. 2018, 153, 54–58. [Google Scholar] [CrossRef]
- Heim, K.; Vinod Kumar, G.S.; García-Moreno, F.; Rack, A.; Banhart, J. Stabilization of aluminium foams and films by the joint action of dispersed particles and oxide films. Acta Mater. 2015, 99, 313–324. [Google Scholar] [CrossRef]
- Heim, K.; Vinod Kumar, G.S.; García-Moreno, F.; Manke, I.; Banhart, J. Drainage of particle-stabilised aluminium composites through single films and Plateau borders. Colloids Surf. A 2013, 438, 85–92. [Google Scholar] [CrossRef]
- Chen, H.I.; Chen, J.C.; Liao, J.J. The influence of shearing conditions on the rheology of semi-solid magnesium alloy. Mater. Sci. Eng. 2008, A487, 114–119. [Google Scholar] [CrossRef]
- Brady, A.P.; Ross, S. The measurement of foam stability. J. Am. Chem. Soc. 1944, 66, 1348–1356. [Google Scholar] [CrossRef]
- Moon, H.K. Rheological behavior and microstructure of ceramic particulate/aluminum alloy composites. Ph.D. Thesis, Massachusetts Institute of Technology, Cambridge, MA, USA, 1990. [Google Scholar]
- Kudoh, M.; Takahashi, T. Estimation of the fluidity of the liquid in the solid-liquid coexisting zone of an Al-Si alloy. Available online: https://eprints.lib.hokudai.ac.jp/dspace/bitstream/2115/41753/1/110_69-80.pdf. (accessed on 23 January 2020).


| Element | Si | Fe | Cu | Al |
|---|---|---|---|---|
| mass% | 0.004 | 0.003 | 0.001 | bal. |
| Element | Si | Fe | Cu | Al |
|---|---|---|---|---|
| mass% | 25.1 | 0.17 | 0.00 | bal. |
© 2020 by the authors. Licensee MDPI, Basel, Switzerland. This article is an open access article distributed under the terms and conditions of the Creative Commons Attribution (CC BY) license (http://creativecommons.org/licenses/by/4.0/).
Share and Cite
Kuwahara, T.; Kaya, A.; Osaka, T.; Takamatsu, S.; Suzuki, S. Stabilization Mechanism of Semi-Solid Film Simulating the Cell Wall during Fabrication of Aluminum Foam. Metals 2020, 10, 333. https://doi.org/10.3390/met10030333
Kuwahara T, Kaya A, Osaka T, Takamatsu S, Suzuki S. Stabilization Mechanism of Semi-Solid Film Simulating the Cell Wall during Fabrication of Aluminum Foam. Metals. 2020; 10(3):333. https://doi.org/10.3390/met10030333
Chicago/Turabian StyleKuwahara, Takashi, Akira Kaya, Taro Osaka, Satomi Takamatsu, and Shinsuke Suzuki. 2020. "Stabilization Mechanism of Semi-Solid Film Simulating the Cell Wall during Fabrication of Aluminum Foam" Metals 10, no. 3: 333. https://doi.org/10.3390/met10030333
APA StyleKuwahara, T., Kaya, A., Osaka, T., Takamatsu, S., & Suzuki, S. (2020). Stabilization Mechanism of Semi-Solid Film Simulating the Cell Wall during Fabrication of Aluminum Foam. Metals, 10(3), 333. https://doi.org/10.3390/met10030333