Abstract
The thermal regime and microstructural phenomenon are studied by using finite-element (FE) modelling and the analytical Rosenthal equation during laser welding of aluminum alloy 5456 (AA5456) components. A major goal is to determine the merits and demerits of this analytical equation which can be an alternative to FE analysis, and to evaluate the effect of imperative assumptions on predicted consequences. Using results from the analytical and numerical approaches in conjunction with experiments, different physical features are compared. In this study, the results obtained from experiments in terms of melt pool shapes are compared with the predicted ones achieved from the numerical and analytical approaches in which the FE model is more accurate than the Rosenthal equation in the estimation of the melt pool dimensions. Furthermore, as to the partially melted zones, the estimations achieved from the numerical modeling are more genuine than ones from the analytical equation with regards to the experimental results. At high energy density, near keyhole welding mode, the reported results show that experimental melt widths are supposed to be narrower than the fusion widths estimated by the analytical solution. The primary explanation could be the influence of thermal losses that occurred during convection and radiation, which are neglected in the Rosenthal equation. Additionally, the primary dendrite arm spacing (PDAS) estimated with the numerical modeling and the analytical Rosenthal solution is comparable with the experimental results obtained.
1. Introduction
Laser beam welding has numerous merits owing to high welding velocity, low heat input, high flexibility, high efficiency of production, narrow weld width and large weld depth in comparison to conventional welding processes, such as those based on the electric arc. Thus, the use of laser welding in different applications such as high pressure and vacuum vessels, crane fabrication, and in the marine and aerospace industries is currently a reality. For instance, pulsed Nd:YAG laser is of great importance because the laser parameters, that is, average power, pulse duration, and frequency, are controllable. As for aluminum and its alloys, they are comprehensively consumed in different industries such as aerospace and automobile owing to their high specific strength and corrosion resistance in comparison to other metallic alloys. Among different kinds of aluminum alloys, 5456 aluminum alloy (AA5456), which is a wrought and non-heat treatable aluminum alloy belonging to the 5xxx Al-Mg series, is focus of attention due to the high amount of magnesium (approximately 5 percent), which improved the material weldability [1].
During welding, process control is fundamental to obtain defect-free joints. All aluminum alloys encompass specific characteristics, namely, low absorption of the laser beam, volatile elements such as magnesium in 5456 aluminum alloy, tendency to create oxide films, and a propensity to form constituents with low melting points [2,3]. Therefore, some defects including excessive porosity, blowholes, and hot cracking can occur in laser welded aluminum alloys [4]. These kinds of flaws can be seriously damaging to the mechanical properties of the welds. To achieve a sound weld of aluminum alloys via laser welding, considering the relationships between microstructure and mechanical properties, determining optimum parameters in the process for different aluminum alloys is of paramount importance. It has been reported that hot cracking phenomenon is eliminated during laser welding of 5456 aluminum alloy by performing preheating just before welding [1]. Researchers have found that increasing pulse overlapping factor induces an increase in Mg loss so that a tendency to formation of excessive solidification cracking occurs [5]. With all these results considered, it is obvious that the solidification process and optimization of laser parameters are determining factors in the performance of laser welds and the resulting microstructures. As far as these imperative concepts are concerned, it is of paramount importance to evaluate the temperature regime during this particular process.
Experimental results play an integral role in characterizing laser welded components; however, these results could be restricted by the technique used, and the time-consuming aspect may also adversely affect the whole process. On the other hand, in order for the significant behavior in laser welding to be investigated and determined, mathematical models are additional ways. It should be considered that numerical and analytical solutions are two major approaches to obtain such insights into the effect of different process parameters. To predict the thermal features of welding, Rosenthal’s analytical model can be widely utilized and has a potential to give an abrupt estimation [6]. However, some assumptions need to be performed when using the Rosenthal equation in order that this analytical solution would be applicable in welding process; nevertheless, this will raise concerns about the results’ accuracy obtained from this equation. On the other hand, the amount of assumptions used in numerical models is often fewer than the analytical solution, which causes to be more genuine. In contrast to this idea, the calculation time needed for numerical models is drastically longer than that of analytical ones.
It has been reported that the Rosenthal equation was already applied to determine which conditions would induce lack of fusion circumstance in different alloys [7]. They found a prediction of blowhole formation induced by lack of fusion under various processing conditions. In another research, the primary dendrite arm spacing (PDAS) was estimated via a processing map [8]. Wang et al. [9] have conducted the phase-field model to evaluate the dendritic growth of grains along the melt pool boundary. Remano et al. [10] have utilized a finite-element (FE) model to investigate molten and solidified Inconel 718 during the laser-based additive manufacturing. In this research, they observed that the fusion width was overestimated when using high energy densities. In this regard, the absorptivity of laser beam by the substrate was determined using a factor which needs to be performed in numerical modeling so that the predicted results became comparable with experimental ones. Artinov et al. [11] developed a 3D model to calculate the heat source and predict the thermal behavior in fusion welding. Furthermore, they accomplished a relationship between numerical results and experimental ones for weld pool geometries and heat transfer. Satyanarayana et al. [12] have applied the convection mode of heat transfer and Marangoni stresses in the fusion zone and have also calculated heating and cooling rates with which they would then use to study the microstructure of fusion and heat affected zones during laser welding of ZR-1%NB alloy. In another study [13], a finite element model was developed to investigate hot cracking phenomena during laser welding of 6xxx aluminum alloys. It was shown that the heat flux vector field achieved from the simulation is in a good agreement with the grain orientation observed in the experiments. As to laser welding of 5xxx and 6xxx Al series, research works have been conducted using thermomechanical finite element models to study the temperature-dependent characteristics of the joints so that optimized laser parameters would be obtained [14]. Moreover, an irreversible melting state variable into the thermomechanical simulation was presented to evaluate how the melting state influences the mechanical and thermal features during laser welding of Al alloys [15]. Based on previous studies, numerical modeling and analytical solutions are both capable to produce satisfactory results during the laser welding process. However, they should be investigated separately, and there has been no comprehensive evaluation of these two routes yet, especially for laser welding of the 5456 aluminum alloy.
All in all, this research aims to describe both analytical and numerical solutions and compare them with regards to laser welding of AA5456 using a pulsed Nd:YAG laser. Based on the previous studies in this regard, it should be mentioned that the continuous mode of laser equipment has been widely used such that a comprehensive study in order to show the comparison between numerical and analytical solutions in laser welding of AA5456 using a pulsed Nd:YAG laser is still lacking. To do so, some important parameters like fusion dimensions, partially melted zone thickness, temperature gradient, cooling rate, solidification rate, and microstructure such as primary dendrite arm spacing (PDAS) were predicted and compared using analytical and numerical approaches in addition to experiments. Moreover, the predicted results were affected by the assumptions performed in the numerical modeling; therefore, these effects were elaborated. Furthermore, to validate these predicted results, some experimental results were obtained and compared to them. By doing so, it is expected that the knowledge of the correlation between determining parameters in the process and laser welded results is enhanced. Additionally, in order to investigate whether the analytical Rosenthal equation can supplement or replace the numerical modeling, the capability and limitations of this equation are studied in this research.
2. Numerical Modeling
In order for the temperature profile to be simulated during laser welding, a finite-element model was prepared. In this case, thermophysical properties of the material, the distribution mode of the laser beam focused on the substrate, and radiated heat losses in conjunction with heat losses through the convection are considered. For this purpose, COMSOL Multiphysics software version 5.4 developed by COMSOL Inc. (Stockholm, Sweden) is utilized to carry this numerical simulation out. Simulation circumstances are similar to processing parameters performed in laser welding, including a mean power of 50–80 W, a spot diameter of 0.5 mm, a frequency of 10 Hz, a duration of 4 ms, and a welding velocity of 2 mm/s.
2.1. Material Properties and Methods
Sheets of aluminum alloy 5456 with a thickness of 5 mm were used as the base metal in this investigation. The length and the width of these aluminum alloy sheets were 100 mm and 50 mm, respectively. Table 1 illustrates the chemical composition of this alloy. In order for the dendritic growth of grains within the fusion zone to be investigated, the scanning electron microscopy (SEM) was utilized.

Table 1.
Chemical composition of samples (in wt.%).
To weld AA5456 sheets in the bead-on-plate condition, a pulsed Nd:YAG laser with the model of IQL-10 was used. This laser apparatus was able to produce a maximum power of 80 W, a wavelength of 1064 nm, a focal length of 100 mm, and a spot diameter of 0.5 mm on the substrate. In the current study, the laser beam was collided with the substrate through the top surface. To protect the welding pool and its surroundings, argon gas at a flow rate of 30 l/min was applied linearly in the welding direction. Table 2 depicts the specific parameters which have been performed in the laser welding process.
Table 2.
Laser welding parameters.
Thermophysical properties of the material such as density, specific heat, and thermal conductivity vary with temperature such that they should be calculated via polynomial coefficients method which is described below. These coefficients are depicted in Table 3 [16,17,18].
Table 3.
Polynomial coefficients vary with temperature T for calculation of Density D, Specific Heat at constant pressure Cp, and Thermal Conductivity of Aluminum alloy 5456 [16,17,18].
As was mentioned above, thermophysical characteristics of the material are computed via polynomial coefficient. The value of each parameter was calculated as function of temperature using COMSOL Multiphysics; these diagrams are shown in Figure 1. In addition, in order for the phase change in the mushy zone to be considered, the heat capacity method is solved by encompassing the latent heat () of the base metal [19]. By doing so, the modified specific heat can be calculated in the mushy zone between the solidus and liquidus temperatures of the material , which is about 67 K; in this region, average melting temperature is defined to be 877.5 K approximately [20] (Equation (1)).
in this equation, and illustrate the specific heat and temperature, respectively.
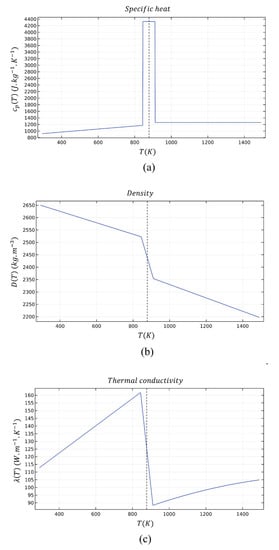
Figure 1.
Variation of thermophysical properties for 5456 aluminum alloy (AA5456 with temperature: (a) specific heat; (b) density; and (c) thermal conductivity.
2.2. Thermal Modeling
The substrate with the width of 10 mm, the length of 10 mm, and the height of 2.5 mm is involved in the thermal modeling. In general, it should be mentioned that the dimension of actual substrate that is used for the laser welding process is larger than the domain considered for simulation. Nevertheless, the thermal model simply plays a role as a heat container in the welding process; the serious thermal involvement happens adjacent to the upper part of the substrate and decreases abruptly with shifting to the bottom [21]. It was verified with a domain size independence test that the calculation domain is appropriate to not influence the temperature regime during the welding process, while restricting the computational load. To do so, five kinds of domains were used to validate the domain size independence. These were 10 × 10 × 2.5 mm3, 8 × 8 × 2 mm3, 6 × 6 × 1.5 mm3, 4 × 4 × 1 mm3, and 2 × 2 × 1 mm 3, as domains 1 to 5, respectively. As shown in Figure 2, the temperature variation at point (5, 0, 2.5), as the initial point of laser beam with an average power of 80 W focused on the substrate, was extracted. The difference between these five domains is less than 1%. Therefore, domain 1 was selected for this calculation to reduce the computational cost and time. However, this issue should be taken into account that by increasing the heat input of laser beam, the molten depth can be larger than the height of the substrate determined in the thermal model. Therefore, if the molten depth becomes larger than the domain used in the thermal modeling, the height of the domain needs to be changed with regards to the molten depth. However, in order for the computational cost and time to be decreased with regards to the molten depth and width, which were the main concentration in the present study, a domain with 2.5 mm height was prepared. Additionally, natural convection within a liquid melt pool is neglected in the thermal calculation. By doing so, the molten pool temperature is supposed to be higher than its temperature in real experiments; however, this would affect the solidification process very little from the molten pool boundary in which phase transformation and heat conduction occur [22]. Equation (2) illustrates the distribution mode of laser beam power, which is considered to be Gaussian. In this equation, is the initial point of the laser beam focused on the substrate, which is equal to (5, 0). Moreover, it should be noted that a pulsed Nd:YAG laser was utilized in the present study; therefore, it has a pulse duration and frequency with which the on-time and off-time of the laser beam can be determined. According to the parameters in Table 2, the pulse duration and frequency are 4 ms and 10 Hz, respectively. This means the laser beam is activated for 4 ms and then deactivated for 96 ms. In this regard, there should be 10 pulses in a second of the laser welding process (the time length from a pulse to the next pulse is around 100 ms). To consider the pulse mode of the laser beam, a step function is defined in which its value is 1 when the laser is active; on the other hand, its value is 0 when the laser beam is off. This function , which is dependent on time of the welding process t, is shown below as Equation (3).
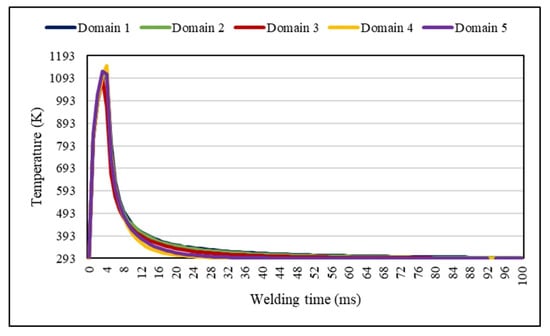
Figure 2.
Domain size independence test.
In this equation, is the laser power, is the absorption coefficient of the material, is the laser beam radius, is the welding velocity, and is the function calculated via Equation (3), in which and are the pulse duration and frequency of the laser equipment, respectively. The absorptivity of aluminum alloy 5456 is reported to be 0.36 [23].
To calculate the amount of radiation losses during laser welding, Equation (4) is performed using a coefficient for radiative heat transfer through the top surface of the substrate:
In this equation, is supposed to be the coefficient for radiative heat transfer, is a constant coefficient known as the Stefan–Boltzmann constant, is the coefficient for emission of the substrate, and is considered to be the ambient temperature; these parameters are reported to be 5.67 , 0.022, and 293 K, respectively [24,25].
In the thermal model, the temperature of the bottom part of the substrate is kept at room temperature. Based on previous studies, it has been shown that the substrate temperature is not significantly affected by the temperature variation at the bottom part of the substrate [26]. Furthermore, there is an assumption in the thermal model in which the insulation aspect of side walls is taken into account. Figure 3a exhibits the thermal model, which is considered for simulation in this research. Moreover, the calculation domain used in this simulation is demonstrated in Figure 3b. It should be taken into account that the mesh used in the present study is extremely fine (530714 elements) to calculate the temperature-dependent parameters accurately. A tetrahedral-shaped mesh with the minimum element size of 0.002 mm and the element volume ratio of 0.06968 was used to investigate the thermal behavior of joints.
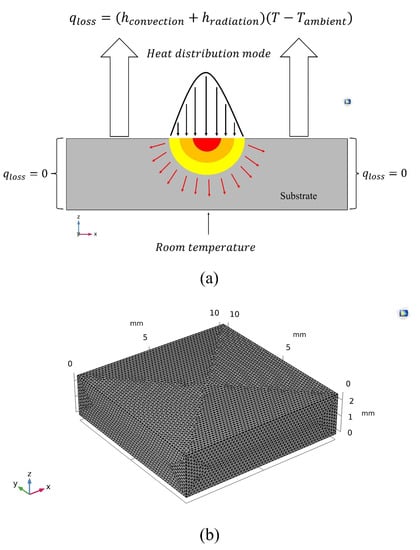
Figure 3.
(a) Thermal model: (1) the distribution mode of laser heat source; (2) radiation and convection losses; (3) insulation of side walls; (4) the bottom part of the substrate remained at room temperature; (b) calculation domain used in the simulation.
3. Analytical Rosenthal Equation
Rosenthal [6] has proposed an analytical method to estimate the thermal characteristics of materials during fusion welding in conduction mode. Therefore, this equation can be used in laser welding processes undergoing conduction mode welding and not key hole, in order to understand the temperature-dependent behavior of materials during welding. The Rosenthal equation is a simple method to predict the thermal behavior of materials, which makes it applicable to various manufacturing processes such that time-dependent parameters like temperature gradient, cooling rate, and solidification rate are able to be calculated using this equation. For this purpose, there are some assumptions that have been taken into account to develop this particular equation, which are as follows [6]:
- Materials’ properties such as specific heat at a constant pressure, density, and thermal conductivity are not the functions of temperature. In addition, the latent heat of materials is not considered when a phase transformation occurs between the solidus and liquidus temperatures of alloys, especially in the calculation of the specific heat in the mushy zone.
- The heat distribution mode on the substrate is considered to be quasi-stationary due to the consistency of welding velocity and power.
- A point heat source is selected in this analytical approach.
- Heat losses through radiation and convection are not taken into account. Furthermore, the natural convection within the substrate is not involved so that the heat produced in the substrate transfers by the conduction mode.
In order for the analytical Rosenthal equation to be applicable in the pulsed mode of a laser beam as a heat generator in the welding process, an additional assumption is made that the laser beam is active in the time range of its pulse duration 4 ms. To do so, Equation (3) should be performed directly in the Rosenthal equation. Therefore, the modified Rosenthal equation is achieved and shown in Equation (5):
According to Equation (5), is the base material starting temperature, is the thermal conductivity, is the welding velocity, is the thermal diffusivity, and is the function that was previously described in Equation (3). It should be taken into account that in Equation (5), the welding is performed in the direction of the -axis; so, to perform welding velocity and time in the equation, is substituted by ; r is the distance of any point on the substrate from the laser beam, which can be computed by . As discussed before, materials’ properties are not the functions of temperature while using in the analytical solution. As a result, the properties mentioned in Table 4 are used in the analytical Rosenthal equation to predict the thermal behavior of the material in laser welding.
Table 4.
Room-temperature thermal properties of aluminum alloy 5456 used in the analytical method.
4. Results
In the present study, the results from experiments, the numerical modeling, and the analytical method are compared with regards to different energy densities. Equation (6) exhibits how the heat input can be calculated from the welding velocity and power. These parameters are of great importance because they affect the molten geometries and the heat transfer in the welding process. The calculated heat inputs in the present study are shown in Table 2.
Figure 4 demonstrates the heat transfer and a transverse-section molten pool achieved by the numerical modeling using an average power of 80 W, welding speed of 2 , and welding time of 4 . By using this model, further calculations of the fusion depth and width, growth rate, and temperature gradient can be enabled, and thus, the microstructure of welds becomes available to be estimated using these temperature-dependent parameters. Furthermore, the dimension of the partially melted zone (PMZ) of welds can be determined using experimental, Rosenthal equation, and FE modeling results. The results obtained from the numerical modeling, the analytical method, and the experiments are compared. The temperature gradient and growth rate determined by the two routes (numerical and analytical) will be evaluated owing to the importance of these parameters in the prediction of microstructure. Moreover, the PDAS (primary dendrite arm spacing) obtained from two approaches will be investigated.
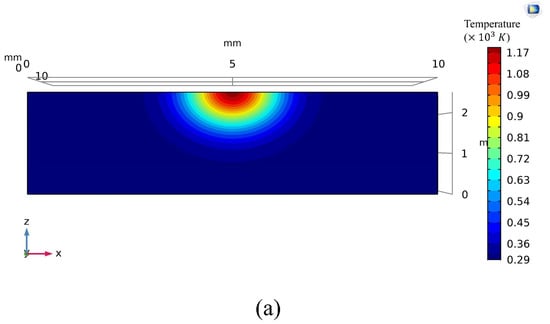
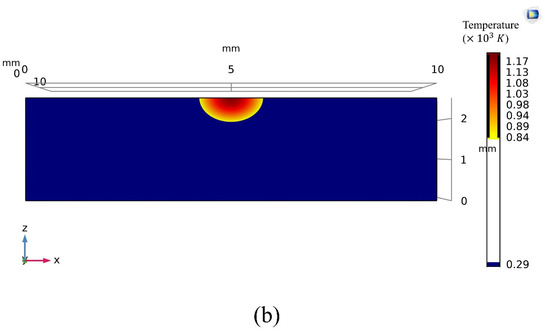
Figure 4.
(a) Transverse-section (x-z) of the heat transfer; (b) molten pool achieved from the numerical modeling using an average laser power of 80 W, welding speed of 2 mm.s−1, and absorptivity of 0.36 at t = 4 ms.
4.1. Molten Pool Dimensions
According to the Rosenthal equation, the fusion width maximizes as . To compute the fusion width in the current study, a simple equation was developed which is derived from the Rosenthal equation. This particular equation enabled the calculation of the path length between the laser beam and any location on the melt pool at a specific temperature. By doing so, computing of the fusion width is possible, and then, the fusion depth can be determined as well. Regarding the welding velocity of 2 , the laser beam will move 8 in the direction of -axis for 4 (the pulse duration of laser beam). The abovementioned criteria are shown as Equation (7).
where is the path length between any location on the weld pool with a specific temperature and the laser beam; is the welding power; is the temperature of any particular location on the melt pool; is the initial temperature of the material, which is about 293 K; is the thermal diffusion coefficient at 293 ; is the welding velocity; is the thermal conductivity of the material at 293 K; and is the absorption coefficient of the substrate. In order for the weld pool width to be calculated, Equation (8) is used which is written as follows:
where is the path length between any location on the weld pool with a particular temperature and the heat generator, is the welding velocity, and is the welding time. It should be taken into account that the analytical Rosenthal equation creates a semi-circular molten pool in which the fusion width () is two times bigger than the fusion depth ().
Experimental results in terms of the fusion width were compared with fusion widths, fusion depths, and partially melted zones thickness achieved by numerical modeling and analytical method. To do so, Rosenthal equation and FE modeling were used in order to calculate these values with which the comparison of these results becomes available with regards to experimental results. It should be noted that the PMZ is the area in which solidification cracks can be produced during laser welding such that the study in terms of this particular area can be beneficial to predict the solidification microstructure. The parameters performed in the numerical modeling are similar to those utilized in experiments; these parameters are comprehensively mentioned in Section 2. In order to compare the validation of the numerical and analytical methods regarding experimental results, four distinct laser powers were selected in the present study.
Fusion widths obtained from experiments are compared with the estimated ones from the numerical modeling and the analytical method. This comparison is illustrated in Figure 5. The average fusion widths were measured from three different transverse sections perpendicular to the welding direction for each heat input. Based on these results, it is observed that fusion widths achieved from the numerical modeling are consistent with those from experiments up to an energy density of 30 . By approaching higher energy densities, the predicted fusion widths tend to overestimate the average fusion widths obtained from experiments. However, there is a gap between the results from the analytical method and ones from experiments; obviously, fusion widths achieved from the Rosenthal equation are bigger than those from experiments. It is apparent that the results from Rosenthal equation are not matched with the experimental results due to some of selected assumptions described in Section 3. According to the FE models, natural convection within the molten pool is neglected so that in smaller melt pools, the temperature is overestimated, compared with genuine melt pools. Therefore, radiation losses are increased in smaller fusion welds. In contrast to this idea, based on the assumptions for the analytical Rosenthal equation, radiation losses are not involved in this method; therefore, fusion widths attained from the analytical method are larger than those from the numerical modeling and experiments.
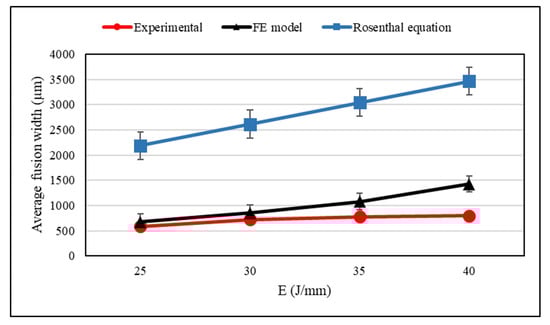
Figure 5.
Comparison of the fusion width obtained from experiments, the numerical modeling, and the analytical Rosenthal equation.
Fusion depths obtained from experiments are compared with the estimated ones from the numerical modeling and the analytical method. This comparison is demonstrated in Figure 6. The average fusion depths were measured from three different transverse sections perpendicular to the welding direction for each heat input. According to these results, it is apparent that fusion depths achieved from the numerical modeling are consistent with those from experiments up to an energy density of 30 . By approaching higher energy densities, the predicted fusion depths incline to overestimate the average fusion depths obtained from experiments. On the other hand, the predicted results from the Rosenthal equation seem to overestimate the average fusion depths attained from the experiments. The main reason may lie in the assumptions of the Rosenthal equation. As discussed above, there is no convection during the simulation of the welding process such that the results can be overestimated. Furthermore, the radiative losses might be too high especially for smaller melt pools; therefore, the predicted results might be inaccurate. In contrast, in the analytical method, radiation losses and natural convection are not considered with which the predicted results could be overestimated in comparison to the predictions from FE modeling and the experimental results.
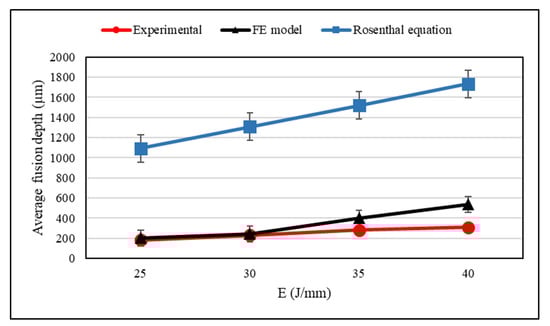
Figure 6.
Comparison of the fusion depth obtained from experiments, the numerical modeling, and the analytical Rosenthal equation.
Figure 7 demonstrates a comparison made on the partially melted zones thickness obtained from the experiments, the FE modeling, and the Rosenthal equation as well as a cross-section of the molten pool, whose parameters were selected from A1 in Table 2, fitted by the FE model of the partially melted zone. As shown in Figure 6, the partially melted zone thickness obtained from the experiments increases when the heat input of the laser beam is augmented. Actually, the partially melted zone (PMZ) is an area formed between the eutectic (or solidus temperature for solutionized work pieces) and liquidus temperatures of materials [29]. It is reported that the energy density can only affect the PMZ length during welding [30]. According to the predicted results from the FE modeling, it is obvious that the partially melted zone thickness enhances with the heat input increment; however, these results overestimate the length of PMZ due to the simplifications described above, such as insulating of substrate walls and neglecting the existence of convection inside the melt pool. Regarding the results obtained from the analytical method, an overestimation of the experimental results can be seen from Figure 7. As described above, there were some assumptions performed to the Rosenthal equation with which the predicted results are not matched with the experimental ones in this regard.
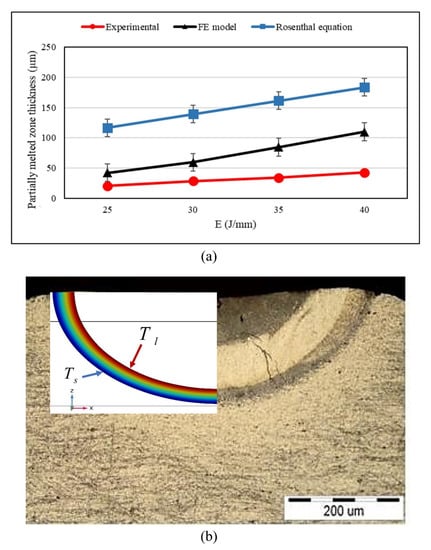
Figure 7.
(a) Comparison of the partially melted zone thickness obtained from experiments, the numerical modeling, and the analytical method; (b) fitted partially melted zone from the finite-element (FE) model on the cross-section of the melt pool using an average laser power of 50 , welding velocity of 2 , and absorptivity of 0.36.
4.2. Predicted Temperature-Dependent Parameters
Both of the temperature gradient (G) and the growth rate (R) are of paramount importance for determining the microstructure of solidified welds. The analytical Rosenthal equation can be utilized to estimate these imperative parameters abruptly via derivation from Equation (5). The temperature gradients in the directions of the axis y- and the axis z- are computed using the following equations. Equations (9) and (10) demonstrate the temperature gradients in the direction of the axis y- and the axis z-, respectively; both of these equations can be utilized through a section in the y-z plane where x is equal to zero. Moreover, for any point in the transverse section of the molten pool at , the cooling rate can be computed using Equation (11).
From the work of Bontha et al. [31], temperature-dependent parameters, namely, temperature gradient, cooling rate, and growth rate vary considerably at different points inside the molten pool. It is of great importance that the fusion depth should be calculated by Equation (7) so that the temperature gradient and the cooling rate of solidified welds can be determined in this regard. In this case, the average fusion depth can be seen from Figure 5 as well. Using Equation (5), the points y and z for different heat inputs are computed from the bottom of the welds to the centerline. These values are utilized to investigate the heat transfer behavior within the molten pool using Equations (9)–(11). Then, the average amounts of the results obtained from the analytical method are compared for various locations. In order for the solidification rate within the melt pool to be determined, the values of temperature gradient and cooling rate achieved from the analytical Rosenthal equation are used in Equation (12) for each point in the melt pool.
As to the numerical modeling, it is also of paramount importance that the fusion depth of solidified welds needs to be determined to evaluate the heat transfer behavior within the molten pool. Then, temperature-dependent parameters including temperature gradient and cooling rate are calculated at different points within the melt pool. In order for this case to be clearer, conceive an example of a laser beam with an average power of 80 W, welding velocity of 2 , and an absorption coefficient of 0.36. Performing these laser parameters, the obtained fusion depth using the numerical modeling is 576 . Temperature and temperature gradient, as thermal properties of the welded material, are computed in five different points from the bottom of the weld pools to the centerline: 76, 176, 276, 376, and 476 . By doing so, Figure 8a–c is attained in which the temperature and the temperature gradient in the direction of the axis z- are illustrated as functions of time and temperature, respectively. It is worthwhile to mention that the average amount of the temperature gradient is taken into account for the melting point and compared with the results obtained from the analytical method. For determining the solidification rate within the molten pool, the cooling rate is measured in the same way as the temperature gradient which was discussed before. Then, the temperature gradient and the cooling rate obtained from the numerical modeling are used in Equation (12), and ultimately, the values of the solidification rate are attained for different locations within the melt pool.
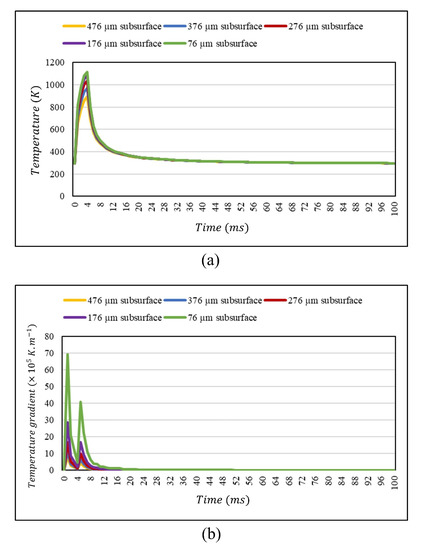
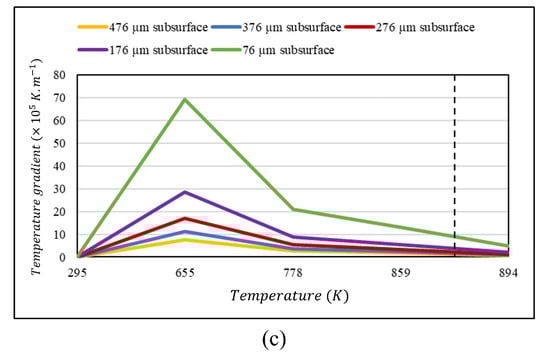
Figure 8.
(a) Variation of temperature versus welding time for different points within the molten pool; (b) variation of temperature gradient versus welding time for different points within the molten pool; (c) variation of temperature gradient versus temperature for different points within the molten pool obtained from the numerical modeling using a laser beam with an average power of 80 , welding velocity of 2 , and absorption coefficient of 0.36.
Temperature gradients are determined for different heat inputs using the numerical modeling and the analytical method, and the results obtained from the numerical modeling are compared with those attained from the analytical Rosenthal equation as shown in Figure 9, where the welding velocity is constant and its value is about 2 . As shown in Figure 9a, the temperature gradient is decreased by increasing heat input of the laser beam; this trend is the same for both approaches including the numerical modeling and the analytical method. The reason may lie in that by increasing the heat input of the laser beam, the molten pool becomes larger, which deteriorates the temperature gradient within the weld pool. According to the parameters used in this study, the results for temperature-dependent parameters such as temperature gradient, cooling rate, and growth rate obtained from the numerical modeling are slightly bigger than those from the analytical Rosenthal equation, as shown in Figure 9a–c.
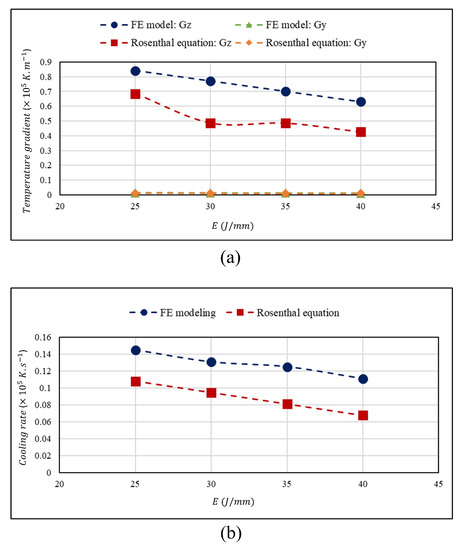
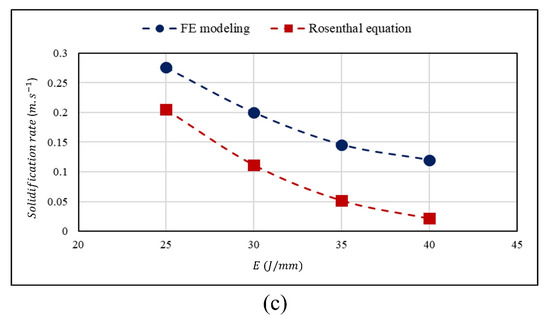
Figure 9.
(a) Temperature gradient, (b) cooling rate, and (c) solidification rate achieved from the numerical modeling and the analytical method versus heat input of the laser beam and their comparison.
Additionally, as can be seen from Figure 9b, the difference between the values of cooling rates obtained from the numerical modeling and the analytical method is increased by enhancing the energy density of the laser beam. The major reason may lie in that by increasing the heat input, radiation loss is increased as well so that this plays an integral role in increasing the difference between the results achieved from the numerical modeling and the analytical method at higher energy densities. Furthermore, as to the analytical method, heat losses are not considered through the substrate such that the temperature is raised considerably within the molten pool which makes it bigger in comparison to the FE model. Therefore, the cooling rate attained from the analytical method is lower than that achieved from the numerical modeling. Moreover, the more heat input is increased, the more the cooling rate from the analytical method is decreased due to an increase in weld pool dimensions. In addition, as to the FE model, the thermal conductivity of the material is a function of temperature. Therefore, by approaching the temperature near to the melting point of the material, the thermal conductivity is increased so that this can help the cooling process in the simulation. However, this cannot be a positive point for the cooling rate achieved from the analytical method because materials properties are not dependent on the temperature of the material using in the analytical Rosenthal equation, as discussed before. Goldak et al. [32] conducted a research in terms of the cooling rate and a comparison of its value obtained from the numerical modeling, the analytical Rosenthal equation, and experiments during welding. Based on the results from the numerical modeling, the analytical method, and experiments, they reported that the cooling rate attained from the FE model was underestimated by 5%, while the cooling rate computed from the Rosenthal equation was overestimated by 41%. Quite contrary, the results obtained from this study differ from those achieved by Goldak et al. because the cooling rate attained from the numerical modeling is higher than that achieved from the analytical method in the present study due to the reasons explained above. It should be considered that Goldak et al. [32] used low-carbon steel as the base metal that has lower thermal conductivity at higher temperatures so that the cooling rate calculated by the numerical modeling became lower than that computed by the analytical Rosenthal equation.
While investigating the heat transfer behavior within the molten pool, it is noteworthy to mention that the initial temperature of the substrate is considered to be constant, which is equal to room temperature. However, in genuine environments, the accumulation of heating in the substrate may affect the initial temperature so that it cannot be considered to become constant. There are some factors that can influence on the initial temperature of the substrate, including a minute time length between pulses with which the time needed for the cooling process is decreased; a small welding path with which the temperature of the molten pool is raised considerably after each pulse; and small features in the geometry with which the heat conduction is become weak due to the reason that oxide films on the substrate have low thermal conductivity. Without considering the local temperature of the substrate, the analytical Rosenthal equation is not applicable to evaluate the heat transfer behavior of the welded material; nevertheless, particular geometries can be performed in the numerical modeling for investigation of the heat transfer during welding.
4.3. Microstructural Evaluation: Primary Dendrite Arm Spacing (PDAS)
Understanding the relationship between the laser parameters and the microstructure can require an understanding of the microstructural evaluation of the joints via the numerical and analytical studies. By doing so, the mechanical characteristics of laser welded components can be estimated using this invaluable knowledge. Primary dendrite arm spacing (PDAS) can be an appropriate microstructural instance with which the mechanical features of welded materials can be elaborated upon [9]. As a result, the correlation between the solidification process and primary dendrite arm spacing has become the attention of various researches [5,33,34]. The Kurz and Fisher (KF) model is one of the most traditional models with which the calculation of PDAS becomes available [34]. It should be mentioned that this model (Equation (13)) has been utilized in Al-Mg systems in which PDAS has reported to be accurate with regards to experimental results [5].
in this equation, , which is known as temperature gradient, is the variation of temperature around a particular location at a given time; , which is known as solidification rate or growth rate, is the travel speed of the solid-liquid interface at a given temperature; is the primary dendrite arm spacing (). The values of , , , and are intrinsic characteristics of the material which are provided in Table 5 [5,20].
Table 5.
Material characteristics of the AA5456 used in the Kurz and Fisher (KF) model.
As shown in Figure 10, the variation of primary dendrite arm spacing (PDAS) obtained from the numerical modeling and the analytical method is illustrated versus the heat input of the laser beam, and a comparison between these results and experimental one has been made. Obviously, the G (temperature gradient) and R (solidification rate) values obtained from the numerical modeling and the analytical Rosenthal equation are different so that Equation (13) results in different values for PDAS attained from the numerical modeling and the analytical method. Wang et al. [35] have observed that both calculation approaches illustrate the same trend in which the PDAS is increased by enhancing heat input. It should be taken into account that the PDAS, which is predicted by the analytical method, is attained to be slightly larger than that from the numerical modeling. To observe the validation of the results obtained from the numerical modeling, an experiment was conducted using the same laser parameters as for the numerical method, and these results are compared with each other. Figure 10 shows the transverse-section of the laser welded material in which the laser parameters are selected from A2 in Table 2. As shown in Figure 11, the PDAS value is 1.029 at the heat input of 30 . It is apparent that the results obtained from the numerical modeling and the analytical method are consistent with the result from an experiment which was done at the heat input of 30 . Apparently, both of the numerical and analytical methods are capable to produce the primary dendrite arm spacing (PDAS), but it needs to have more experimental results to validate the numerical and analytical methods efficiently and compare their results to see which one is more accurate that the other one. Thus, there should be more experiments, specifically at various heat inputs, to verify the numerical modeling and the analytical method. Furthermore, with more available data, the determination of better methods will be attainable as well.
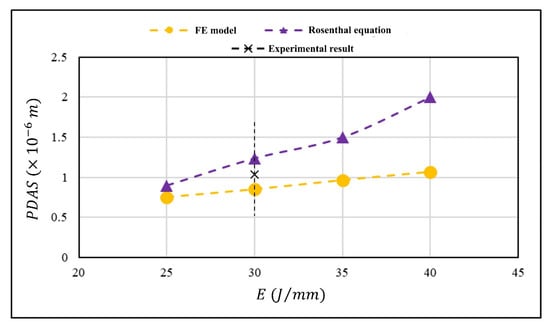
Figure 10.
Variation of primary dendrite arm spacing (PDAS) obtained from the experiment, the numerical modeling, and the analytical method versus heat input.
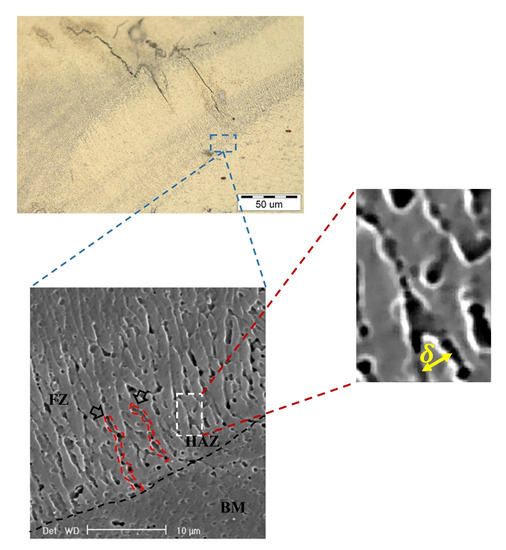
Figure 11.
Measurement of dendrite arms taken by optical and scanning electron microscopies at the boundary of fusion zone using a laser with an average power of 60 , welding velocity of 2 , and absorption coefficient of 0.36.
5. Conclusions
In the present study, the heat transfer behavior of AA5456 as the base metal is investigated while welding by a pulsed Nd:YAG laser. To do so, the numerical modeling and the analytical method are performed, and the estimated results are compared with the experimental ones. According to the investigation, welding pool dimensions including fusion width, fusion depth, and PMZ thickness; temperature-dependent parameters such as temperature gradient, cooling rate, and growth rate; and primary dendrite arm spacing (PDAS) are determined for different heat inputs. Moreover, the results obtained from the numerical modeling and the analytical method are compared with the results from experiments to validate these methods as a confident tool in prediction of mechanical properties as well as the microstructure. The conclusions are mentioned below:
- (1)
- The fusion width and depth obtained from the numerical modeling are consistent with the experimental results up to the heat input of 30 J · mm−1. However, by increasing the heat input, the discrepancy between the results from the numerical modeling and experimental ones becomes larger. The Rosenthal equation overestimates the melt pool dimensions. The reason may lie in the assumptions performed in the analytical Rosenthal equation in terms of neglecting heat losses through the substrate.
- (2)
- With regards to the partially melted zone, the FE model is slightly larger than the experimental results at the heat input of 25 J · mm−1. However, by increasing the heat input, the discrepancy between the results achieved from the numerical modeling and the results from experiments becomes wider. On the other hand, the Rosenthal equation overestimates the partially melted zone in comparison to the FE model and the experiment; this could be a result of assumptions with which heat losses as well as latent heat of the material are supposed to be neglected.
- (3)
- Numerical modeling produces temperature-dependent parameters including temperature gradient, cooling rate, and growth rate, which are higher than those obtained from the analytical method. Moreover, the discrepancy between the predicted results using the numerical modeling and the analytical method becomes larger by enhancing energy density.
- (4)
- The primary dendrite arm spacing (PDAS) is measured using the numerical modeling and the analytical method. As a result, the values obtained from the analytical method are slightly larger than those from the numerical modeling. Furthermore, it is observed that both of the numerical and analytical methods predict the PDAS with somewhat accuracy at the heat input of 30 J · mm−1 regarding the experimental result. However, there should be more experiments to verify these methods as a confident tool for prediction of the microstructure in laser welded materials, especially at different heat inputs.
- (5)
- All in all, the Rosenthal equation underestimates thermal results and overestimates microstructural results in comparison to the FE model. It should be taken into account that the discrepancy between the results attained from the analytical method and the numerical modeling becomes larger at higher heat inputs; therefore, there should be a restriction in utilizing the analytical Rosenthal equation at higher heat inputs to investigate the heat transfer behavior of laser welded materials due to the assumptions performed in this particular method. Thus, the numerical modeling can be widely used for investigation of heat transfer behavior of welded components at higher heat inputs, and its accuracy is more than the analytical method because it uses genuine materials’ characteristics.
Author Contributions
H.H.: Investigation, formal analysis, writing of the paper; Z.Z.: Formal analysis, writing of the paper; J.S.: Investigation; J.P.O.: Formal analysis, writing of the paper; H.N.-M.: Formal analysis, supervision, writing of the paper. All authors have read and agreed to the published version of the manuscript.
Funding
This research was funded by Fundação para a Ciência e a Tecnologia (FCT–MCTES): Grant number: UIDB/00667/2020 (UNIDEMI).
Acknowledgments
J.S. and J.P.O. acknowledge Fundação para a Ciência e a Tecnologia (FCT–MCTES) for its financial support via the project UIDB/00667/2020 (UNIDEMI).
Conflicts of Interest
The authors declare no conflict of interest.
References
- Hamidreza, H.; Naffakh-Moosavy, H. Hot cracking in pulsed Nd: YAG laser welding of AA5456. Opt. Laser Technol. 2018, 103, 22–32. [Google Scholar]
- Sabina, C.; Casalino, G.; Casavola, C.; Moramarco, V. Analysis and comparison of friction stir welding and laser assisted friction stir welding of aluminum alloy. Materials 2013, 6, 5923–5941. [Google Scholar]
- Cam, G.; Koçak, M. Progress in joining of advanced materials Part 2: Joining of metal matrix composites and joining of other advanced materials. Sci. Technol. Weld. Join. 1998, 3, 159–175. [Google Scholar] [CrossRef]
- Zhao, H.; White, D.R.; DebRoy, T. Current issues and problems in laser welding of automotive aluminium alloys. Int. Mater. Rev. 1999, 44, 238–266. [Google Scholar] [CrossRef]
- Beiranvand, Z.; Malekshahi, F.; Malek Ghaini, H.; Naffakh Moosavy, M.S.; Torkamany, M.J. Solidification cracking susceptibility in pulsed laser welding of Al–Mg alloys. Materialia 2019, 7, 100417. [Google Scholar] [CrossRef]
- Rosenthal, D. Mathematical theory of heat distribution during welding and cutting. Weld. J. 1941, 20, 220–234. [Google Scholar]
- Tang, M.P.; Chris, P.; Jack, L.B. Prediction of lack-of-fusion porosity for powder bed fusion. Addit. Manuf. 2017, 14, 39–48. [Google Scholar] [CrossRef]
- Liang, Y.-J.; An, L.; Xu, C.; Pang, X.-T.; Wang, H.-M. Prediction of primary dendritic arm spacing during laser rapid directional solidification of single-crystal nickel-base superalloys. J. Alloy. Compd. 2016, 688, 133–142. [Google Scholar] [CrossRef]
- Lei, W.; Wei, Y.; Zhan, X.; Yu, F.; Cao, X.; Gu, C.; Ou, W. Simulation of dendrite growth in the laser welding pool of aluminum alloy 2024 under transient conditions. J. Mater. Process. Technol. 2017, 246, 22–29. [Google Scholar]
- John, R.; Ladani, L.; Sadowski, M. Laser additive melting and solidification of Inconel 718: Finite element simulation and experiment. Jom 2016, 68, 967–977. [Google Scholar]
- Antoni, A.; Bachmann, M.; Rethmeier, M. Equivalent heat source approach in a 3D transient heat transfer simulation of full-penetration high power laser beam welding of thick metal plates. Int. J. Heat Mass Transf. 2018, 122, 1003–1013. [Google Scholar]
- Satyanarayana, G.K.L.; Narayana, B.; Nageswara, R.M.S.; Slobodyan, M.A.E.; Kiselev, A.S. Numerical Simulation of the Processes of Formation of a Welded Joint with a Pulsed ND: YAG Laser Welding of ZR–1% NB Alloy. Therm. Eng. 2019, 66, 210–218. [Google Scholar] [CrossRef]
- Wei, H.; Chen, J.S.; Wang, H.-P.; Blair, E.C. Thermomechanical numerical analysis of hot cracking during laser welding of 6XXX aluminum alloys. J. Laser Appl. 2016, 28, 022405. [Google Scholar] [CrossRef]
- Wei, H.; He, Q.; Chen, J.-S.; Wang, H.-P.; Blair, E.C. Coupled thermal-mechanical-contact analysis of hot cracking in laser welded lap joints. J. Laser Appl. 2017, 29, 022412. [Google Scholar] [CrossRef]
- He, Q.; Wei, H.; Chen, J.-S.; Wang, H.-P.; Blair, E.C. Analysis of hot cracking during lap joint laser welding processes using the melting state-based thermomechanical modeling approach. Int. J. Adv. Manuf. Technol. 2018, 94, 4373–4386. [Google Scholar] [CrossRef]
- Mills, K.C. Recommended Values of Thermophysical Properties for Selected Commercial Alloys; Woodhead Publishing: Sawston, Cambridge, UK, 2002. [Google Scholar]
- Leitner, M.; Leitner, T.; Schmon, A.; Aziz, K.; Pottlacher, G. Thermophysical properties of liquid aluminum. Metall. Mater. Trans. A 2017, 48, 3036–3045. [Google Scholar] [CrossRef]
- Gaosheng, W.; Huang, P.; Xu, C.; Liu, D.; Ju, X.; Du, X.; Xing, L.; Yang, Y. Thermophysical property measurements and thermal energy storage capacity analysis of aluminum alloys. Sol. Energy 2016, 137, 66–72. [Google Scholar]
- Comini, B.; Comini, G.; Fasano, A.; Primicerio, M. Numerical solution of phase-change problems. Int. J. Heat Mass Transf. 1973, 16, 1825–1832. [Google Scholar]
- Muraca, R.F.; Whittick, J.S. Materials Data Handbook: Aluminum Alloy 5456; NASA Technical Report Server: Washington, DC, USA, 1 June 1972.
- Salman, H.A.; Hubeatir, K.A.; AL-Kafaji, M.M. Modeling of Continues Laser Welding for Ti-6Al-4V Alloys Using COMSOL Multiphysics Software. Eng. Technol. J. 2018, 36, 914–918. [Google Scholar]
- Hu, D.; Kovacevic, R. Modelling and measuring the thermal behaviour of the molten pool in closed-loop controlled laser-based additive manufacturing. Proc. Inst. Mech. Eng. Part B J. Eng. Manuf. 2003, 217, 441–452. [Google Scholar] [CrossRef]
- Gaskell, D.R. Introduction to the Thermodynamics of Materials, 5th ed.; CRC Press: Boca Raton, FL, USA, 2008; pp. 66–91. [Google Scholar]
- Bergman, L.T.; Incropera, F.P.; DeWitt, D.P.; Lavine, S.A. Fundamentals of Heat and Mass Transfer; John Wiley & Sons: Hoboken, NJ, USA, 2011. [Google Scholar]
- Zhao, N.; Yang, Y.; Han, M.; Luo, X.; Feng, G.; Zhang, G. Finite element analysis of pressure on 2024 aluminum alloy created during restricting expansion-deformation heat-treatment. Trans. Nonferrous Met. Soc. China 2012, 22, 2226–2232. [Google Scholar] [CrossRef]
- Patcharapit, P.; Onler, R.; Yao, S. Numerical and experimental investigations of micro and macro characteristics of direct metal laser sintered Ti-6Al-4V products. J. Mater. Process. Technol. 2017, 240, 262–273. [Google Scholar]
- Ramasamy, S. CO2 and Nd: YAG laser beam welding of 6111-T4 and 5754-O aluminum alloys for automotive applications. Ph.D. Thesis, The Ohio State University, Columbus, OH, USA, 1997. [Google Scholar]
- Moon, D.W.; Metzbower, E.A. Laser beam welding of aluminum alloy 5456. Weld. J. 1983, 62, 53s–58s. [Google Scholar]
- Rao, K.; Prasad, N.R.; Viswanathan, N. Partially melted zone cracking in AA6061 welds. Mater. Des. 2008, 29, 179–186. [Google Scholar]
- Homam, M.; Mohammad-Reza, N.; Seyed, A.; Seyedein, H.; Goodarzi, M.; Khodabakhshi, M.; Mapelli, C.; Barella, S. Modern fiber laser beam welding of the newly-designed precipitation-strengthened nickel-base superalloys. Opt. Laser Technol. 2014, 57, 12–20. [Google Scholar]
- Srikanth, B.; Klingbeil, N.W.; Kobryn, P.A.; Fraser, H.L. Effects of process variables and size-scale on solidification microstructure in beam-based fabrication of bulky 3D structures. Mater. Sci. Eng. A 2009, 513, 311–318. [Google Scholar]
- John, G.; Chakravarti, A.; Bibby, M. A new finite element model for welding heat sources. Metall. Trans. B 1984, 15, 299–305. [Google Scholar]
- Lu, S.-Z.; Hunt, J.D. A numerical analysis of dendritic and cellular array growth: The spacing adjustment mechanisms. J. Cryst. Growth 1992, 123, 17–34. [Google Scholar] [CrossRef]
- Kurz, W.; Fisher, D.J. Dendrite growth at the limit of stability: Tip radius and spacing. Acta Metall. 1981, 29, 11–20. [Google Scholar] [CrossRef]
- Xiaoqing, W.; Gong, X.; Chou, K. Review on powder-bed laser additive manufacturing of Inconel 718 parts. Proc. Inst. Mech. Eng. Part B J. Eng. Manuf. 2017, 231, 1890–1903. [Google Scholar]
© 2020 by the authors. Licensee MDPI, Basel, Switzerland. This article is an open access article distributed under the terms and conditions of the Creative Commons Attribution (CC BY) license (http://creativecommons.org/licenses/by/4.0/).