1. Introduction
Transport properties of metals, electrical resistivity and thermal conductivity, are topics of considerable interest in physics, as they are, for example, essential parameters for modeling planetary cores and their structure. For the resistivity of solid and liquid phases of metals, there exists a collection of data, well summarized in [
1]. These results are based on works for specific metals, such as the Matula experiments with copper and other metals [
2]. There are also data on platinum and iron, the metals used in this work.
In fact, measurements in different works [
3,
4] give a range for bulk platinum resistivity between 10 and 60 × 10
m when its temperature increases from standard values to liquefaction. These measurements are an extension of those published by Powell et al. [
5] ranging from −200 to 100 Celsius degrees, where they report values going from 10 to 20 × 10
m.
Results for resistivity of iron solid and liquid phases also exist and have been published. The work by Powell [
6] gives a value for the iron resistivity at liquid phase of 125 × 10
m, reached after an initial value for the solid iron under 25 × 10
m, which is in agreement with calculations and experimental data shown by other groups, both recently and years ago [
7,
8].
Plasma of different metals also had been studied and there are some works available. For example, the review article from Lebedev et al. [
9] showing data on liquid metals at high pressures, up to 4
atm. On the other hand, Milchberg et al. [
10] measured the resistivity of aluminum up to a temperature of 10
K, with no significant changes in the density due to sample heating with a laser beam which prevents the metal expansion during the measurement time. De Silva and other collaborators [
11,
12] had studied experimentally the resistivity of dense copper and aluminum plasmas, also evaluated by Miki et al. [
13] in a different range of parameters, by means of an exploding wire setup with the wire surrounded by water or glass capillaries. Later on, Sheftman and Krasik [
14] used a similar setup to further extend results on copper, aluminum and tungsten. So among the methods to create plasma, lasers can reach temperatures and pressures in large values, up to kiloelectronvolts and mega-bars, respectively, that the exploding wire cannot reach. Conversely, lower plasma pressure and density values are possible to produce with exploding wires setups.
On the contrary, to the knowledge of the authors, there are no experimental data published on the resistivity of metal gases such as iron and platinum. In this work, following the method developed for an exploding wire setup by the authors [
15], and previously used to measure the resistivity limits of copper metal gas [
16], further measurements of resistivity limits for gases of iron and platinum are presented.
In the experimental conditions described in [
15,
16], a neutral classical gas is formed with energy density of few hundreds of kJ per mol and pressure below 100 atm, that expands against the surrounding air. Under this condition, the gas phase grows at the expense of the self-heating solid-liquid core, a process well described in previous works [
17,
18]. In a similar manner to other gases, electrical resistivity of metal gases is larger than in their solid phase.
It is not easy to configure the exploding wire experiment in order to obtain the above-mentioned evolution. First, it must be a balance between the wire vaporization time and the current rising time in order to avoid arcs and shorts that can be produced by fast enough discharges. Therefore, electrical energy delivery and time in which this energy is delivered are among the main parameters to control this balance. In these experiments, maximum energy provided was on the order of 100 Joules, and the time for energy delivery is on the order of 2 s.
Second, wire geometry and mass are important factors, as if the wire were too short, the gas phase would be so short that it could not be easy to measure it (at least not with the available diagnostics). On the other hand, if the wire has a diameter that is too large, then the electrical current Joule heating of the solid and liquid phases would not be radially homogeneous.
Finally, in accordance with the previous reasoning, the electrical current delivery time cannot be too fast, again, in order to obtain metal gas in a time scale long enough as to measure them. Therefore, typical electrical current rates for exploding wire setups, from 50 to 100 A/ns or higher [
19], are too fast for the experiments presented here and need a much slower current rate of a maximum of
A/ns. As a result, it is not easy to achieve an electric discharge on the wire so as to have a relatively long gaseous transition (dark pause). Then, for each material, there is only a narrow range of parameters where this can be achieved.
As it is more clearly explained in our previous work [
15], the gaseous phase of the metal is not fully homogeneous due to different causes. One of the most important sources of inhomogeneities in the expanding phase is the fact that current distribution is not radially homogeneous, and changing dynamically. On the other hand, the central part of the expanding wire could be in a totally different phase, being a hot liquid that converts in the expanding gas, at least in the first moments of the gas expansion. Furthermore, it is worth mentioning again that the resistivity limits presented in this work are based on measures about the external layer of the expanding gas, therefore, the internal composition of this phase or its different densities do not affect the measurements presented here.
Furthermore, although less probable, it is possible that part of the gas reacts with the oxygen in the air to form metal oxides. In order to eliminate this latter effect, experiments should be made in an inert atmosphere, with argon for example. Such experiments are currently beyond the scope of this work. In our experiments, we use three voltages to charge the capacitor bank described in the previous section, so the oxidized metal gas percentage must be dependent on the voltage because of its dependence on the total energy provided to the metal gas. Our experiments show small to no such effect in the obtained values; otherwise, the dispersion on the error would be proportional to the charging voltage, a behaviour not present in our experiments.
2. Experimental Setup
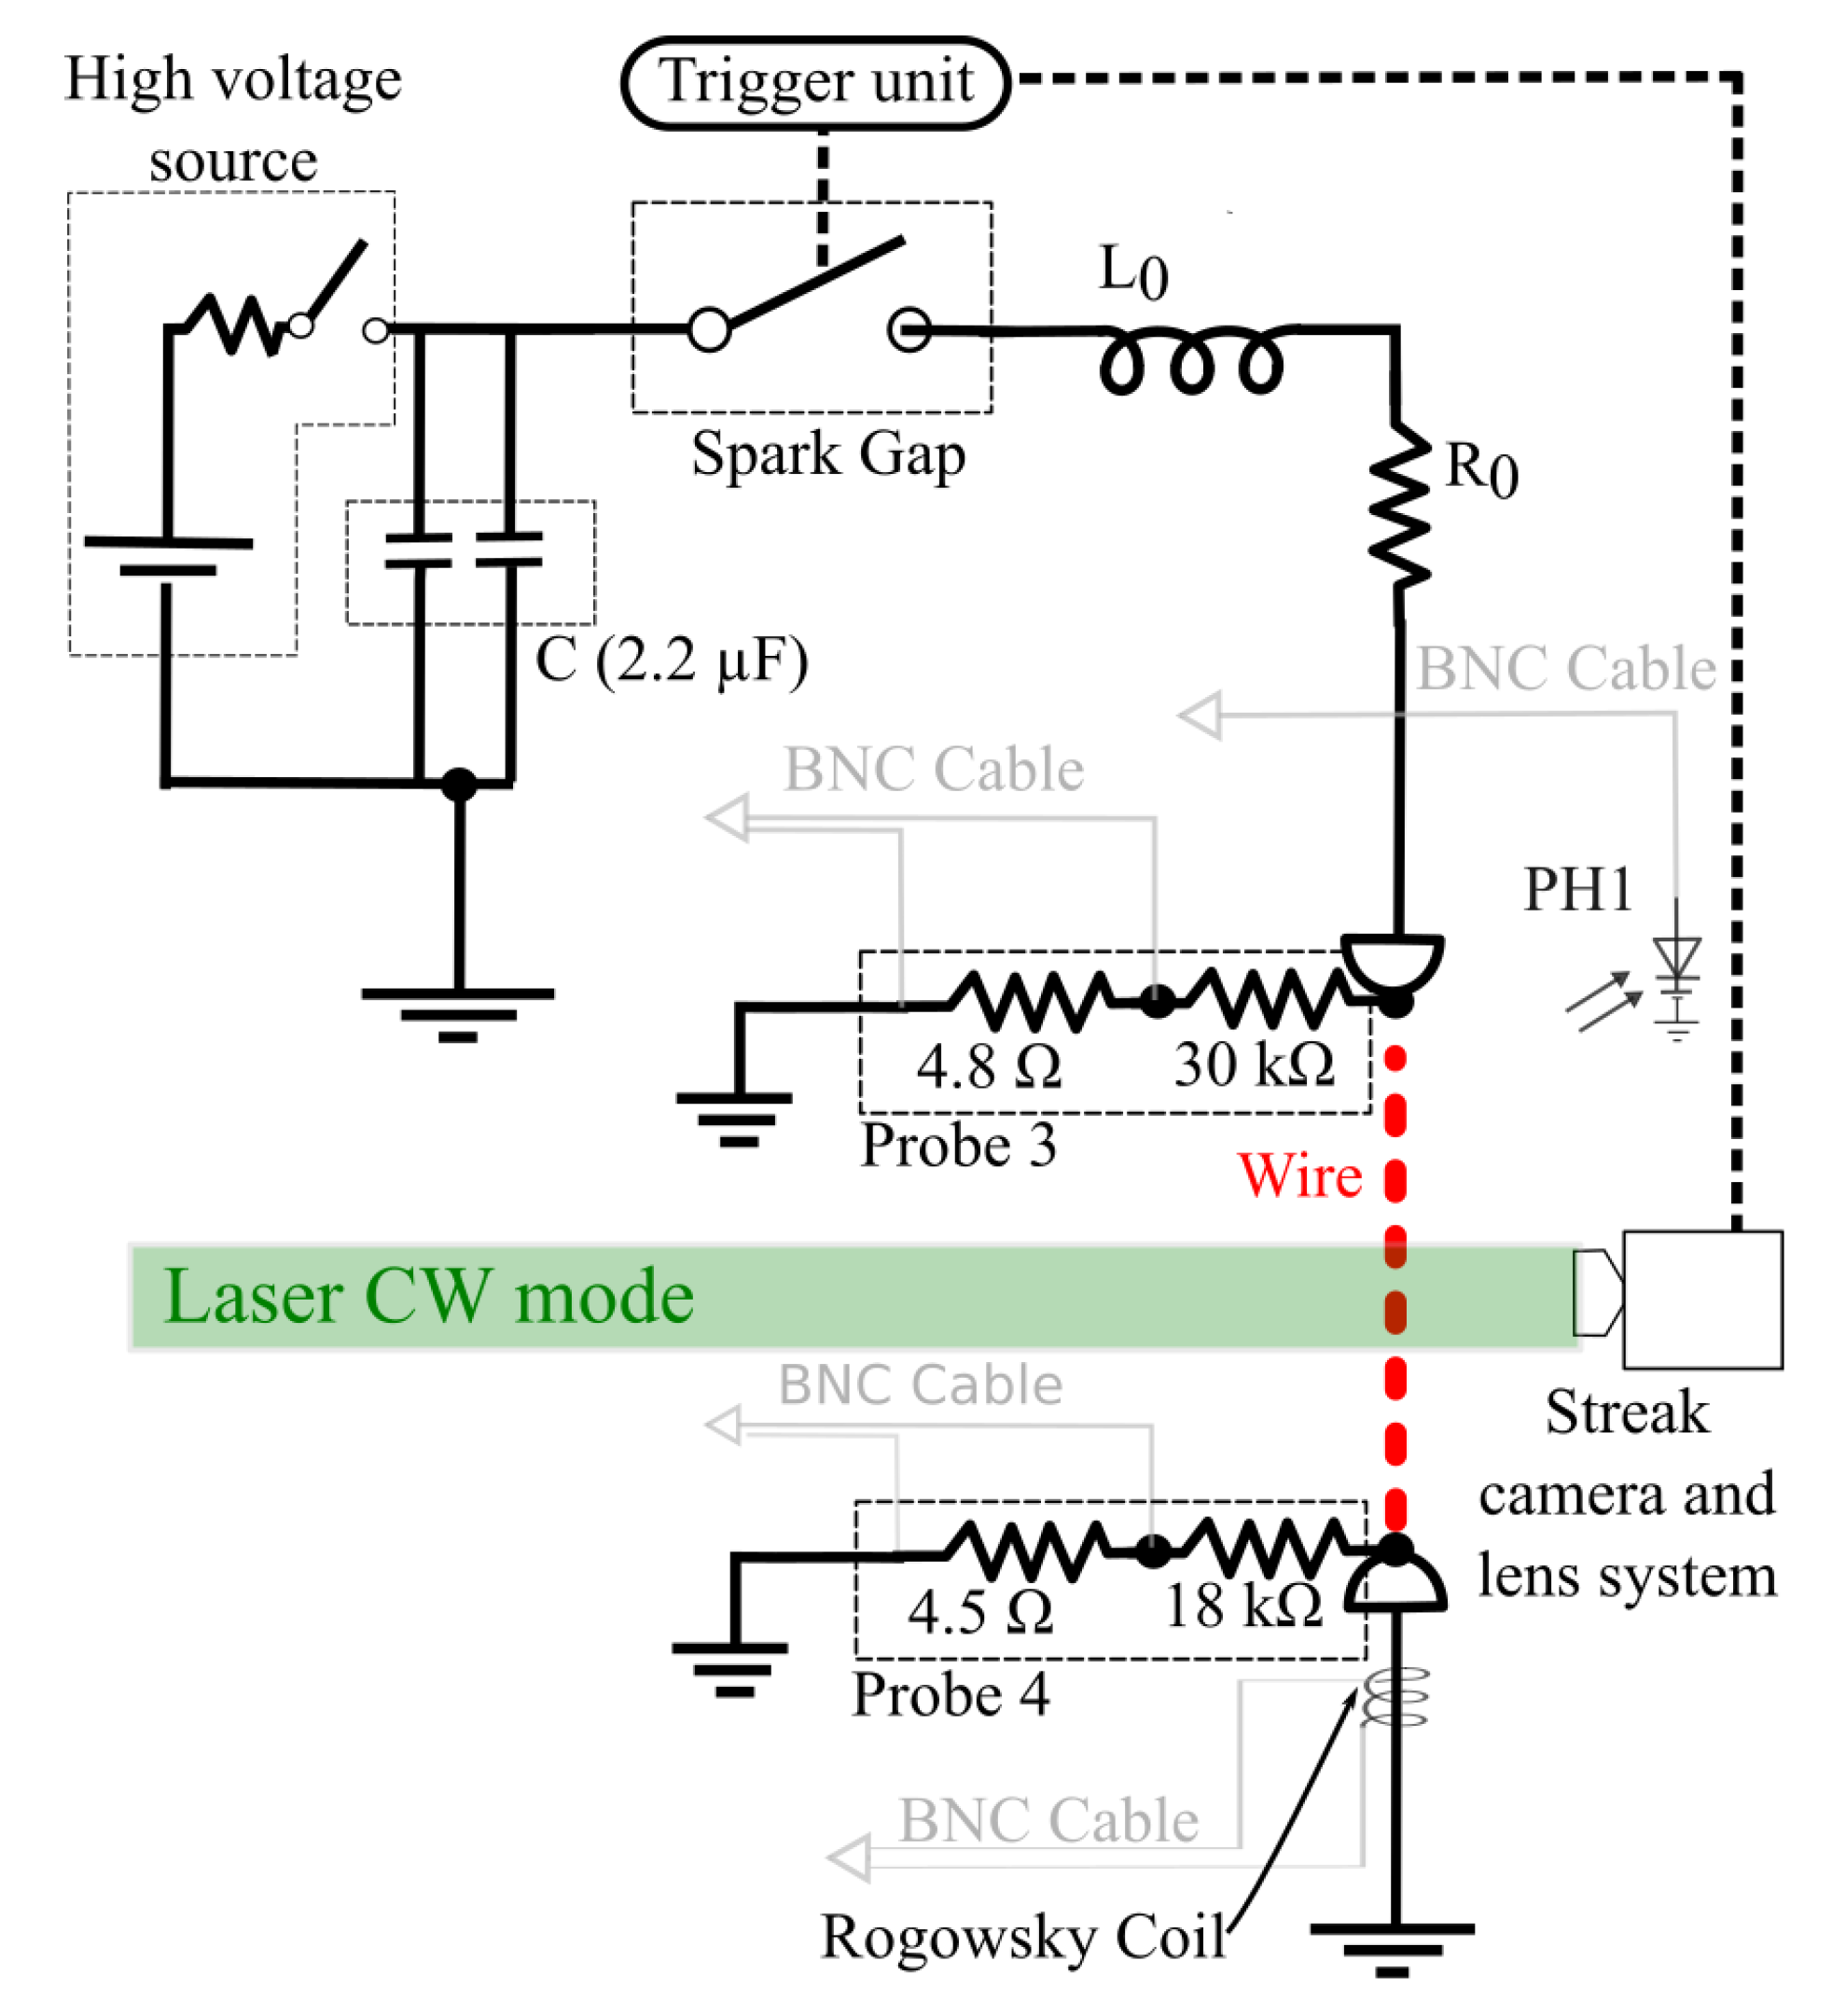
Experiments described here were performed in the ALEX (ALambre EXplosivo, exploding wire in Spanish) exploding wire system located at the INEI, University of Castilla-La Mancha, Spain, following previous works as already commented in the introduction. Metallic wires of iron and platinum with fixed diameter and lengths, 125 m and 56.9 ± 0.1 mm, respectively, were used. In order to measure the resistivity limits in different experimental situations, voltage in the capacitors bank was changed between 10, 15, and 20 kV.
To produce the intense currents necessary in the experiments, ALEX uses a capacitor bank with two capacitors in parallel, of 1.1
F each, and a maximum voltage on the order of 60 kV. Connected in series with a high voltage source, through a Spark Gap synchronized unit, the capacitor bank discharges the electrical current through the metallic wire. This discharge is synchronized with the streak camera unit, as shown in
Figure 1.
Voltage dividers (“Probe 3” and “Probe 4”) and the Rogowski coil, as quoted in the figure, record the voltage and current over time in oscilloscopes placed at a Faraday cage room far from the experiment. These and other electronic control equipment are placed inside this Faraday cage to prevent problems associated with the electromagnetic wave noise produced by the explosion of the wire in open atmospheric air.
Data from these probes are calibrated to give the actual measurements of voltage and current circulating through the wire, and are later used to calculate the resistivity limits for the wire metal, as explained in the next section of this work. Current measurements employed in this work are analog integrates, by means of a passive RC circuit, from the Rogowski coil signal made before its recording in the oscilloscope. Therefore, current signals do not need any numerical treatment beyond the multiplication by the calibration factor.
It is worth to mention that in order to obtain the resistivity limits, current measurements must be very precise on the dark pause stage. So the chosen current sensor must work either on a large scale, from Amperes to kiloamperes in our experiments, or dismiss the largest current values appearing out of the dark pause; this last approach was used in this work as shown in
Figure 2. On the other hand, as the Rogowski coil provides the current derivative, it is a common experimental practice to make a numerical integration of the result to obtain the current that usually must be corrected because of a constant bias in the current signal. Such an approach cannot work in these experiments because the current signal bias is not constant and has random variations. Therefore, an analog integration of the current signal by a passive RL circuit before the scope input was used.
To calculate the resistivity limits of metal gases, it is also necessary to measure (with great detail) the dynamical behavior of the radial expansion of the gas. Such task is performed with retro-illuminated streak images in this work. Continous-wave laser light of 532 nm wavelength, depicted in
Figure 1, was used as light source, producing streak images like the one shown in
Figure 3. As this streak photo shows, thanks to the simultaneous recording of the diameter expansion, vertical dimension, and the time at which such diameter size appears, horizontal dimension, the radial expansion of the gas phase of the metals can be examined as a function of time, therefore synchronizing it with electrical energy proportioned to the wire and other magnitudes. As can be seen in the mentioned streak image, a shock wave in air is produced by the gas expansion and separates from the metal gas at later times recorded by the camera. Values considered for the radial expansion of the metal gas were taken only from the inner darker part of the image that corresponds to the metal gas.
As streak images record behavior of the metal gas expansion in time, differences due to charging voltage in the capacitors’ bank arise in the images. A most prominent feature is that the gas phase time shortens as the charging voltage increases, leading to the different time scales that are shown in
Figure 4 for platinum wires.
Signals of Voltage probes, Rogowski coil and its analog integration are recorded with the same time base provided by the oscilloscopes, so in order to synchronize them with the streak images, the photodiode signal PH1 is used.
3. Resistivity Limits Model and Results
Although details of the model and hypothesis that lead to the resistivity limits had been previously published by the authors [
15], it is useful to include a short review of the model.
Usual exploding wire systems can be classified, among other parameters, by the power that is able to deliver, fully dependent on the capacitors’ bank and external circuit. Broadly speaking, they are divided into slow and fast systems; slow with less than 50 A/ns of current derivative and fast when the current is higher than 100 A/ns, respectively [
20]. When the electrical discharge in the circuit is slower even than the limit previously mentioned, then phase transformation of the metallic wire from solid to plasma state can be tuned up to stand for a time as long as microseconds. Under these experimental conditions, the intermediate metal gas state lasts long enough as to allow for its study.
When most of the wire material is in the gaseous state, and due to the larger resistivity of this phase, current passing through the wire halts and reaches a minimum: a situation frequently described in the literature as dark pause [
21,
22]. As previously mentioned, this phase is the object of this work.
General conditions to obtain a large dark pause sufficient to allow for measurements of metal resistivity limits is not an easy endeavor. The current derivative impose strong limitations: it cannot be so slow as to avoid the phase transformations of the metal, and simultaneously cannot be so high that the vapor phase is too short making the measurements difficult. Therefore, a maximum value of ≈10 A/ns has been used during these experiments.
On the other hand, the geometry of the wire must also be carefully tuned-up, as it is linked to the wire mass through the wire volume, which must be converted in a large percentage in vapor to reduce the difference between the upper and lower resistivity limits, as explained latter in this section. Therefore, as a first approximation, dimensions of the wire should be larger than usual in exploding wire systems to perform these experiments; for example, length on the order of 10 centimeters. Furthermore, the diameter cannot be very thin, ≈10 m, because then the dark pause will be too short, or too thick, ≈250 m, to minimize inhomogeneities in the wire expansion after the beginning of its conversion to a metal gas phase. Due to practical reasons, diameters smaller than 100 m are not used in this experiment, and the wire length is locked at the value mentioned above (56.9 ± 0.1 mm).
Following our previous works, a lower bound of the metal gas resistivity can be written as [
16]:
with
the resistive voltage across the wire,
the expanding radius measured by the streak, and
I the electrical current flowing through the wire system. To arrive to this equation, it is necessary to consider the wire expansion as inhomogeneous, with a gas produced from an internal liquid core being ablated by the electrical current. Then, the total resistivity of the circuit can be considered as the parallel of two very distinctive states of the same metal: an external gas and the inner liquid core, or an equivalent phase. Therefore, (
1) gives the lower limit of the metal gas resistivity.
To obtain an upper limit of the resistivity based on the measurements of radial expansion and resistance, it is necessary to use the system thermodynamics. As explained in the previously cited article, the total internal energy given to the material can not be larger than the electrical energy absorbed by it, and taking into account that the gas suffers an expansion against a constant atmospheric pressure, the upper limit for the resistivity can be written as:
where
is the moment in which the wire starts to boil,
n the number of moles in the gas state,
l the length of the system (constant and equal to the initial wire length, as wire expansion can be considered cylindrical),
the molar heat capacity at constant pressure,
the boiling temperature of the metal, and
the latent heat of vaporization. Considering that both temperature and number of moles of the gas monotonically increase with time during the dark pause, a first approach for evaluating the upper limit of the resistivity, given by (
2), is by assuming a linear dependence with time. This approximation holds true within 20% according to numerical simulations [
16].
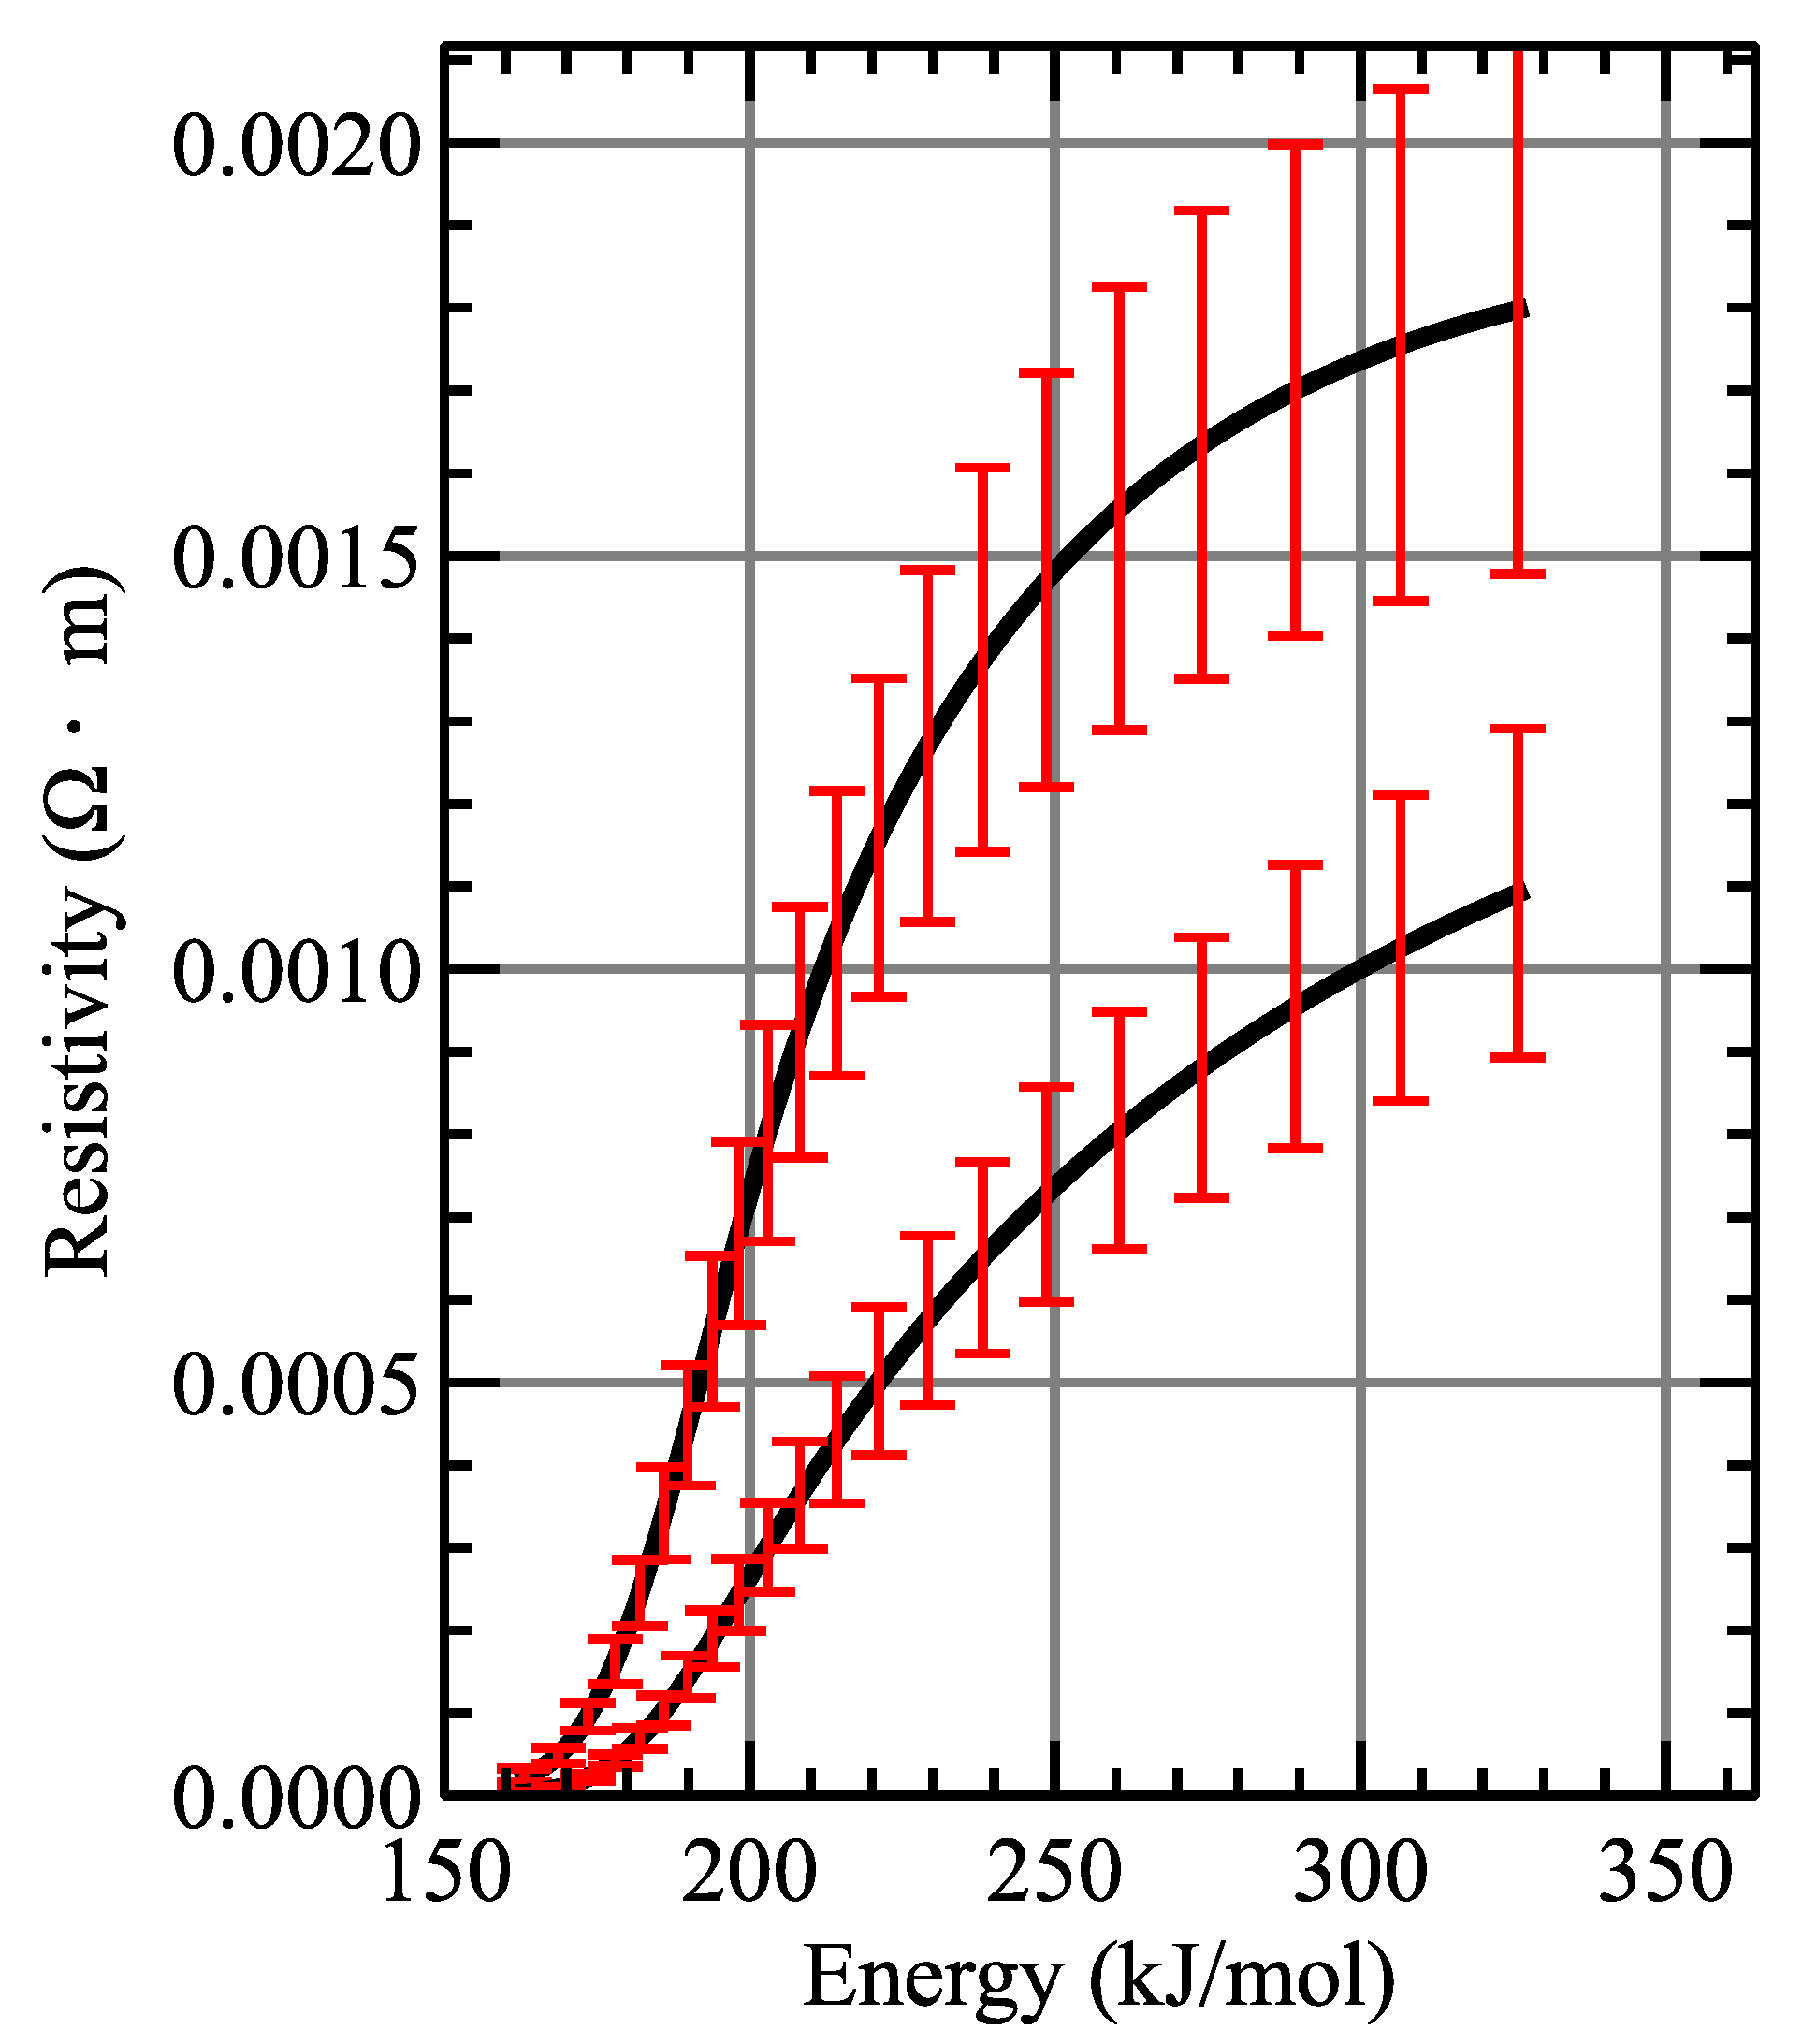
The result of the measurement of the resistivity limits of iron and platinum are plotted in
Figure 5 and
Figure 6. The maximum resistivity value which was measured for iron reaches up to 0.03
m, meanwhile, in the case of platinum, the maximum values achieved are about twenty times smaller than that (in the order of 1.4
m). In both figures, it is possible to appreciate that the obtained gas resistivity of both metals is much larger, by several orders of magnitude, than their solid and liquid counterparts. Such difference is to be expected, as the gas is a much better insulator than the solid or liquid phase of the conductor. Solid iron presents a resistivity on the order of 10
m, compared with a maximum of ≈0.03
m recorded for the gas. A similar trend is observed with platinum; its solid resistivity is on the same order of magnitude as iron, but its gas resistivity reaches a maximum of ≈1.4
Ohm·m. Therefore, even for the most favorable case of platinum, the gas resistivity is three orders of magnitude larger than in the solid state.
At the end of the dark pause, most of its energy can be considered as internal energy, since the expansion is much slower (or even has stopped) relative to the beginning. This leads to the upper limit approaching the actual value of the resistivity. At the same time, taking into account that at that time the liquid phase has decreased significantly (or disappeared), it also causes the lower limit to approach the real value of the resistivity. This is seen on the graphs where the differences between upper and lower limit curves decrease with time. The above graphs also show that the above-mentioned hypotheses of linear dependencies with time are quite reasonable, since, for example, an overestimation of the amount of moles in the gaseous state could make the upper limit lower than the lower limit, while an underestimation could lead to a very high upper limit.
It is worth to discuss the energy scales of the obtained resistivity, as they provide useful information about the final metal vapor stage achieved. Enthalpy of fusion and vaporization of iron is 343 kJ/mol, a value close to the final value measured of the energy absorbed by the wire in our experiments. Therefore, measured resistivity values that are presented here are representative of the whole gaseous phase of the material. Such is not the case for platinum, as its fusion and vaporization enthalpies reach a value of ≈532 kJ/mol. Resistivity measurements presented in this work are halted at ≈330 kJ/mol, therefore these values do not include the whole range of energies that platinum can reach [
23].

