Article

Investigation on Strength and Microstructural Evolution of Porous Cu/Cu Brazed Joints Using Cu-Ni-Sn-P Filler

1
Department of Mechanical Engineering, University of Malaya, Kuala Lumpur 50603, Malaysia
2
Centre of Advanced Manufacturing & Material Processing (AMMP Centre), University of Malaya, Kuala Lumpur 50603, Malaysia
3
Department of Materials Science, School of Engineering, Tokai University, Kanagawa 259-1292, Japan
*
Author to whom correspondence should be addressed.
Metals 2020, 10(3), 416; https://doi.org/10.3390/met10030416
Submission received: 12 January 2020 / Revised: 29 February 2020 / Accepted: 2 March 2020 / Published: 24 March 2020

Abstract

:
Porous Copper (Cu) was brazed to Cu plates using Cu-9.7Sn-5.7Ni-7P amorphous filler metal. The effects of brazing parameters on the porous Cu and brazed joints were investigated. The furnace brazing temperatures employed were 660 °C and 680 °C, and the holding times were 10 and 15 min. After brazing, the microstructure was analyzed using Scanning Electron Microscope (SEM) equipped with Electron Dispersive X-ray Spectroscope (EDS). SEM results showed that the thickness of the brazed seam at the base joint decreased with increasing temperature and time. At low brazing temperature, microvoids and cracks were observed at the joint interface. The microvoids and cracks disappeared in the sample brazed at 680 °C for 15 min, and higher diffusion of the filler was noted in the overall bonded region. The formation of Cu-P, Cu-Ni, and Ni-Sn phases at the joint interface was validated using X-ray diffraction. The phases formed increased the hardness of the brazed joints and porous Copper. It was observed that the rigidity of porous Copper tends to increase due to surface hardening effects. The rigidity of porous Cu after brazing is important in ensuring minimal deformation during cooling device servicing, which is an integral feature of prospect product development.

Graphical Abstract

1. Introduction

Improving heat transfer in thermal devices like heat exchangers has become a vital point of focus in the industry. Several studies [1,2,3,4] have been carried out to optimize the size, layout, and shape of devices to improve the heat-transfer characteristics. Another way to enhance heat transfer is to use a porous material, which may be crucial in thermal management applications due to its high surface-area-to-volume ratio, low relative density, and high fluid permeability. Potential applications of porous materials include electronics cooling equipment such as heat sinks, cooling turbine blades, chemical processes, and high-efficiency heat exchangers. Porous Copper (Cu) is an ideal metal for use in heat exchangers and heat sinks because past studies show that it exhibits enhanced thermal properties, such as higher thermal conductivity and convective heat transfer coefficients, compared to base metal [5,6,7]. Among different types of heat sinks, those utilizing microchannels are anticipated to exhibit excellent cooling performance as small channel diameters can boost the heat-transfer capacity. Compared to conventional materials, the most important feature of porous Cu foam is its light weight, due to the presence of multiple voids within. These pores are known to exhibit several interesting combinations of physical and mechanical properties, such as resistance to thermal shock and excellent noise attenuation [8,9,10,11].
Porous metals are studied as a promising alternative in compact heat exchangers due to their superior thermodynamic characteristics. Qu et al. [12] investigated the natural convection in porous Cu with different pore densities (10–40 PPI) and porosities (0.90–0.95) and discovered that the heat-transfer rate increases with decreasing pore density and porosity. Moreover, heat-transfer performance is enhanced with increasing height due to the greater surface area. In another work, Ogushi et al. [13] investigated the heat-transfer capacity of three types of porous Cu heat sinks. The researchers found that the heat-transfer capacity of lotus-type porous Cu is four times greater than conventional groove fins and 1.3 times greater than microchannel heat sinks with the same pumping power.
More recently, Zhang et al. [14] experimentally investigated the heat-transfer performance of a lotus-type porous Cu heat sink. During sample production, the lotus-type porous Cu was joined to a pure Cu plate by diffusion welding and vacuum brazing in the heat sink test section. Compared to vacuum brazing, the force applied in diffusion welding leads to slight deformation. Therefore, the brazing method was employed to fabricate all heat sinks owing to the higher productivity and lower cost. However, an investigation by Boomsma et al. [15] revealed that greater heat transfer comes at a large cost on account of the escalated pressure drop. They reported that part of this pressure drop escalation is due to brazing imperfections. As the pores are compressed further and the cells become smaller, the brazing material fills some of the cells near the plate entirely. Thus, careful preparation prior to brazing is essential to reduce brazing imperfections.
Bastarows et al. [16] investigated the heating of a foam-filled channel for electronics cooling applications. The experimental method involved conductive thermal epoxy bonding and brazing of the metal foam to a heated plate. The test results showed that in contrast to the epoxy-bonded samples, the brazed metal foam prevailed upon heat removal. Nawaz et al. [17] studied open-cell aluminum metal foam as a compact replacement for conventional fins in brazed aluminum heat exchangers. The authors demonstrated that metal foams show promising potential, especially in the targeted application for air-cooling systems. They pointed out that the bonding method is significant in that contact resistance can have a considerable role in structures that are not brazed. The literature presented above indicates that different types of porous metals are being utilized in cooling devices. The joining of stainless steel and aluminum foams has also been studied previously in terms of the microstructural and mechanical properties of brazed joints [18,19]. Brazing has been identified as the most suitable method of joining porous metal and substrate as it facilitates good bonding between them and enhances heat transfer significantly [20]. However, studies on the microstructure characterization and mechanical properties of joints brazed using porous Cu have not yet been reported in the literature. The successful joining of porous Cu to a Cu plate is substantial when considering porous Cu in the design of cooling devices such as heat exchangers.
Brazing is a reliable and efficient way of joining metals by using a filler metal with a lower melting point than the parent material, such that fusion with the parent material does not occur. Brazing has the advantage of capillary action in penetrating the joint gap between parent materials. In this research, brazing was conducted to join an open type of porous Cu foam to a Cu plate. A single piece of filler metal was placed at the base to join the base and top side, creating a closed-cell sandwich structure. The focus of this research is to investigate the effects of brazing parameters (temperature and time) on porous Cu and the brazed joint interfaces for the potential application of porous Cu as a heat exchanger.

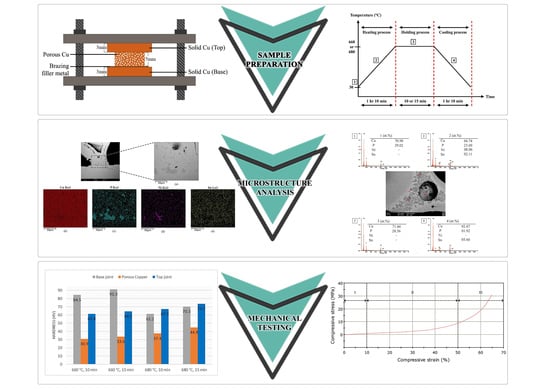
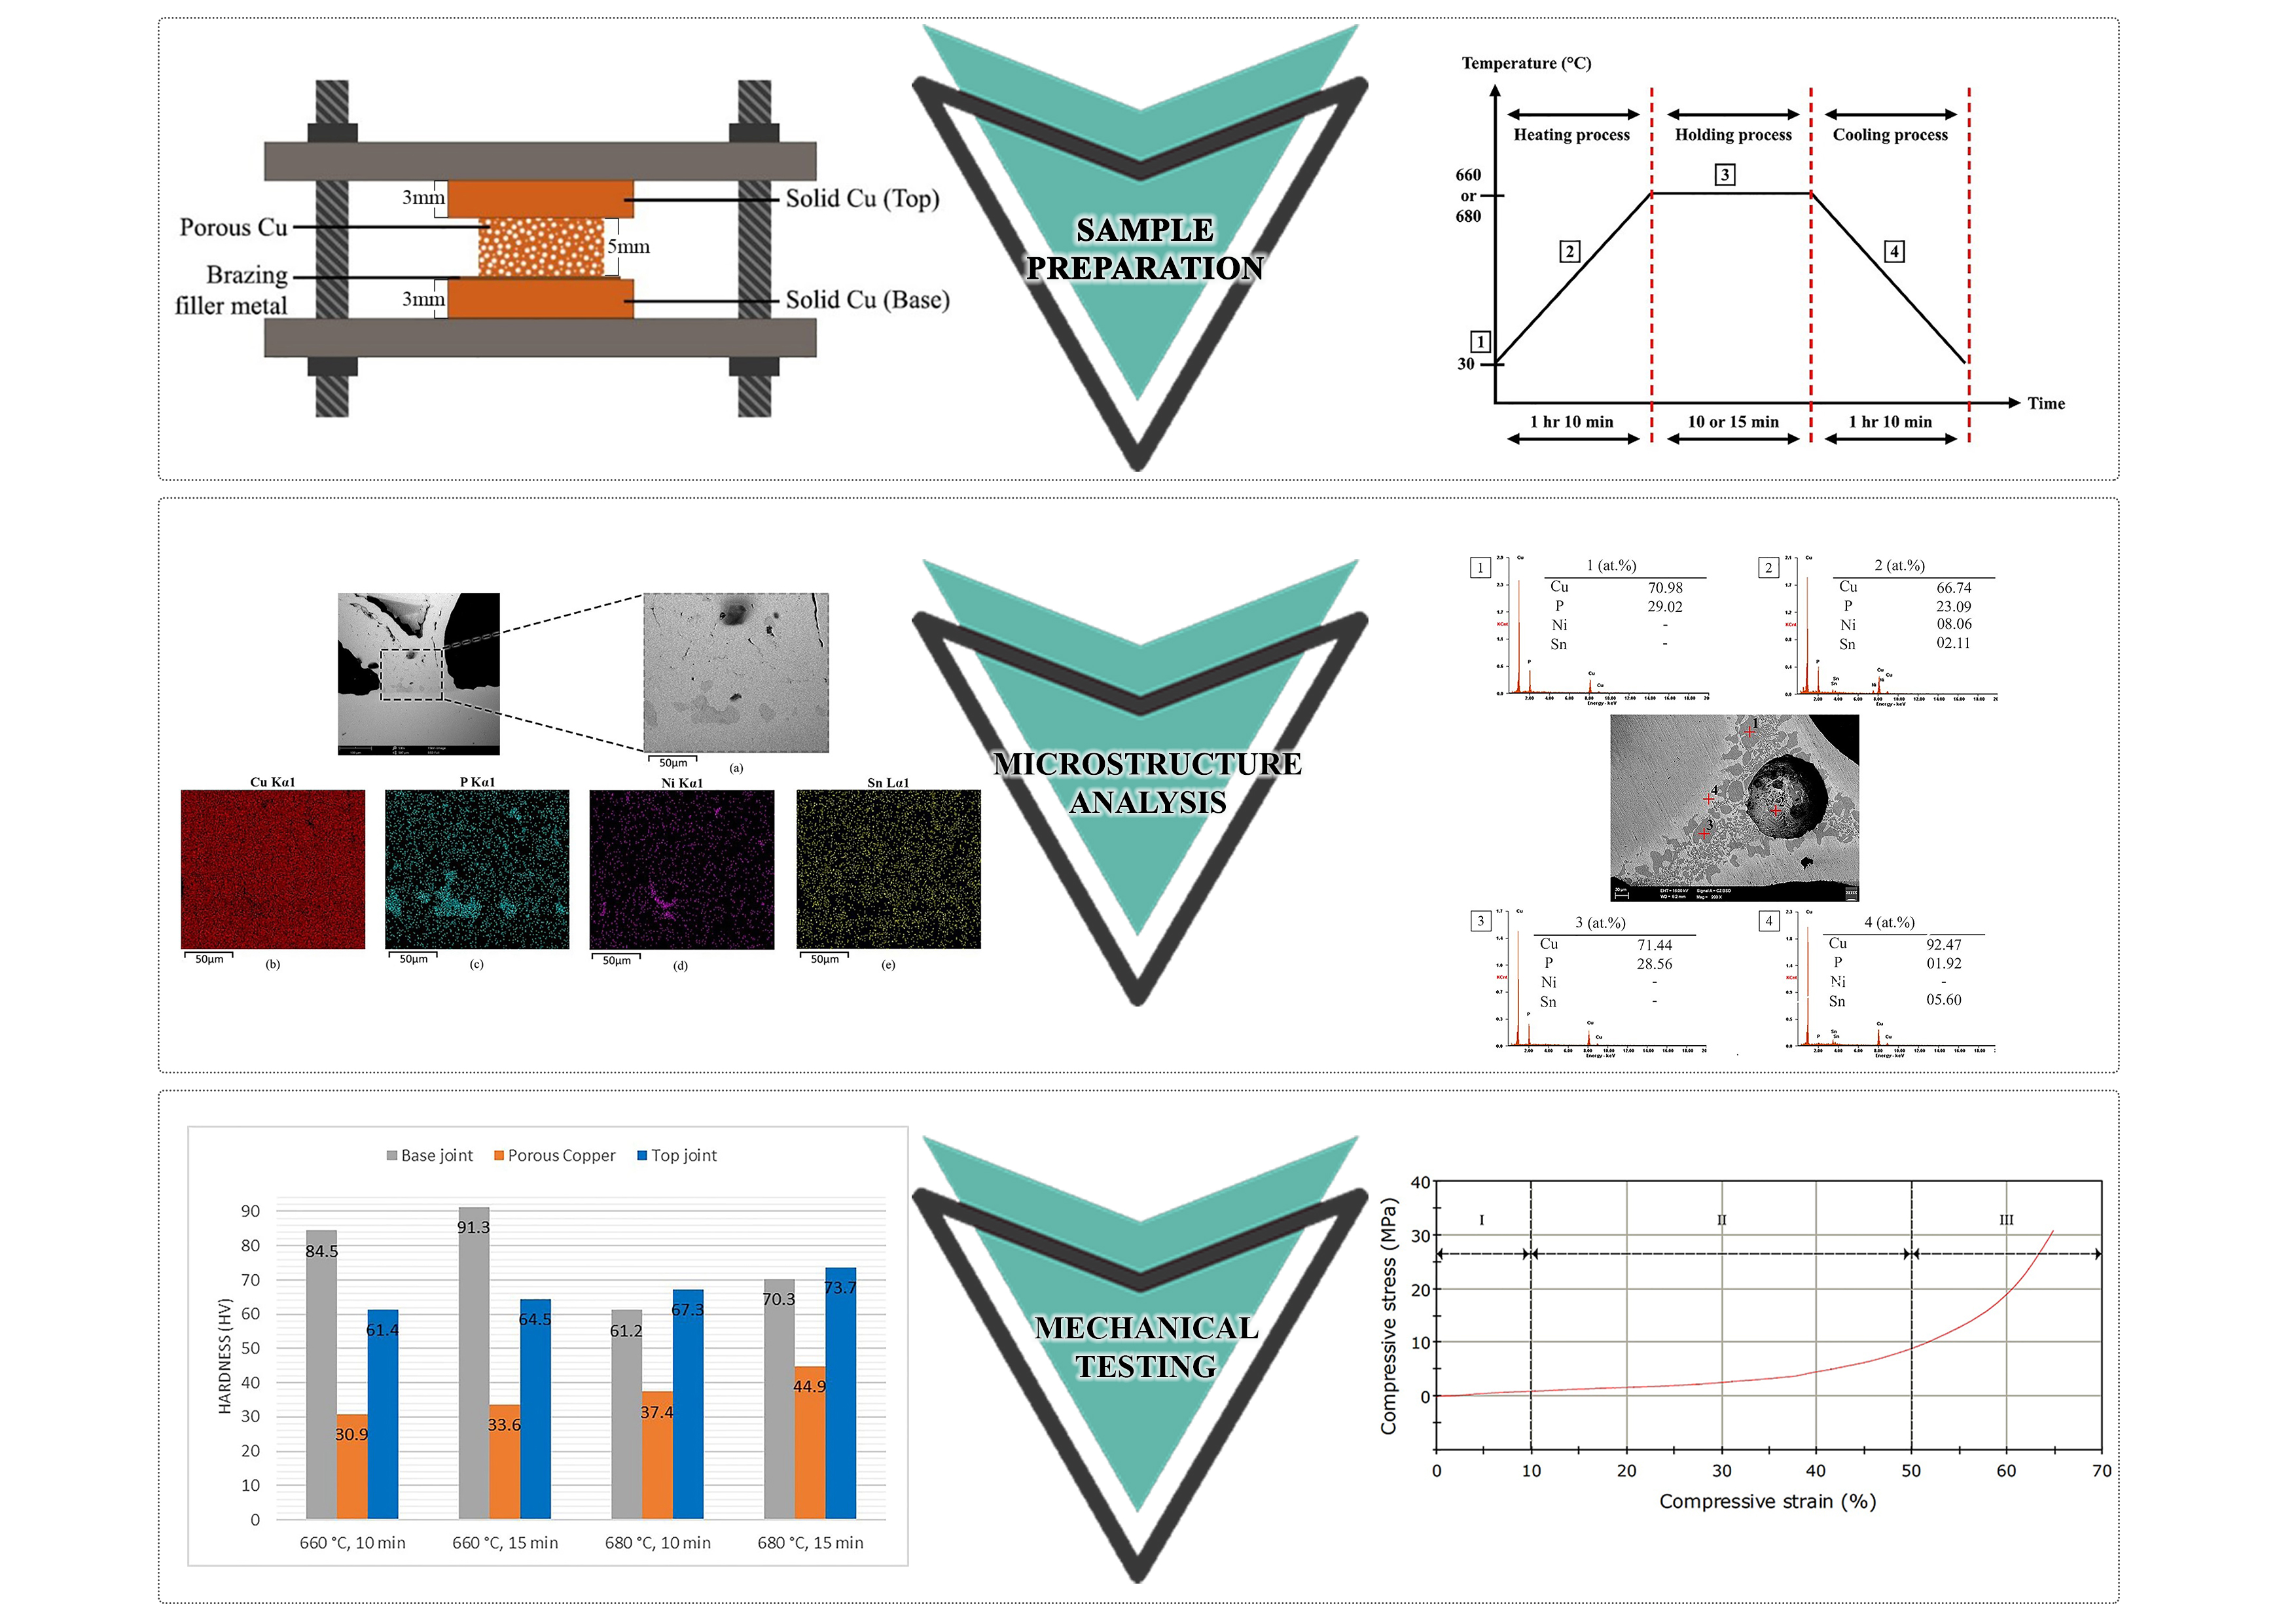
2. Materials and Methods

The specimens used were commercially available pure solid Cu plates (99.9 wt.%) and porous Cu (15 PPI); these were cut using wire Electrical Discharge Machining (EDM) into 15 × 15 × 3 mm3 and 10 × 10 × 5 mm3 parts, respectively. Porous Cu employed in this research was produced by the precipitation of supersaturated gas dissolved in the molten metal during solidification. The metal to be foamed was melted in an autoclave with a controlled pressure of hydrogen, so that the melt became saturated with hydrogen. The melt was then directionally solidified and, as it cooled through the solid-gas eutectic point, it became supersaturated. A piece of Cu-based filler metal (MBF 2005) was prepared. The 50 μm thick, 13 × 13 mm2 piece had a composition of Cu-9.7Sn-5.7Ni-7P wt.%. The solidus and liquidus temperatures of the filler metal are 595 °C and 635 °C, respectively [21]. Several advantages, including extremely high chemical and phase homogeneity, good wettability, and narrow melting and solidification ranges have been reported for this amorphous filler metal manufactured by the rapid solidification process [22]. The filler metal has high corrosion and wear resistance due to the presence of Ni, Sn, and P. The specimens were stacked in sandwich configuration in a specific clamp system (Figure 1).
Prior to brazing, the solid Cu surface was scrubbed with 800 grit SiC paper and the porous Cu was immersed in a diluted solution of 5% sulfuric acid and distilled water to obtain an extremely clean, oxide-free surface. The samples were brazed at two temperatures, 660 °C and 680 °C. The holding time was 10 and 15 min [23]. For the brazing process, the average heating and cooling rates were set at 10 °C/min. Brazing was carried out in a tube furnace equipped with argon gas and a heating controller. This equipment allows the introduction of argon gas to control the atmosphere [24]. Industrial grade argon gas was applied at a rate of 3.5 L/min. The brazing profile in terms of 4 brazing stages is shown in Figure 2.
For microstructural characterization, the study was conducted on one sample per parameter. The samples were ground with abrasive 300–2400 grit SiC papers. The samples were polished with 0.5 µm MicroPolish alumina suspension until a mirror finish was attained. The microstructure was characterized using a Scanning Electron Microscope (SEM) model Phenom Pro X Desktop equipped with an Electron Dispersive X-ray Spectroscope (EDS). The built-in software used for analysis was Phenom World. An X-Ray Diffractometer (XRD) model PANalytical Empyrean was employed for testing, while HighScore software was run for analysis to identify the elements and phases. Vickers microhardness test analysis was carried out under a load of 100 g for a duration of 5 s. The microhardness tester model used was HMV 2T E, Shimadzu. The brazed samples were subjected to compression by an Instron Universal Testing Machine (Model 3369). The samples had an initial thickness of 5 mm and final thickness of 2 mm. The crosshead speed of the mounted jig was set to 0.25 mm/min. The software version Bluehill 2.0 was used for compression test analysis.

3. Results

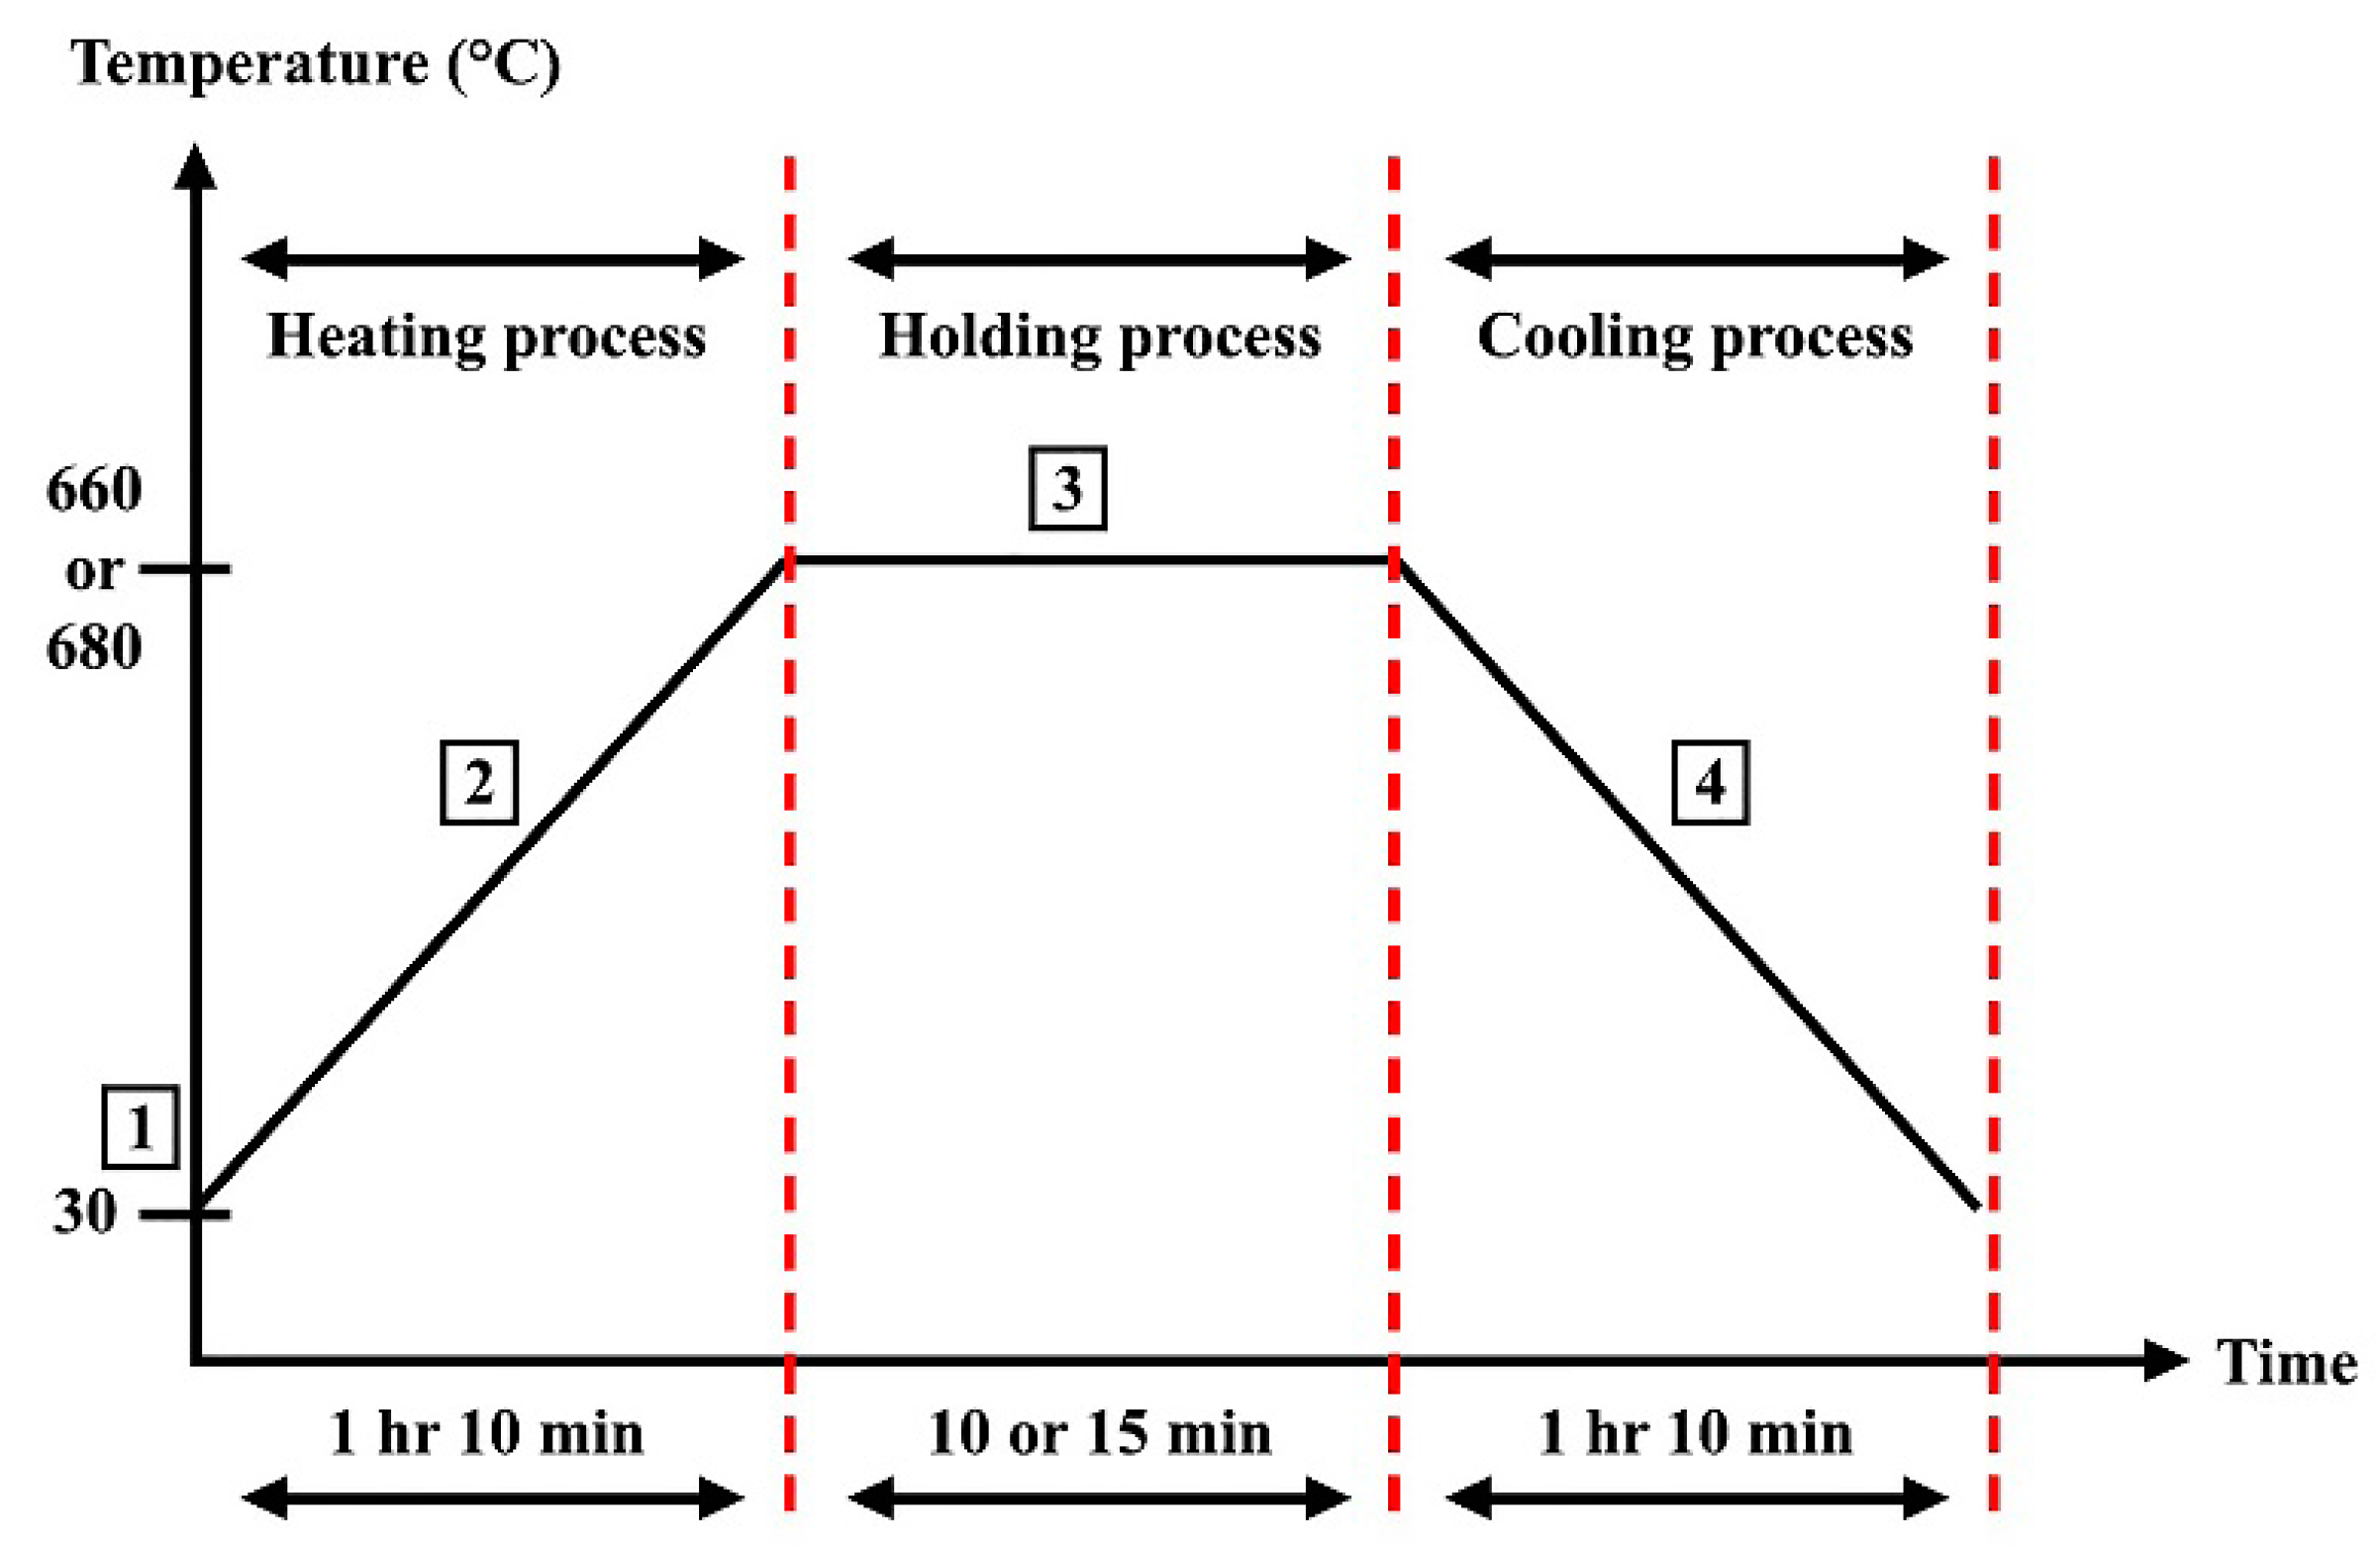
3.1. Effect of Brazing Parameters on the Microstructure of the Brazed Joints

Figure 3a–h presents the interfacial microstructure of Cu/Cu-Ni-Sn-P/Porous Cu/Cu joints that were brazed successfully using amorphous filler metal. The joints were soundly bonded and devoid of imperfections such as cracks and voids at higher brazing temperature. Figure 3 illustrates the microstructure of all samples in 2 categories: top (Figure 3a–d) and base (Figure 3e–h). The filler metal elements obviously diffused into the porous Cu and the top joint interface after brazing.
The porous Cu joined to the Cu plates (Figure 3) displays a clearly visible diffusion of filler metal elements at the joint interface in dark grey. The dark grey areas indicate interfacial interaction between Cu and molten filler, involving dissolution, diffusion, and chemical reactions during the brazing process. Micro-voids and cracks were identified at the joint interface, leading to doubts about the joint’s efficiency at low brazing temperature. Figure 3a,b,e,f demonstrate this issue. The reason for this shortcoming is that at the relatively low temperature of 660 °C, the filler was unable to completely react with the top-side Cu plate. At 660 °C, the temperature is not high enough to ensure the diffusion of the brazing filler to the top-side Cu plate. This could, however, be resolved by increasing the brazing temperature to 680 °C, whereby the voids and cracks were minimized, and a continuous reaction product was clearly identified at the joint interface. Finally, upon increasing the brazing time to 15 min, no voids or cracks were observed, as indicated in Figure 3d,h
To elucidate the atomic behavior at the brazed joint interfaces, the distribution of existing filler metal elements was measured by EDS. Figure 3b,f illustrate cross sections of the top and base of the joint brazed at 660 °C for 15 min. The interfacial microstructure of the major elements at each spot marked in Figure 3b,f detected by EDS are tabulated in Table 1. It shows that the base contained a considerable amount of phosphorus (P) distributed across the joint interface and porous Cu area. The EDS analysis of the base of the joint at point 1 shows that the dark region contained Cu (78.4 at. %), P (20.0 at. %), and small amounts of Nickel (Ni) and Tin (Sn), which indicates a Cu solid solution with a Cu-P phase according to the Cu-P phase diagram [25]. A substantial amount of Ni was identified at point 3. Based on the EDS results in Table 1 for the top joint interface, the region marked as point 5 was enriched with Cu (61.26 at. %), P (23.36 at. %), Ni (15.18 at. %), and Sn (0.19 at. %), signifying possible phases of Cu-P and Cu-Ni. There were high percentages of P element at all points marked on the top joint interface in Table 1. Therefore, it appears that P was the main element contributing to the formation of the dark grey area. Element P in the filler metal had the function of accelerating the dissolution of Cu during brazing. However, the Ni content was very low except at point 5, indicating that Ni was diffusing slowly compared with P.
To analyze the role of brazing temperature in microstructure formation, the EDS results for the sample brazed at 680 °C for 10 min (Figure 3c,g) are presented in Table 2. The grey region marked as point 3 in Table 2 was enriched with Cu (84.04 at. %), P (13.71 at. %), Ni (1.12 at. %), and Sn (1.13 at. %). Point 3 apparently consisted of Cu solid solution and Cu-P phase compounds [26]. However, there was a lower percentage of Ni element at the base compared to the sample brazed at 660 °C. At a high temperature, better diffusion of Ni from the filler metal through the porous Cu and top joint interface was noted (in line with the high values in Table 2 for the top of the joint). The EDS analysis of the brazed top joint interface shows that the dark region at point 5 was composed of Cu (45.42 at. %), P (18.36 at. %), Ni (35.81 at. %), and a negligible amount of tin. This dark phase apparently consists of Cu-P and Cu-Ni phase compounds. The EDS results obtained are in good agreement with previous studies on pure Cu joints brazed with a similar amorphous filler metal [27,28].
The diffusion of filler metal into the top of the joint improved with temperature due to the interdiffusion of Ni towards the porous Cu and top joint area. The homogenous filler spread through capillary action by penetrating the clearances between porous Cu. Figure 3c,g signify that the thickness of the reaction interface reduced at the base, diffusing into the porous Cu and top of the joint. By increasing the brazing temperature to 680 °C and holding time to 15 min, Figure 3d,h suggest that the interdiffusion and interaction between the filler metal and Cu increased significantly. The dark grey residual product of the filler metal seemingly diffused from the base joint interface into the porous Cu and top joint area due to the increase in temperature and time.
The main reason for the change in microstructure formation at higher temperature is the wettability difference. As the temperature increased, the wettability of the filler increased. A study conducted by Hissyam et al. [29] investigated the effect of Cu-based amorphous fillers’ composition on spreading and wetting behavior. The increase in brazing temperature led to bigger spreading area of the molten filler. According to the results, higher temperature increases the wetting angle and spreading ability of the filler (MBF 2005). The composition of filler also influences wetting and spreading ability of filler. Nickel and P enhances the strength and hardness to the filler, respectively. Sn reduces friction and improves braze ability of the filler.
From the Cu-based filler metal, P and Ni are the main elements to have actively diffused into the porous Cu and top joint interface. The most commonly used additive in Cu-based brazing filler metal is P, because it can reduce the melting point of the filler efficiently according to the Ni-P binary phase diagram [30]. Moreover, P can also enhance the wettability and spreading ability of the filler metal [31]. P is known to act as a fluxing agent [32]. As P has a deoxidizing effect, Cu-P filler metals tend to be self-fluxing. The solubility of P in Cu played a role in successful diffusion to produce a Cu-P phase. Moreover, the addition of some Ni and Sn is important to improve the glass forming ability during filler metal manufacturing [33]. Ni offers better toughness and strength at high and low temperatures. Ni is commonly used as a diffusion barrier between Cu and Sn to suppress the formation of Cu-Sn intermetallic compounds, which is not favorable because the formation of this thick phase will lead to crack propagation [34].
The EDS compositional maps in Figure 4 and Figure 5 show the element distribution in the areas selected on the joint brazed at 680 °C for 10 min. The EDS maps reveal that the reaction interface mainly consisted of Cu, Ni, and P. From the spatial distribution of the elements, the joint contained Cu-rich phases in the eutectic composition. Figure 4 and Figure 5 also signify that although a certain amount of P diffused into Cu, a large quantity of P was still distributed in the residual reaction product. Thus, P was the main element that formed a continuous reaction phase and had a key role in the interfacial reaction. Moreover, a significant amount of Ni diffused towards the top joint reaction interface due to the higher temperature (Figure 5). As Ni has good wetting characteristics with Sn [35], it seems to impart a greater degree of fluidity, allowing the metal to flow freely. Sn, as an active alloy and melting point depressant [36], diffused through the base metal and had a low concentration at the joint interface (Figure 4 and Figure 5). As Sn has a lower melting point, it spread throughout the brazed joint such that liquation occurred during brazing. Liquation in brazing is defined as the tendency of the lower melting constituents of the brazing filler metal to separate out and flow away from the higher melting constituents upon heating [37].

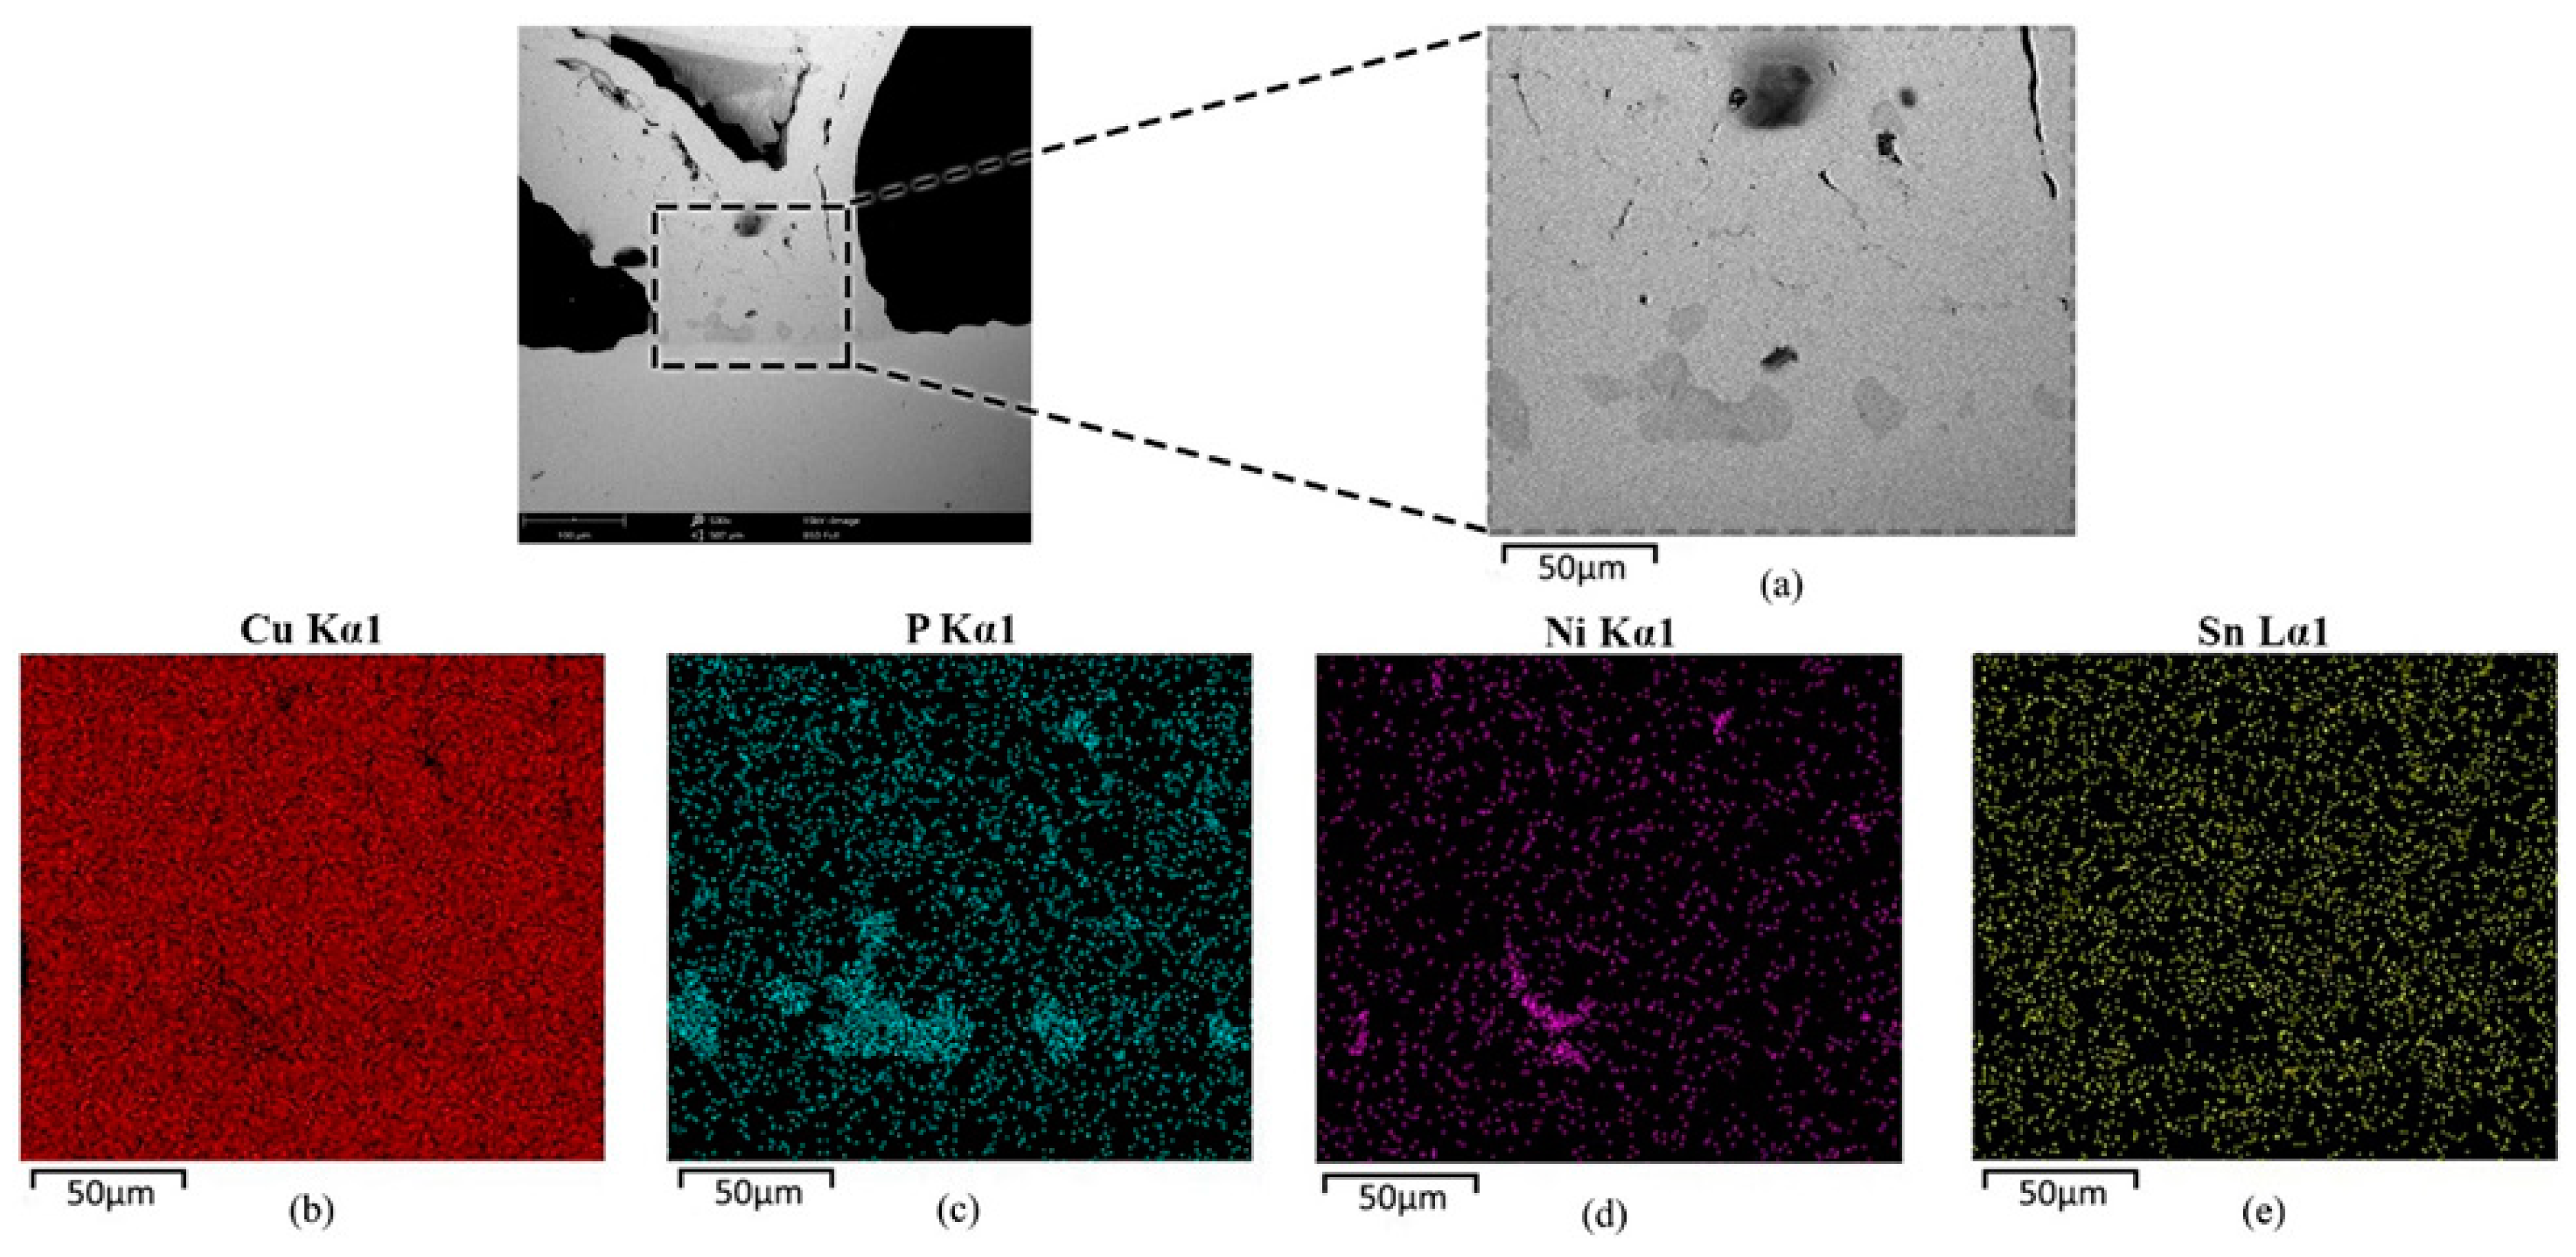
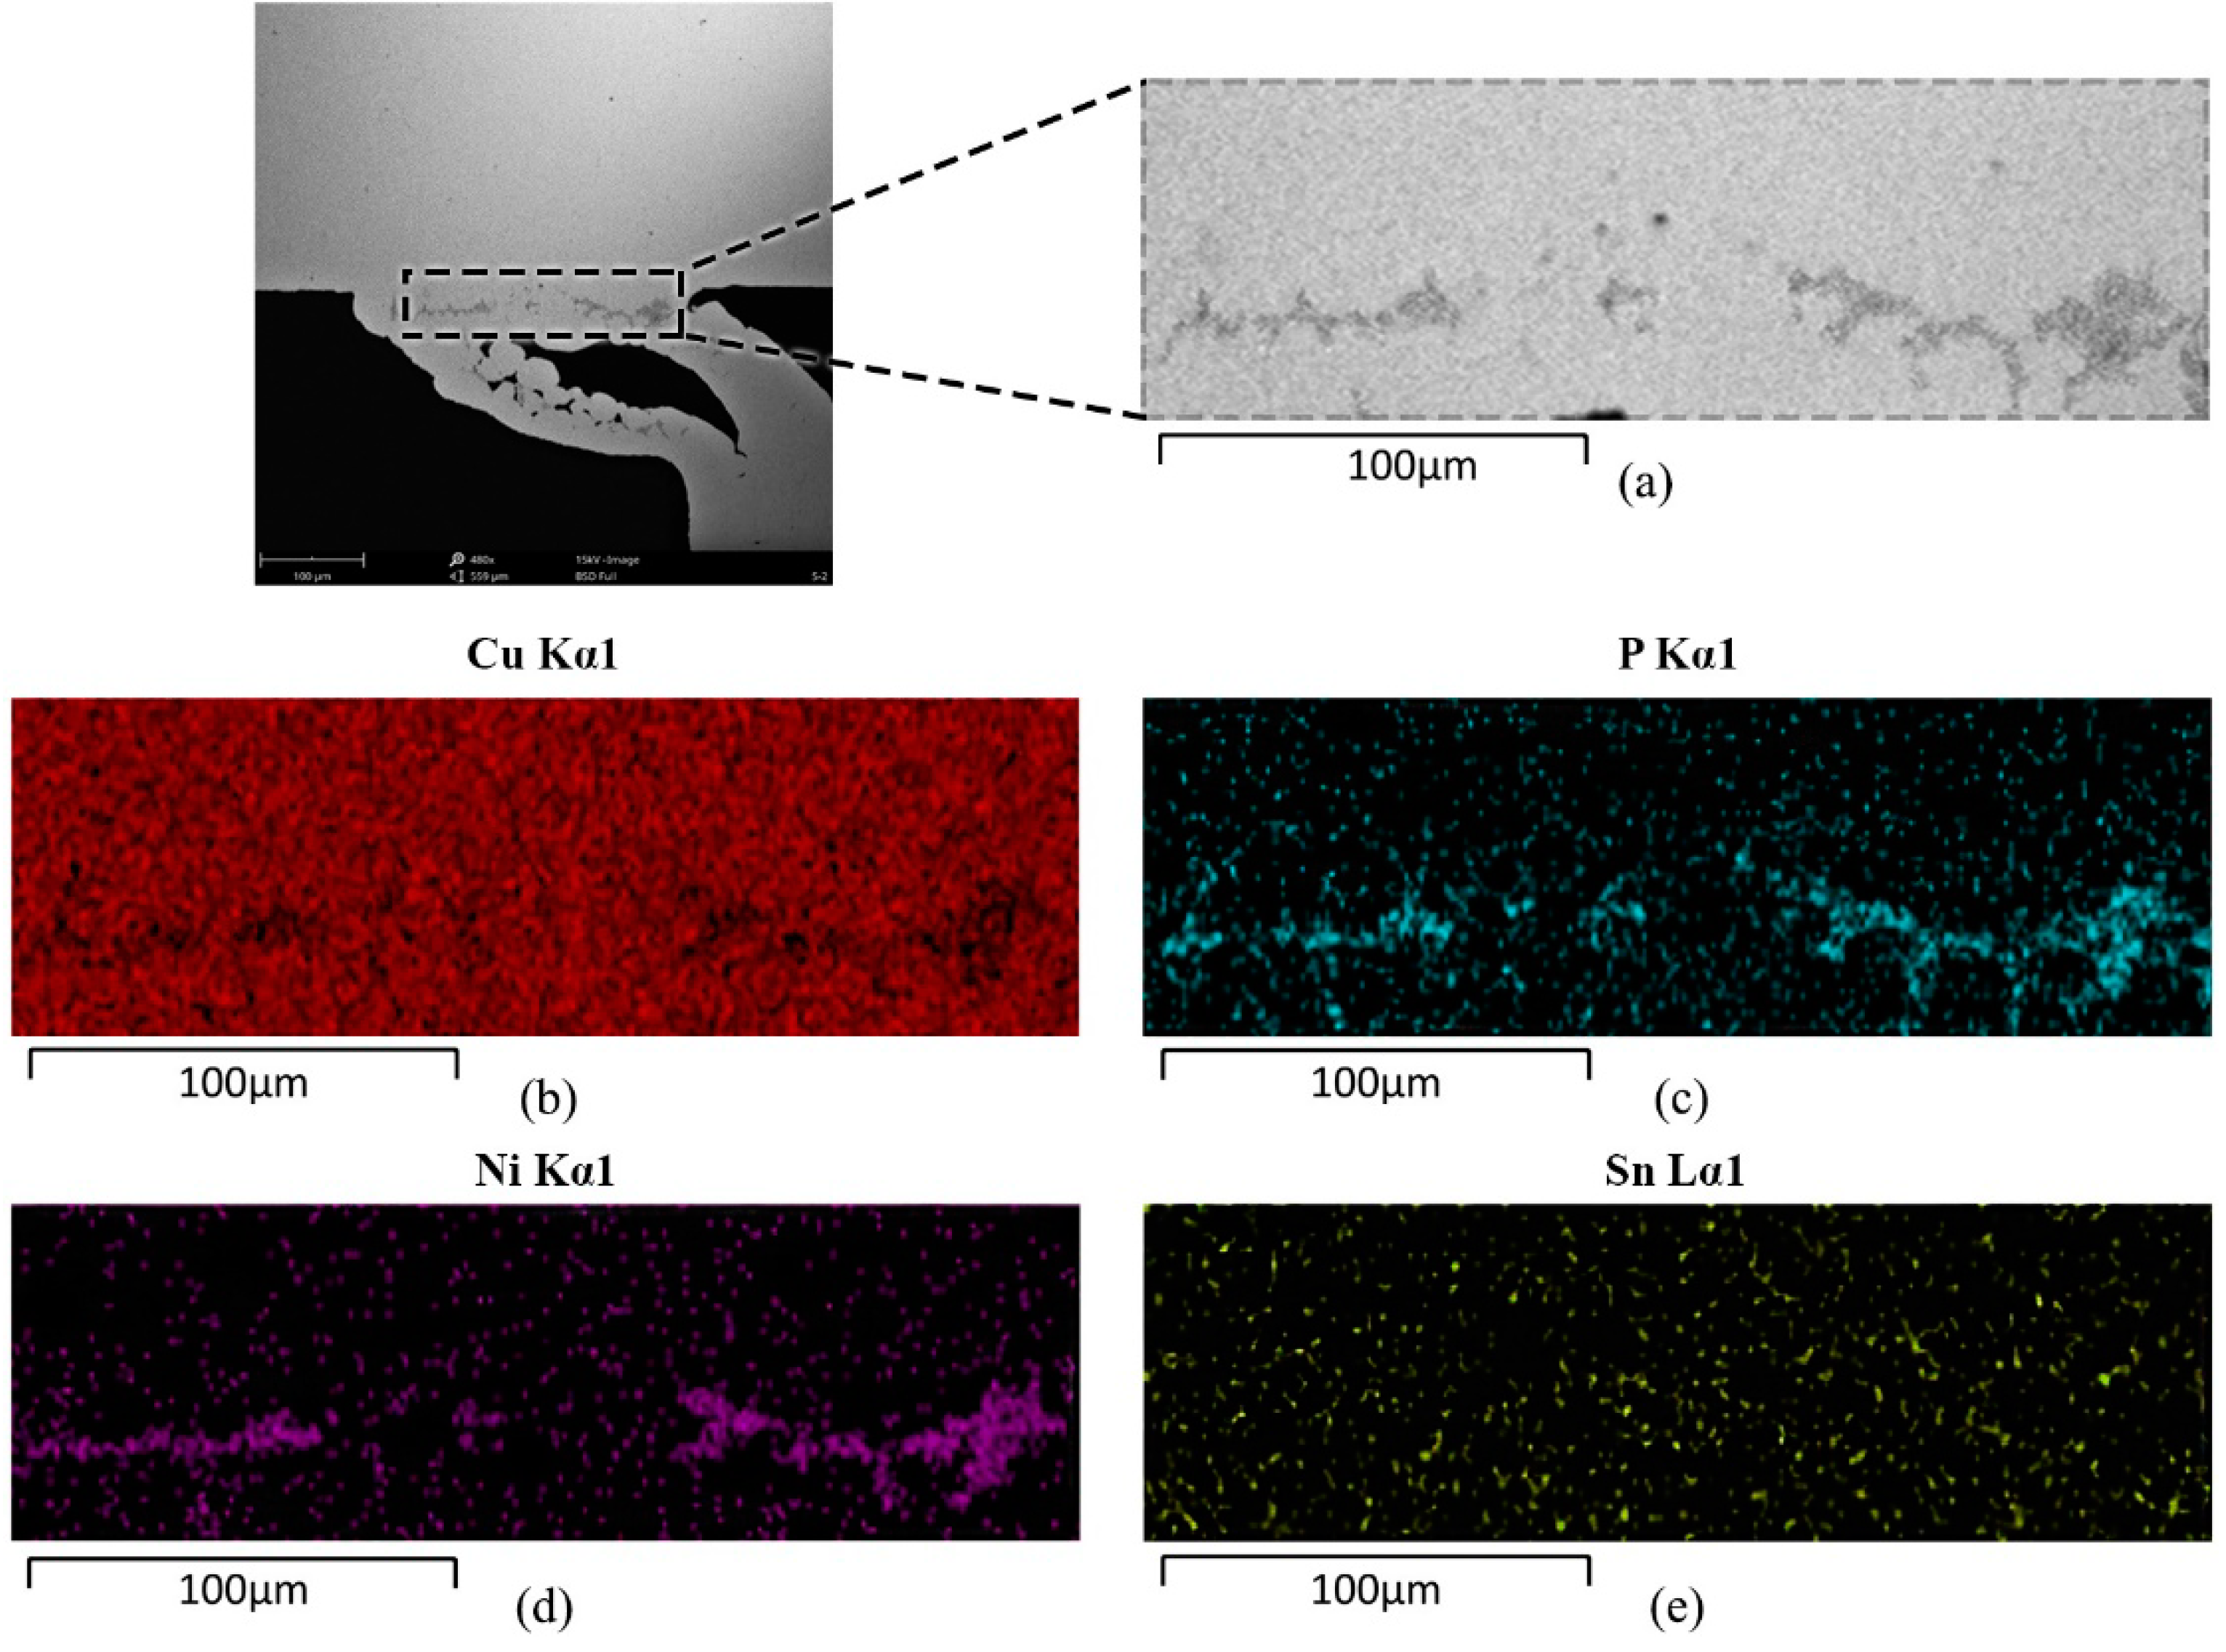
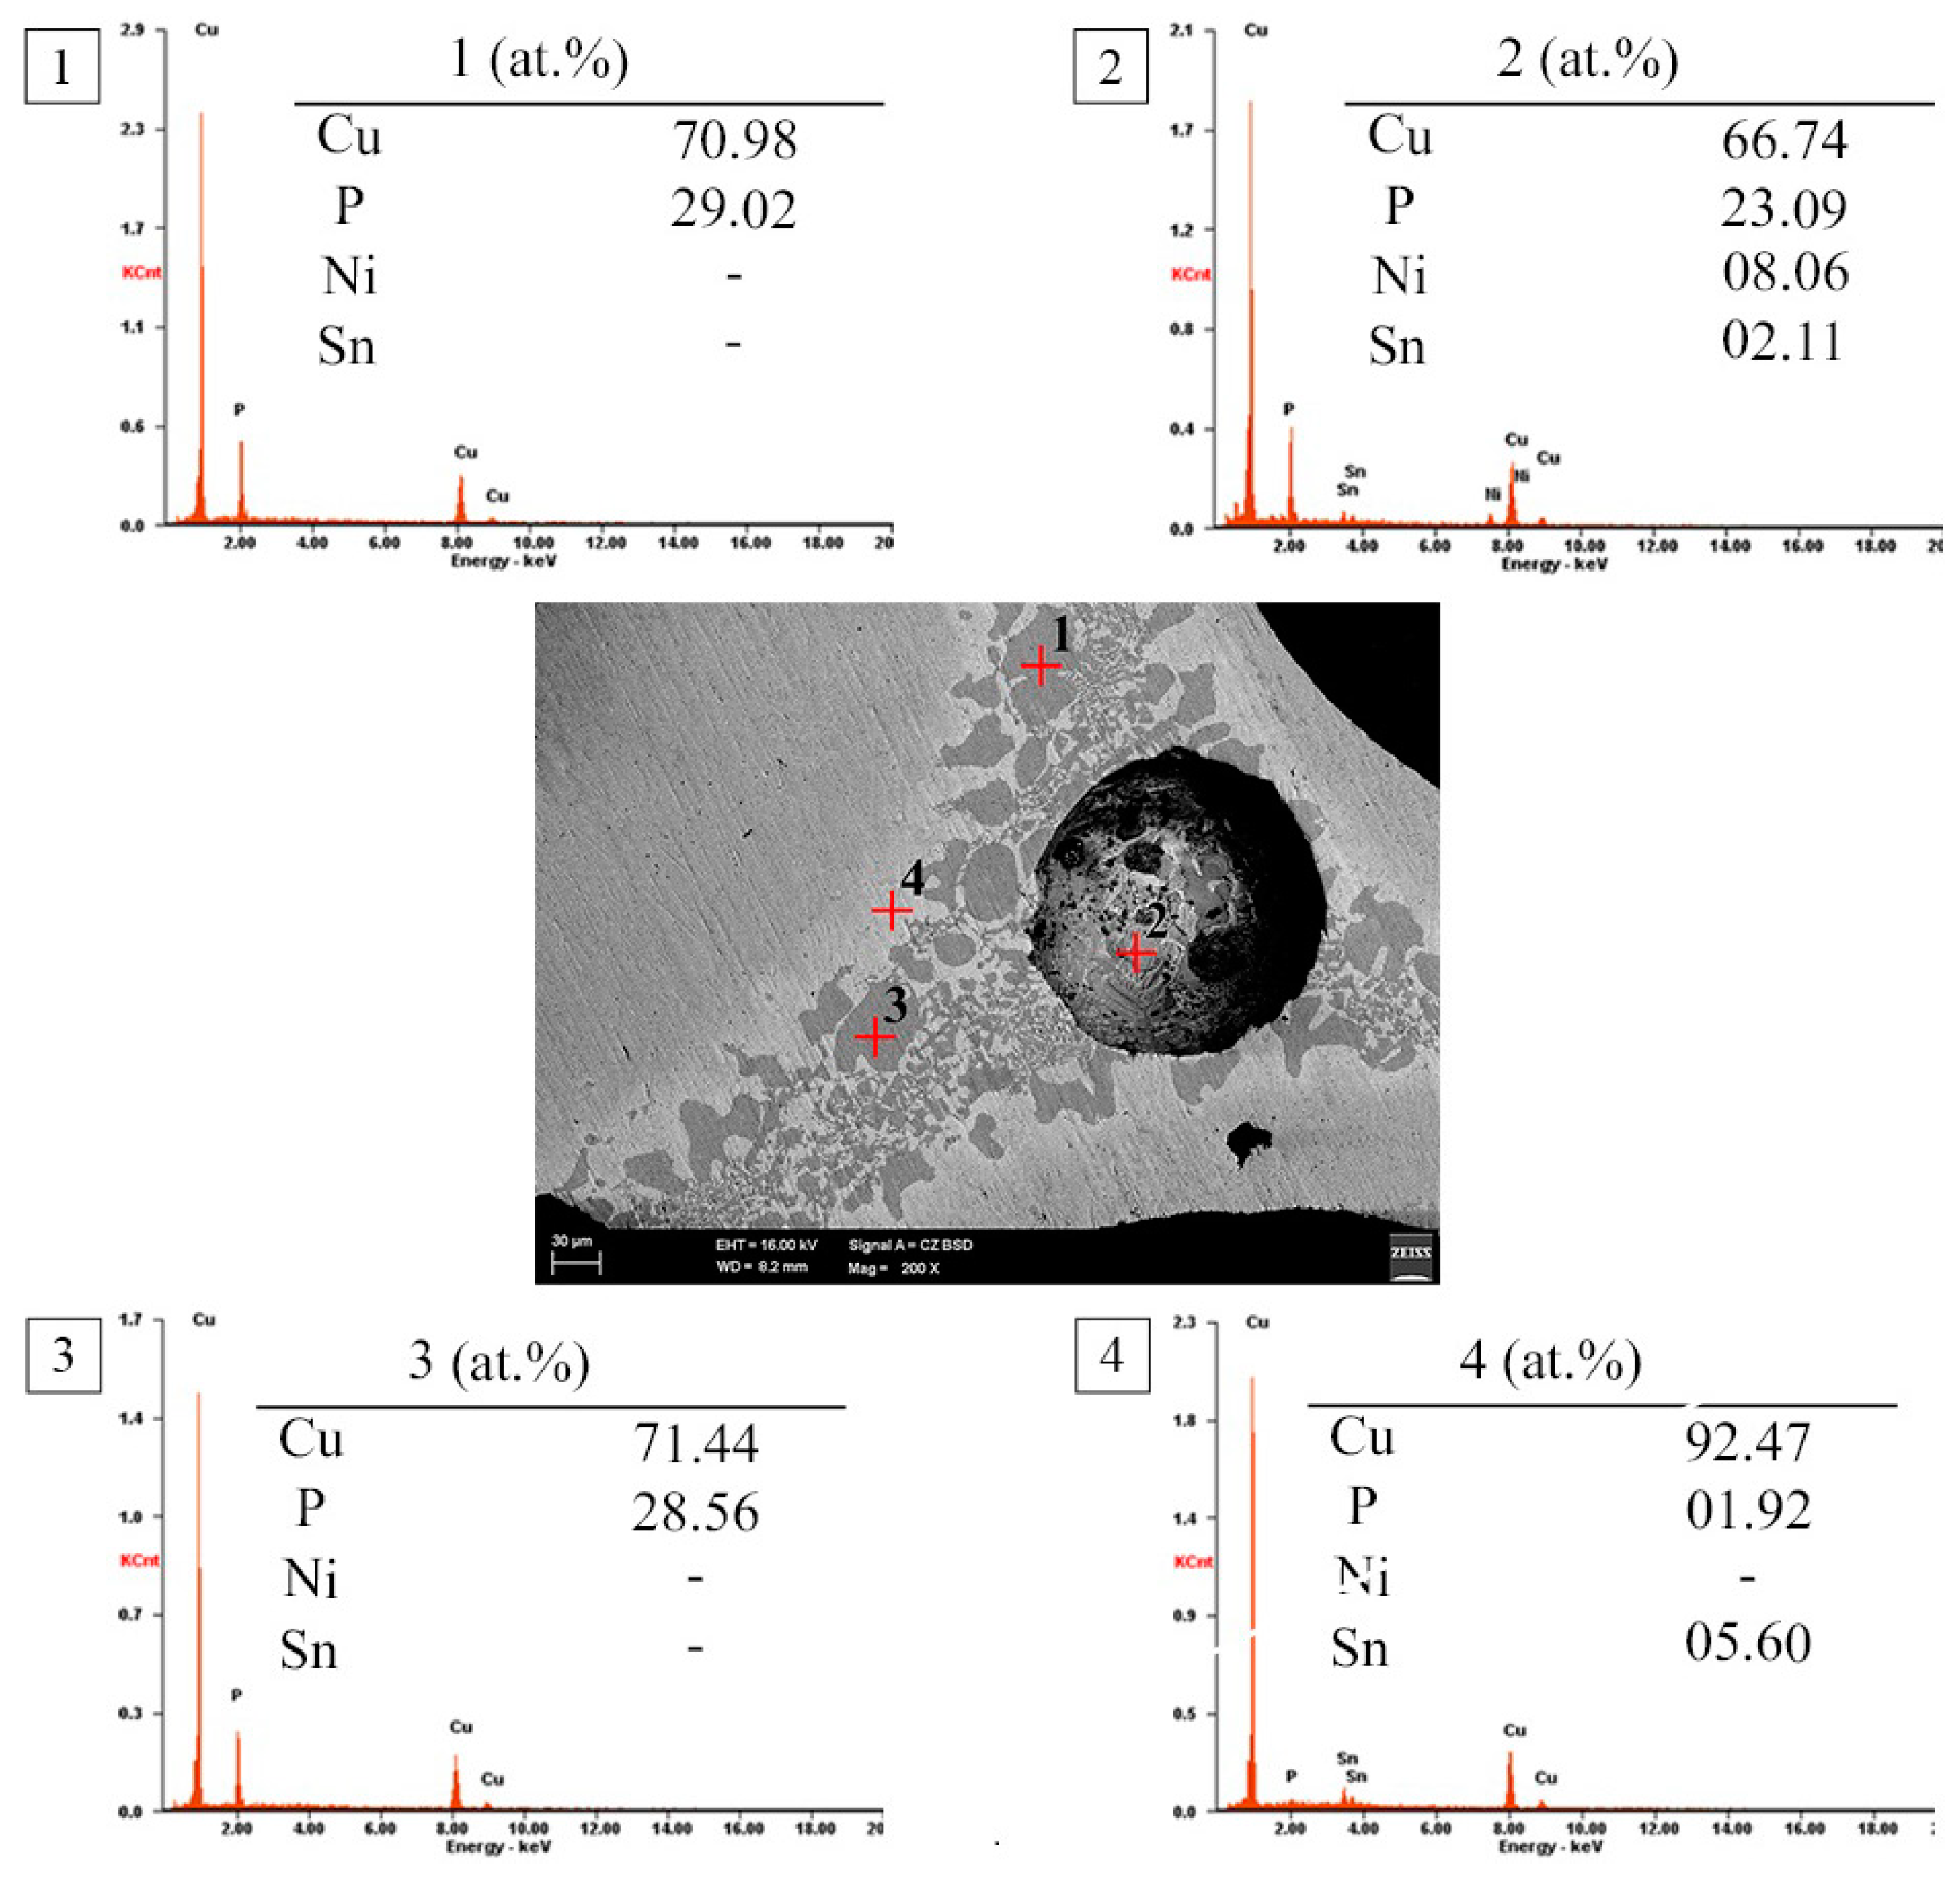
3.2. Microstructural Analysis of Porous Copper Surface

Figure 6 illustrates the microstructure formation at porous Cu surface after brazing at 680 °C for 15 min. It is evident that the filler metal has diffused into porous Cu from the base side, creating the dark grey reaction product. The filler metal reaction product has mostly settled around the pore which is the weakest section in terms of strength. The EDS composition of different points marked in Figure 6 confirms that P is the main factor in the formation of the reaction product. P diffused into porous Cu at points 1, 2, and 3, which represent a Cu solid solution matrix enriched with P. The region marked as Point 2 in Figure 6 was enriched with Cu (66.74 at. %), P (23.09 at. %), Ni (8.06 at. %), and a small amount of Sn, which indicates formation of Cu solid solution with Cu-P phase according to the Cu-P phase diagram [25]. However, excessive growth of brittle Cu3P phase will give joints a low mechanical strength. This finding has been revealed by Hasap et al. [38], who stated that excessive formation of Cu3P would encourage propagation of cracks and fractures. Furthermore, the behavior suggests that P has spread and settled around the pores of porous Cu.
The spread was assisted by capillary action as molten filler diffused and coated the porous Copper surface at an elevated temperature. The region marked as point 4 consisted of Cu (92.48 at. %), Sn (5.60 at. %), and a small amount of P. This region is outside the dark grey reaction product and shows that Sn has diffused into the parent metal throughout the bonded region. The lower values of Sn observed in the EDS analysis support this observation. Overall, a considerable amount of reaction products formed at the porous Cu surface and the formation of Cu-P phase will harden the porous Cu and increase its strength. The filler successfully coated the porous Cu surface, resulting in an increase in hardness and strength.

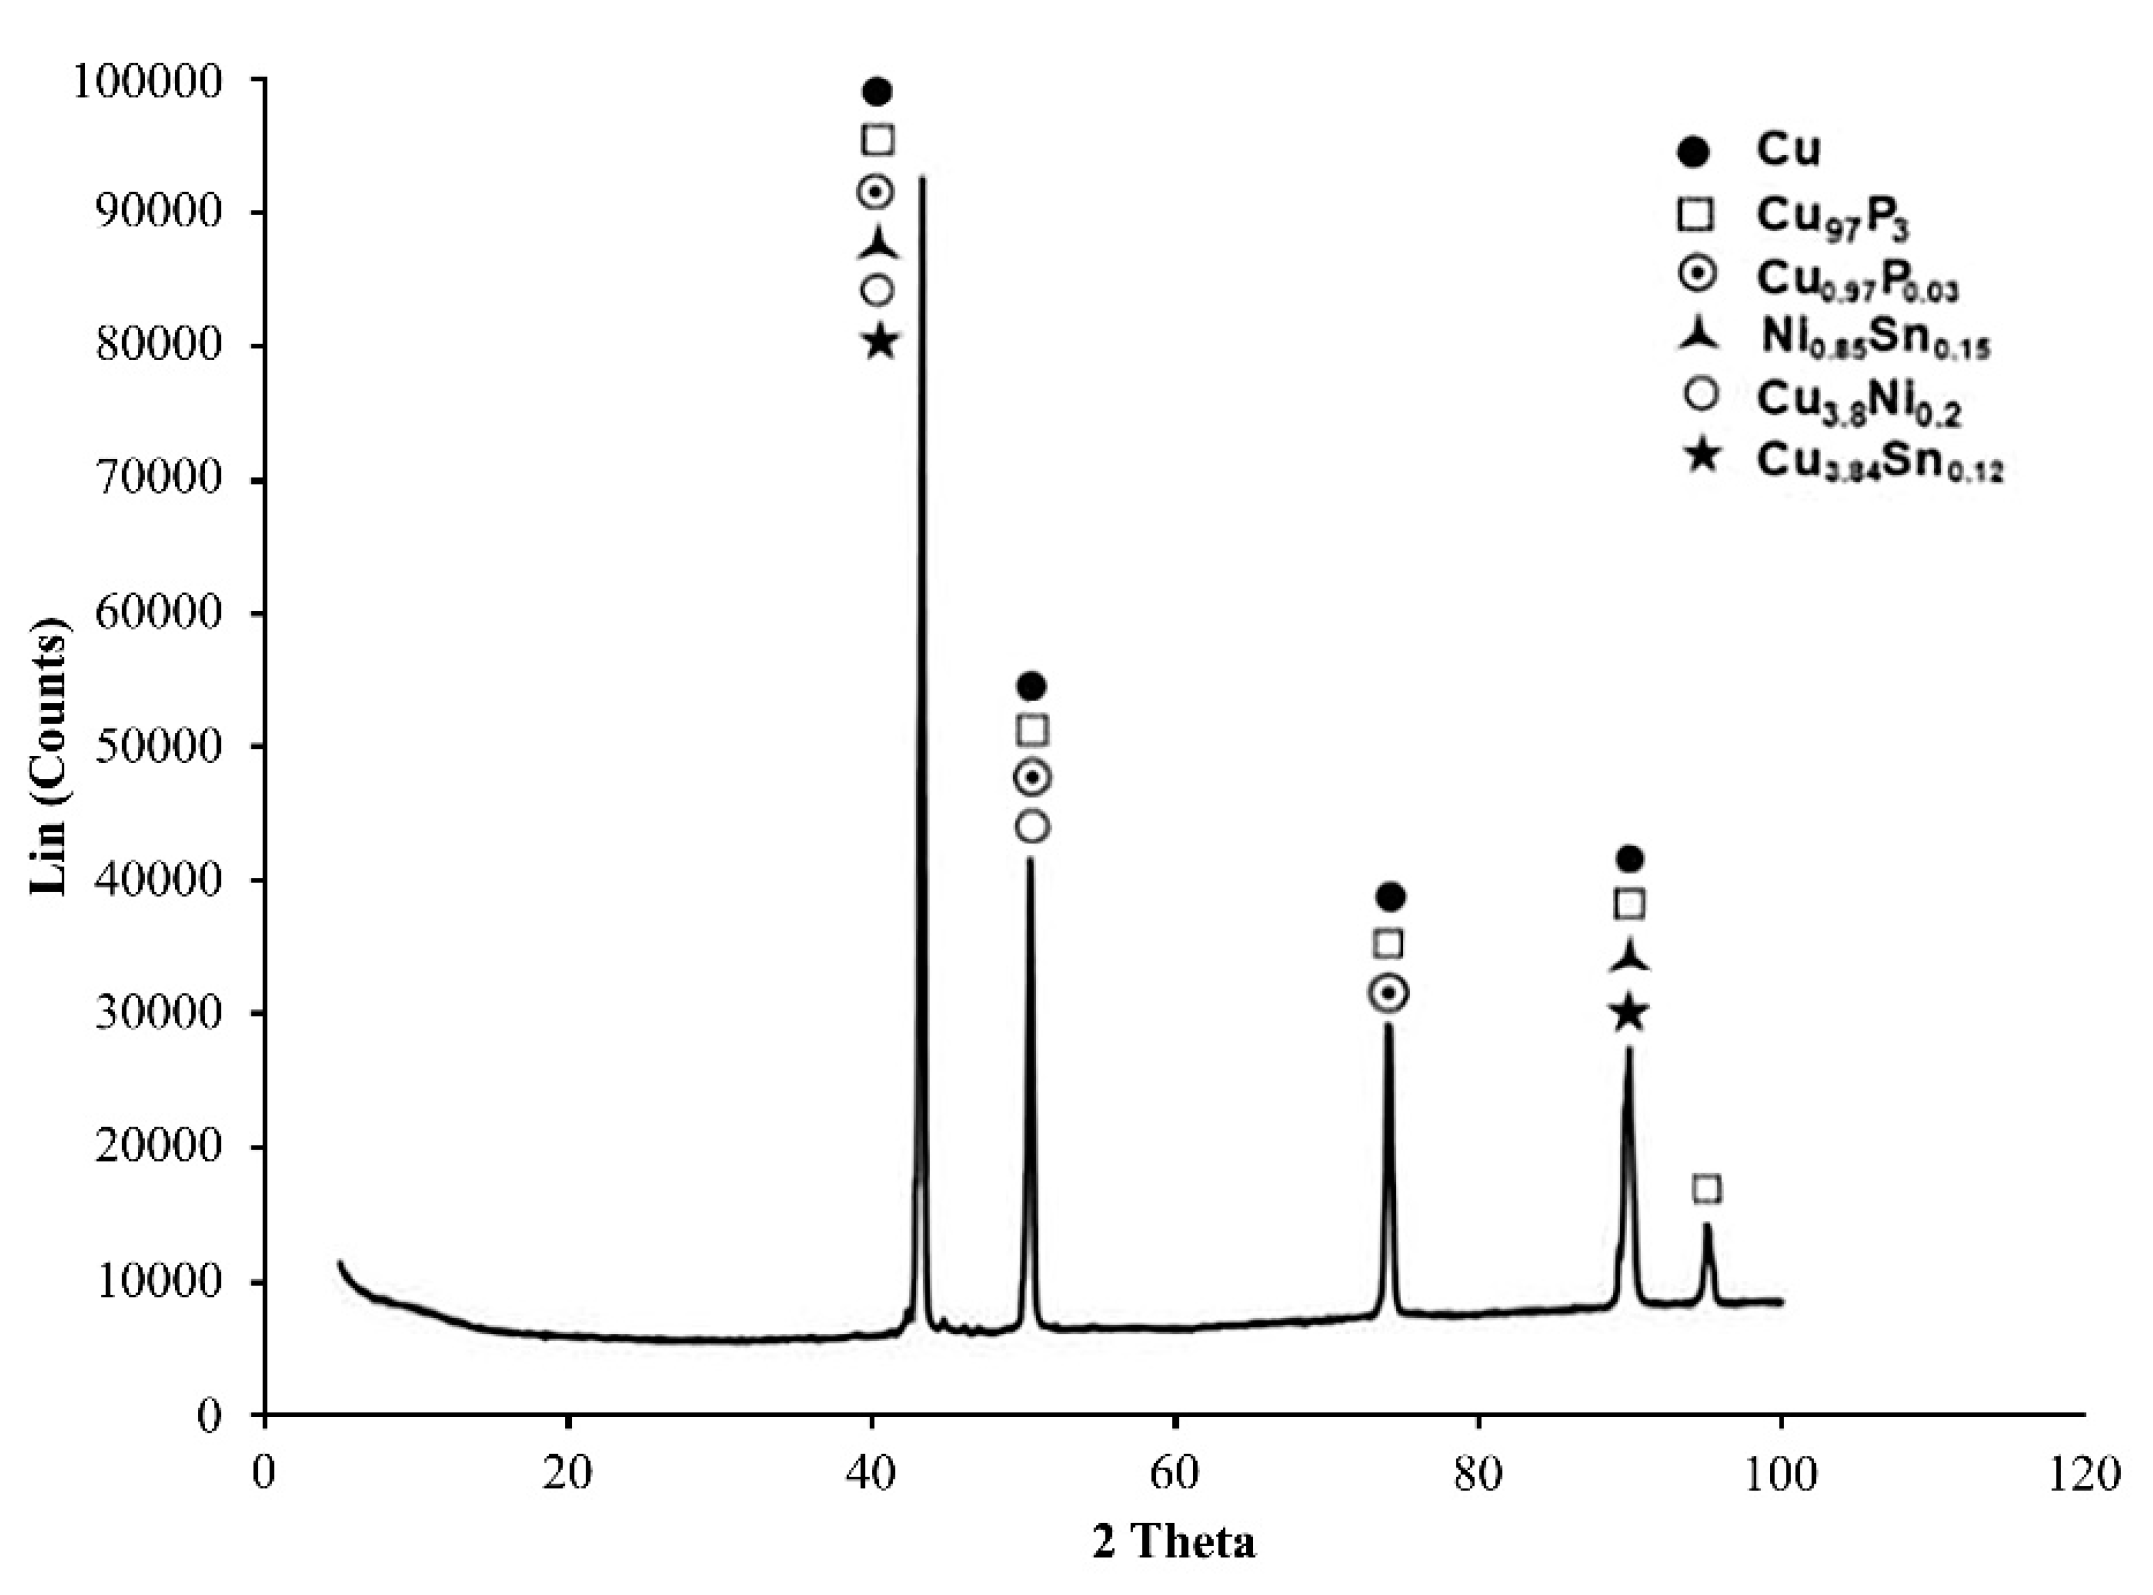
3.3. Phase Identification of the Brazed Samples

XRD analysis was performed to confirm the results obtained from SEM microstructural analysis. Several sample parameters were prepared for different parts of one sample, including the base and top side with compressed porous Cu. All the samples analyzed exhibited a similar pattern of peaks, which appeared to indicate the formation of almost identical phases. Therefore, the best XRD analysis results are presented in Figure 7, where it is revealed that all sharp peaks are related to Cu.
The XRD analysis indicates that five phases are present due to the reaction of the brazing filler metal with the Cu plate and porous Cu, as follows: Copper Phosphorus (Cu0.97P0.03), Copper Phosphide (Cu97P3), Nickel Tin (Ni17Sn3), Copper Nickel (Cu3.8Ni0.2), and Copper Tin (Cu3.84Sn0.12). Furthermore, there are strong peaks of Cu0.97P0.03 and Cu3.8Ni0.2 phases at 660 °C and 680 °C. In sum, the typical joint phase compounds determined include Cu-P, Cu-Ni, Cu-Sn, and Ni-Sn. It must also be mentioned that Cu-P alloys are inherently brittle and sensitive to loading rate. Hence, the addition of nominal P content (7 wt.%) slightly affected the reduction of joint ductility. However, phosphorus is often used to deoxidize Cu, which can increase hardness and strength [32].

3.4. Effect of Brazing Parameters on the Mechanical Properties of the Brazed Joints

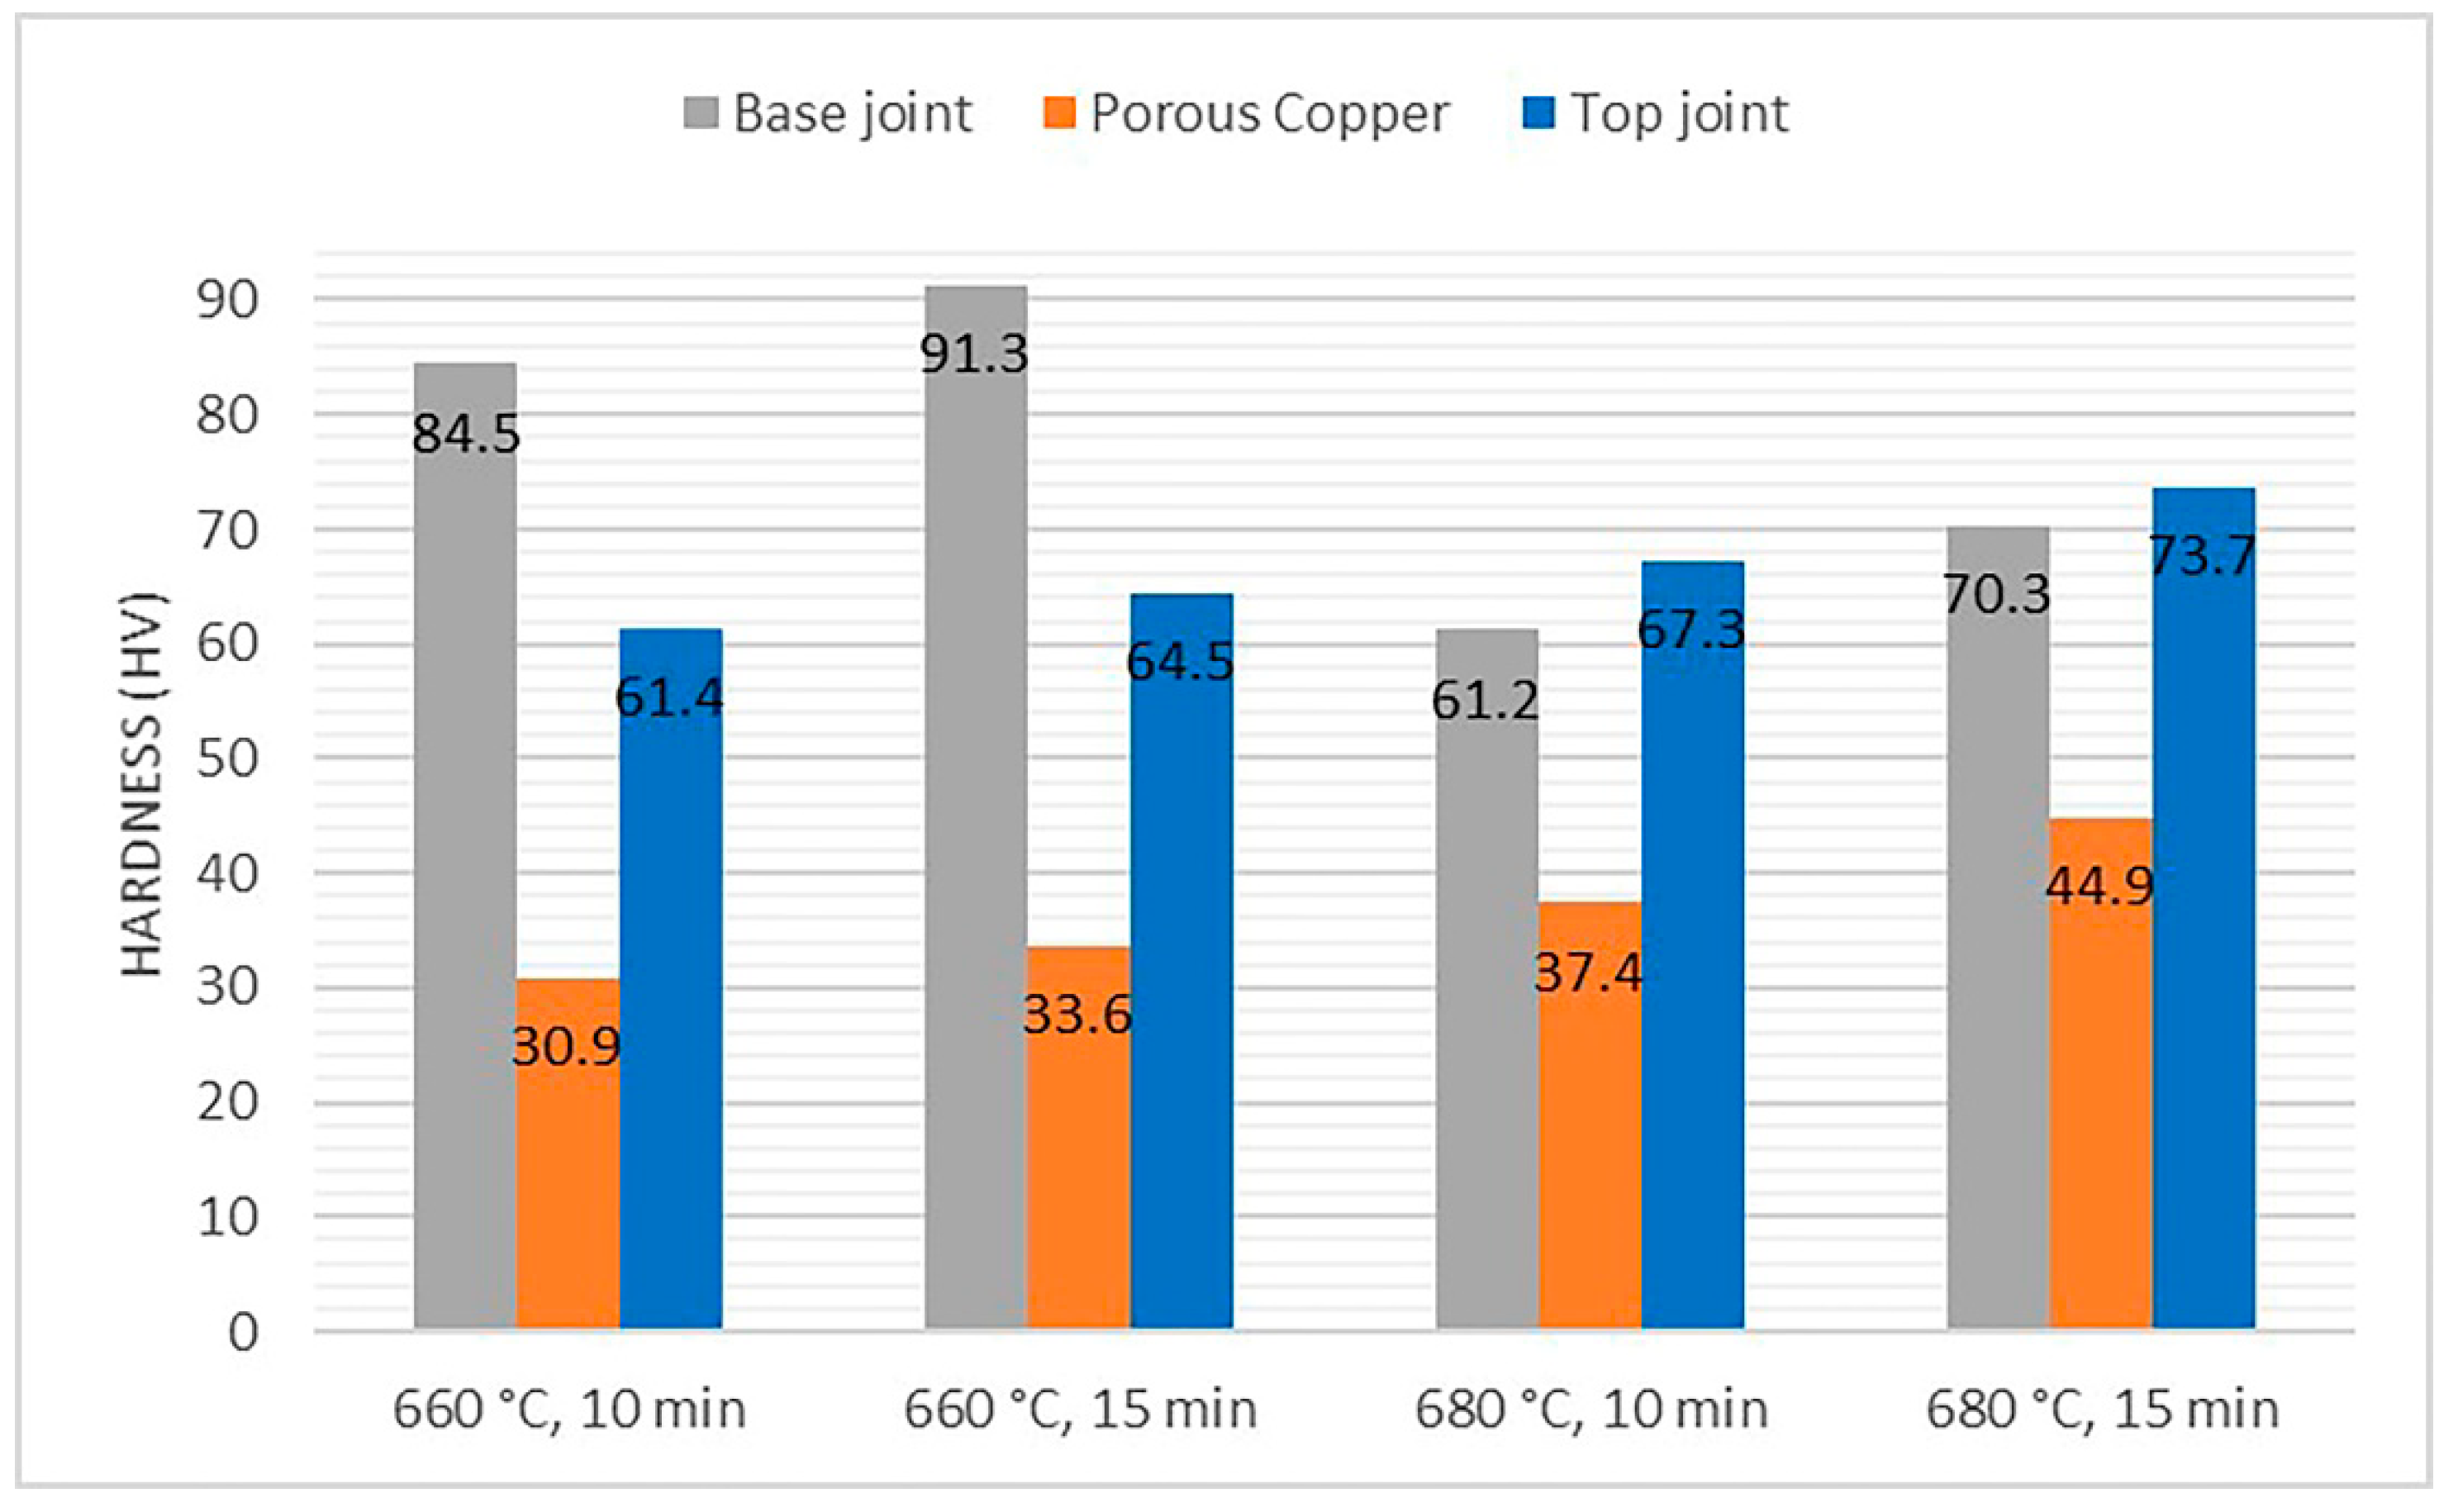
3.4.1. Microhardness Test

A Vickers microhardness test was performed to evaluate the changes in hardness of the solid and porous Cu after brazing. Indentations were made at several points on the samples from the base to the top side after brazing. The hardness value of the as-received Cu plate prior to brazing was 28.7 HV. The hardness of the porous Cu was assumed to be the same as that of the as-received Cu plate, because the porous Cu was made from pure Cu.
Figure 8 indicates that the hardness of porous Cu gradually increased with increasing brazing temperature and time. It is worth remarking that the base joint interface attained a maximum hardness of 91.3 HV when the holding time was extended to 15 min at 660 °C. It is noted that increasing the holding time influenced the hardness values due to interaction between the filler elements and Cu. However, the hardness of the base of the joint brazed at 660 °C was greater than the base of the joint brazed at 680 °C, indicating that the filler metal slightly diffused into the top side at 660 °C. The hardness values of the base of the joint decreased with increasing temperature due to the dissolution and interdiffusion of the main elements from the filler metal through the porous Cu and the top joint interface. This means that the high hardness measured was because of the filler metal residue on the base side. Overall, as the temperature and time increased, more diffusion occurred and the hardness values of the porous Cu and top of the joint gradually increased.
Although the brazing filler metal has four elements, Cu and Ni have the same crystal structure and similar radii, electronegativity, and valence. Therefore, complete solubility occurs between them and a substitutional solid solution formation is evident. This is mainly due to diffusion of Ni towards porous Cu and the top side at higher temperature, as shown in Table 2. Cu and Ni solid solution increased the strength of the top-side joint. Furthermore, higher P-content increased the hardness of porous Cu by coating its surface. The top of the joint had a maximum of 73.7 HV when the holding time was increased to 15 min at 680 °C. At high brazing temperature, the porous Cu surface hardened significantly and achieved a maximum of 44.9 HV, which is a substantial aspect of this research in ensuring that porous Cu will not deform during service.

3.4.2. Compression Testing

Compression testing was carried out on all samples to investigate the material behavior under crushing load. The specimens were compressed and the deformation under various loads was recorded. Figure 9 illustrates that the compressive strength of the sample brazed at 680 °C for 15 min increased significantly compared to porous Cu before brazing. The typical stress-strain curve of all porous samples can be characterized by three distinguished regions known as linear elastic, plateau, and densification [39].
In the first region, deformation occurred elastically, presenting a linear development under strains below 10%. The brazed sample was able to withstand a stress of 1.1 MPa, whereas the porous Cu before brazing was able to endure a stress of 0.63 MPa at 10% compressive strain. The second region shows an almost horizontal development, where stress did not increase remarkably with strain. This region corresponds to the collapse of the cells when the stresses exceeded a certain value and were in a plane perpendicular to the loading direction. The plateau region is a key feature of porous materials, which serves in the case of energy absorption. The energy absorbed by the sample corresponds directly to the area under the stress-strain curve. The sample brazed at 680 °C for 15 min had a higher plateau stress and the slope during the plateau region was steeper, indicating that its energy absorption capacity increased. The energy absorbed by the material depends on the amount of plateau stress and densification strain [40,41]. As the plateau stress increased for the sample brazed in this study, the energy absorption capacity of the porous Cu increased after brazing.
The third region is densification, which manifests under high strains and is where stress increased sharply with increasing strain. At this stage, the cell walls become pressed together and the material attains bulklike properties. As the cell walls come into contact due to increasing deformation, a sharp increase in the stress-strain curve is evident. The sample brazed at 680 °C for 15 min had a maximum compressive load of 2980.9 N, and compressive stress was 30.79 MPa. However, the porous Cu before brazing had a maximum compressive load of 784 N, whereas the compressive stress was 8.75 MPa. The increment in value of compressive stress for the brazed sample confirms that the filler metal diffused into the porous Cu during brazing, hence, hardening the porous Cu surface. It also indicates that the porous Cu was able to withstand the highest amount of stress and was more rigid after brazing with increasing brazing time and temperature.
The ligaments of porous Copper played an important role in increasing the compressive strength. The thickness of the ligaments of porous Copper are nonuniform. Therefore, the compressive strength values vary due to different amounts of dissolution and diffusion of the filler elements into the ligaments, starting from the base where the filler metal was supplied until up to the top. By increasing the temperature and time, higher diffusion of filler elements into the ligaments of porous Copper was noticed. The filler elements provided a coating of porous Cu and its ligaments to increase strength. The main element responsible for hardening porous Cu is Phosphorus. Some amount of Nickel was also present which increased the strength of porous Cu in the middle. At a higher temperature of 680 °C, Nickel percentage increases in the porous Cu and top-side joint, shown in Table 2. The base side has high phosphorus content but due to diffusion of Nickel towards top side, the Nickel percentage at the base side is low. Overall, it can be concluded that the rigidity of the porous Cu tends to increase because of surface hardening. The rigidity of porous Cu after brazing is essential in ensuring less deformation during cooling device servicing.

4. Conclusions

For all parameters tested, joints were brazed successfully on both sides using a single piece of Cu-P-Ni-Sn brazing filler metal to join porous Cu to Cu plates. It was found that this brazing process is economical due to the lower brazing temperature used and shorter holding time. The filler metal was melted, and it filled the joint gap by capillary action to form a joint with good strength. The microstructure of the brazed joint changed with increasing temperature, and no voids or cracks were observed in the sample brazed at 680 °C for 15 min. With increasing temperature and time, enhanced diffusion of the filler metal elements was noted in the overall bonded region. The dark grey residual in the filler reaction product reduced at the base and diffused towards the porous Cu and top joint interface. At elevated brazing temperature and time, increased hardness was observed at the porous Cu and the top of the joint due to the presence of abundant filler metal elements identified as reaction products; namely, Cu-P, Cu-Ni, Cu-Sn, and Ni-Sn. These reaction products are believed to have hardened the porous Cu and brazed joint interfaces, contributing to a significant rise in compressive strength and rigidity. The rigidity of porous Cu is a noteworthy aspect in this study, particularly in terms of its potential application in cooling devices, such as heat exchangers and heat sinks.

Author Contributions

Conceptualization, T.Z., F.Y., T.A., and M.M.S.; methodology, M.M.S. and T.Z.; validation, T.Z., F.Y., and T.A.; investigation, M.M.S. and T.Z.; data curation, M.M.S.; writing—original draft preparation, M.M.S.; writing—review and editing, M.M.S., T.Z., F.Y., and T.A.; visualization, M.M.S. and T.Z.; supervision, T.Z. and F.Y.; funding acquisition, T.Z. and F.Y. All authors have read and agreed to the published version of the manuscript.

Funding

This research was funded by University of Malaya Research Fund Assistance (BKP), grant number BK005-2015.

Acknowledgments

The authors are grateful for the financial support provided by the International Graduate Research Assistance Scheme (IGRAS). The authors also gratefully acknowledge the support of the AMMP Centre staff and Faculty of Engineering, University of Malaya.

Conflicts of Interest

The authors declare no conflict of interest.

References

  1. Lee, K.S.; Kim, W.S.; Si, J.M. Optimal shape and arrangement of staggered pins in the channel of a plate heat exchanger. Int. J. Heat Mass Trans. 2001, 44, 3223–3231. [Google Scholar] [CrossRef]
  2. Tanda, G. Heat transfer and pressure drop in rectangular channel with diamond-shaped elements. Int. J. Heat Mass Trans. 2001, 44, 3529–3541. [Google Scholar] [CrossRef]
  3. Pongsoi, P.; Pikulkajorn, S.; Wang, C.C.; Wongwises, S. Effect of fin pitches on the air-side performance of crimped spiral fin-and-tube heat exchangers with a multipass parallel and counter cross-flow configuration. Int. J. Heat Mass Trans. 2011, 54, 2234–2240. [Google Scholar] [CrossRef]
  4. Sayed, A.E.; Mesalhy, O.M.; Abdelatief, M.A. Flow and heat transfer enhancement in tube heat exchangers. Heat Mass Transf. 2015, 51, 1607–1630. [Google Scholar] [CrossRef]
  5. Zhang, L.; Mullen, D.; Lynn, K.; Zhao, Y. Heat Transfer Performance of Porous Copper Fabricated by Lost Carbonate Sintering Process. Mater. Res. Soc. Proc. 2009, 1188, LL04-07. [Google Scholar] [CrossRef] [Green Version]
  6. Xiao, Z.; Zhao, Y. Heat transfer coefficient of porous copper with homogeneous and hybrid structures in active cooling. J. Mater. Res. 2013, 28, 2545–2553. [Google Scholar] [CrossRef] [Green Version]
  7. Singh, R.; Akbarzadeh, A.; Mochizuki, M. Sintered porous heat sink for cooling of high-powered microprocessors for server applications. Int. J. Heat Mass Trans. 2009, 52, 2289–2299. [Google Scholar] [CrossRef]
  8. Liu, P.S.; Liang, K.M. Review Functional materials of porous metals made by P/M, electroplating and some other techniques. J. Mater. Sci. 2001, 36, 5059–5072. [Google Scholar] [CrossRef]
  9. Tuchinskiy, L. Novel fabrication technology for metal foams. J. Adv. Mater. 2005, 37, 60–65. [Google Scholar]
  10. Feng, S.; Li, F.; Zhang, F.; Lu, T.J. Natural convection in metal foam heat sinks with open slots. Exp. Therm. Fluid Sci. 2018, 91, 354–362. [Google Scholar] [CrossRef]
  11. Shen, B.; Yan, H.; Sunden, B.; Xue, H.; Xie, G. Forced convection and heat transfer of water-cooled microchannel heat sinks with various structured metal foams. Int. J. Heat Mass Transf. 2017, 113, 1043–1053. [Google Scholar] [CrossRef]
  12. Qu, Z.; Wang, T.; Tao, W.; Lu, T. Experimental study of air natural convection on metallic foam-sintered plate. Int. J. Heat Fluid Flow 2012, 38, 126–132. [Google Scholar] [CrossRef]
  13. Ogushi, T.; Chiba, H.; Nakajima, H. Development of Lotus-Type Porous Copper Heat Sink. Mater. Trans. 2006, 47, 2240–2247. [Google Scholar] [CrossRef]
  14. Zhang, H.; Chen, L.; Liu, Y.; Li, Y. Experimental study on heat transfer performance of lotus-type porous copper heat sink. Int. J. Heat Mass Transf. 2013, 56, 172–180. [Google Scholar] [CrossRef]
  15. Boomsma, K.; Poulikakos, D.; Zwick, F. Metal foams as compact high performance heat exchangers. Mech. Mater. 2003, 35, 1161–1176. [Google Scholar] [CrossRef]
  16. Bastarows, A.F.; Evans, A.G.; Stone, H.A. Evaluation of Cellular Metal Heat Dissipation Media; Division of Engineering and Applied Sciences: Cambridge, MA, USA, 1998. [Google Scholar]
  17. Nawaz, K.; Bock, J.; Dai, Z.; Jacobi, A.M. Experimental studies to evaluate the use of metal foams in highly compact air-cooling heat exchangers. In Proceedings of the Paper presented at the International Refrigeration and Air Conditioning Conference, West Lafayette, IN, USA, 12–15 July 2010. [Google Scholar]
  18. Shirzadi, A.A.; Kocak, M.; Wallach, E.R. Joining stainless steel metal foams. Sci. Technol. Weld. Join. 2004, 9, 277–279. [Google Scholar] [CrossRef]
  19. Bangash, M.; Ubertalli, G.; Saverio, D.D.; Ferraris, M.; Jitai, N. Joining of Aluminium Alloy Sheets to Aluminium Alloy Foam Using Metal Glasses. Metals 2018, 8, 614. [Google Scholar] [CrossRef] [Green Version]
  20. Sekulic, D.P.; Dakhoul, Y.M.; Zhao, H.; Liu, W. Aluminum Foam Compact Heat Exchangers: Brazing Technology Development vs. Thermal Performance. In Proceedings of the Cellmet Conference, Dresden, Germany, 8–10 October 2008. [Google Scholar]
  21. European Patent Application. Available online: http://patentimages.storage.googleapis.com/b1/96/3a/33cbb50daba87d/EP0429026A1.pdf (accessed on 15 February 2020).
  22. Yu, W.; Lu, W.; Xia, T. Formation Process of Joints Brazing with Amorphous Filler Metal. Rare Met. Mater. Eng. 2013, 42, 688–691. [Google Scholar] [CrossRef]
  23. Schwartz, M. Brazing: For the Engineering Technologist, 1st ed.; Chapman and Hall: London, UK, 1995; p. 296. [Google Scholar]
  24. Committee, A.C. Brazing Handbook, 5th ed.; American Welding Society: Miami, FL, USA, 2007. [Google Scholar]
  25. Predel, B. Cu-P (Copper-Phosphorus). In Cr-Cs–Cu-Zr; Springer: Berlin/Heidelberg, Germany, 1994; pp. 1–3. [Google Scholar] [CrossRef]
  26. Miettinen, J. Thermodynamic description of Cu-Sn-P system in the Copper-rich corner. Calphad 2001, 25, 67–78. [Google Scholar] [CrossRef]
  27. Jattakul, P.; Kanlayasiri, K. Effects of brazing parameters on the microstructure and tensile shear force of Copper sheets using amorphous filler metal. In Proceedings of the 4th International Conference on Engineering, Applied Sciences and Technology (ICEAST 2018), Phuket, Thailand, 4–7 July 2018. [Google Scholar]
  28. Zhang, J.; Yu, W.; Lu, W. Mechanical Properties and Microstructure of Pure Copper Joints Brazed with Amorphous Cu68.5Ni15.7Sn9.3P6.5 Filler Metal. Int. J. Simul. Syst. Sci. Technol. 2016, 17, 15–19. [Google Scholar] [CrossRef]
  29. Hissyam, W.N.W.M.N.; Halil, A.M.; Kurniawan, T.; Ishak, M.; Ariga, T. Effect of Copper-based Fillers Composition on Spreading and Wetting Behaviour. IOP Conf. Ser. Mater. Sci. Eng. 2017, 238, 012020. [Google Scholar] [CrossRef] [Green Version]
  30. Schmetterer, C.; Vizdal, J.; Ipser, H. A new investigation of the system Ni–P. Intermetallics 2009, 17, 826–834. [Google Scholar] [CrossRef]
  31. Zorc, B.; Kosec, L. Comparison of brazed joints made with BNi-1 and BNi-7 nickel-base brazing alloys. Rev. Metal. 2000, 36, 100–107. [Google Scholar] [CrossRef] [Green Version]
  32. Sim, R.F. Copper Phosphorus Based (Self-fluxing) Brazing Alloys used for Joining Copper and its Alloys. FWP J. 1987, 27, 33–42. [Google Scholar]
  33. Jacobson, D.M.; Humpston, G. Principles of Brazing; ASM International: Materials Park, OH, USA, 2005. [Google Scholar]
  34. Ghosh, R.; Kanjilal, A.; Kumar, P. Effect of type of thermo-mechanical excursion on growth of interfacial intermetallic compounds in Cu/Sn-Ag-Cu solder joints. Microelectron. Reliab. 2017, 74, 44–51. [Google Scholar] [CrossRef]
  35. Liu, P.; Gu, X.; Liu, X.; Jin, X.; Zhang, Y.; Long, Z. Interfacial reaction of SnAgCu-xNi composite solders on Cu and Ni substrate. In Proceedings of the 5th International Brazing and Soldering Conference, Las Vegas, NV, USA, 22–25 April 2012; pp. 207–212. [Google Scholar]
  36. Cui, J.; Zhai, Q.; Xu, J.; Wang, Y.; Ye, J. Adding Sn on the Performance of Amorphous Brazing Fillers Applied to Brazing TA2 and Q235. J. Surf. Eng. Mater. Adv. Technol. 2014, 4, 342–347. [Google Scholar] [CrossRef] [Green Version]
  37. Kay, D. Liquation of Brazing filler metals—Good or Bad? In Proceedings of the 5th International Brazing and Scoldering Conference, Las Vegas, NV, USA, 22–25 April 2012; p. 402. [Google Scholar]
  38. Hasap, A.N.; Noraphaiphipaksa, N.; Kanchanomai, C. The Microstructure and Strength of Copper Alloy Brazing Joints. Weld. J. 2014, 93, 116–123. [Google Scholar]
  39. Nakajima, H. Fabrication, properties and application of porous metals with directional pores. Prog. Mater. Sci. 2007, 52, 1091–1173. [Google Scholar] [CrossRef]
  40. Gibson, L.J.; Ashby, M.F. Cellular Solids: Structure and Properties. Cambridge Solid State Science Series, 2nd ed.; Cambridge University Press: Cambridge, UK, 1997. [Google Scholar] [CrossRef]
  41. Ashby, M.F.; Evans, A.G.; Fleck, N.A.; Gibson, L.J. Properties of Metal Foams; Hutchinson, J.W., Wadley, H.N.G., Eds.; Butterworth-Heinemann: Oxford, UK, 2000; Volume 40, pp. 40–54. [Google Scholar] [CrossRef]
Figure 1. Schematic illustration of specimen arrangement in a clamp system.
Metals 10 00416 g001
Figure 2. Profile of brazing parameters used in the experiment.
Metals 10 00416 g002
Figure 3. SEM images of brazed joints: (a,e) 660 °C, 10 min; (b,f) 660 °C, 15 min; (c,g) 680 °C, 10 min; (d,h) 680 °C, 15 min. Images (a–d) represent the top side and (e–h) the base side.
Metals 10 00416 g003
Figure 4. Map analysis of joint interface brazed at 680 °C for 10 min: (a) SEM micrograph of the base of the joint; and elemental analysis of (b) Cu, (c) P, (d) Ni, (e) Sn.
Metals 10 00416 g004
Figure 5. Map analysis of joint interface brazed at 680 °C for 10 min: (a) SEM micrograph of the top of the joint; and element analysis of (b) Cu, (c) P, (d) Ni, (e) Sn.
Metals 10 00416 g005
Figure 6. SEM micrographs with marked points (1–4), and EDX peak pattern (with respect to points 1–4) of porous Cu brazed at 680 °C for 15 min.
Metals 10 00416 g006
Figure 7. XRD pattern of surface brazed at 680 °C for 15 min with marked phase distribution.
Metals 10 00416 g007
Figure 8. Microhardness values of samples brazed with different parameters.
Metals 10 00416 g008
Figure 9. Compressive stress-strain curve of porous Copper; (a) as-received, (b) 680 °C, 15 min.
Metals 10 00416 g009
Table 1. EDS composition (at. %) at different points marked in Figure 3b,f for the top and base of the joint brazed at 660 °C for 15 min.
PointBASE OF JOINT 3fTOP OF JOINT 3b
123456
Cu78.489.165.771.2261.2676.74
P20.06.57.924.4623.3619.12
Ni0.91.525.24.3315.183.67
Sn0.62.91.1-0.190.47
Table 2. Composition (at. %) of different points at the top and base of the joint sample brazed at 680 °C for 10 min according to the points marked in Figure 3c,g.
PointBASE OF JOINT 3gTOP OF JOINT 3c
123456
Cu75.9076.8784.0439.8245.4268.16
P21.8621.0613.7121.0218.3611.56
Ni1.651.541.1238.8735.8119.84
Sn0.590.521.130.290.410.44

