Abstract
Recent studies showed that structural changes in amorphous alloys under high pressure torsion (HPT) are determined by their chemical composition and processing regimes. For example, HPT treatment of some amorphous alloys leads to their nanocrystallization; in other alloys, nanocrystallization was not observed, but structural transformations of the amorphous phase were revealed. HPT processing resulted in its modification by introducing interfaces due to the formation of shear bands. In this case, the alloys after HPT processing remained amorphous, but a cluster-type structure was formed. The origin of the observed changes in the structure and properties of amorphous alloys is associated with the chemical separation and evolution of free volume in the amorphous phase due to the formation of a high density of interfaces as a result of HPT processing. Amorphous metal alloys with a nanocluster structure and nanoscale inhomogeneities, representatives of which are nanoglasses, significantly differ in their physical and mechanical properties from conventional amorphous materials. The results presented in this review show that the severe plastic deformation (SPD) processing can be one of the efficient ways for producing a nanocluster structure and improving the properties of amorphous alloys.
1. Introduction
Amorphous alloys are one of the most attractive areas of modern materials science [1,2,3,4,5,6,7]. Amorphous metals and alloys are usually produced by melt quenching at typical rates of ≥106 К/s down to temperatures of 0.2–0.3 Тmelt (Тmelt is the melting temperature), at which diffusion and crystallization processes are suppressed [1,2,3,4]. The advanced functional properties (mechanical, magnetic, corrosion, etc.) of amorphous materials promoted active research in this field. In recent years, the fabrication of the so-called “bulk metallic glasses” (BMGs) [4,5] has been a developing area of research. BMG compositions are selected in such a way that an amorphous structure can be obtained even at cooling rates of 102 К/s, and this enables producing bulk amorphous samples with a diameter of up to several centimeters.
High tensile strength, large elastic strain limit, high hardness, low friction coefficient, good resistance to corrosion, and wear provide great potential for various commercial applications of amorphous alloys [6,7]. Amorphous alloys with unique soft magnetic properties are widely used [6,7]. The atomic structure of metallic glasses determines their mechanical properties. In particular, their tensile strength and yield stress are higher in comparison to their crystalline counterparts. For example, yield stress reaches 2 GPa for Cu-, Ti-, and Zr-based BMGs, 3 GPa for Ni-based, and 4 GPa for Fe-based alloys [8].
The combination of high strength, good corrosion resistance, and reduced elastic modulus provides a promising outlook for amorphous materials for medical equipment and implants, including biodegradable CaMg-based implants [9].
Unfortunately, amorphous materials exhibit extremely low tensile ductility, since their deformation occurs via the formation and propagation of shear bands (SBs), and they fracture catastrophically along the very first SB [1,2]. In this regard, numerous attempts have been made to find a way to improve the ductility via structural modifications of amorphous alloys [10,11,12,13,14]. The main idea of these routes is to form SBs in amorphous phases preliminarily or to obtain amorphous structures consisting of nanoclusters [13]. Preliminary deformation by compression, cold rolling, etc., enables increasing the ductility and other service properties of amorphous alloys [10,11,12] due to the nucleation of secondary SBs and branching of SBs. However, conventional thermomechanical treatment does not allow producing large strains in the case of brittle amorphous materials. A promising way to introduce high strain and, therefore, a high density of structural defects into amorphous solids is the use of severe plastic deformation. Severe plastic deformation (SPD) is a group of metal-working techniques involving very large strains under high pressure [15,16]. In crystalline materials, they result in the formation of “ultrafine” grains (UFG) (d < 500 nm) or nanocrystals (NC) (d < 100 nm) [15,16]. Among various SPD methods, high pressure torsion (HPT) is especially interesting as it can be readily applied for brittle and hard-to-deform materials [15,16].
There are many research groups actively involved in studying the effect of HPT processing on amorphous alloys. In particular, the following groups can be identified: Zhilyaev and Langdon [16,17]; Kovács et al. [18,19,20]; Boucharat and Wilde [21]; Pippan [22]; Zhu [23], Meng [24]; Glezerand Sundeev [25,26,27]; Edalati and Horita [28,29]; Aronin and Abrosimova [30,31,32]; Czeppe and Korznikova [33,34,35]; and other groups. It is worth noting that the effect of HPT processing on amorphous alloys was examined in the section of the book [16], and also quite recently (in 2019), an extensive overview was published on this topic [36]. However, the topic of the effect of HPT processing on amorphous alloys is very broad, and it contains many subtasks; the present review will be interesting for the audience as well. We should note that the author Valiev is a pioneer in the research areas on SPD processing, including HPT processing, of metallic materials for producing a nanocrystalline state [15,37,38], and a leading expert in this field. He and Gunderov, together with other co-authors, conducted one of the first studies on the effect of HPT processing on amorphous alloys [39,40,41,42,43,44,45,46,47,48], and since then, they have performed quite many studies in this area. In this connection, the present review includes, in the first place, the research results obtained by its authors.
In recent years, the influence of HPT processing on amorphous alloys has been investigated in numerous publications [41,47,49,50,51,52,53,54,55,56,57,58,59,60]. It has been shown that in amorphous alloys of certain chemical compositions, SPD processing leads to partial nanocrystallization [41,51,52,53,54]. In amorphous alloys of some other compositions, nanocrystallization during SPD is not observed; however, SPD processing leads to the creation of an extremely high density of SBs in the amorphous matrix and the formation of internal heterogeneity in the amorphous structure [24,50,57]. The produced materials significantly differ in their physical and mechanical properties from amorphous materials with a homogeneous structure. In particular, the formation of internal heterogeneities in the amorphous structure leads to changes in the magnetic, electrical, mechanical, and other properties of alloys. The aim of this review is to present and analyze the effect of SPD processing on the atomic structure of amorphous alloys, their properties, internal energy, and the relaxation processes during heating, as well as the crystallization kinetics of amorphous alloys during subsequent annealing.
2. Atomic Structure of Amorphous Alloys Subjected to SPD
HPT processing results in extremely high densities of shear bands in the amorphous matrix [50]. In general, the spacing between adjacent shear bands is found to be reduced with increasing plastic deformation. In [50], Au49Ag5.5Pd2.3Cu26.9Si16.3 BMG samples were deformed using the HPT technique, under a quasi-hydrostatic pressure of 6 GPa with five revolutions (n = 5) [50]. A modulated structural feature with a large number of shear bands is visible in SEM and TEM micrographs for the cross-section of the HPT-treated samples (Figure 1a,b). The spacing between the shear bands is about 50–100 nm [50].
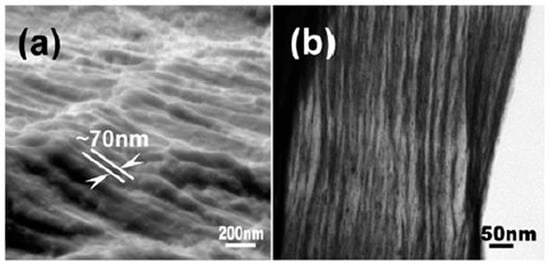
Figure 1.
(a) SEM and (b) TEM images of a cross-section through the Au49Ag5.5Pd2.3Cu26.9Si16.3 bulk metallic glass (BMG) after high pressure torsion (HPT), revealing a high density of shear bands (reprinted from [50], with permission from Elsevier).
It was also shown that after the high-energy ball milling of the Zr70Cu20Ni10 metallic glass, the spacing between the shear bands ranged from 30 to 70 nm [61].
The introduction of shear bands using SPD has a significant effect on both the microstructure and atomic structure of metal glasses [41,50,51,52,53,54,55]. According to some works, excess free volume is accumulated in shear bands in BMGs formed at ambient temperature [62,63]. Hence, the high density of shear bands increases the free volume of an amorphous alloy.
Some other studies have shown that the structure of shear bands is heterogeneous [64,65] and, for example, in the bulk Pd40.5Ni40.5P19 metallic glass, is probably a multilayer heterogeneous structure. It was concluded [65] that the observed inhomogeneous structure of shear bands can be associated with both short and medium ordering in a glassy system. In the study [64], a quantitative analysis showed variations in the local specific volume and local average order for different shear bands and even for different parts of the same shear band. Thus, the shear band differs in excess volume and in the local atomic order from the structure of the surrounding amorphous matrix, and the structure of an amorphous material after SPD is a composite of shear bands and the amorphous material between them [66]. Furthermore, under SPD, in the amorphous phase surrounding the shear bands, complex processes associated with the flow and transformation of point defects also occur [67]. As a result, the entire volume of the material transforms in a complicated manner under SPD.
The transformation path of the amorphous structure depends on the composition of the amorphous alloy and the SPD processing regimes. Among the interesting phenomena observed in amorphous alloys of some compositions is nanocrystallization during SPD processing at room temperature [41,51,52,53,54]. In a series of earlier publications, it was shown that nanocrystallization in the amorphous phase occurs under deformation [66,67,68,69]. In these works, the formation of separate nanocrystals in shear bands during deformation by upsetting, stretching, or microindentation was revealed. For the first time, nanocrystallization of the amorphous alloys during HPT was observed in the work [49,52]. We should note that whereas during conventional deformation, nanocrystallization was observed in only a small amount of the amorphous material in the shear bands, nanocrystallization during HPT was observed throughout the entire volume of the amorphous samples.
In a series of studies [41,42,49,51,52,53,54,70], nanocrystallization during HPT of initially amorphous melt-spun (MS) Nd12Fe82B6, Nd9Fe84B7 ribbons was investigated. In [52], the amorphous MS Nd12Fe82B6 alloy ribbons were subjected to SPD by HPT at room temperature under a pressure of P = 5 GPa. As a result of this processing, monolithic 100%-density disc samples having a diameter of 10 mm and a thickness of 0.2 mm were produced from the initial ribbons. TEM investigations showed that the amorphous structure (Figure 2a) was typical for the initial MS Nd-Fe-B alloy. No crystallites were observed in the bright- or dark-field images, and the selected area electron diffraction (SAED) pattern showed diffusive rings typical for amorphous alloys [49]. Despite this, the structure of the initial alloy was not completely homogeneous, because magnetic measurements revealed a certain amount of crystalline phases of Nd2Fe14B and α-Fe.
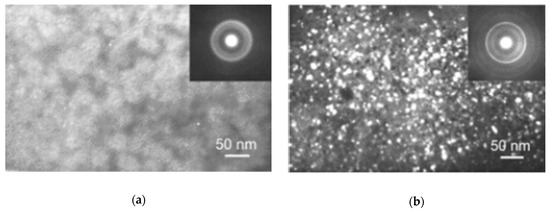
Figure 2.
TEM images and SAED patterns for the Nd12Fe82B6 alloy: (a) the initial melt-spun (MS) state, dark-field image; (b) dark-field image in α-Fe reflex after HPT φ = 16π [49].
After HPT, the microstructure of the alloy changed considerably. In the SAED pattern, one may observe the appearance of the diffraction rings of the nanocrystalline α-Fe phase (Figure 2b). Particles of this phase of about 10 nm in size are clearly seen in the dark-field TEM images (Figure 2b) [49].
A change in the phase composition after HPT is also reflected by a change in the temperature dependences of the specific magnetization σ(T). Figure 3a shows the σ(T) dependence for the Nd12Fe82B6 alloy in the initial MS state and after HPT. The MS state demonstrates a sharp decrease in magnetization during heating from 20 °C to 180 °C. Since the Curie temperature (Tc) of the amorphous Nd-Fe-B phase is about 200 °C, this behavior of the σ(T) dependence points to a large amount of the amorphous phase in the initial MS alloy [52]. Another small kink in this curve at a temperature of 300 °C indicates the presence of the Nd2Fe14B phase with Tc equal to 310 °C [71]. A drop in magnetization down to zero takes place at a temperature of about 770 °C and is related to the transition of α-Fe into the paramagnetic state. Thus, in the initial alloy, there are some amounts of the Nd2Fe14B and α-Fe phases, except for the basic amorphous phase.
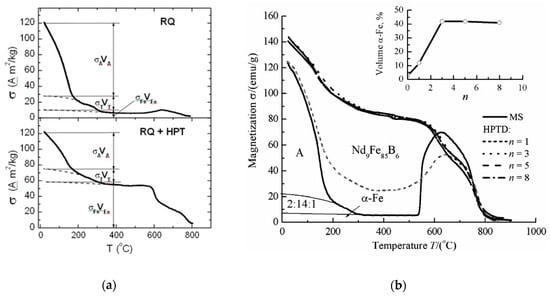
Figure 3.
Temperature dependence of magnetization σ for: (a) the Nd12Fe82B6 alloy in the rapidly quenched (RQ) state and after HPT n = 5 [49]; (b) the MS Nd9Fe85B6 ribbons and samples after high pressure torsion deformation (HPTD) n = 1, n = 3, n = 5, n = 8; inset: the volume fraction of Fe for different numbers of revolutions (reprinted from [52], with permission from Elsevier).
All the phases contained in the alloy are ferromagnetic at room temperature, and their volume fractions can be evaluated approximately, assuming the additive contribution of the phases into the total magnetization:
where σT, σFe, σA are the values of magnetization at 20 °C and VТ, VFe, VА are the volume fractions of the Nd2Fe14B, α-Fe and amorphous phases, respectively. The σFe and σT values are equal to 220 and 100 Am2/kg for the measurement field H = 9 kOe (716.2 kA/m) [68]. The calculations of the alloy phase composition are presented in Table 1 [49].

Table 1.
Phase composition of the Nd12Fe82B6 and Nd9Fe85B6 alloys in the initial MS state and after HPT [49,52].
The dependence of σ(T) for the MS alloy after HPT changed significantly (Figure 3a). The contributions of Nd2Fe14B and amorphous phases to the total magnetization decreased, and the contribution of α-Fe increased greatly. This testifies to a decrease in the content of the amorphous and Nd2Fe14B phases and an increase in the content of the α-Fe phase up to 25%, or almost 10-fold (see Table 1). Therefore, TEM, XRD, and magnetic studies testify that the HPT of the amorphous MS NdFeB alloy leads to the nanocrystallization of α-Fe to the enrichment of the amorphous phase with Nd [49].
It is interesting to note that the Nd2Fe14B phase is decomposed into amorphous and α-Fe phases in the same way as occurs during the HPT of the cast Nd-Fe-B alloys [72,73,74,75,76].
In [52], the high-pressure torsion deformation of the MS Nd9Fe85B6 ribbons was performed, varying the number of revolutions, n, from n = 1 to n = 8. Figure 3b shows the results of thermomagnetic analysis of the MS Nd9Fe85B6 samples in a different state. The initial ribbons contained about 85% of the amorphous phase, 12% of the Nd2Fe14B phase, and 3% of the bcc Fe-based phase. With increasing deformation rate to n = 3, the weight fraction of α-Fe increases to 40%, while that of the amorphous phase decreases (see Table 1). As the inset shows (Figure 3b), an increase in the HPT rate above n = 3 does not lead to a further increase in the volume fraction of α-Fe.
Thus, the HPT processing of the amorphous MS Nd9Fe85B6 and Nd12Fe82B6 alloys leads to the same structural transformation. According to the XRD and thermomagnetic analyses, HPT processing leads to the decomposition of the amorphous phase and the formation of α-Fe nanocrystals. HPT leads to the decomposition of the initial crystalline phase of Nd2Fe14B into nanocrystalline α-Fe and the amorphous phase enriched with Nd. With a further increase in strain (more than three revolutions), the amount of nanocrystalline α-Fe remains nearly unchanged: 40% for Nd9Fe85B6 and 25% for Nd12Fe82B6. Thus, there is certain strain, which corresponds to the stabilization of the structural state of the MS Nd9Fe85B6 alloy. It should be noted that a similar stabilization of grain size and phase composition is also observed in crystalline materials [16].
The amorphous phase, which is formed by the HPT processing, is enriched in Nd in comparison with the overall amount of Nd in the alloy. An increase in the amount of Nd in the alloys results in an increase in the amount of the amorphous phase, which is formed by the HPT processing, in comparison with the amount of the α-Fe phase. It was shown by computation that the chemical composition of the amorphous phase is close to the equiatomic one: Nd 50% and Fe 50%. Thus, for Nd-Fe-B alloys, the chemical composition of the amorphous phase, produced by the HPT processing, weakly depends on the chemical composition of the initial alloy.
In [54], the structural evolution of amorphous Nd9Fe85B6 subjected to HPT at room temperature was studied by measuring positron lifetimes. The study also included the determination of Doppler broadening of positron-electron annihilation photons.
Analysis of positron lifetime measurements showed the following. The ratio curve of pure defect-free Fe gives a horizontal line (Figure 4b). The curve of the freshly prepared MS Nd9Fe85B6 alloy (in the region pL ≥ 20 × 10−3 m0c) lies between the curves of defect-free pure Nd and Fe and differs greatly from the curve of pure Bor. The analysis shows that the chemical environment surrounding the structural free volumes (V) in the freshly prepared alloy MS Nd9Fe85B6 is enriched in Nd and Fe atoms [54]. After HPT, the MS alloy curve moves to the line of defect-free pure Fe (horizontal line). This indicates that vacancy-type defects generated by HPT are mainly surrounded by Fe atoms. This clearly indicates the enrichment of the residual amorphous matrix with Fe atoms.
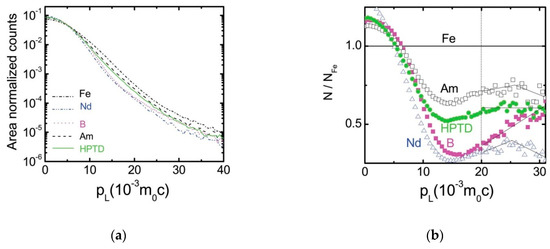
Figure 4.
(a) Coincident Doppler broadening spectra: as-prepared (Am) MS Nd9Fe85B6; HPTD-processed MS Nd9Fe85B6; on defect-free pure Nd, Fe, and B at RT. These spectra are plotted after area normalizing processing. (b) Ratio curves of the coincidently measured Doppler broadening spectra (Am) MS Nd9Fe85B6; HPT MS Nd9Fe85B6; pure Nd, Fe, and B (at RT). All spectra are normalized to the spectrum of pure Fe (horizontal line). The shape of the ratio curve indicating that the HPT-induced vacancy-type defects are dominantly surrounded with Fe atoms (reprinted from [54], with the permission of AIP Publishing).
The following scheme was proposed in [54]: during HPT, the vacancy-type defects are induced in the amorphous phase, and deformation leads to the predominant association of Fe atoms with defects of the vacancy type and increases the mobility of Fe atoms. This contributes to the enrichment of some forms of amorphous matrices with Fe atoms and significantly reduces the crystallization activation energy. As a result, large-scale α-Fe nanocrystallization occurs during HPT treatment at room temperature.
The influence of HPT processing on the amorphous structure of MS Ni44Fe29Co15Si2B10 was investigated in [77]. The HPT processing was performed under a pressure of 5 GPa through different numbers of revolutions (from 0.5 to 8) at temperatures of 293 and 77 K. Nanocrystallization under HPT at temperatures of 293 and 77 K is observed for this material. Nanocrystallization leads to the formation of the γ-phase (face-centered cubic) in the initial amorphous phase of Ni-Fe-Co alloys [77]. Both heterogeneous deformation through the shear bands and nanocrystallization in shear bands are observed in amorphous Ni44Fe29Co15Si2B10 at the initial stage of HPT (for the 1st revolution). According to this work, a further increase in strain results in a change in the deformation mechanism. Shear bands are no longer observed. Instead of shear bands, a homogeneous distribution of nanoparticles of the crystalline phase with an average size up to 10 nm is observed. It was suggested that an increase in the number of revolutions (more than one) results in delocalization of the plastic flow overall and in shear bands in particular. It seems that the process of plastic deformation was transformed into a quasi-homogeneous one. This type of plastic flow corresponds to the deformation behavior of amorphous alloys at high temperatures, close to the glass transition temperature. In this case, the effects of a local temperature increase, which correspond to the shear deformation, are observed throughout the entire volume of the deformed material. The formation of the crystalline phase occurs not in localized shear bands, but in the entire volume.
As mentioned before, during the traditional deformation of amorphous alloys, nanocrystallization was observed in the areas of localized deformation in shear bands [66,67,68,69]. During SPD processing, nanocrystallization takes place in the entire volume of the deformed sample. This is due to a very high degree and high homogeneity of deformation during SPD. The mechanism of nanocrystallization is still unclear. Many studies show that during traditional deformation, this process is athermal in nature [66,69]. On the other hand, in [66], an assumption was made that the formation of nanocrystals in shear bands occurred due to the diffusion enhancement, which appeared as a result of defects produced by deformation of the amorphous alloy rather than due to adiabatic heating in local areas. This assumption seems to be well grounded, but the following should be noted. As we have found, α-Fe crystals are formed in an amorphous Nd-Fe-B alloy during HPT. As was revealed in [78], α-Al nanocrystals were formed during deformation of amorphous Al-based alloys. It appears that for these alloys, nanocrystallization during HPT is accompanied by decomposition of the amorphous alloy with the formation of nanocrystals of the main metal, whereas the neighboring areas become enriched with alloying elements. The decomposition of the amorphous phase with further consolidation of the main element in nanofields is observed prior to nanocrystallization. The phenomenon of a similar decomposition of alloys during ball milling was recently discussed in [79]. As was shown in [79], HPT processing can induce local redistribution of elements in alloys, as well as changes in the concentration of the main element in nanofields due to the formation of vacancy flows.
The following explanation of the observed effect was proposed [58]. The temperature of nanocrystallization of pure metals decreases significantly with a decrease in grain size; for the nanostructured state, nanocrystallization occurs at temperatures of 0.25 Tmelt [16,31,80]. Moreover, due to the high values of the driven force of nanocrystallization, the crystallization temperature of amorphous films of pure metals (Fe, Ni) produced by deposition on a cold substrate is about 4 K [80]. Due to the relative simplicity of the crystalline lattice of a pure metal, the lattice can be easily restored, since to move adjacent atoms to the positions of the crystalline nodes, it is sufficient to move them to distances shorter than atomic radii. This process does not require diffusion activity. Thus, the crystallization of clusters with an increased concentration of the main metal formed during SPD occurs at room or even lower temperatures [58].
It was assumed [77] that with a local temperature growth, high values of local stresses cause crystallization, otherwise it would be difficult to explain the events of nanocrystallization that were observed at cryogenic temperatures (77K) [77]. It has been suggested that stress induces temperature-dependent processes: high values of stresses lead to the lowest temperature value of the temperature-activated process of crystallization.
The following hypothesis was proposed to explain the processes of stabilization of the structural state under HPT-induced nanocrystallization: the formation of crystals occurs during the processing, not after its completion [58,77]. During the HPT processing, nanocrystals are formed in the amorphous phase, and they affect the processes of further deformation. The crystallites interact with the newly formed shear bands in the amorphous matrix. As a result, the generation and accumulation of dislocations inside the crystallites occur. The highest dislocation density will obviously be near the border of the crystallite/amorphous matrix, where the interaction between the shear bands and crystalline boundaries will be the most active [77]. At some point (the moment of the highest dislocation density in the frontier zone), the frontier zone or even the entire crystalline particle spontaneously goes into the amorphous state due to the minimum of the free energy of the amorphous state in comparison with the high-defective crystal, that is the stress-induced process of crystals “dissolution” in the amorphous matrix will occur. Very small crystalline particles (less than 10 nm) are not able to accumulate dislocation-type defects [81]. Therefore, the nanocrystalline particles of the amorphous matrix smaller than 10 nm will not be dissolved under HPT processing because they will effectively push dislocations at the interface and remain defect-free. In other words, nanocrystals with a size less than 10 nm, arising in the amorphous matrix either directly upon crystallization in shear bands or under partial deformation “dissolving” of larger crystallites, will have structural stability during further stages of HPT processing. Thus, a new amorphous-nanocrystalline state, stable in the conditions of deformation, is formed. Based on the foregoing, it is easy to explain the fact that in all the studies, in which the process of crystal formation during the SPD of amorphous alloys was studied, the crystals were always nanoscale, i.e., only nanocrystallization was observed, and relatively large crystals were never observed [77].
Complex structural transformations take place during HPT in the amorphous MS Ti50Ni25Cu25 alloy. According to [41,51], during the HPT processing of this alloy, very small (about 3 nm in size) nanocrystals of the B2 (Ti2NiCu) phase similar to the composition of the amorphous phase are formed, and the volume fraction of nanocrystals is probably not large. However, in addition to some nanocrystallization in the Ti50Ni25Cu25 alloy during the HPT processing, other transformations of the structure and, consequently, the properties of this alloy took place. In the studies [55,56], the microstructure of the amorphous MS Ti50Ni25Cu25 ribbons subjected to HPT was investigated. HPT processing was performed for up to 10 revolutions under a pressure of 6 GPa at room temperature (RT) and at a temperature of 150 °C. As a result, solid samples with a thickness of 0.2–0.3 mm and a diameter of 10 mm were produced from the initial MS ribbons. According to the XRD and SAED patterns, the structure of the HPT-processed samples, as well as that of the initial MS ribbons was amorphous [55]. The bright-field image of the initial Ti50Ni25Cu25 alloy exhibits in this case the characteristic “salt-pepper” contrast, which is typically observed in amorphous materials. Figure 5b shows a TEM image of the MS alloy subjected to HPT at RT. The SAED pattern contains an amorphous halo. In the bright-field image, brighter and darker regions with a size of about 20 nm can be distinguished [55].
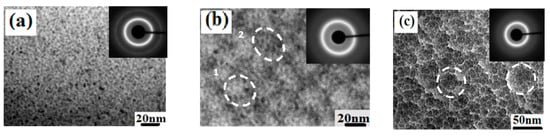
Figure 5.
TEM images of the MS Ti50Ni25Cu25 alloy: (a) the initial MS state, bright-field image, SAED pattern; (b) HPT at T = 20 °C, bright-field image, SAED pattern, (c) HPT at T = 150 °C, bright-field image, SAED pattern; the dashed lines encircle the dark and bright regions (“clusters”) in the microstructure [55].
Similarly, the SAED pattern from the sample subjected to HPT at 150 °C contains an amorphous halo. The microstructure exhibits the following features observed using TEM (Figure 5c). Dark regions (“clusters” with a size of about 40 nm) become visible in the bright-field image (Figure 5c). These “clusters” are separated from each other by thin brighter interfaces, and they also have internal contrast. Small nanocrystals of the B2 phase about 3 nm in size in HPT-processed MS Ti50Ni25Cu25 are observed in the dark-field TEM image. However, the size of nanocrystals is much smaller than the size of clusters visible in the bright-field image. Thus, it follows that nanocrystals and clusters are different structural elements.
Hence, the observed contrast in the TEM bright-field micrographs differs for the samples in different conditions: for the initial amorphous ribbons, for the MS alloy after HPT at 20 °C and after HPT at 150 °C, suggesting that the structure of the material depends on the temperature of deformation. Moreover, these “clusters” represent some kind of amorphous structure. This contrast could be the result of the existence in the amorphous phase of regions with a reduced free volume (bright regions, bright boundaries) and with an enhanced free volume (dark regions).
During the HPT processing of a number of other amorphous alloys, nanocrystallization was not observed [24,50,57,58]. The influence of HPT on the Au49Ag5.5Pd2.3Cu26.9Si16.3 BMG samples was investigated in [50]. The atomic structure of the as-cast and SPD-treated specimens was analyzed by X-ray diffraction using a synchrotron radiation source at the BW5 station of HASYLAB. From X-ray diffraction analyses, the structure factor, S(q), and the pair distribution function (PDF), g(r), were deduced [82].
Investigation by X-ray diffraction using the synchrotron radiation detected the difference in the pair distribution function between the as-cast and SPD-treated Au-BMG samples recorded at ambient temperature and in a supercooled liquid state at a temperature of approximately 10 K below the onset of crystallization, Tx. As was shown in [50], the SPD treatment leads to the rearrangement of atoms in the BMG, e.g., atoms that were originally located in the first, second, and following nearest neighbor shells are displaced into the space between these shells. Consequently, the degree of short-range order (SRO) of atomic arrangements in the SPD-treated sample was reduced. This corresponds to an increase in free volume of approximately 0.6% and, consequently, to an increase in the lattice strain of about 0.2%. This implies that shear strain is mostly accumulated in high-density shear bands rather than between atoms. The differences in the atomic structures between the SPD-treated and as-cast BMGs is preserved even in the supercooled liquid region [50].
Comparing the PDFs for the as-cast samples with the SPD-treated below and/or above Tg, one can conclude that the temperature-dependent structural changes detected in the SPD-treated sample are weaker than those in the as-cast sample. These results indicate that the SPD-treated sample is relatively unstable at room temperature and during annealing, but it experienced less structural changes when it was heated at 2.5 K·min−1 up to the supercooled liquid (before crystallization). Thus, a new amorphous structure in the Au-based BMG formed as a result of HPT, consisting of an amorphous phase with high-density shear bands and a lower degree of short-range order [50]. The HPT processing of Au-based BMGs leads to the formation of a nanoglass-type structure with a reduced density and modified physical properties [83,84].
Thus, HPT can lead to complex structural modifications of the amorphous state even without nanocrystallization of the amorphous phase. Herewith, it can lead to the formation of a high density of shear bands, where the spacing between the bands is about 50–100 nm [50]. In other works [24,41,52,53,54,55,56,57,85], shear bands were not observed in the amorphous structure after HPT processing.
As mentioned earlier, in [77], it was shown that under HPT for the number of revolutions >1, the process of plastic flow became quasi-homogeneous. For some cases, TEM showed the formation of a cluster structure. For MS TiNiCu- and Zr-based BMGs, deformation proceeds through the formation of a high density of shear bands, which disappear in the final stages.
Therefore, it is possible to propose the following model of the transformation of an amorphous structure in MS TiNiCu during SPD. In the first stage, in initial amorphous structure of primary SBs appears, and the spacing between the SBs is several thousand nanometers (Figure 6). In the second stage, the subsequent increase in strain leads to the formation of secondary bands, with the spacing up to one hundred nanometers. Perhaps, in the third stage, a partial redistribution of the free volume and relaxed atoms in the amorphous state after SPD takes place, and a nanoglass-type structure is formed.
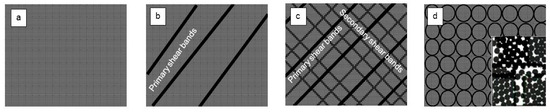
Figure 6.
The proposed model of the transformation of the amorphous structure during SPD: (a) initial amorphous structure; (b) appearance of primary shear bands (SBs) under a low strain; the spacing between the SBs is several thousand nanometers; (c) subsequent increase in strain leads to the formation of secondary bands, with the spacing up to one hundred nanometers; (d) relaxed amorphous state after SPD (inset: enlarged view).
It is necessary to say a few words about the structure and properties of nanoglasses produced by the bottom-up technology.
Recent studies have revealed methods to introduce microstructural defects in the form of glass-glass interfaces into the homogenous structure of a glass so that amorphous solids result with microstructures that are comparable to the microstructures of polycrystalline materials. About 20 years ago, Herbert Gleiter and his group developed the idea of nanoglasses, in which nanometer-sized clusters with an amorphous structure comparable to the one of the corresponding melt-cooled glasses wre connected by interfaces with reduced atomic densities [83,84,86,87]. This idea may be understood by comparing the microstructure of nanoglasses with the microstructure of nanocrystalline solids. It is well known that one way of introducing a high density of interfaces into crystals is by consolidating nanometer-sized crystals with identical (Figure 7c) or different (Figure 7d) chemical compositions.
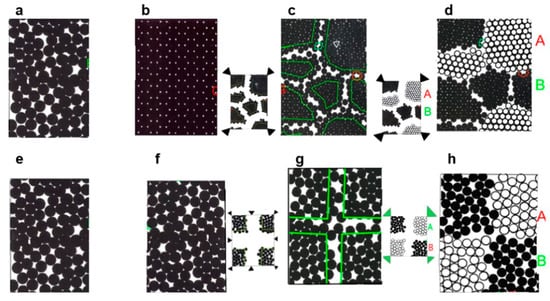
Figure 7.
The analogy between the defect and the chemical microstructures of nanocrystalline materials and nanoglasses: (a) Melt of identical atoms and (b) a single crystal. The defect microstructure (c) and chemical microstructure (d) of nanocrystalline materials are compared with the corresponding defect microstructure (g) and the chemical microstructure (h) of nanoglasses. (f) displays the glassy structure obtained by quenching the melt shown in (e) (reprinted from [86], with permission from Elsevier).
Nanoglasses are based on the idea [83,84,86,87,88,89,90,91] of applying analogous approaches for creating glasses with controllable defect microstructures in the form of interfaces between adjacent glassy regions with identical or different chemical compositions. Again, if we start from a melt consisting of one kind of atom only (Figure 7e), a glass may be obtained by quenching the melt with a sufficiently high cooling rate (Figure 7f). By analogy to Figure 7c, it is proposed to introduce a high density of glass–glass interfaces by consolidating nanometer-sized glassy clusters (Figure 7g) with identical or different chemical compositions (Figure 7h).
Initially, nanoglasses were synthesized using the method of inert gas condensation (IGC), i.e., the consolidation of amorphous powder-clusters (IGC-samples). This production process involves the following two steps. During the first step, nanometer-sized glassy spheres are generated by evaporating (or sputtering) the material in an inert gas (e.g., He) atmosphere. The resulting glassy nanospheres are accumulated on the surface of a cold finger. After scraping from the cold finger, the material in the form of flakes is compacted into a pellet shaped nanoglass specimen. The compaction is performed at high pressures up to 5 GPa. This production procedure is basically identical to the one used to generate nanocrystalline materials. Until now, using this method, nanoglasses have been synthesized from various alloys: Au-Si, Au-La, Fe-Si, Fe-Sc, La-Si, Pd-Si, Ni-Ti, Ni-Zr, and Ti-P [86]. Using magnetron sputtering under certain conditions (gas pressure, target–substrate orientation), almost all amorphous alloys can be produced in the form of nanoglasses [86]. Both described bottom up methods have certain disadvantages, such as the possible oxidation and contamination of nanopowders during the preparation processes and the presence of pores in samples after consolidation; nanoglass materials processed by magnetron sputtering usually contain columnar “grains”.
It is possible that the structures produced by SPD in several amorphous alloys are comparable in some aspects with the structures of the nanoglass-type produced by IGC. However, at present, there is no direct evidence for this. Special studies are required to answer this question.
3. Transformation of the Properties of Amorphous Alloys as a Result of SPD Processing
One of the widely used characteristics of amorphous materials is the free volume [5,8]. XRD is one of the possible methods for estimating the free volume ΔV in amorphous alloys, including those subjected to HPT [61,78,92,93]. X-ray diffraction makes it possible to determine the radius of the first coordination sphere (R1) of the amorphous phase and the change in ΔV as a result of structural transformations [61]. Studies have shown that HPT leads to an increase in the value of R1, and an increase in free volume [61].
Samples of HPT-processed BMG contain many SBs [50,94,95]. It is known that the atomic structure of the SBs and the regions nearest to them also differ from the amorphous matrix ΔV [13]. Therefore, the structure of BMG subjected to HPT can be represented as two phases: the structure in SB and the amorphous structure in the matrix. With large strains, ΔV of the matrix can also change. It is interesting to use direct density measurement to estimate ΔV and compare these values with ΔV obtained using XRD. An estimate of the change in ΔV in the HPT of amorphous alloys from a change in R1 in accordance with XRD may show a significant error. However, this approach can also be used to analyze changes in the amorphous structure during HPT.
Usually, the hydrostatic weighing method is used to measure the density, and the density, in turn, depends on the free volume [96]. However, the application of this method to determine the density of samples subjected to HPT is difficult, due to the complex shape of the samples themselves. In [97], a new unique method of direct density measurement was proposed. In [98], XRD and this new method for density measurement of small samples [97] were used in order to measure changes in density and free volume of the amorphous alloy Zr62Cu22Al10Fe5Dy1 subjected to HPT.
According to XRD, the structure of the as-cast and HPT-processed Zr62Cu22Al10Fe5Dy1 BMG is amorphous (Figure 8a). The position of the first amorphous halo shifts towards the lower angles after HPT (Table 2). The values of the R1 could be estimated using the Ehrenfest equation [78,93]:
where θ is the scattering angle and λ is the radiation wavelength. The initial BMG and BMG after HPT n = 5 at RT and 150 °C have the R1 2.999, 3.003, and 3.006 Å, respectively (Table 2) [98]. The variation of R1 is correlated with the relative variation of the free volume ΔV by the equation [21]:
where R0 and RHPT are the R1 sphere of the initial and HPT-processed BMG, respectively; V0 and VHPT are the mean atomic volumes of the initial and HPT-processed BMG, respectively. HPT at RT and 150 °C lead to an increase in the ΔV by 0.44 and 0.74%, respectively. HPT leads to an increase in the values of full width at half maximum (FWHM). The increase in FWHM was also explained by the structure transformation [92].
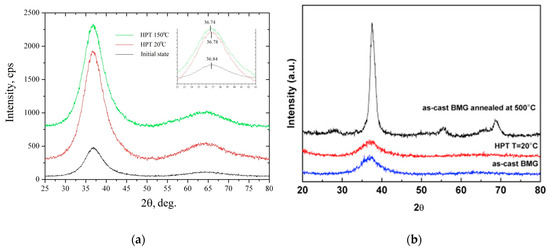
Figure 8.
X-ray diffraction patterns of: (a) as-cast Zr62Cu22Al10Fe5Dy1 and the specimens subjected to HPT at temperatures of 20 and 150 °C [98]; (b) as-cast Zr62Cu22Al10Fe5Dy1 after HPT at RT and after annealing at temperatures 500 °C for 10 min (reprinted from [95], with the permission of AIP Publishing).
Table 2.
Parameters of the amorphous structure of the Zr62Cu22Al10Fe5Dy1 BMG in the initial state and after HPT (n = 5) processing at temperatures of 20 and 150 °C from XRD and direct density measurements [98].
The formation of an asymmetrical amorphous halo reflects the separation of the amorphous phase into amorphous phases with different compositions [98]. The effects of separation of the amorphous phase after HPT in Nd-Fe-B and Al-Ni-RE amorphous MS alloys were observed in [41,93]. The amorphous halo of the initial Zr62Cu22Al10Fe5Dy1 BMG retains its symmetrical shape after HPT processing [98], which means the absence of HPT-driven chemical separation in this BMG.
The density of the as-cast and HPT-processed Zr62Cu22Al10Fe5Dy1 BMG was measured using the new technique [97]. The density measurements demonstrate that the initial Zr62Cu22Al10Fe5Dy1 BMG has a density ρ equal to 6.98 kg/m3 (Table 2) [98], which correlates well with data for bulk samples of this BMG produced by hydrostatic weighing [96]. HPT at temperatures of 20 °C and 150 °C leads to a decrease in the density values (Δρ) by 2.1 and 1%, respectively, in comparison with the initial state (Table 2) [98].
A decrease in density values for samples after HPT treatment may be due to an increase in free volume. It was shown on the Zr62Cu22Al10Fe5Dy1 BMG alloy, subjected to HPT at a temperature of 150 °C, that the Δρ value obtained from direct density measurements was close to the ΔV value obtained by the XRD method. The corresponding Δρ = 2.1% for BMG treated with HPT at 20 °C is much larger than the ΔV = 0.44% [98], which is probably due to the fact that HPT at a lower temperature can lead to the formation of pores or cracks in the HPT-treated sample, although SEM studies do not reveal the presence of pores and cracks in the samples. However, it should be borne in mind that pores and cracks may not be detected during microscopic studies, if they are nanometer in size. This feature introduces an additional error into the ΔV values determined by the direct method. It should be noted that the increase in ΔV values by 0.44 and 0.74% obtained in work [98] is close to the ΔV values (up to 1%) observed in other HPT-processed BMGs [61].
The value of ΔV = 0.44% obtained by XRD for BMG after HPT at room temperature is less than the value of ΔV = 0.74% for samples treated with HPT at 150 °C, i.e., processing at a higher temperature leads to a more expressed formation of free volume. It is possible that an increase in the temperature of HPT to 150 °C should contribute to the deformation of BMG and the generation of SB in the sample.
In [57], the behavior of Zr62Cu22Al10Fe5Dy1 BMG after HPT during nanoindentation and its sensitivity to the strain rate were investigated. Samples in the form of disks were subjected to HPT n = 5 at room temperature and at 150 °C. According to XRD, differential scanning calorimetry (DSC), and TEM, the structure of the initial BMG was amorphous. Annealing at 500 °C caused partial crystallization of BMG, as shown in the X-ray diffraction patterns of Figure 8b.
The mechanical behavior of the as-cast BMG and samples after HPT is markedly different. Serration was visible on the nanoindentation curves for the as-cast BMG and annealed at 370 °C. In contrast, BMG after HPT at room temperature did not exhibit a serrated flow (Figure 9a). It can be assumed that the HPT treatment led to more homogeneous deformation compared to the as-cast BMG during nanoindentation due to an increase in the free volume and concentration of shear bands [99].
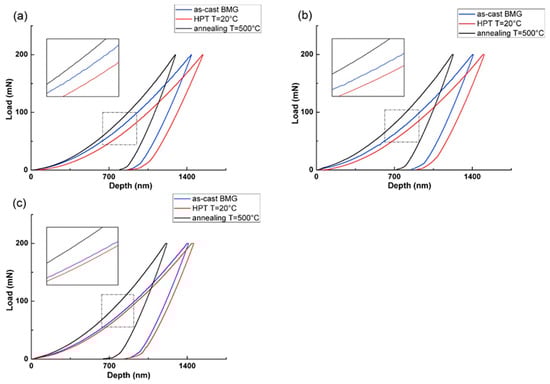
Figure 9.
Typical load–penetration curves for the as-cast BMG, as-cast BMG subjected to HPT at 20 °C, and BMG annealed at 500 °C, tested at equivalent strain rates (a) 0.0025 s−1, (b) 0.01 s−1 and (c) 0.05 s−1 (reprinted from [95], with the permission of AIP Publishing).
The strain rate sensitivity m was calculated from the nanoindentation data in [95]. HPT at room temperature leads to a significant 2.5-fold increase in the parameter m, from m = 0.014 to m = 0.036, while the elastic modulus decreases slightly, from 90 to 85 GPa; thus, the correlation between Young’s modulus and m was found. Moreover, HPT leads to a decrease in hardness. Annealing at 500 °C leads to a decrease in m by 0.01. This is typical for RT straining of crystalline alloys. Interestingly, HPT at 150 °C leads to an increase in Young’s modulus and hardness, but m increases as well (as compared to the initial BMG). The changes in m can be explained by changes in the ΔV and its distribution induced by HPT.
The following pattern of structural changes induced by HPT may be proposed. HPT introduces a significant amount of SB into the amorphous matrix and forms boundaries with an increased ΔV. Therefore, for HPT samples, the deformation area causes the propagation of many shear bands previously formed under HPT, which leads to a more uniform flow, which is expressed as the disappearance of the serrated flow on the indentation curve for the HPT sample and, consequently, an increase in m. The clusters in nanoglasses play the same role [86].
In [100], the effect of HPT on the tendency to plastic flow in the Zr60Cu18.5Nb2Ni7.5Al10Ti2 BMG was studied using microindentation and measurements of the relative height of the ‘‘pileup” at the base of the indent. The BMG are characterized by the formation of a “pileup” at the base of the indent during microindentation because of a tendency to local plastic flow. The plasticity of the deformed volume is determined from the ‘‘pileup” [101]. To assess plasticity, one should correlate the ‘‘pileup” height in the recovered indent with depth H [101]:
The h had been adjusted by reducing it to constant HV in the following form:
where is the microhardness after HPT (n is number of anvil revolutions) and is the microhardness in the initial state.
At HPT n = 2, the of the Zr60Cu18.5Nb2Ni7.5Al10Ti2 BMG increases by 35–50%. At n = 5, the abruptly decreases and becomes lower than that in the initial BMG [100].
Nanoglasses may exhibit unique properties as compared to their homogeneous amorphous alloy [83,84,86,87]. The properties of nanoglasses may be modified by controlling the size of the glassy regions and by varying their chemical composition. A Fe90Sc10 nanoglass is (at 300 K) ferromagnetic, whereas the corresponding MS glass is paramagnetic. Moreover, nanoglasses were more ductile, more biocompatible, and catalytically more active than the corresponding MS glasses. Thus, varying the structural state of amorphous alloys provides an opportunity to control the properties [86].
As shown in the above section, HPT leads to the transformation of the structure of amorphous alloys, the formation of SB, nanocrystallization, and the formation of inhomogeneities similar to the structure of nanoglasses. Correspondingly, HPT leads to essential transformations of the properties of amorphous alloys.
The results of studies of the effect of HPT on the structure of MS Ti50Ni25Cu25 have already been presented above [54]. Tensile tests of the initial Ti50Ni25Cu25 ribbon and the HPT-processed Ti50Ni25Cu25 samples were conducted [102]. The vein-like pattern, typical for amorphous materials [103,104,105], is observable on the fracture of initial MS Ti50Ni25Cu25. The distance between the expressed veins is about 10 µm (Figure 10a). The veins become more branched, and the distance between them is smaller: about 3 µm after HPT RT (Figure 10b). HPT at 150 °C leads to the appearance of areas with dimples with a size of about 3 µm [102]. Such fracture corresponds to a more ductile fracture behavior. The changes in the fracture surfaces can be interpreted as a successive increase of the material’s local ductility due to HPT, which is connected with changes in the structure after HPT.
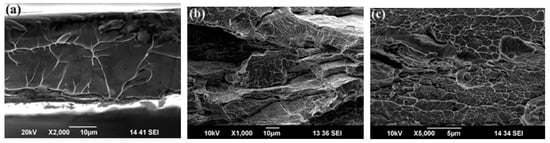
Figure 10.
Fracture surface of specimens after tensile tests: (a) the initial amorphous TiNiCu ribbon; (b) HPT at T = 20 °C; (c) HPT at T = 150 °C [102].
Enhanced tensile ductility of the Zr65Al7.5Ni10Cu12.5Pd5 BMG after HPT was reported in [85]. The BMG was subjected to a compression stage and HPT processing. The deformation behavior was analyzed using the digital image correlation (DIC) method and SEM. The changed ΔV and possible nanocrystallization were studied by DSC, positron annihilation spectroscopy, TEM, and synchrotron XRD. Studies showed that numerous SB nuclei were formed during tensile tests through shear transformation zones (STZs), which occurred in softer vacancy cluster regions, and that SB propagation was impeded by the typical free volume regions and SB interactions. The finite element method (FEM) was performed to investigate theoretically during HPT and residual stresses after HPT. The deformation behavior of the initial, compressed, and HPT specimens was investigated. The yield strengths of the initial and compressed BMG were similar (Figure 11a) [85]. The tensile deformation behaviors of the HPT specimens were different as compared with that of initial BMG. The values of yield strength of the HPT specimens were lower. The stress-strain curves demonstrated clear work-hardening behavior. The maximum strengths exceeded the yield stress of the initial BMG. HPT processing led to an increase of the plastic deformation region (DIC analyses), and the strain distribution became more homogeneous (Figure 11b) [85].
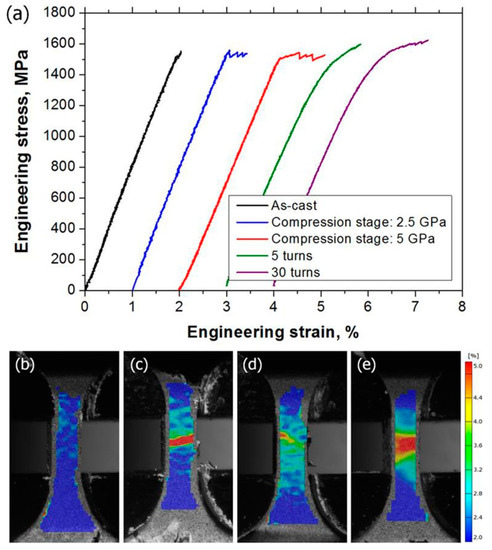
Figure 11.
(a) Stress-strain curves of the as-cast and HPT-processed BMGs and the strain distribution of (b) the as-cast specimen, (c) the compression-stage HPT specimen, (d) the 5 turn HPT specimen, and (e) the 30 turn HPT specimen before fracture [85].
Investigations revealed that the HPT-processed specimens had a heterogeneous microstructure, consisting of a mixture of SBs and undeformed matrix. The heterogeneity prevented strain localization. In [85], it was also assumed that the work-hardening behavior with a tensile ductility of the Zr65Al7.5Ni10Cu12.5Pd5 BMG resulted from the multiple SB caused by uniformly distributed heterogeneous microstructures without cracks or pores after HPT.
It was shown that the HPT of the Zr-based BMG led to a decrease in the elastic modulus E. The simultaneous effect of a decrease in the E and an increase in tensile ductility was crucial for applications of amorphous alloys.
4. Influence of HPT on the Behaviors of Amorphous Alloys during Annealing
In [24], the relation between hardness (HV), elastic modulus (E), and relaxation enthalpy (ΔH) of HPT-processed BMG was investigated. The Zr50Cu40Al10 BMG was subjected to HPT under a pressure of 5 GPa at room temperature for up to 50 revolutions. Both elastic modulus E and hardness H, which were measured using nanoindentation, decreased with an increase in the number of revolutions (Figure 12a) [24].
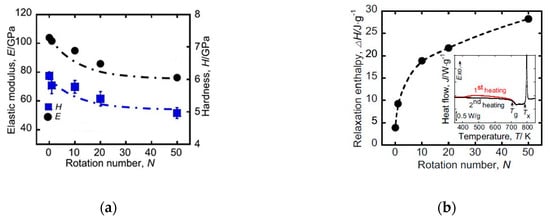
Figure 12.
(a) Elastic modulus and hardness as a function of the number of revolutions. The values for the initial BMG are plotted for n = 0. (b) Structural relaxation enthalpy as a function of the number of HPT revolutions. The value for the initial Zr50Cu40Al10 BMG is plotted for n = 0. The inset shows the DSC curves of the sample deformed by HPT for 50 revolutions, where Tg and Tx denote the glass transition and crystallization temperature, respectively. The red and black lines denote the first and second heating curves, respectively (reprinted from [24], with the permission of AIP Publishing).
The specimen for the DSC measurement was heated two times: the first time above the finishing of glass transition (743 K), and the second time above the crystallization temperature up to 873 K. The structural relaxation enthalpy ΔH was measured as the difference between the first and second heating DSC in the range of 400–730 K. The DSC curves for the HPT-deformed samples showed a pronounced exothermic peak due to structural relaxation in the temperature range below the glass transition temperature (Tg). An example of the DSC curve for the sample deformed by HPT for 50 revolutions is shown as an inset in Figure 12b. HPT did not alter Tg significantly, but led to a pronounced exothermic heat flow due to the relaxation of the deformed structure. Figure 12b shows an increase in the structural relaxation enthalpy with an increase in number of revolutions [24]. The relaxation enthalpy exhibited an excellent linear correlation with the observed decrease in the values of hardness and elastic modulus [24].
The observed decrease in hardness and elastic modulus can be attributed to the rejuvenated structure by HPT deformation. Local atomic environments in the rejuvenated structure BMG have a low local shear modulus. Thus, they are potential sites to become an STZ under the stress. The introduction of a rejuvenated volume decreases the overall mechanical strength. This is supported by the good linear correlation between E and H and the relaxation enthalpy [24]. It was shown that for the initial BMG state, the value of ΔH =5 J/g, and after HPT, it grew up to 25 J/g [24].
In [50], the DSC investigation of the as-cast and HPT-treated Au49Ag5.5Pd2.3Cu26.9Si16.3 BMG was conducted. The increase of the free volume and ΔH was suggested by the broad exothermic peak prior to the Tg, (Figure 13). The Tg remained unaltered (404 K) for all samples (as-cast, HPT, and HPT-treated specimen stored for three months under RT), whereas the crystallization behavior was significantly altered after HPT. A considerable exothermic event in the below Tg was detected in the HPT sample as compared to the initial state (inset of Figure 13). The ΔH was about 0.33 kJ mol−1 for the HPT sample, and only ΔH = 0.06 kJ mol−1 for the initial state. The area of this peak decreased for the HPT sample aged at RT for three months by 55% (H ~ 0.15 kJ mol−1). These observations suggested that the HPT enhanced the free volume of the BMG. During annealing at RT for three months, the free volume was recovered. The crystallization temperature Tc for the HPT sample was about 12 K lower than that measured for the initial state. Furthermore, the crystallization signal in the DSC curve HPT sample split into two peaks, indicating that the mode of crystallization was modified by HPT.
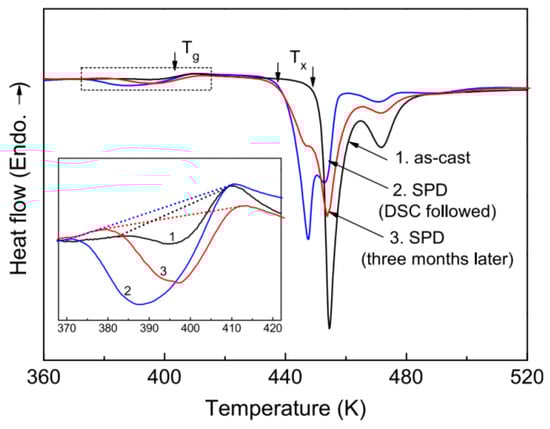
Figure 13.
DSC traces of the as-cast and SPD-processed Au49Ag5.5Pd2.3Cu26.9Si16.3 BMG. The third DSC curve was obtained for the SPD-treated sample after aging for three months at ambient temperature. The inset is the local magnification of the selected regime below Tg. A heating rate of 20 K·min−1 was used in all DSC measurements, endotermic effects up (Endo.) (reprinted from [50] with permission from Elsevier).
In [54], the relaxation enthalpy was measured during heating in the range of 20–400 °C for the initial MS TiNiCu and for the sample after HPT processing n = 5 at RT and 150 °C. Tc and ΔH are shown in Table 3. As a result of HPT at RT, the Tc temperature dropped down by about 40 °C in comparison with the initial state, and Tc dropped down by 20 °C as a result of HPT at 150 °C (Table 3). HPT led to a decrease in ΔH in comparison with the initial ribbons (Table 3). The value of ΔH remained virtually the same for the samples processed by HPT at RT, 50, and 100 °C (Table 3). For the sample, subjected to HPT at 150 °C, ΔH dropped 1.5 times in comparison with the HPT-treated samples at RT and approximately two times in comparison with the initial ribbons. The reduction of the ΔH may be associated with the reduced free volume ΔV in the amorphous phase [24].
Table 3.
Crystallization temperatures and energy of structural relaxation occurring during heating for the as-spun and HPT-processed MS Ti50Ni25Cu25 samples [55].
Thus, the HPT processing results in an increase in the relaxation energy for the Zr50Cu40Al10 and Au49Ag5.5Pd2.3Cu26.9Si16.3 BMGs [24,50] and in a decrease for MS Ti50Ni25Cu25 [54]. According to our data, the value of relaxation enthalpy for MS Ti50Ni25Cu25 is significantly higher than the value of relaxation enthalpy of the Zr50Cu40Al10 BMG. We can speculate that the HPT processing of the state with increased (probably corresponding to the maximum possible stored energy due to high quenching rates of producing) values of relaxation enthalpy (melt-spun ribbon) leads to a decrease in these values due to processes of relaxation. However, for BMGs, apparently, the opposite tendency for changes in energies is observed. From the initial low values, relaxation enthalpy increases due to the accumulation of energy via HPT processing. On the other hand, SPD leads to partial nanocrystallization in the Ti50Ni25Cu25 alloy [41,51], which should lead to a decrease in relaxation energy. At the same time, in Zr- and Au-based BMGs, HPT-nanocrystallization does not occur. The question of whether SPD-induced nanocrystallization is the only way to reduce the relaxation energy under SPD is still open.
The process of crystallization taking place during annealing of amorphous alloys after HPT significantly differs from this of the non-deformed analogues [41,51]. For instance, in the MS Ti50Ni25Cu25 alloy, HPT and annealing result in markedly finer nanograins than the annealing of the initial amorphous alloy [15,50]. The grain size in the MS Ti50Ni25Cu25 alloy after annealing at 450 °C 10 min is 1.5 μm (Figure 14a), whereas in the sample subjected to HPT and subsequent annealing, dg = 100 nm (Figure 14b).
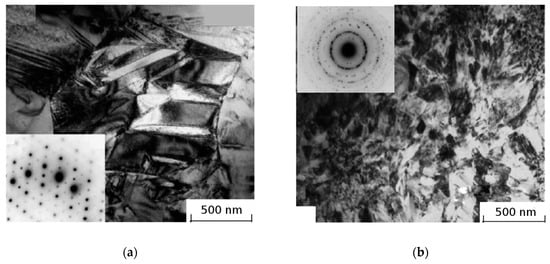
Figure 14.
Bright-field TEM image and the corresponding SAED pattern for the MS Ti50Ni25Cu25 alloy: (a) after annealing at 450 °C for 10 min, note the martensite plates inside the grains; (b) subjected to HPT (T = 200 °C) and subsequent annealing at 450 °C for 10 min [55].
It has been also revealed that the crystallization during annealing of the MS Nd12Fe82B6, Nd9Fe85B6, and Nd9Fe84B7 alloys subjected to HPT differs from crystallization of the non-deformed MS alloy [41,52,53,54]. As a result of HPT-induced nanocrystallization, a high density of α-Fe nanocrystals with a size 10 nm has been induced in amorphous Nd-Fe-B after HPT at RT. These α-Fe nanocrystals are the nuclei for crystallization of the Nd2Fe14B phase. As a result, a homogeneous structure of the nanocrystalline α-Fe and nanocrystalline Nd2Fe14B phases is formed after annealing in the HPT sample, as compared with the non-deformed MS alloy [53]. In the results, the values of Hc and σr are ~30% higher for the annealed MS+HPT alloy in comparison to the annealed non-deformed MS Nd12Fe82B6 alloy (Table 4) [52].
Table 4.
Hysteresis properties of the MS Nd12Fe82B6 alloy after HPT and annealing at 600 °C, 10 min [76].
The Nd9Fe85B6 magnets prepared by a combination of HPT and subsequent thermal annealing show enhanced magnetic properties with an increase by 13% in Br, 19% in Hc, and 30% in BHmax as compared with the magnets prepared by annealing of amorphous Nd9Fe85B6 [53].
4.1. The Strain Achieved by HPT and Special Monitoring Schemes for the Formation of Shear Bands
Some recent results on the HPT processing of BMGs are shown in the following papers. In [106], the shear band evolution with the HPT deformation was examined in the Vit105 (Zr52.5Cu17.9Ni14.6Al10Ti5) bulk metallic glass. For this purpose, a new HPT deformation scheme was developed. Under this scheme, two halves of disks of the bulk metallic glass were joined together and processed by high-pressure torsion for various strains (Figure 15).
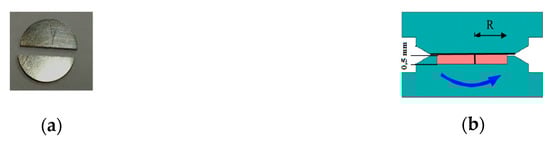
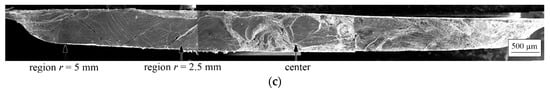
Figure 15.
(a) Image of the two halves of the as-cast HPT disk. (b) Scheme of constrained HPT processing: the lower anvil has a groove with a depth of 0.5 mm, and the upper anvil is flat. (c) SEM image of the internal surface of the sample subjected to HPT for one revolution (reprinted from [106] with permission from Elsevier).
The images of the Vit105 and Cu samples after the HPT processing of two halves of a disk are shown in Figure 16.
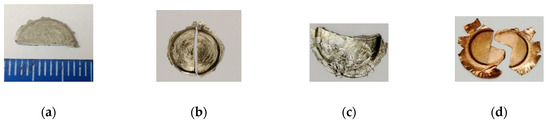
Figure 16.
Optical images of samples: (a) BMG after compression only; (b) BMG after HPT for n = 1/4 revolutions; (c) BMG after HPT for n = 5 revolutions; (d) two halves of pure Cu after HPT for n = 1/4 revolutions (reprinted from [106] with permission from Elsevier).
The SEM examination samples of internal surfaces were subsequently used to study the formation of SPD under HPT. An increase in deformation led to a significant increase in SBs’ density. The highest density was observed for the HPT state n = 5. The distance between the shear bands was down to 500 nm (Figure 17). The maximum density of shear bands was observed at the edges of HPT-treated samples and in the areas adjacent to the upper anvils (Figure 15 and Figure 17) [107].
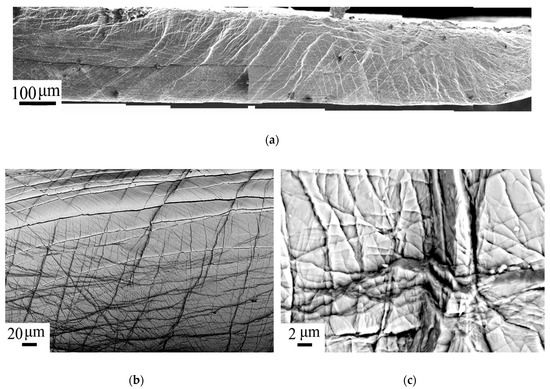
Figure 17.
SEM images of the internal surface of the Vit105 BMG after HPT for n = 5: (a) general view of the sample; (b) region r-2.5 mm, magnification ×390; (c) magnification ×5000 (reprinted from [106] with permission from Elsevier).
From the obtained shear angle of the lower part relative to the upper part (Figure 16), one can see that the shear strain by HPT for n = 5 can be estimated, which equals γr5 ≈ 1, whereas the well-known formula (6) predicts γr5 = 290. Thus, HPT introduces into this BMG a much smaller strain in comparison with the prediction of Formula (6). A soft metal–pure Cu was subjected to HPT for 1/4 revolution under a similar scheme, and in this case, the shear angle was consistent with that predicted by Formula (6). It was also shown in [107,108,109] that the HPT of high-strength BMGs actually produced a smaller strain than predicted by Formula (6). In [107], it was shown that in Vitreloy LM-1B BMG, HPT with rotation n = 0.1 led to plastic strain of γR=2 = 0.12 instead of the nominal γR=2 = 2.0 value predicted by Formula (6). This discrepancy can be explained by the effect of “slippage” during HPT [17].
However, the density of the shear bands in the Vit105 BMG changed considerably as a result of HPT. According to XRD, HPT n = 5 led to an increase in the free volume (by about 1.3%) [106]. Thus, though the actual SB in the HPT samples was significantly lower in comparison with the expected value, the BMG under HPT experienced significant transformations in the structure. This fact requires further study.
The temperature increase that occurs during the HPT of BMG is important. The problem of the temperature increase during the HPT of various metallic materials is reflected in some studies [110,111,112,113,114,115,116,117]. The data available in the papers are rather contradictory, but in most papers, the heating of metal samples during HPT was estimated from 30 to 200 °C. The data on the temperature increase during the HPT of amorphous alloys are even more contradictory. According to [36,118], the temperature of the alloy increased to Tg during HPT for n = 1 (at an anvil rotation speed of 1 rpm) and reached 400 °C for CuZr(Al) [118]. However, these provisions are questionable. If the temperature during the HPT increases to Tg, then homogeneous deformation should take place in amorphous alloys, without the formation of shear bands, and the relaxation of the material should occur (the free volume decreases, and the relaxation energy decreases) [65,119]. However, in many works SBs were observed in amorphous alloys after HPT [61], and the free volume and relaxation energy increased. It can be assumed that during the HPT of BMGs, they are heated up to approximately the same temperatures as during the HPT of crystalline materials—to 200 °C [110,111,112,113,114,115,116].
The structural transformations of amorphous alloys during HPT are caused by several factors, including an increase in the temperature of the sample as a whole. However, it can be argued that the main physical mechanism that causes the transformation of the structure of amorphous alloys during HPT is the formation and motion of a very large density of shear bands in the samples. According to [106], the distance between the bands, calculated from SEM images, can be about 500 nm. Estimation of the gaps between the shear bands in amorphous materials after HPT based on TEM data showed that they reached 30 nm [94,120,121,122].
The mechanism of the structural transformation of an amorphous material during the propagation of a shear band can be described as follows: in the band itself (representing the shear plane), at the moment of motion, the material becomes heated to the melting temperatures [123]. However, this heating occurs in just microseconds, and the material heated in the narrow zone of the shear band (about 10 nm wide) also cools down in just microseconds due to the outflow of heat into the material surrounding the band [123]. Therefore, in the zone of the shear band, both relaxation/crystallization of the amorphous phase due to the heating and a high density of quasi-vacancies–defects of the atomic volume and the growth of non-equilibrium (growth of the free volume and internal energy) due to very rapid cooling of the material heated in the band take place.
According to [124], the structure of an amorphous material transforms even at a distance of 10 µm from the shear band that has passed. Thus, at the density of shear bands observed during the HPT processing, all of the amorphous material subjected to deformation should transforms.
Furthermore, the following notes can be made. During the HPT processing, the effect was observed when the height of the materials under processing, h, decreases with increasing number of anvil revolutions, n, due to the outflow of the material from under the anvils into the flash. The sample experiences a complex deformation by compression under high pressure, combined with torsion and the flow of the material into the flash. Correspondingly, at the initial stages of deformation, the structure is significantly influenced by the deformation. However, as the number of revolutions increases and n reaches a certain critical value (roughly estimated for BMGs as n = 3–5), the values of h become practically stabilized. “The deformation by compression combined with material flow into the flash” ceases or grows minimally with further increasing n. As shown above, the “torsional deformation”, as such, of BMG samples due to the displacement of the lower part of the sample with respect to its upper part does not take place. The effect of sliding of the anvil surface on the sample surface under high pressure occurs. The frictional work is transformed into heat, and consequently into the heating of the sample and the anvils (as mentioned above, to the temperatures around 200 °C, or somewhat higher in the sliding mode). No significant deformation of the sample occurs here. Hence, in the HPT processing of BMGs and other solid materials, the initial stage can be distinguished, with a noticeable actual strain and strain-induced structural transformation. After n reaches a certain critical value, the strain as such decreases with increasing n, the heating makes a considerable contribution into the structural transformation, and the increasing number of revolutions leads rather to an increase in the time of exposure (annealing) at the temperature of self-heating during HPT processing (although this is undoubtedly subject to discussion). On the other hand, in some works, it is reported that when n during the HPT processing exceeds n = 5 (up to n = 10 and higher), structural changes also occur in BMG, as in crystalline alloys: the internal energy increases, which indicates a higher strain with increasing n [77]. These issues certainly require further study and analysis.
4.2. Accumulative HPT Procedure
As shown in [106], the actual shear strain in samples subjected to HPT is significantly lower in comparison with the expected value. In order to achieve high strain in BMGs, the authors proposed a new method: “accumulative HPT [125]. In the accumulative HPT procedure, the sample undergoes several cycles of HPT processing, then cutting, stacking, pressing, and subsequent HPT, as shown in Figure 18. Finally, the stacked segments are subjected to HPT with n ≥ 3 as a result of which the fragments are consolidated into a monolithic disk [125]. The total number of revolutions during the “accumulative HPT” processing of Vit105 BMG was n = 5, and the total deformation of the BMG by pressing and shear was roughly estimated as γ∑ = 6 [125].
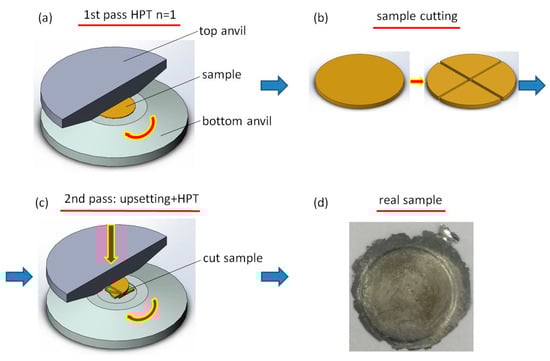
Figure 18.
Principle of the “accumulative HPT” process: (a) disk-shaped sample subjected to HPT n = 1; (b) sample cut into four pieces; (c) pieces are stacked on top of the HPT anvil and HPT n = 1 applied again; (d) BMG sample obtained according to this procedure (reprinted from [125] with permission from Elsevier).
Some of the BMG disks were processed by conventional HPT with n = 5. In this case, the total deformation of the BMG could be estimated as γ∑ = 2. These estimates are very approximate, but they show that the total deformation at the “accumulative HPT” was 2.5 times greater than during conventional HPT.
The structure of the initial BMG is amorphous, as shown by the XRD method, and the position of the amorphous halo of the BMG after HPT shifts towards lower angles (Table 5). This means an increase in R of the first coordination sphere (R1) (Table 5) [82,98]. The relative changes in ΔV after HPT could be estimated from R1 according to [82]. The increase in free volume (ΔV) after conventional HPT n = 5 was ΔV ≈ 1% and ΔV after accumulative HPT was ≈ 2.5%. The ΔV = 2.5% is too large compared to the ΔV usually observed during HPT of a BMG [82]. This is due to the large error in determining ΔV from the XRD [82]. However, these results indicate that the structure of BMG after accumulative HPT transforms much more significantly than after conventional HPT. The increase in the FWHM after HPT (Table 5) was also explained by changes in the structure of BMG [92]. The growth of FWHM after “accumulative HPT” is greater than after conventional HPT (Table 5), which also indicates the efficiency of accumulative HPT.
Table 5.
Parameters of the amorphous structure of the BMG in different states from XRD (reprinted from [125] with permission from Elsevier).
5. Conclusions
Thus, recent studies have shown that SPD significantly affects the atomic structure and properties of amorphous alloys. The variation of microstructure resulting from SPD processing is closely related to processing parameters (amount of shear strain, temperature of processing, imposed pressure).
In a number of publications, it was shown that nanocrystallization in the amorphous phase occurs under SPD. We should note that under conventional schemes of deformation, nanocrystallization was observed in a small fraction of amorphous material in shear bands, whereas during HPT, it takes place throughout the entire volume of amorphous samples. It is interesting to note that during HPT of an amorphous alloy (for instance Nd–Fe-B), the amorphous phase is decomposed into the amorphous and crystalline phases of basic pure metals. In some amorphous alloys (for instance, MS Ti50Ni25Cu25), besides nanocrystallization during HPT processing other complex transformations of the structure were observed. Amorphous “clusters” become visible, and these “clusters” represent some kind of amorphous structure. This contrast could be the result of the existence in the amorphous phase of regions with reduced free volume and with enhanced free volume.
During the HPT processing of a number of other amorphous alloys, nanocrystallization was not observed, but a new amorphous structure could be formed as a result of HPT, depending on changes in the short-range order, the total amount, and the redistribution of free volume. Perhaps, structures produced by the SPD methods are in some aspects comparable to the nanoglass-type structures produced by IGC.
Correspondingly, as a result of the HPT processing of amorphous alloys, essential transformations occur in their properties, in particular mechanical properties. For instance, as a result of preliminary HPT processing, the fracture fractography changes. Nanoindentation studies have shown that HPT processing leads to a significant increase in the values of the strain rate sensitivity in comparison with the initial state. At the same time, the course of change of the elastic modulus in a Zr-based BMG depends on the temperature of the HPT processing (20 or 150 °C). In some cases, HPT leads to a decrease in the values of Young’s modulus. The first work, indicating the emergence of tensile ductility in some BMGs (Zr65Al7.5Ni10Cu12.5Pd5) after HPT processing, has been published. The emergence of tensile ductility can be explained by the formation of a high density of nanoscale inhomogeneities in the amorphous state. High tensile strength, high hardness, and low elastic modulus provide the great potential of BMGs for various commercial applications; however, these applications are limited by the brittleness of amorphous materials. Thus, a decrease in the elastic modulus and an increase in tensile ductility via HPT processing can provide wide applications for amorphous alloys.
It has been also revealed that the process of crystallization that occurs during the annealing of the MS amorphous alloys subjected to HPT differs significantly from the crystallization of the non-deformed analogues. In the case of MS Nd-Fe-B alloys, this enabled producing higher magnetic properties via a combination of HPT processing and annealing than via annealing of non-deformed analogues. Therefore, the combination of HPT processing and annealing in some cases can lead to the formation of specific nanostructured states with improved functional properties. However, currently, many aspects of the nature of the transformation of the structure and properties of amorphous alloys subjected to HPT are still unclear and require further research.
A discrepancy between the experimentally observed and predicted shear strains has been detected. The actual strain is significantly smaller than the predicted one.
The authors proposed a new method, “accumulative HPT”, to achieve high strain in hard materials, including BMGs. The study showed that the structure of the Zr-based BMG during accumulative HPT transforms much more significantly than in the case of conventional HPT with the same number of revolutions.
Author Contributions
Conceptualization, D.G.; writing, original draft preparation, D.G.; writing, review and editing, V.A. All authors read and agreed to the published version of the manuscript.
Funding
The work is funded by RFBR IND-a Research Project 19-58-45014.
Acknowledgments
The authors are grateful for the productive collaboration of Ruslan Valiev, Aleksandr Glezer, Jing Tao Wang, Horst Hahn, Dmitry Louzguine-Luzgin, Aleksandr Aronin, Galina Abrosimova, Yulia Ivanisenko, Evgeniy Ubyivovk, Evgeniy Boltynjuk, Andrey Bazlov, Roman Sundeev, Anna Churakova, Askar Kilmametov, Almir Mullayanov, Alfred Sharafutdinov, Ilshat Sabirov, Julia Bazhenova, and many other people.
Conflicts of Interest
The authors declare no conflict of interest.
References
- Greer, A.L.; Ma, E. Bulk Metallic Glasses: At the Cutting Edge of Metals Research. MRS Bull. 2007, 32, 611–619. [Google Scholar] [CrossRef]
- Inoue, A. Stabilization of metallic supercooled liquid and bulk amorphous alloys. Acta Mater. 2000, 48, 279–306. [Google Scholar] [CrossRef]
- Abrosimova, G.E. Evolution of the structure of amorphous alloys. Physics-Uspekhi 2011, 54, 1227–1242. [Google Scholar] [CrossRef]
- Goncharova, E.V.; Konchakov, R.A.; Makarov, A.S.; Kobelev, N.P.; Khonik, V.A. On the nature of density changes upon structural relaxation and crystallization of metallic glasses. J. Non. Cryst. Solids 2017, 471, 396–399. [Google Scholar] [CrossRef]
- Greer, A.L. Metallic Glasses. Science 1995, 267, 1947–1953. [Google Scholar] [CrossRef]
- Inoue, A.; Nishiyama, N. New Bulk Metallic Glasses for Applications as Magnetic-Sensing, Chemical, and Structural Materials. MRS Bull. 2007, 32, 651–658. [Google Scholar] [CrossRef]
- Axinte, E. Metallic glasses from “alchemy” to pure science: Present and future of design, processing and applications of glassy metals. Mater. Des. 2012, 35, 518–556. [Google Scholar] [CrossRef]
- Louzguine-Luzgin, D.V.; Inoue, A. Bulk Metallic Glasses. In Handbook of Magnetic Materials; Elsevier: Sendai, Japan, 2013; pp. 131–171. [Google Scholar] [CrossRef]
- Wang, Y.B.; Xie, X.H.; Li, H.F.; Wang, X.L.; Zhao, M.Z.; Zhang, E.W.; Bai, Y.J.; Zheng, Y.F.; Qin, L. Biodegradable CaMgZn bulk metallic glass for potential skeletal application. Acta Biomater. 2011, 7, 3196–3208. [Google Scholar] [CrossRef]
- Cao, Q.P.; Liu, J.W.; Yang, K.J.; Xu, F.; Yao, Z.Q.; Minkow, A.; Fecht, H.J.; Ivanisenko, J.; Chen, L.Y.; Wang, X.D.; et al. Effect of pre-existing shear bands on the tensile mechanical properties of a bulk metallic glass. Acta Mater. 2010, 58, 1276–1292. [Google Scholar] [CrossRef]
- Park, K.-W.; Lee, C.-M.; Kim, H.-J.; Lee, J.-H.; Lee, J.-C. A methodology of enhancing the plasticity of amorphous alloys: Elastostatic compression at room temperature. Mater. Sci. Eng. A 2009, 499, 529–533. [Google Scholar] [CrossRef]
- Zhang, Q.S.; Zhang, W.; Xie, G.Q.; Louzguine-Luzgin, D.V.; Inoue, A. Stable flowing of localized shear bands in soft bulk metallic glasses. Acta Mater. 2010, 58, 904–909. [Google Scholar] [CrossRef]
- Ma, E.; Ding, J. Tailoring structural inhomogeneities in metallic glasses to enable tensile ductility at room temperature. Mater. Today 2016, 19, 568–579. [Google Scholar] [CrossRef]
- Ketov, S.V.; Sun, Y.H.; Nachum, S.; Lu, Z.; Checchi, A.; Beraldin, A.R.; Bai, H.Y.; Wang, W.H.; Louzguine-Luzgin, D.V.; Carpenter, M.A.; et al. Rejuvenation of metallic glasses by non-affine thermal strain. Nature 2015, 524, 200–203. [Google Scholar] [CrossRef] [PubMed]
- Valiev, R.Z.; Estrin, Y.; Horita, Z.; Langdon, T.G.; Zechetbauer, M.J.; Zhu, Y.T. Producing bulk ultrafine-grained materials by severe plastic deformation. JOM 2006, 58, 33–39. [Google Scholar] [CrossRef]
- Valiev, R.Z.; Zhilyaev, A.P.; Langdon, T.G. Bulk Nanostructured Materials; John Wiley & Sons, Inc: Hoboken, NJ, USA, 2013; ISBN 9781118742679. [Google Scholar]
- Zhilyaev, A.; Langdon, T. Using high-pressure torsion for metal processing: Fundamentals and applications. Prog. Mater. Sci. 2008, 53, 893–979. [Google Scholar] [CrossRef]
- Kovács, Z.; Henits, P.; Zhilyaev, A.P.; Révész, Á. Deformation induced primary crystallization in a thermally non-primary crystallizing amorphous Al85Ce8Ni5Co2 alloy. Scr. Mater. 2006, 54, 1733–1737. [Google Scholar] [CrossRef]
- Kovács, Z.; Henits, P.; Zhilyaev, A.P.; Chinh, N.Q.; Révész, Á. Microstructural characterization of the crystallization sequence of a severe plastically deformed Al-Ce-Ni-Co amorphous alloy. Mater. Sci. Forum 2006, 519–521, 1329–1334. [Google Scholar] [CrossRef]
- Henits, P.; Révész, Á.; Schafler, E.; Szabó, P.J.; Lábár, J.L.; Varga, L.K.; Kovács, Z. Correlation between microstructural evolution during high-pressure torsion and isothermal heat treatment of amorphous Al 85 Gd 8 Ni 5 Co 2 alloy. J. Mater. Res. 2010, 25, 1388–1397. [Google Scholar] [CrossRef]
- Boucharat, N.; Hebert, R.J.; Rösner, H.; Wilde, G. Deformation-Induced Nanocrystallization in Al-Rich Metallic Glasses. Solid State Phenom. 2006, 114, 123–132. [Google Scholar] [CrossRef]
- Sarac, B.; Spieckermann, F.; Rezvan, A.; Gammer, C.; Krämer, L.; Kim, J.T.; Keckes, J.; Pippan, R.; Eckert, J. Annealing-assisted high-pressure torsion in Zr55Cu30Al10Ni5 metallic glass. J. Alloys Compd. 2019, 784, 1323–1333. [Google Scholar] [CrossRef]
- Huang, J.Y.; Zhu, Y.T.; Liao, X.Z.; Valiev, R.Z. Amorphization of TiNi induced by high-pressure torsion. Philos. Mag. Lett. 2004, 84, 183–190. [Google Scholar] [CrossRef]
- Meng, F.; Tsuchiya, K.; Seiichiro; Yokoyama, Y. Reversible transition of deformation mode by structural rejuvenation and relaxation in bulk metallic glass. Appl. Phys. Lett. 2012, 101, 121914. [Google Scholar] [CrossRef]
- Glezer, A.M.; Sundeev, R.V.; Shalimova, A.V. The cyclic character of phase transformations of the crystal ⇔ amorphous state type during severe plastic deformation of the Ti50Ni25Cu25 alloy. Dokl. Phys. 2011, 56, 476–478. [Google Scholar] [CrossRef]
- Sundeev, R.V.; Glezer, A.M.; Shalimova, A.V. Are the abilities of crystalline alloys to amorphization upon melt quenching and severe plastic deformation identical or different? Mater. Lett. 2016, 175, 72–74. [Google Scholar] [CrossRef]
- Sundeev, R.V.; Shalimova, A.V.; Glezer, A.M.; Pechina, E.A.; Gorshenkov, M.V.; Nosova, G.I. In situ observation of the “crystalline⇒amorphous state” phase transformation in Ti 2 NiCu upon high-pressure torsion. Mater. Sci. Eng. A 2017, 679, 1–6. [Google Scholar] [CrossRef]
- Edalati, K.; Yokoyama, Y.; Horita, Z. High-pressure torsion of machining chips and bulk discs of amorphous Zr50Cu30Al10Ni10. Mater. Trans. 2010, 51, 23–26. [Google Scholar] [CrossRef]
- Edalati, K.; Horita, Z. A review on high-pressure torsion (HPT) from 1935 to 1988. Mater. Sci. Eng. A 2016, 652, 325–352. [Google Scholar] [CrossRef]
- Abrosimova, G.; Aronin, A.; Matveev, D.; Pershina, E. Nanocrystal formation, structure and magnetic properties of Fe–Si–B amorphous alloy afterdeformation. Mater. Lett. 2013, 97, 15–17. [Google Scholar] [CrossRef]
- Abrosimova, G.E.; Aronin, A.S.; Dobatkin, S.V.; Kaloshkin, S.D.; Matveev, D.V.; Rybchenko, O.G.; Tatyanin, E.V.; Zverkova, I.I. The Formation of Nanocrystalline Structure in Amorphous Fe-Si-B Alloy by Severe Plastic Deformation. J. Metastable Nanocrystalline Mater. 2005, 24–25, 69–72. [Google Scholar] [CrossRef]
- Abrosimova, G.; Aronin, A. Nanocrystal formation in Al- and Ti-based amorphous alloys at deformation. J. Alloys Compd. 2018, 747, 26–30. [Google Scholar] [CrossRef]
- Czeppe, T.; Korznikova, G.; Morgiel, J.; Korznikov, A.; Chinh, N.Q.; Ochin, P.; Sypień, A. Microstructure and properties of cold consolidated amorphous ribbons from (NiCu)ZrTiAlSi alloys. J. Alloys Compd. 2009, 483, 74–77. [Google Scholar] [CrossRef]
- Korznikova, G.F.; Korznikova, E.A. Production of bulk samples from Ni based melt-spun ribbons by consolidation on Bridgman anvils. Lett. Mater. 2012, 2, 25–28. [Google Scholar] [CrossRef][Green Version]
- Korznikova, G.F.; Czeppe, T.H.; Korznikov, A.V. On plastic deformation of bulk metallic glasses in Bridgman anvils. Lett. Mater. 2014, 4, 117–120. [Google Scholar] [CrossRef]
- Révész, Á.; Kovács, Z. Severe Plastic Deformation of Amorphous Alloys. Mater. Trans. 2019, 60, 1283–1293. [Google Scholar] [CrossRef]
- Valiev, R.Z.; Krasilnikov, N.A.; Tsenev, N.K. Plastic deformation of alloys with submicron-grained structure. Mater. Sci. Eng. A 1991, 137, 35–40. [Google Scholar] [CrossRef]
- Valiev, R. Materials science: Nanomaterial advantage. Nature 2002, 419, 887, 889. [Google Scholar] [CrossRef]
- Gunderov, D.V.; Raab, G.I.; Sharafutdinov, A.V.; Stolyarov, V.V.; Sellers, C. Cold consolidation of nanocrystalline NdFeB powders via a severe plastic deformation method. In Proceedings of the Fifteenth International Workshop on Rare-Earth Magnets and Their Applications, Dresden, Germany, 30 August–3 September 1998; Schultz, L., Mueller, K.H., Eds.; pp. 359–362. [Google Scholar]
- Popov, A.G.; Ermolenko, A.S.; Gaviko, V.S.; Schegoleva, N.N.; Stolyarov, V.V.; Gunderov, D.V. Magnetic Hysteresis Properties and Structural Features of Nanocrystalline Nd9Fe84B7 Alloy Prepared by Melt-spinning and Severe Plastic Deformation. In Proceedings of the Sixteenth International Workshop on Rare-Earth Magnets and Their Applications, Sendai, Japan, 2000; Kaneko, H., Homma, M., Okada, M., Eds.; The Japanese Institute of Metals: Sendai, Japan, 2000; pp. 621–630. [Google Scholar]
- Valiev, R.; Gunderov, D.; Zhilyaev, A.P.; Popov, A.G.; Pushin, V. Nanocrystallization Induced by Severe Plastic Deformation of Amorphous Alloys. J. Metastable Nanocrystalline Mater. 2004, 22, 21–26. [Google Scholar] [CrossRef]
- Li, H.; Li, W.; Zhang, Y.; Gunderov, D.V.; Zhang, X. Phase evolution, microstructure and magnetic properties of bulk α-Fe/Nd2Fe14B nanocomposite magnets prepared by severe plastic deformation and thermal annealing. J. Alloys Compd. 2015, 651, 434–439. [Google Scholar] [CrossRef]
- Straumal, B.B.; Mazilkin, A.A.; Protasova, S.G.; Gunderov, D.V.; López, G.A.; Baretzky, B. Amorphization of crystalline phases in the Nd–Fe–B alloy driven by the high-pressure torsion. Mater. Lett. 2015, 161, 735–739. [Google Scholar] [CrossRef]
- Teitel’, E.I.; Metlov, L.S.; Gunderov, D.V.; Korznikov, A.V. On the structural and phase transformations in solids induced by severe plastic deformation. Phys. Met. Metallogr. 2012, 113, 1162–1168. [Google Scholar] [CrossRef]
- Gunderov, D.V.; Stolyarov, V.V. Bulk α-Fe/Nd2Fe14B nanocomposite magnets produced by severe plastic deformation combined with thermal annealing. J. Appl. Phys. 2010, 108, 053901. [Google Scholar] [CrossRef]
- Korolev, A.V.; Kourov, N.I.; Pushin, V.G.; Gunderov, D.V.; Boltynjuk, E.V.; Ubyivovk, E.V.; Valiev, R.Z. Paramagnetic susceptibility of the Zr62Cu22Al10Fe5Dy1 metallic glass subjected to high-pressure torsion deformation. J. Magn. Magn. Mater. 2017, 437, 67–71. [Google Scholar] [CrossRef]
- Gunderov, D.; Boltynjuk, E.; Ubyivovk, E.; Lukyanov, A.; Churakova, A.; Zamula, Y.; Batyrshin, E.; Kilmametov, A.; Valiev, R.Z. Atomic Force Microscopy Studies of Severely Deformed Amorphous TiNiCu Alloy. Defect Diffus. Forum 2018, 385, 200–205. [Google Scholar] [CrossRef]
- Zhang, N.; Gunderov, D.; Yang, T.T.; Cai, X.C.; Jia, P.; Shen, T.D. Influence of alloying elements on the thermal stability of ultra-fine-grained Ni alloys. J. Mater. Sci. 2019, 54, 10506–10515. [Google Scholar] [CrossRef]
- Gunderov, D.V.; Popov, A.G.; Schegoleva, N.N.; Stolyarov, V.V.; Yavary, A.R. Phase Transformation in Crystalline and Amorphous Rapidly Quenched Nd-Fe-B Alloys under SPD. In Nanomaterials by Severe Plastic Deformation; Wiley-VCH Verlag GmbH & Co. KGaA: Weinheim, Gemany, 2005; pp. 165–169. [Google Scholar]
- Wang, X.D.; Cao, Q.P.; Jiang, J.Z.; Franz, H.; Schroers, J.; Valiev, R.Z.; Ivanisenko, Y.; Gleiter, H.; Fecht, H.-J. Atomic-level structural modifications induced by severe plastic shear deformation in bulk metallic glasses. Scr. Mater. 2011, 64, 81–84. [Google Scholar] [CrossRef]
- Valiev, R.Z.; Pushin, V.G.; Gunderov, D.V.; Popov, A.G. The use of severe deformations for preparing bulk nanocrystalline materials from amorphous alloys. Dokl. Phys. 2004, 49, 519–521. [Google Scholar] [CrossRef]
- Popov, A.G.; Gaviko, V.S.; Shchegoleva, N.N.; Shreder, L.A.; Gunderov, D.V.; Stolyarov, V.V.; Li, W.; Li, L.L.; Zhang, X.Y. Effect of High-Pressure Torsion Deformation and Subsequent Annealing on Structure and Magnetic Properties of Overquenched Melt-Spun Nd9Fe85B6 Alloy. J. Iron Steel Res. Int. 2006, 13, 160–165. [Google Scholar] [CrossRef]
- Li, W.; Li, L.; Nan, Y.; Xu, Z.; Zhang, X.; Popov, A.G.; Gunderov, D.V.; Stolyarov, V.V. Nanocrystallization and magnetic properties of amorphous Nd9Fe85B6 subjected to high-pressure torsion deformation upon annealing. J. Appl. Phys. 2008, 104, 023912. [Google Scholar] [CrossRef]
- Li, W.; Li, X.; Guo, D.; Sato, K.; Gunderov, D.V.; Stolyarov, V.V.; Zhang, X. Atomic-scale structural evolution in amorphous Nd9Fe85B6 subjected to severe plastic deformation at room temperature. Appl. Phys. Lett. 2009, 94, 231904. [Google Scholar] [CrossRef]
- Gunderov, D.; Slesarenko, V.; Lukyanov, A.; Churakova, A.; Boltynjuk, E.; Pushin, V.; Ubyivovk, E.; Shelyakov, A.; Valiev, R. Stability of an Amorphous TiCuNi Alloy Subjected to High-Pressure Torsion at Different Temperatures. Adv. Eng. Mater. 2015, 17, 1728–1732. [Google Scholar] [CrossRef]
- Gunderov, D.V.; Slesarenko, V.Y.; Churakova, A.A.; Lukyanov, A.V.; Soshnikova, E.P.; Pushin, V.G.; Valiev, R.Z. Evolution of the amorphous structure in melt-spun Ti50Ni25Cu25 alloy subjected to high pressure torsion deformation. Intermetallics 2015, 66, 77–81. [Google Scholar] [CrossRef]
- Boltynjuk, E.V.; Gunderov, D.V.; Ubyivovk, E.V.; Lukianov, A.V.; Kshumanev, A.M.; Bednarz, A.; Valiev, R.Z. The structural properties of Zr-based bulk metallic glasses subjected to high pressure torsion at different temperatures. AIP Conf. Proc. 2016, 1748, 6. [Google Scholar] [CrossRef]
- Gunderov, D.V. Some regularities in the amorphization and nanocrystallization under severe plastic deformation of crystalline and amorphous multicomponent alloys (In Russian). Investig. Russ. 2006, 151, 1404–1413. [Google Scholar]
- Gunderov, D.; Boltynjuk, E.; Ubyivovk, E.; Churakova, A.; Kilmametov, A.; Valiev, R. Consolidation of the Amorphous Zr 50 Cu 50 Ribbons by High-Pressure Torsion. Adv. Eng. Mater. 2019, 1900694. [Google Scholar] [CrossRef]
- Gunderov, D.; Boltynjuk, E.; Churakova, A.; Batirshin, E.; Mullayanov, A.; Titov, V.; Ivanisenko, J. Effect of high-pressure torsion on the mechanical behavior of a Zr-based BMG. IOP Conf. Ser. Mater. Sci. Eng. 2019, 672, 012028. [Google Scholar] [CrossRef]
- Shao, H.; Xu, Y.; Shi, B.; Yu, C.; Hahn, H.; Gleiter, H.; Li, J. High density of shear bands and enhanced free volume induced in Zr70Cu20Ni10 metallic glass by high-energy ball milling. J. Alloys Compd. 2013, 548, 77–81. [Google Scholar] [CrossRef]
- Argon, A.S.; Kuo, H.Y. Plastic flow in a disordered bubble raft (an analog of a metallic glass). Mater. Sci. Eng. 1979, 39, 101–109. [Google Scholar] [CrossRef]
- Yokoyama, Y. Ductility improvement of Zr–Cu–Ni–Al glassy alloy. J. Non. Cryst. Solids 2003, 316, 104–113. [Google Scholar] [CrossRef]
- Rösner, H.; Peterlechner, M.; Kübel, C.; Schmidt, V.; Wilde, G. Density changes in shear bands of a metallic glass determined by correlative analytical transmission electron microscopy. Ultramicroscopy 2014, 142, 1–9. [Google Scholar] [CrossRef]
- Mitrofanov, Y.P.; Peterlechner, M.; Binkowski, I.; Zadorozhnyy, M.Y.; Golovin, I.S.; Divinski, S.V.; Wilde, G. The impact of elastic and plastic strain on relaxation and crystallization of Pd–Ni–P-based bulk metallic glasses. Acta Mater. 2015, 90, 318–329. [Google Scholar] [CrossRef]
- Jiang, W.H.; Pinkerton, F.E.; Atzmon, M. Deformation-induced nanocrystallization in an Al-based amorphous alloy at a subambient temperature. Scr. Mater. 2003, 48, 1195–1200. [Google Scholar] [CrossRef]
- Chen, H.; He, Y.; Shiflet, G.J.; Poon, S.J. Deformation-induced nanocrystal formation in shear bands of amorphous alloys. Nature 1994, 367, 541–543. [Google Scholar] [CrossRef]
- Lee, S.-W.; Huh, M.-Y.; Fleury, E.; Lee, J.-C. Crystallization-induced plasticity of Cu–Zr containing bulk amorphous alloys. Acta Mater. 2006, 54, 349–355. [Google Scholar] [CrossRef]
- Kim, J.J.; Choi, Y.; Suresh, S.; Argon, A.S. Nanocrystallization during nanoindentation of a bulk amorphous metal alloy at room temperature. Science 2002, 295, 654–657. [Google Scholar] [CrossRef] [PubMed]
- Popov, A.G.; Gaviko, V.S.; Shchegoleva, N.N.; Shreder, L.A.; Stolyarov, V.V.; Gunderov, D.V.; Zhang, X.Y.; Li, W.; Li, L.L. High-pressure-torsion deformation of melt-spun Nd9Fe85B6 alloy. Phys. Met. Metallogr. 2007, 104, 238–247. [Google Scholar] [CrossRef]
- Buschow, K.H.J. New permanent magnet materials. Mater. Sci. Reports 1986, 1, 1–63. [Google Scholar] [CrossRef]
- Stolyarov, V.V.; Gunderov, D.V.; Valiev, R.Z.; Popov, A.G.; Gaviko, V.S.; Ermolenko, A.S. Metastable states in R2Fe14B-based alloys processed by severe plastic deformation. J. Magn. Magn. Mater. 1999, 196–197, 166–168. [Google Scholar] [CrossRef]
- Gaviko, V.S.; Popov, A.G.; Ermolenko, A.S.; Shchegoleva, N.N.; Stolyarov, V.V.; Gunderov, D.V. Decomposition of the Nd2Fe14B intermetallic compound upon severe plastic deformation by shear under pressure. Phys. Met. Metallogr. 2001, 92, 58–66. [Google Scholar]
- Stolyarov, V.V.; Gunderov, D.V.; Popov, A.G.; Gaviko, V.S.; Ermolenko, A.S. Structure evolution and changes in magnetic properties of severe plastic deformed Nd(Pr)–Fe–B alloys during annealing. J. Alloys Compd. 1998, 281, 69–71. [Google Scholar] [CrossRef]
- Popov, A.G.; Gaviko, V.S.; Shchegoleva, N.N.; Puzanova, T.Z.; Ermolenko, A.S.; Stolyarov, V.V.; Gunderov, D.V.; Raab, G.I.; Valiev, R.Z. Severe plastic deformation of R-Fe-B (R = Pr or Nd) hard magnetic alloys. Phys. Met. Metallogr. 2002, 94, S75–S81. [Google Scholar]
- Popov, A.G.; Gaviko, V.S.; Shchegoleva, N.N.; Shreder, L.A.; Gunderov, D.V.; Stolyarov, V.V.; Li, W.; Li, L.L.; Zhang, X.Y. Effect of high-pressure torsion deformation and subsequent annealing on structure and magnetic properties of overquenched melt-spun Nd9Fe85B6 alloy. In Proceedings of the 19th International Workshop on Rare Earth Permanent Magnets and Their Applications, Beijing, China, 30 August–2 September 2006. [Google Scholar]
- Glezer, A.M.; Plotnikova, M.P.; Shalimova, A.V.; Dobatkin, S.V. Severe plastic deformation of amorphous alloys: I. Structure and mechanical properties. Bull. Russ. Acad. Sci. Phys. 2009, 73, 1233–1239. [Google Scholar] [CrossRef]
- Abrosimova, G.; Aronin, A. On decomposition of amorphous phase in metallic glasses. Rev. Adv. Mater. Sci. 2017, 50, 55–61. [Google Scholar]
- Gapontsev, V.L.; Kesarev, A.G.; Kondrat’ev, V.V.; Ermakov, A.E. Phase separation in nanocrystalline alloys upon generation of nonequilibrium vacancies at grain boundaries. Phys. Met. Metallogr. 2000, 89, 430–434. [Google Scholar]
- Handrich, K.; Kobe, S. Amorphe Ferro- und Ferrimagnetika; Physik-Verlag: Weinheim, Germany, 1980. [Google Scholar]
- Gryaznov, V.G.; Kaprelov, A.M.; Romanov, A.E. Size effect of dislocation stability in small particles and microcrystallites. Scr. Metall. 1989, 23, 1443–1448. [Google Scholar] [CrossRef]
- Yavari, A.R.; Le Moulec, A.; Inoue, A.; Nishiyama, N.; Lupu, N.; Matsubara, E.; Botta, W.J.; Vaughan, G.; Di Michiel, M.; Kvick, Å. Excess free volume in metallic glasses measured by X-ray diffraction. Acta Mater. 2005, 53, 1611–1619. [Google Scholar] [CrossRef]
- Gleiter, H. Nanoglasses: A new kind of noncrystalline materials. Beilstein J. Nanotechnol. 2013, 4, 517–533. [Google Scholar] [CrossRef]
- Gleiter, H.; Schimmel, T.; Hahn, H. Nanostructured solids–From nano-glasses to quantum transistors. Nano Today 2014, 9, 17–68. [Google Scholar] [CrossRef]
- Joo, S.-H.; Pi, D.-H.; Setyawan, A.D.H.; Kato, H.; Janecek, M.; Kim, Y.C.; Lee, S.; Kim, H.S. Work-Hardening Induced Tensile Ductility of Bulk Metallic Glasses via High-Pressure Torsion. Sci. Rep. 2015, 5, 9660. [Google Scholar] [CrossRef]
- Jing, J.; Krämer, A.; Birringer, R.; Gleiter, H.; Gonser, U. Modified atomic structure in a PdFeSi nanoglass. J. Non. Cryst. Solids 1989, 113, 167–170. [Google Scholar] [CrossRef]
- Gleiter, H. Our thoughts are ours, their ends none of our own: Are there ways to synthesize materials beyond the limitations of today? Acta Mater. 2008, 56, 5875–5893. [Google Scholar] [CrossRef]
- Gleiter, H. Nanocrystalline solids. J. Appl. Crystallogr. 1991, 24, 79–90. [Google Scholar] [CrossRef]
- Weissmüller, J.; Schubert, P.; Franz, H.; Birringer, R.; Gleiter, H. The physics of non-crystalline solids. In Proceedings of the VII National Conference on the Physics of Non-Crystalline Solids, Cambridge, UK, 4–9 August 1991. [Google Scholar]
- Fang, J.X.; Vainio, U.; Puff, W.; Würschum, R.; Wang, X.L.; Wang, D.; Ghafari, M.; Jiang, F.; Sun, J.; Hahn, H.; et al. Atomic Structure and Structural Stability of Sc 75 Fe 25 Nanoglasses. Nano Lett. 2012, 12, 458–463. [Google Scholar] [CrossRef] [PubMed]
- Śniadecki, Z.; Wang, D.; Ivanisenko, Y.; Chakravadhanula, V.S.K.; Kübel, C.; Hahn, H.; Gleiter, H. Nanoscale morphology of Ni50Ti45Cu5 nanoglass. Mater. Charact. 2016, 113, 26–33. [Google Scholar] [CrossRef]
- Cao, Q.P.; Li, J.F.; Zhou, Y.H.; Horsewell, A.; Jiang, J.Z. Effect of rolling deformation on the microstructure of bulk Cu60Zr20Ti20 metallic glass and its crystallization. Acta Mater. 2006, 54, 4373–4383. [Google Scholar] [CrossRef]
- Aronin, A.; Matveev, D.; Pershina, E.; Tkatch, V.; Abrosimova, G. The effect of changes in Al-based amorphous phase structure on structure forming upon crystallization. J. Alloys Compd. 2017, 715, 176–183. [Google Scholar] [CrossRef]
- Ubyivovk, E.V.; Boltynjuk, E.V.; Gunderov, D.V.; Churakova, A.A.; Kilmametov, A.R.; Valiev, R.Z. HPT-induced shear banding and nanoclustering in a TiNiCu amorphous alloy. Mater. Lett. 2017, 209, 327–329. [Google Scholar] [CrossRef]
- Boltynjuk, E.V.; Gunderov, D.V.; Ubyivovk, E.V.; Monclús, M.A.; Yang, L.W.; Molina-Aldareguia, J.M.; Tyurin, A.I.; Kilmametov, A.R.; Churakova, A.A.; Churyumov, A.Y.; et al. Enhanced strain rate sensitivity of Zr-based bulk metallic glasses subjected to high pressure torsion. J. Alloys Compd. 2018, 747, 595–602. [Google Scholar] [CrossRef]
- Churyumov, A.Y.; Bazlov, A.I.; Zadorozhnyy, V.Y.; Solonin, A.N.; Caron, A.; Louzguine-Luzgin, D.V. Phase transformations in Zr-based bulk metallic glass cyclically loaded before plastic yielding. Mater. Sci. Eng. A 2012, 550, 358–362. [Google Scholar] [CrossRef]
- Kilmametov, A.; Gröger, R.; Hahn, H.; Schimmel, T.; Walheim, S. Bulk Density Measurements of Small Solid Objects Using Laser Confocal Microscopy. Adv. Mater. Technol. 2017, 2, 1600115. [Google Scholar] [CrossRef]
- Gunderov, D.V.; Boltynjuk, E.V.; Sitdikov, V.D.; Abrosimova, G.E.; Churakova, A.A.; Kilmametov, A.R.; Valiev, R.Z. Free volume measurement of severely deformed Zr 62 Cu 22 Al 10 Fe 5 Dy 1 bulk metallic glass. J. Phys. Conf. Ser. 2018, 1134, 012010. [Google Scholar] [CrossRef]
- Jiang, W.H.; Atzmon, M. Rate dependence of serrated flow in a metallic glass. J. Mater. Res. 2003, 18, 755–757. [Google Scholar] [CrossRef]
- Glezer, A.M.; Louzguine-Luzgin, D.V.; Khriplivets, I.A.; Sundeev, R.V.; Gunderov, D.V.; Bazlov, A.I.; Pogozhev, Y.S. Effect of high-pressure torsion on the tendency to plastic flow in bulk amorphous alloys based on Zr. Mater. Lett. 2019, 256, 126631. [Google Scholar] [CrossRef]
- Glezer, A.M.; Potekaev, A.I.; Cheretaeva, A.O. Thermal and Time Stability of Amorphous Alloys; CRC Press: Boca Raton, FL, USA, 2017; ISBN 9781315158112. [Google Scholar]
- Gunderov, D.V.; Churakova, A.A.; Lukyanov, A.V.; Prokofiev, E.A.; Khasanova, D.A.; Zamanova, G.I. Thin microstructure of amorphous Ti-Ni-Cu alloy subjected to high pressure torsion. Bull. Bashkir Univ. 2015, 20, 406–407. [Google Scholar]
- Bhowmick, R.; Raghavan, R.; Chattopadhyay, K.; Ramamurty, U. Plastic flow softening in a bulk metallic glass. Acta Mater. 2006, 54, 4221–4228. [Google Scholar] [CrossRef]
- Jiang, F.; Zhang, D.H.; Zhang, L.C.; Zhang, Z.B.; He, L.; Sun, J.; Zhang, Z.F. Microstructure evolution and mechanical properties of Cu46Zr47Al7 bulk metallic glass composite containing CuZr crystallizing phases. Mater. Sci. Eng. A 2007, 467, 139–145. [Google Scholar] [CrossRef]
- Huang, Y.; Shen, J.; Sun, J.; Zhang, Z. Enhanced strength and plasticity of a Ti-based metallic glass at cryogenic temperatures. Mater. Sci. Eng. A 2008, 498, 203–207. [Google Scholar] [CrossRef]
- Gunderov, D.V.; Churakova, A.A.; Boltynjuk, E.V.; Ubyivovk, E.V.; Astanin, V.V.; Asfandiyarov, R.N.; Valiev, R.Z.; Xioang, W.; Wang, J.T. Observation of shear bands in the Vitreloy metallic glass subjected to HPT processing. J. Alloys Compd. 2019, 800, 58–63. [Google Scholar] [CrossRef]
- Kovács, Z.; Schafler, E.; Szommer, P.; Révész, Á. Localization of plastic deformation along shear bands in Vitreloy bulk metallic glass during high pressure torsion. J. Alloys Compd. 2014, 593, 207–212. [Google Scholar] [CrossRef]
- Dmowski, W.; Yokoyama, Y.; Chuang, A.; Ren, Y.; Umemoto, M.; Tsuchiya, K.; Inoue, A.; Egami, T. Structural rejuvenation in a bulk metallic glass induced by severe plastic deformation. Acta Mater. 2010, 58, 429–438. [Google Scholar] [CrossRef]
- Adachi, N.; Todaka, Y.; Yokoyama, Y.; Umemoto, M. Cause of hardening and softening in the bulk glassy alloy Zr50Cu40Al10 after high-pressure torsion. Mater. Sci. Eng. A 2015, 627, 171–181. [Google Scholar] [CrossRef]
- Figueiredo, R.B.; Pereira, P.H.R.; Aguilar, M.T.P.; Cetlin, P.R.; Langdon, T.G. Using finite element modeling to examine the temperature distribution in quasi-constrained high-pressure torsion. Acta Mater. 2012, 60, 3190–3198. [Google Scholar] [CrossRef]
- Edalati, K.; Miresmaeili, R.; Horita, Z.; Kanayama, H.; Pippan, R. Significance of temperature increase in processing by high-pressure torsion. Mater. Sci. Eng. A 2011, 528, 7301–7305. [Google Scholar] [CrossRef]
- Edalati, K.; Hashiguchi, Y.; Pereira, P.H.R.; Horita, Z.; Langdon, T.G. Effect of temperature rise on microstructural evolution during high-pressure torsion. Mater. Sci. Eng. A 2018, 714, 167–171. [Google Scholar] [CrossRef]
- Yamaguchi, D.; Horita, Z.; Nemoto, M.; Langdon, T.G. Significance of adiabatic heating in equal-channel angular pressing. Scr. Mater. 1999, 41, 791–796. [Google Scholar] [CrossRef]
- Zhilyaev, A.P.; García-Infanta, J.M.; Carreño, F.; Langdon, T.G.; Ruano, O.A. Particle and grain growth in an Al-Si alloy during high-pressure torsion. Scr. Mater. 2007, 57, 763–765. [Google Scholar] [CrossRef]
- Todaka, Y.; Umemoto, M.; Yamazaki, A.; Sasaki, J.; Tsuchiya, K. Influence of High-Pressure Torsion Straining Conditions on Microstructure Evolution in Commercial Purity Aluminum. Mater. Trans. 2008, 49, 7–14. [Google Scholar] [CrossRef]
- Zhilyaev, A. Energy Stored during High Pressure Torsion of Pure Metals. Lett. Mater. 2019, 9, 142–146. [Google Scholar] [CrossRef]
- Lewandowski, J.J.; Greer, A.L. Temperature rise at shear bands in metallic glasses. Nat. Mater. 2006, 5, 15–18. [Google Scholar] [CrossRef]
- Hóbor, S.; Kovács, Z.; Révész, Á. Macroscopic thermoplastic model applied to the high pressure torsion of metallic glasses. J. Appl. Phys. 2009, 106, 023531. [Google Scholar] [CrossRef]
- Slipenyuk, A.; Eckert, J. Correlation between enthalpy change and free volume reduction during structural relaxation of Zr55Cu30Al10Ni5 metallic glass. Scr. Mater. 2004, 50, 39–44. [Google Scholar] [CrossRef]
- Zheng, B.; Zhou, Y.; Mathaudhu, S.N.; Valiev, R.Z.; Tsao, C.Y.A.; Schoenung, J.M.; Lavernia, E.J. Multiple and extended shear band formation in MgCuGd metallic glass during high-pressure torsion. Scr. Mater. 2014, 86, 24–27. [Google Scholar] [CrossRef]
- Boltynjuk, E.; Ubyivovk, E.; Gunderov, D.; Mikhalovskii, V.; Valiev, R.Z. Multiple Shear Bands in Zr-Based Bulk Metallic Glass Processed by Severe Plastic Deformation. Defect Diffus. Forum 2018, 385, 319–324. [Google Scholar] [CrossRef]
- Gunderov, D.V.; Boltynjuk, E.V.; Ubyivovk, E.V.; Churakova, A.A.; Abrosimova, G.E.; Sitdikov, V.D.; Kilmametov, A.R.; Valiev, R.Z. High pressure torsion induced structural transformations in Ti- and Zr-based amorphous alloys. IOP Conf. Ser. Mater. Sci. Eng. 2018, 447, 012052. [Google Scholar] [CrossRef]
- Greer, A.L.; Cheng, Y.Q.; Ma, E. Shear bands in metallic glasses. Mater. Sci. Eng. R Rep. 2013, 74, 71–132. [Google Scholar] [CrossRef]
- Pan, J.; Chen, Q.; Liu, L.; Li, Y. Softening and dilatation in a single shear band. Acta Mater. 2011, 59, 5146–5158. [Google Scholar] [CrossRef]
- Gunderov, D.V.; Churakova, A.A.; Astanin, V.V.; Asfandiyarov, R.N.; Hahn, H.; Valiev, R.Z. Accumulative HPT of Zr-based bulk metallic glasses. Mater. Lett. 2020, 261, 127000. [Google Scholar] [CrossRef]


© 2020 by the authors. Licensee MDPI, Basel, Switzerland. This article is an open access article distributed under the terms and conditions of the Creative Commons Attribution (CC BY) license (http://creativecommons.org/licenses/by/4.0/).