Article

Shear Bands Topology in the Deformed Bulk Metallic Glasses

by
Mikhail Seleznev
1,* and
Alexei Vinogradov
2
1
Institute of Materials Engineering, Technische Universität Bergakademie Freiberg, 09599 Freiberg, Germany
2
Department of Department of Mechanical and Industrial Engineering, Norwegian University of Science and Technology - NTNU, 7491 Trondheim, Norway
*
Author to whom correspondence should be addressed.
Metals 2020, 10(3), 374; https://doi.org/10.3390/met10030374
Submission received: 18 February 2020 / Revised: 11 March 2020 / Accepted: 12 March 2020 / Published: 14 March 2020
(This article belongs to the Special Issue Recent Advancements in Metallic Glasses)

Abstract

:
Recent experimental studies revealed the presence of Volterra dislocation-type long-range elastic strain/stress field around a shear band (SB) terminated in a bulk metallic glass (BMG). The corollary from this finding is that shear bands can interact with these stress fields. In other words, the mutual behaviour of SBs should be affected by their stress fields superimposed with the external stresses. In order to verify this suggestion, the topography of the regions surrounding SBs terminated in the BMGs was carefully analysed. The surfaces of several BMGs, deformed by compression and indentation, were investigated with a high spatial resolution by means of scanning white-light interferometry (SWLI). Along with the evidence for the interaction between SBs, different scenarios of the SB propagation have been observed. Specifically, the SB path deviation, mutual blocking, and deflection of SBs were revealed along with the significant differences between the topologies of the mode II (in-plane) and mode III (out of plane) SBs. While the type II shear manifests a linear propagation path and a monotonically increasing shear offset, the type III shear is associated with a curved, segmented path and a non-monotonically varying shear offset. The systematic application of the “classic” elastic Volterra’s theory of dislocations to the behaviour of SBs in BMGs provides new insight into the widely reported experimental phenomena concerning the SB morphology, which is further detailed in the present work.

Graphical Abstract

1. Introduction

Bulk metallic glasses (BMGs) possess a unique set of properties such as an unrivalled combination of toughness and strength [1], very high elastic limit and elastic energy capacity [2], biocompatibility [3], corrosion resistance, etc. [4]. One of the main disadvantages is the localisation of the BMG plastic deformation at room temperature in the shear bands (SB) [5]. SB is a planar defect with a thickness of about 10–20 nm [6] accumulating the excess-free volume (EFV) during deformation [7]. Such a “decompaction” of the SB structure induces strain softening [8], with the formation of voids and microcracks merging into the main crack as load increases [9,10]. However, significant experimental evidence has been put forward on strain hardening and material densification occurring in BMGs in association with shear bands during mechanical compression [11], tension [12], and rolling [13]. Moreover, the presence of EFV trapped in the glassy state does not necessarily lead to strain softening. The finite element modelling shows that the plasticity of metallic glasses can be enhanced with the EFV-induced heterogeneity, and even apparent hardening can be achieved [14]. The cyclic loading of BMGs in the range of apparently elastic strains leads to the formation of the elastic nano-scale heterogeneity in the bulk [15]. The nano-scale heterogeneity, which is inherent to SB, has been widely approved not only by modelling [16], but also experimentally by high-resolution transmission electron microscopy (HRTEM) and digital image correlation (DIC). In particular, it was convincingly demonstrated that the SB structure consists of alternating ~0.1–0.4 µm-long segments representing compressed and stretched areas with the density, which is either larger or smaller than that in the matrix, respectively [17,18]. Thus, the material within the SB can experience both local softening due to decompaction, and hardening due to compaction of atoms.
The successful observations of the deformation hardening in BMGs commonly refer to the high density of SBs. The greater the number of SBs and the total sheared area, the larger the deformation capacity and the apparent ductility [1,11]. The emergence of the primary SB always leads to softening and failure due to the concentration of all shear deformation in one band [19]. The intermittent hardening of BMG is witnessed by multiple observations of intersecting SBs blocking each other similarly to slip bands in crystals [11,13]. Thus, the hardening/softening behaviour is governed by the development of SBs and their interactions with each other as well as with the applied stress.
The underlying mechanism of non-uniform deformation of BMGs is still under debates due to a great complexity of direct observations. Currently, the most widespread concept is based on the hypothetical elementary deformation units—the shear-transformation zones (STZ) [20]. Microscopic STZs are supposed to interact elastically by triggering slip avalanches and forming macroscopic SBs. Ironically, the critical interaction parameter—the elastic field of the STZ—is a priori undefinable in the static state [5]. One can approximate the STZ-induced elastic fields by the infinite-range mean-field [21], which is in good numerical agreement with experiments even though it is still largely speculative. Along with the family of STZ models, the approaches based on atomistic simulations are actively discussed and used for the interpretation of the SB behaviour in metallic glasses [22]. Among these approaches, the dislocation-based model [23], the free volume model [24], and the percolation approach [25] are particularly noteworthy.
The alternative to simulations is the use of empirical studies of elastic displacements created by SB. The recently disclosed long-range elastic fields around the SB tip [26] allow assuming reasonably that the interaction between SBs occurs across the scales not only on the atomic level but also on the macroscopic scale, which resembles the behaviour of dislocations in crystals, despite fundamental microstructural differences between crystals and amorphous solids.
The SB activity manifests itself as shear steps on a polished surface of a deformed sample and can be revealed with the surface profile analysis. The surface morphology of sheared BMGs has been frequently observed in the 2D-mode by means of scanning electron microscopy (SEM) [27,28,29], or in the 3D-mode by atomic force microscopy (AFM) [30,31,32] or confocal laser scanning microscopy (CLSM) [33]. In comparison with CLSM and AFM, scanning white light interferometry (SWLI) is more suitable for the 3D mapping of the SB topology due to a combination of the unbeatable vertical resolution up to 0.1 nm and rapid scanning of the area up to 1 cm2 [34].
Both AFM and SWLI methods have been used to investigate the influence of the applied stress and pre-strain history on the SB morphology during BMG indentation [32,34]. The results clearly suggest that the interaction exists between the developing SBs, previously formed SBs and residual stresses, which results in SB reactivation, blockage, intersection, and termination. However, all these effects were described without taking into account that the SB is the imperfection with its own self-induced elastic stress field. The present work reports on the results of detailed investigations of the macro-scale 3D surface topology of the deformed BMG aiming at shedding light on the formation of SB’s features and mutual SBs interactions on account of their long-ranged elastic stresses.
The paper is organised as follows. In the following section, the material properties and testing methods are briefly described. For the sake of consistency, the results and discussion are provided together within each sub-section of Section 3. Section 3.1 highlights the experimental evidence to date supporting the presence of long-range elastic fields. SBs morphologically classified as shear and tear mode types in Section 3.1 are further analysed by means of the 3D surface mapping in Section 3.2 and Section 3.3, respectively. Section 3.4 is focused on the local offset and path deviations within SBs. Whereas Section 3.1, Section 3.2, Section 3.3 and Section 3.4 describe the results of SB investigations after mechanical compression, Section 3.5 reveals new facts of the interaction between SBs formed during micro-indentation of BMGs. Lastly, all findings are summarised in Section 4.

2. Materials and Methods

Pd-based and Zr-based BMG ingots were produced by a suction casting process in a copper mould under a purified argon atmosphere. Processing details are given in Reference [35] for Pd40Ni40P20, Reference [36] for Zr48Cu45Al7, and Reference [37] for Pd40Cu30Ni10P20, respectively. All specimens for mechanical testing were shaped by spark erosion. The samples with 2 × 2 × 4 mm3 dimensions were prepared from the Pd40Ni40P20 (PdNiP) glassy ingot. The surfaces were polished to a mirror finish for shear band observations at different scales. The samples of Pd40Cu30Ni10P20 (PdCuNiP) were shaped to 2.66 × 2.66 × 5.5 mm3 dimensions. U-shaped and square notches were introduced in these samples to localise the deformation zone and provoke the SB nucleation in the field of view of the camera used for in-situ imaging of the deformation surface and the digital image correlation (DIC) analysis. One batch of the samples was polished to the mirror finish for SB observations and the SWLI analysis of the shear band profiles. The other batch was kept in the as-cast state for the measurement of displacement fields around SB tips with the help of DIC analysis.
Compression experiments were carried out using the rigid mechanical testing system comprising of a screw-driven tension/compression module Kammrath and Weiss (Kammrath and Weiss, Dusseldorf, Germany), high-speed video camera Photron SA3 (Photron Ltd, Tokio, Japan) and the acoustic emission triggering circuit designed to interrupt the experiment when a new SB emerges. Details of the experimental setup have been documented in Reference [38]. Samples were loaded in compression between two parallel lubricated tungsten carbide plates with a speed of 1 µm/s. When the new SB appeared at the free surface, the testing system was stopped automatically, the samples were unloaded, and the surface topology was investigated by SWLI (Zygo NewView 7100, Zygo Corporation, Middlefield, CT, USA).
A piece of the as-cast Zr48Cu45Al7 (ZrCuAl) alloy was polished to a mirror finish for micro-indentation experiments performed using the Nanovea Scratch tester (Nanovea, Irvine, CA, USA) at 20 N force applied to the diamond Berkovich indenter (three-sided pyramid) with the loading/unloading speed of 1 N/s and the load holding time of 10 s. The shear bands emerging around the indenter were observed using the SWLI technique. To reveal the possible interactions between the SBs, the indentations were performed close to each other, of 50 µm apart, so that the indenter affected deformation zones overlapped. After indentation, the sample surface was scanned by SWLI.

3. Results and Discussion

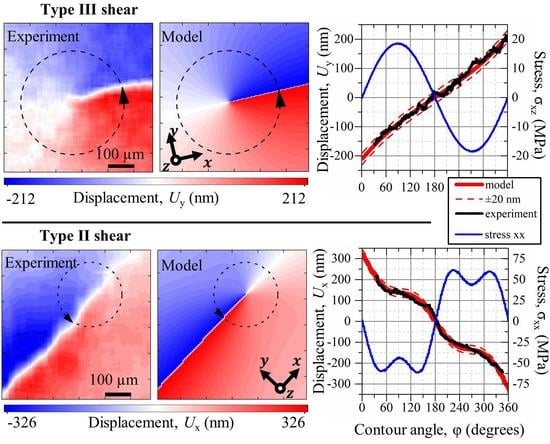
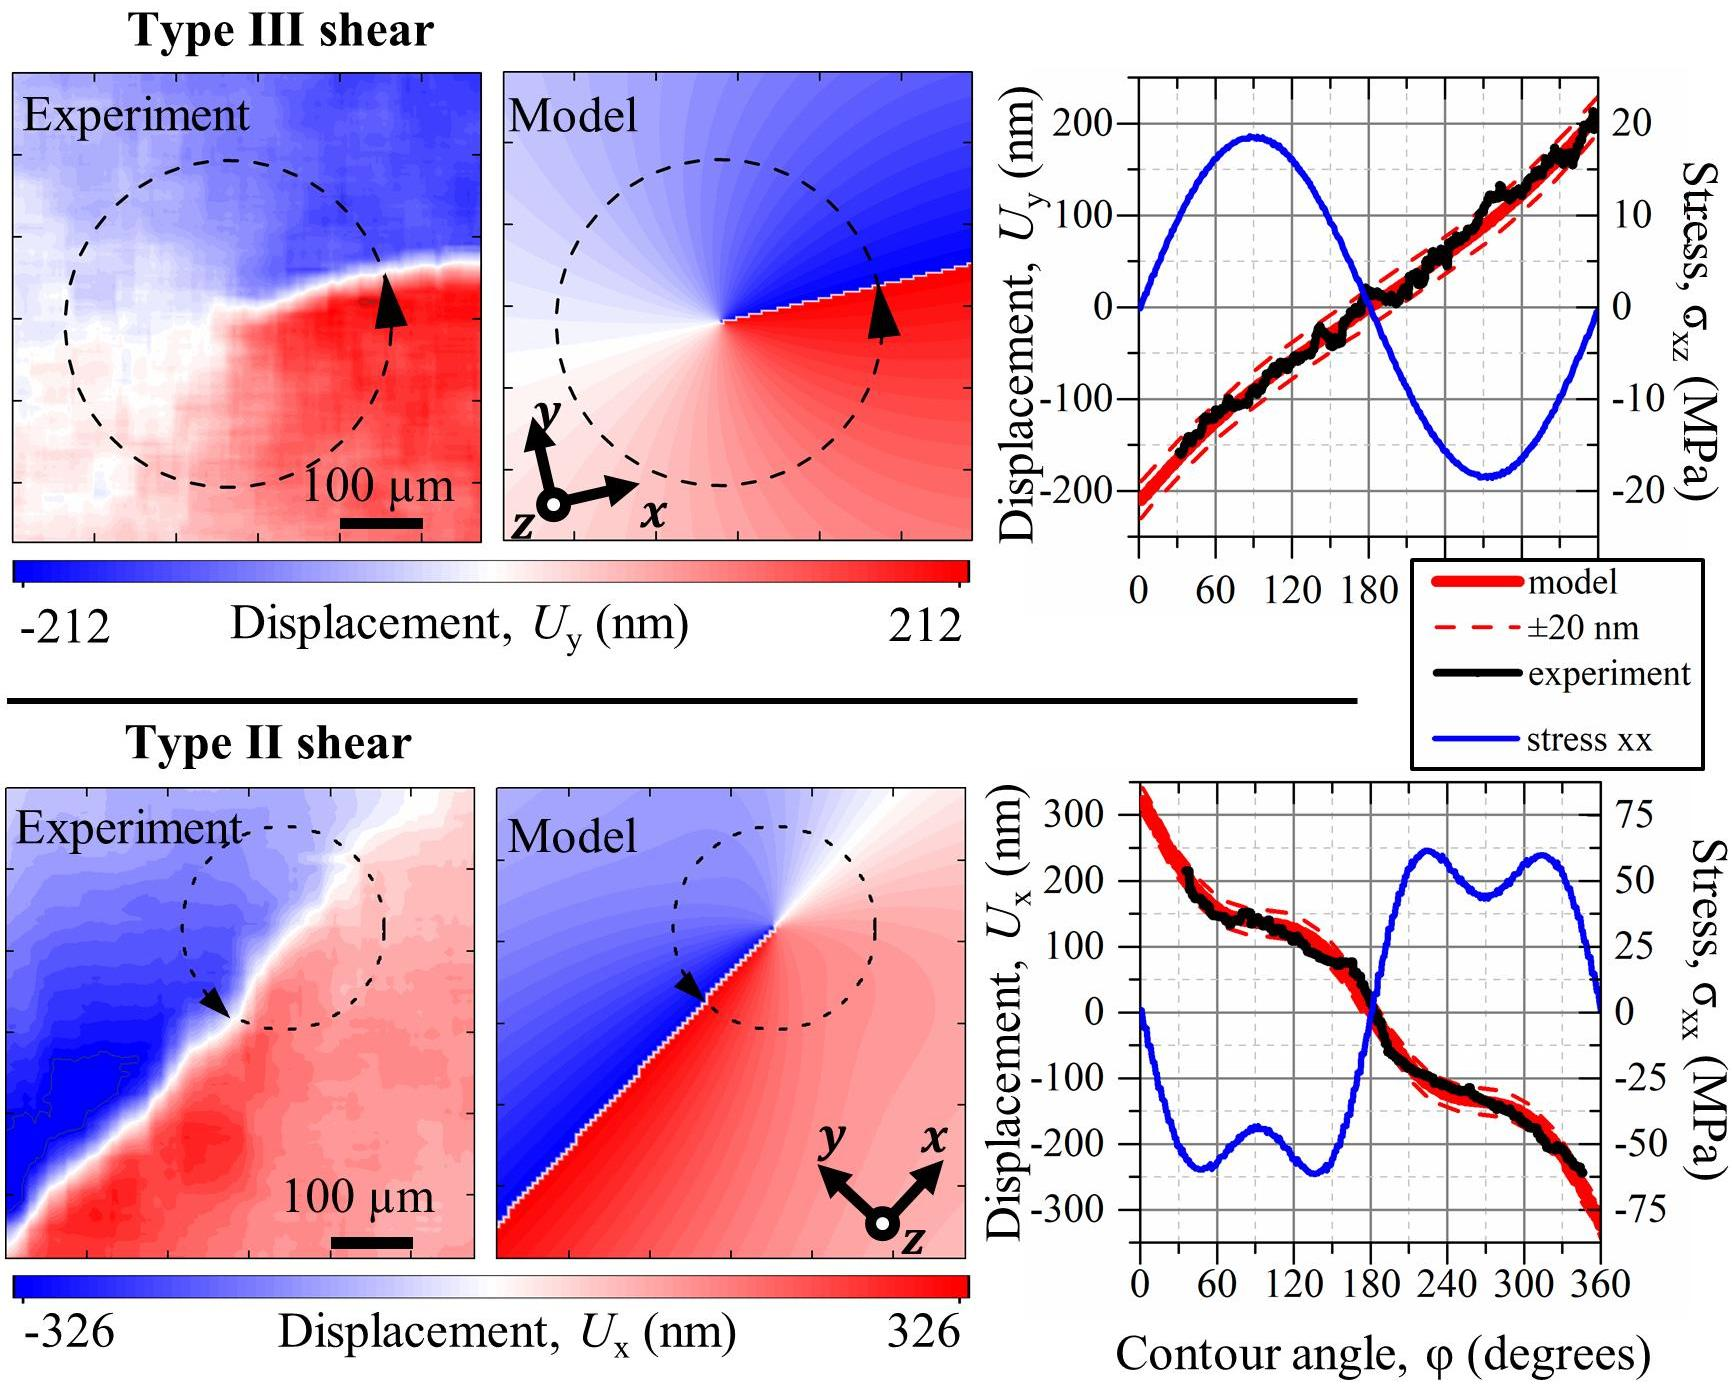
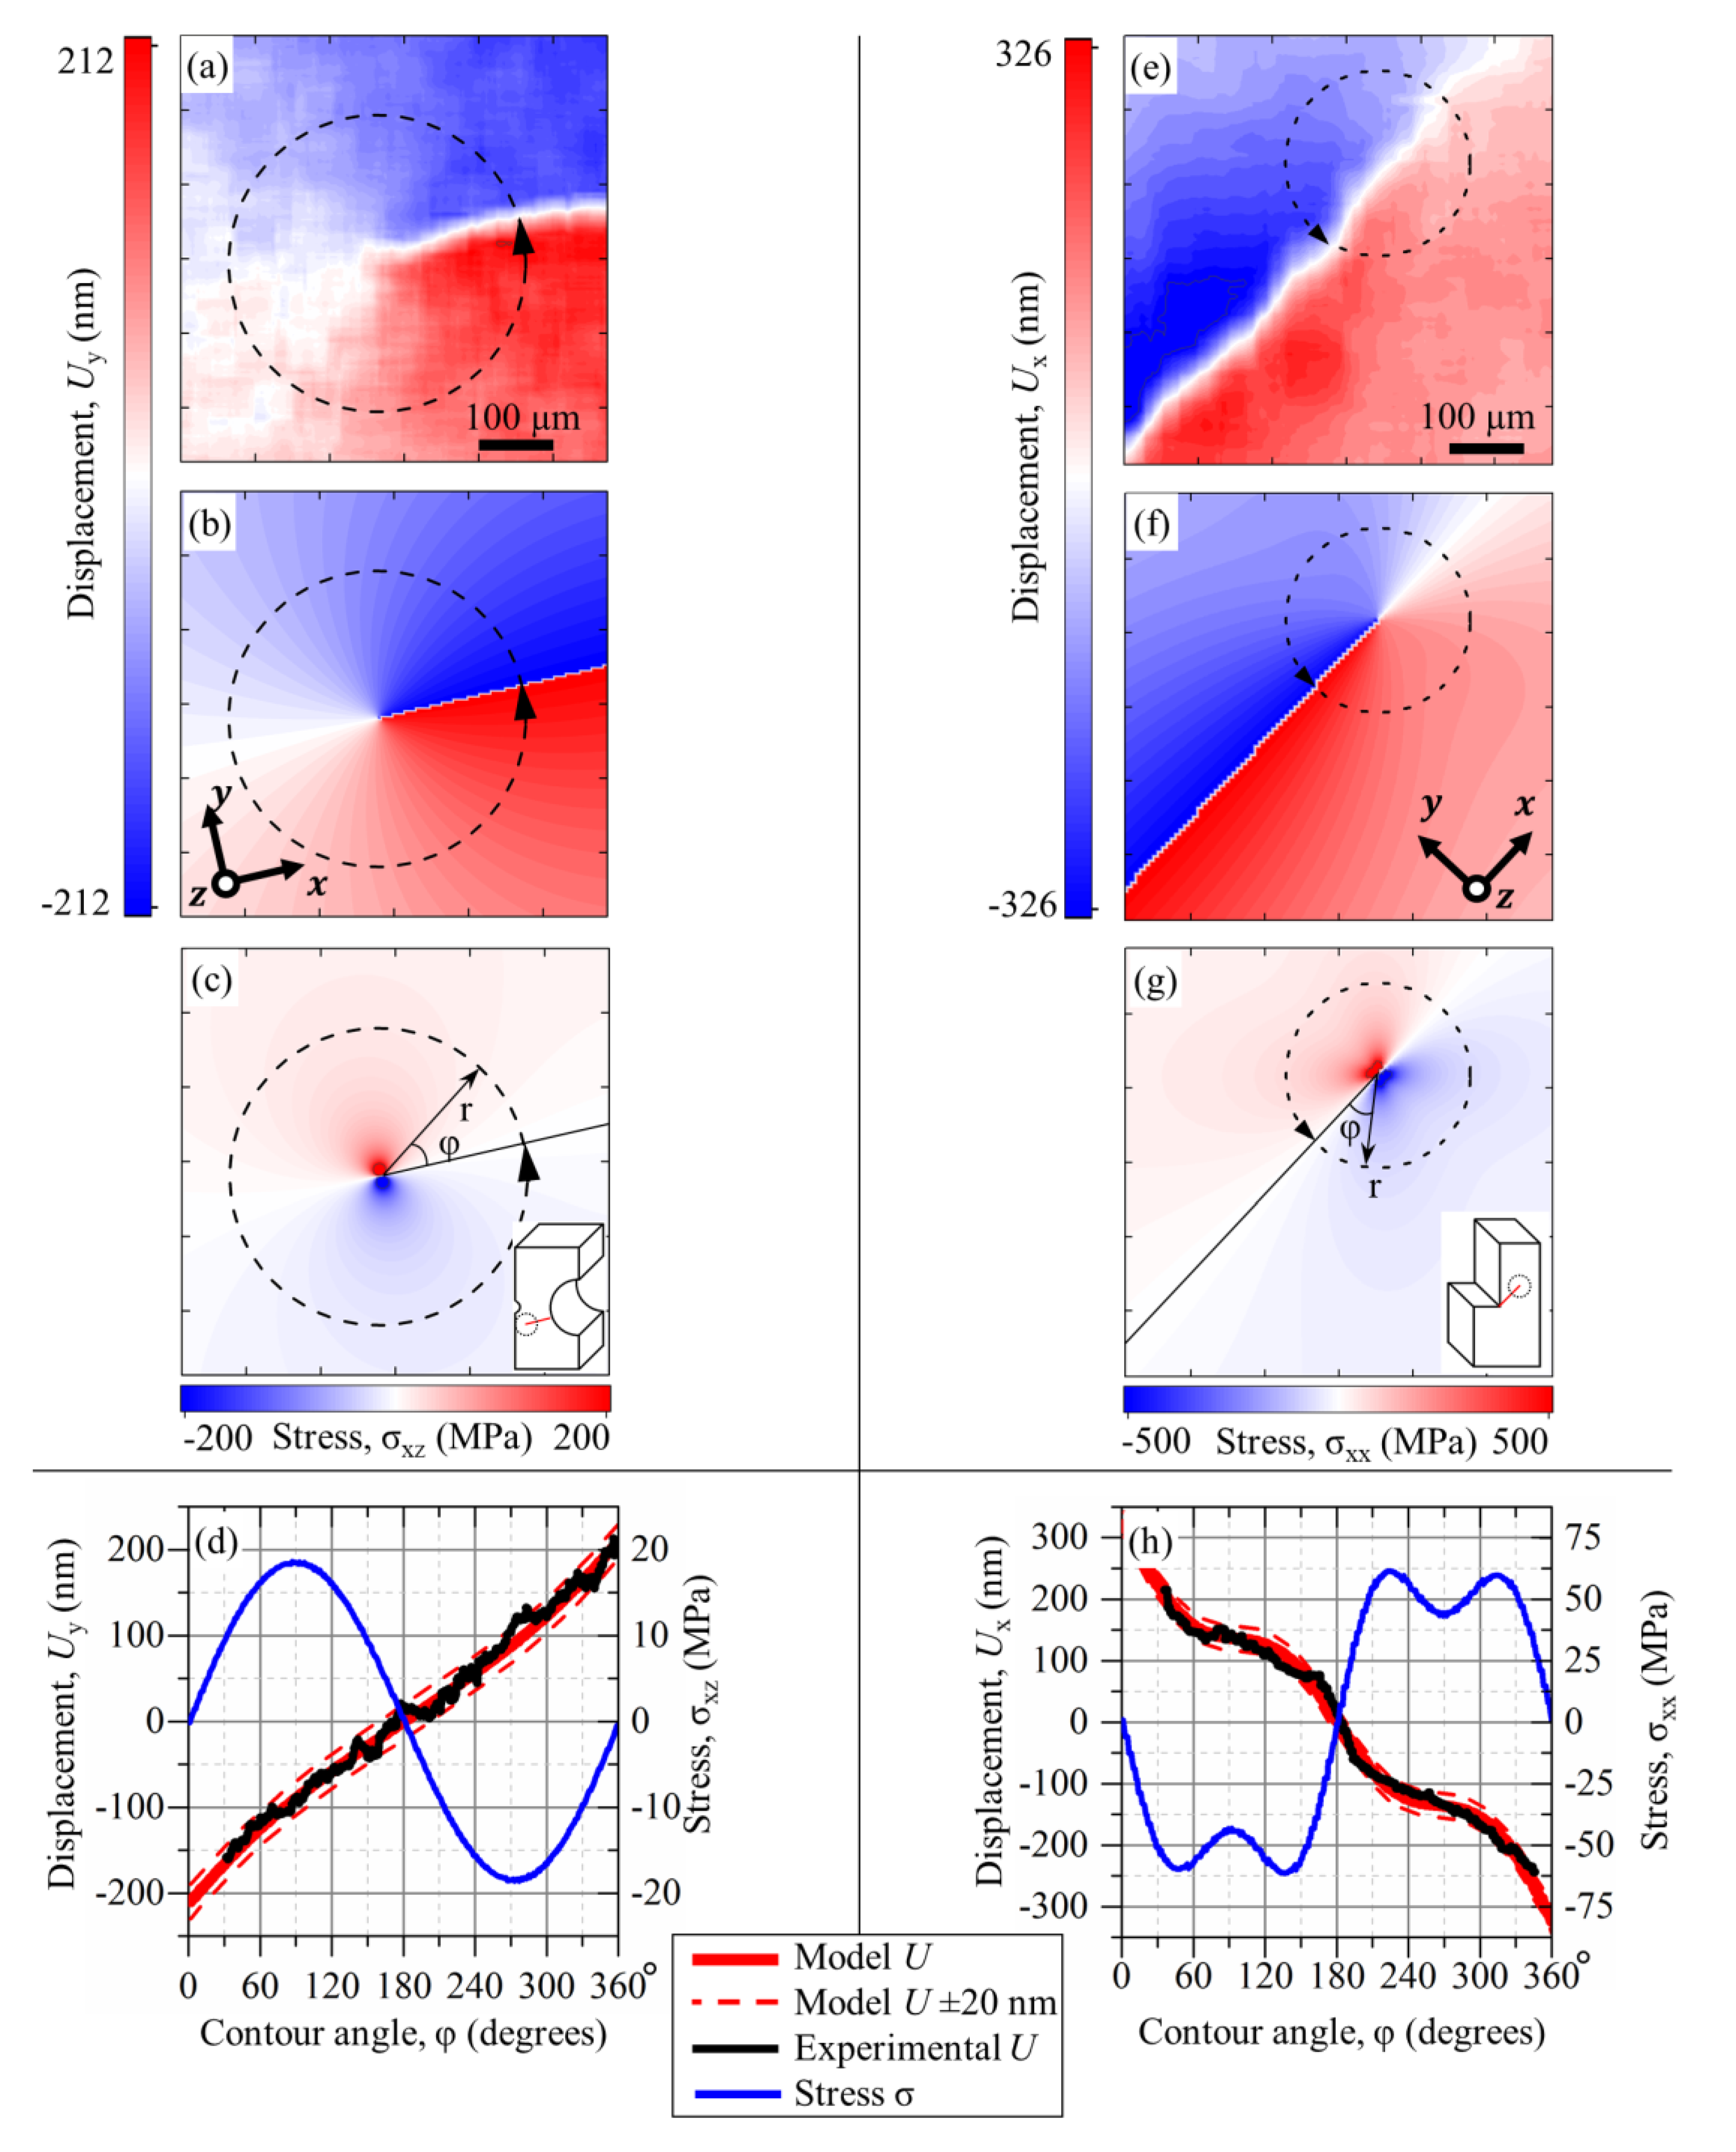
3.1. Measurement of the Long-Range Stress Fields Produced by Shear Bands

The first brief report on the direct observations of the long-range elastic strain and stress fields created by a shear band terminated inside the BMG was made by the same authors in Reference [26]. For consistency with what follows, we repeat the same experiment and provide new additional insight into this topic. The specially designed sample geometry promotes obtaining SBs with either the dominating shear mode (mode II, by analogy with that of the shear crack), c.f., the inset in Figure 1g, or the tearing mode (mode III out-of-plane shear), c.f., the inset in Figure 1c, during compression. After in-situ imaging of emerging SBs in PdCuNiP specimens, the displacement fields around the SB tips were calculated using the DIC algorithm (Figure 1a,d).
Notice that the presented in Figure 1a,d displacements Uy and Ux are “raw”, i.e., they are calculated using only the correlation coefficient method without any smoothing or filtering. The displacement of the mode II shear was calculated directly from the XY-plane. The mode III shear offset was inclined to the observed surface at 45°, which projects itself on the XY-plane. This made it possible to quantify the out-of-plane shear offset via its XY-projection. Using the well-known expressions for the strain and stress fields created by perfect screw and shear dislocations in elastic continuum [39] with account of the actual shear geometry in the present experiments, the expected displacement fields have been calculated [26] and plotted in Figure 1b,f for comparison with experimental data, (Figure 1a,e) respectively. Even a simple juxtaposition of these respective figures suggests good qualitative agreement between the experimental findings and the predictions from the dislocation theory both for mode III (Figure 1a,b) and mode II shear (Figure 1e,f). The quantitative comparison is represented in Figure 1d,h using a circular contour around the shear band tip (with the tip in the center and the arbitrarily chosen radius). The dislocation-based elastic model predictions exhibit impressive numerical agreement with the experimental data within the error of less than 10%, which is a remarkable result.
Both experimental data and theoretical calculations show that elastic fields around the SB associated with the Volterra-type macro-dislocation [40] are large enough to increase the local stresses significantly, i.e. of 10–100 MPa stress hundreds of micrometres apart from the shear tip (Figure 1c,g).
The experimental evidence for the existing Volterra dislocation-type long-range elastic fields around the SB front offers a new insight into the interpretation of previously reported experimental results regarding the SB-related properties of metallic glasses, such as apparent work hardening [11,12,13], internal friction relaxation peak [41,42,43], reactivation and suppression of the SB activity [34], etc. While there are multiple similarities in the shear behaviour in crystalline and amorphous solids, there are also major differences. Due to the absence of long-range order within the atomic structure of a glass, BMGs do not have crystallographically defined slip planes and directions. Therefore, (i) the shear slip in the amorphous structure requires dilatation [44], which is notably more pronounced than that in the core of the crystal dislocations [45], and (ii) the SB’s offset and propagation direction are not constrained by a crystal structure. These factors collectively lead to considerable topological differences between the mode II and mode III SBs, which is further investigated in Section 3.2 and Section 3.3, respectively.

3.2. Mode II Shear Morphology

The offset of the mode II SB aligns with the shear propagation direction. This promotes the straight path of the shear front through the specimen. Therefore, under the uniform far-field stress (e.g., during compression of an unnotched specimen), the SB appears commonly as a straight line. Since such an SB does not produce a step at the lateral surface, it is challenging to observe it by any topology-sensitive microscopic imaging technique. The offsets of plastic shear along the SB can be, however, easily noted on the lightly scratched surface, as exemplified by Figure 2d. This figure shows the topology map of the surface fragment represented in Figure 2a (the red line indicates the scratch intersecting the SB and the red arrows indicate 1μm plastic shear offsets associated with the bands).
The pure mode II shear is rarely observed. Many, if not most, SBs of this mode contain some contribution from the mode III component, which manifests itself as a surface step (Figure 2b). This step is nicely resolvable with aid from SWLI (Figure 2) where three shear bands marked #1, #2, and #3, respectively, are shown (SBs #1 and #2 are parallel to each other while SB #3 intersects SB #1 at the right angle). It has been shown that a mode II shear offset changes linearly along the SB from the maximum at the surface step to zero at the shear tip [27]. However, the mode III offset component within the primary mode II SB (Figure 2a) exhibits different types of behaviour, which can be seen as
(1) the monotonic decrease in a shear step height to a zero (SB #1),
(2) the non-monotonic decrease in the shear step height alongside the shear band (SB #2, notice the altering step direction in the middle of the figure),
(3) propagation blocking due to the SB-SB interaction (SB #3).
The offset of the off-plane component of the predominantly mode II SB can linearly decrease from maximum (step 7 ≈ 250 nm, Figure 2c) to zero at the tip of SB #1, similarly to the mode II offset reported in Reference [27]. The step direction can change the sign and becomes negative, c.f., SB #2, step 6 ≈ −10 nm (Figure 2c). Figure 2 illustrates the known fact [46] that one SB can block the propagation of another, c.f., SB #3 is terminated at SB #1 (Figure 2). One can see that SB #3 exhibits the step height 150 nm (step 1) at the initiation site at the specimen edge, and it ends sharply when meeting SB #1 with the step height of 42 nm (step 2). The site is featured by a local plastic pile-up of 90 nm (step 4) visible in the inset of Figure 2a between steps 3 and 5, being of 50–60 nm each. On the other hand, SB #1 propagates straight by 0.5 mm into the specimen with the gradually vanishing shear offset.
Considering the macroscopic homogeneity of the glassy microstructure, the fact that one SB can block the other, which has been frequently observed in abundant literature, is yet to be understood. One of the plausible explanations to this blockage effect can be given based on the possible SB-SB interaction via their elastic stress fields. As mentioned in the introduction, the experimentally revealed nano-scale SBs heterogeneities create alternating tension/compression regions along the shear path [17,18]. Thus, the elastic field of the tip of SB #3 can interact with SB #1, which results in the effective blockage of shear bands.
If the SB-induced elastic stresses extend across the scales from nano-range to macro-range, one should be able to observe the following related effects.
(1) The long-range elastic stress field around the SB-tip (c.f., Figure 1) should influence the SB step morphology if the shear offset is out-of-plane (mode III).
(2) The local deviations should manifest themselves not only along the SB path but also in the shear offset.
(3) The SB propagation should be sensitive to the superposition of the local stresses and the self-stresses arising from the SB tip.
These effects are overviewed in Section 3.3, Section 3.4 and Section 3.5, respectively.

3.3. Mode III Shear Morphology

Unlike the mode II shear, the mode III shear deformation occurs in the direction perpendicular to the shear propagation plane. This shear mode is less constrained and has some “degree of freedom” in the propagation direction, which can result not only in the appearance of local deviations of the SB path but also in its segmentation. A typical example of such an SB is represented in Figure 3. Each segment of the mode III SB is labelled numerically from #1 to #7 and consists of two parts: (i) the arched step with a constant shear offset ranging from 500 to 50 nm and (ii) the tip with a monotonic decrease in the offset height from 50 nm to zero (Figure 3a).
One should keep in mind that the shear plane of the observed SB is inclined with respect to the scanned specimen surface (Figure 3c). Thus, the shear offset values (Figure 3d) are larger than the vertical (Z-axis) step height values by a factor of around 1.4. This, however, does not change the mode III shear behaviour qualitatively. Such a shear band propagates in a progressive manner (at sharp contrast with simultaneous sliding), which has been shown in Reference [27]. Unlike the straight single-line mode II shear, the mode III shear path is segmented into short consequent fragments, so that each propagation event occurs one after another.
Considering that the SB tip induces a long-range stress field, one can easily rationalize the above observations. The mode III shear initiates from a stress concentrator, located at the edge of the specimen (Figure 3c). The plane of the maximum shear stresses is inclined at approximately 45° to the loading axis (40° in the case of compression). The SB tends to align itself with this plane, but the resulting trajectory is not straightforward. This is due to the fact that a path of the mode III shear in a BMG is the result of the superposition of external far-field stress and the stress field of the mode III shear itself (Figure 1c). A sum of two perpendicular acting forces—one from the external stress and one from the dislocation-induced peak stress—results in the tortuous path, which one can observe clearly for each segment.
Even in polycrystalline materials, the planar discontinuities, such as cracks, may propagate along a smoothly curved non-crystallographic path due to a specific superposition of triaxial stresses. Compare, for example, the S-shaped cracks, which are frequently observed in hydrogen embrittled steels [47].
The curved morphology of the SB indicates that the Volterra-type macro-dislocation associated with the shear band deviates from the preferred maximum macroscopic shear stress plane. The more the SB deviates from this plane, the lesser is the driving force for its propagation, which vanishes at some point, and the shear front stops (Figure 3e(I)). The next shear segment starts from the stress concentrator located at the intersection of the maximum shear plane and the previous shear path (Figure 3e(II)). In this scenario, each new SB segment increases the total offset at the surface, extends the overall SB length, deviates from the general mode III plane, and stops (Figure 3e(III)).
Another exciting feature of the mode III SB step morphology is that the individual segments tend to curve in the same direction. This observation can be logically explained by the stress fields of SB’s tips. Each tip of the terminated SB can be described as a Volterra-type screw macro-dislocation, which is shown in Figure 3e—isometric view. The screw shear tips form an energetically favourable dislocation-like ladder (just like that in crystals) with alternating negative and positive stresses (see Figure 3e, top view). This happens due to the attraction of the opposite sign stress components—an example of dislocations interaction in a BMG.

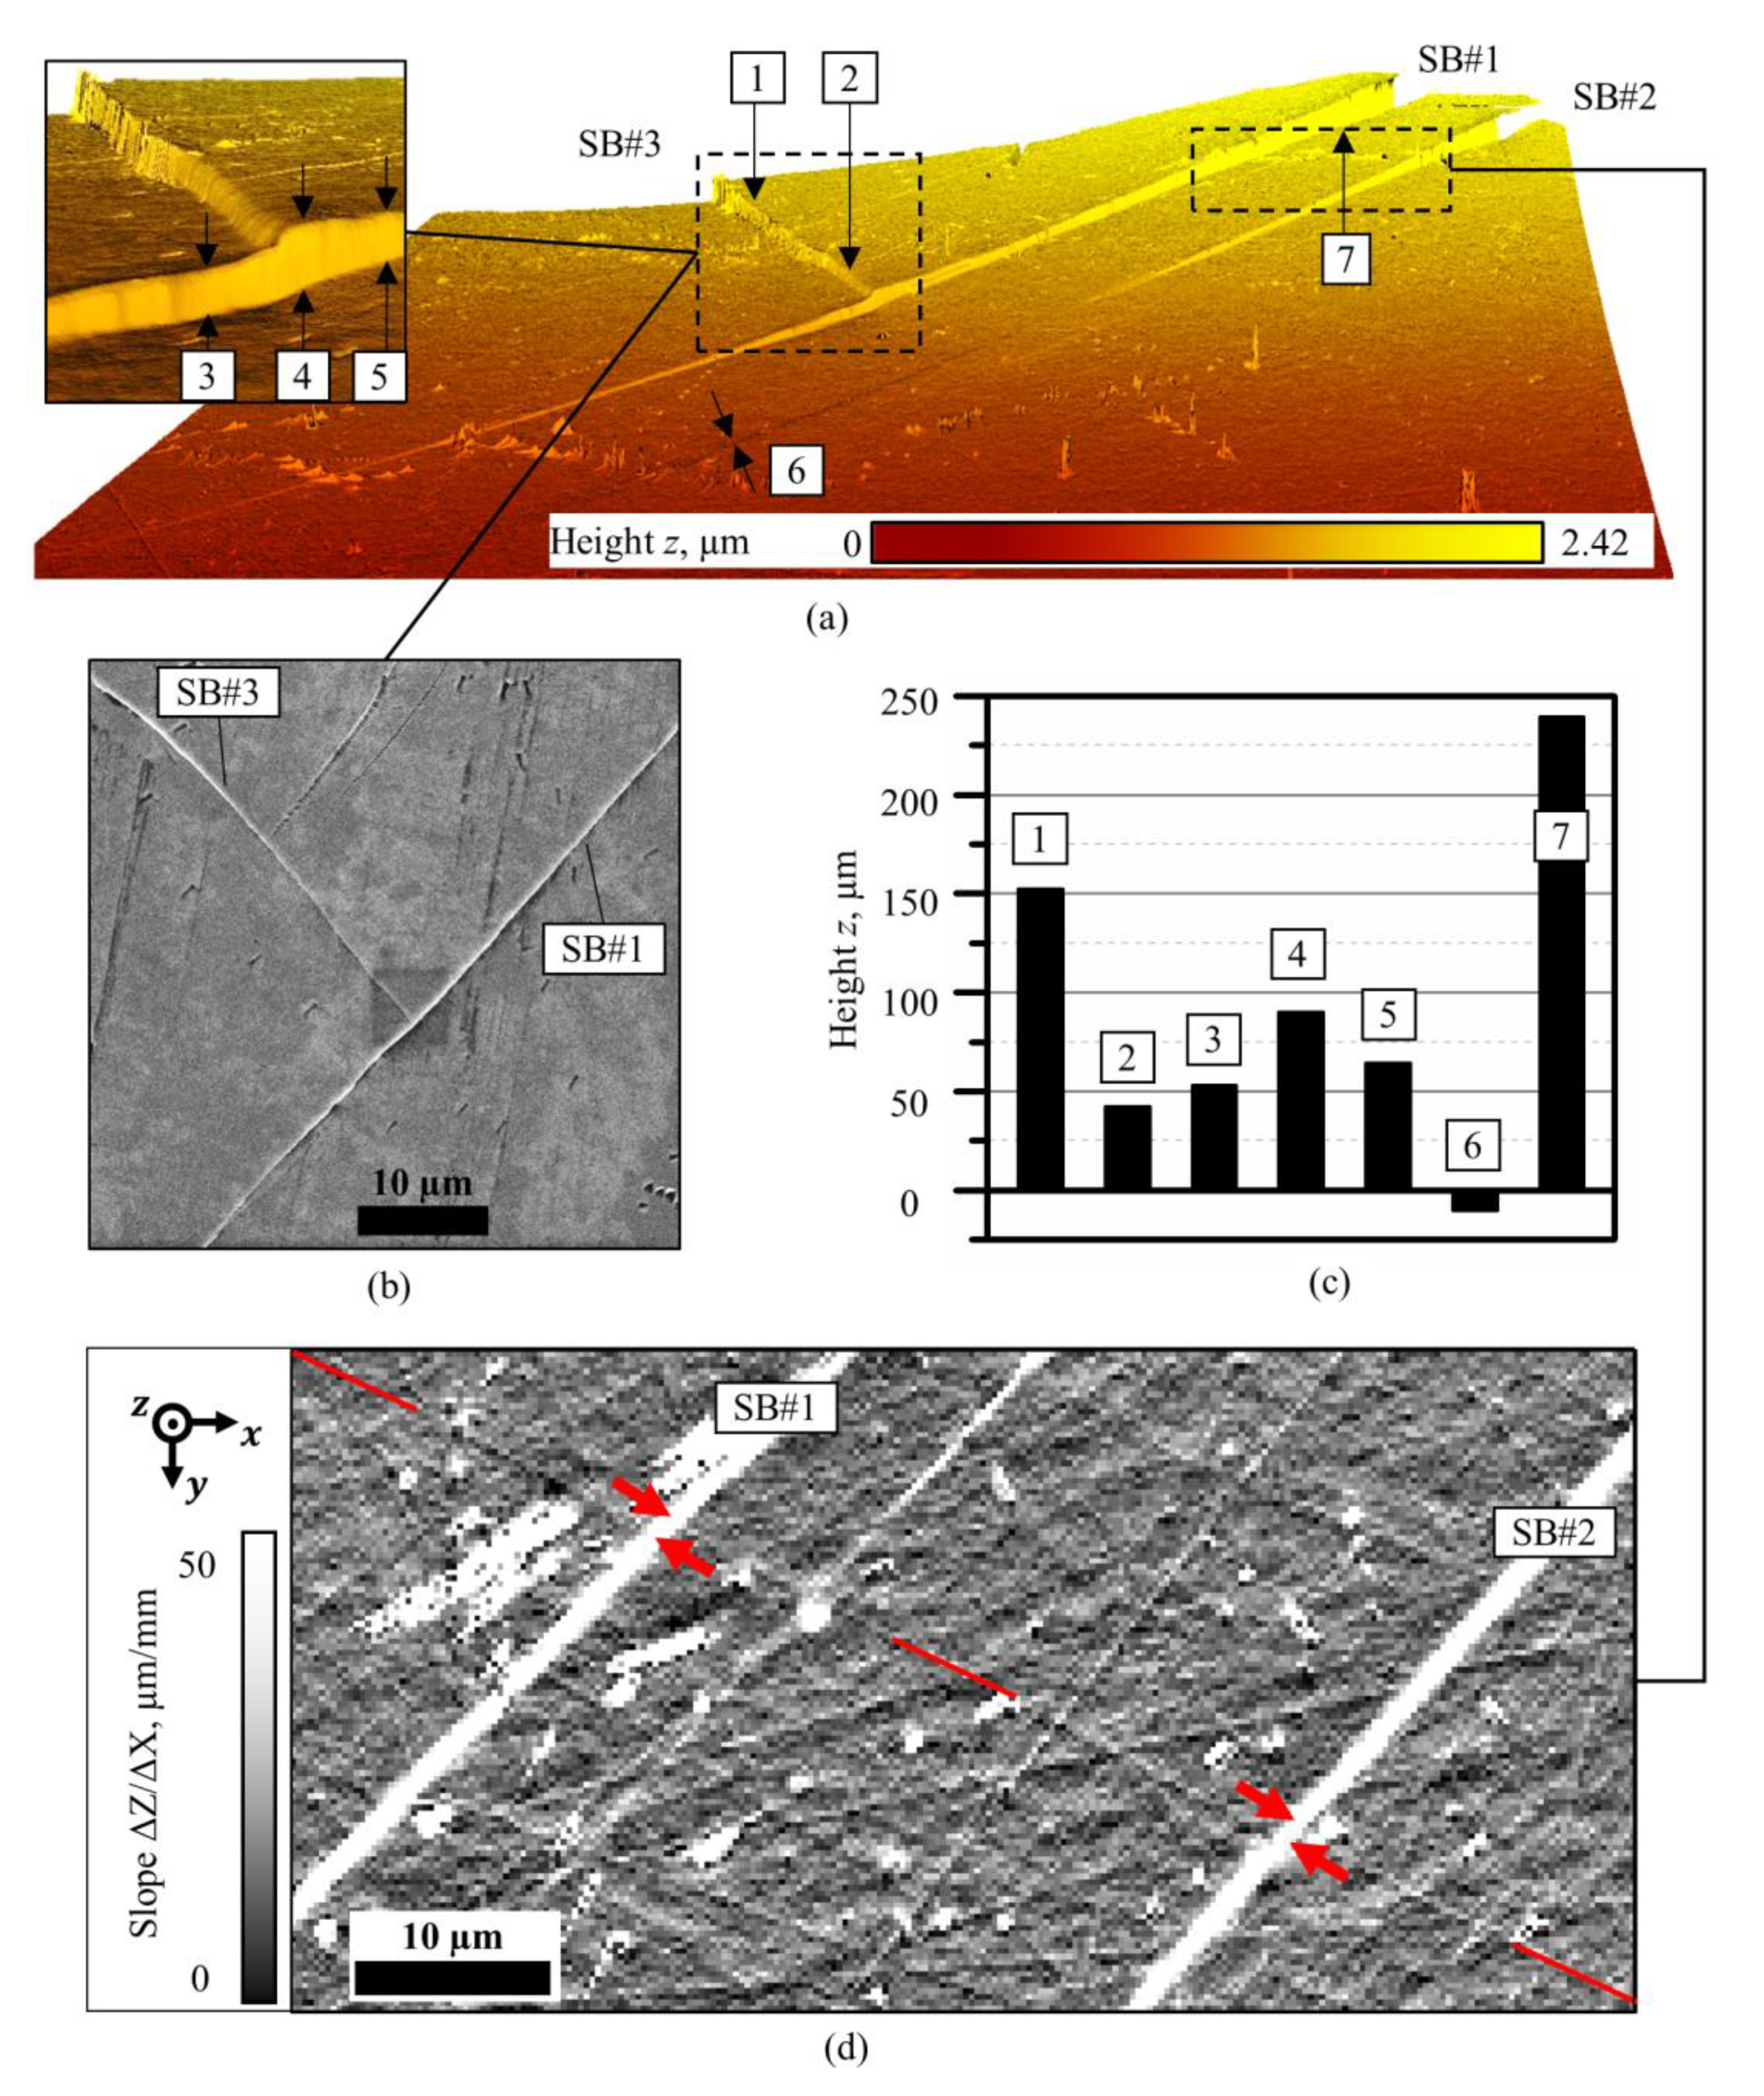
3.4. Shear Offset Fluctuations

Considering the shear propagation mechanism proposed in Section 3.3, the nano-scale heterogeneities of the SB [17,18] should somehow accumulate with each segmental length increment. The regions of low density along the SB evolve to from nanovoids and microcracks, which leads to fracture [9,10,19,48]. This density fluctuation growth should then influence the observed SB step morphology. The SWLI technique allows us to detect such an influence, which manifests itself through the wavy fluctuation of the SB step height (Figure 4). The “old” SBs (i.e., bands formed by several shear events) exhibit these fluctuations, which are clearly visible on the tilted map (Figure 4a). Isometric view of the SB part zooms in the morphology and shows an inhomogeneous nature of BMG shear. The observed SB fluctuates both along its path up to ± 1.5 µm (Figure 4c) and the step height around ± 200 µm (Figure 4d).
As suggested by Gilman, the observed path deviations up to 30% would produce the elastic energy increase of less than 10% [49]. The shear stress τxz introduced by the offset fluctuation can be estimated via the Cauchy’s infinitesimal strain γxz tensor as:
τ X Z = G · γ X Z = G 1 2 ( d x d z + d z d x ) = G 2 d z d x ,
where G = 35.5 GPa is the shear modulus of the Pd40Cu30Ni10P20 alloy [2]. The calculated local shear stress value varies in the range of ± 600 MPa (Figure 4e). It is worth mentioning that a real stress range is likely even larger, considering the of 45° angle between a shear plane and the scanned surface. Such large stress values up to 1 GPa result from the accumulation of several (up to 10 in observed “old” SB) successive shear events on one plane. This means that the stress oscillations along the SB, introduced by one mode III shear event, should be of an order of magnitude smaller, i.e., around 100 MPa. However, the calculation of strains performed by Binkowski et al. [17] shows that the strain variations occur in the range from +0.30 to −0.10 alongside an individual mode II shear band, which yields the local shear stress values up to several GPa.
Nevertheless, the above described quantitative estimations strongly suggest the inherently fluctuating nature of the shearing processes occurring in BMGs. Local stress values along the SB are comparable with those at the SB tip, as shown in Section 3.1. This means that the SB stress interaction can occur not only around the SB tip but also along a whole SB length.

3.5. Shear Bands’ Behaviour during Indentation

Several indentation experiments were conducted on the surface of Zr-based BMG, as described in Section 2. Examples of morphology of indented surfaces are presented in Figure 5. A typical triangular pyramidal indentation footprint is surrounded by SBs forming stepwise pile-ups with the height variations observable on 3D maps (Figure 5d,e). The 20–30 µm wide pile-ups form near each side of the indent. To reveal the influence of shear deformation prehistory on the formation of SBs, the distance between the indentation centers was chosen to be close enough to ensure that the shear zones created by two neighbouring indents overlap. The first indentation in the non-deformed material is labelled #1 and the subsequent indentation is marked #2. Three pairs of indents were made so that the edges of their footprints were aligned parallel to each other at 43 µm, 35 µm, and 28 µm apart, respectively (Figure 5a–c). The second indentation was also performed with the indenter tip perpendicular to the edge of the first imprint (Figure 5f).
Indentation of the non-deformed BMG forms regular concentric arcs of shear offsets around the pyramidal imprint, indentations #1 in Figure 5a–c. The monotonic stress field gradient form accurately curved shear traces, which can be considered as iso-stress lines (Figure 5a–f, indentation #1). The picture changes significantly when the plastic shearing is enforced in the pre-deformed area. In this case, the formation SBs caused by the second indentation is driven by the superposition of their stress fields with the external stress field created by the indenting pyramid tip and the stress field existing in the specimen from the previously formed SBs around indent #1. The most clear effect is seen as shear branching and the dramatic change in the SBs morphology form a regular circle line to a set of segmented, significantly distorted lines (Figure 5a–f). Such a complex branched morphology cannot be obtained as a geometrical sum of slip events occurring in two-slip systems [50]. A new SB can swap its arc curvature to the opposite one from the previous indent (Figure 5a). This effect can be related to the reactivation of the “old” preexisting SBs, as it was observed in Reference [34]. The significant residual compressive stresses from the first indentation can even suppress the formation of new SBs when the edges of the indents are aligned to each other (Figure 5c). In the case of the normal orientation of imprints (Figure 5f), one can notice the deflection of the second set of SBs from the ideal circumferential shape in the vicinity of the previously formed SBs. The possible mechanism of this effect is sketched schematically in Figure 5g. Although the exact initiation point of the SB is not known, it is likely to be located on the plane perpendicular to the centre of the indent side as the point of the maximum stress. The propagating SB reaches the pre-deformed area where the stresses of both indents superimpose (Figure 5g, blue), and the resulting stress field at the SB tip shifts significantly toward the compressive direction. This forces the SB to turn in the direction of the compressive stress maximum.

4. Summary and Conclusions

The results presented in this study testify to the existence and significance of Volterra dislocation-type long-range elastic strain/stress fields around a shear band tip in deformed BMGs. Such a stress field affects the behaviour of the SB under external load and can be revealed by examining the surrounding surface topography. In order to study the SB’s topological features, 3D surface scanning of the deformed BMGs was conducted with aid from the SWLI technique. Different stress conditions were achieved in BMGs under mechanical compression and indentation testing to stimulate different shear modes and SB’s interactions. The results of the 3D surface mapping of the deformation-induced shear zones were analysed by taking into account the existence of long-range strain/stress field around each SB tip. The results can be summarised as follows.
(1) The elastic field around a tip of the SB in a BMG was experimentally approved to be similar to the elastic field of the Volterra-type macro-dislocation, revealing edge-like (mode II shear) and screw-like (mode III shear) shear components. Thus, SBs in BMGs can be described in terms of the Volterra’s macro-dislocations and their behaviour under load can be rationalised accordingly.
(2) The long-range stress fields produced by macro-dislocations are supposed to be responsible for the frequently reported SB-SB interactions causing branching, deflecting, mutual blocking, and local strain hardening.
(3) The offset of a mode II shear under uniform compression coincides with the shear propagation direction. This determines the SB’s path and offsets deviations, which gives rise to the mode II shear features including the progression of a solitary shear band along the straight path without significant deviations, and a monotonic offset change from the tip to the specimen edge without significant offset deviations.
(4) The offset of the mode III shear under uniform compression is perpendicular to the shear propagation direction. Having no strong constraints on the path or offset, the mode III shear tend to curve exhibiting significant deviations of the path and in the offset. This mode of SBs shows a segmented morphology, where each segment represents a separate mode III shear, which bends away from the primary shear plane toward the side by forming a sort of a “dislocation-like” wall.
(5) The SWLI technique applied to compressed BMG specimens reveals local deviations both in the shear path and shear step height in qualitative agreement with suggestions by Gilman [49] and Binkowksi et al. [17]. The shear offset deviations were found to accumulate with every following shear event. Shear deviation accumulation is believed to be the main reason for the crack initiation and failure of BMGs.
(6) The behaviour of SBs in deformed BMGs is strongly affected by their self-induced local strain/stress fields leading to frequently observed and, reported in the literature, SB interactions revealed as branching, rejuvenation, mutual blocking, and deflection of propagating SBs.

Author Contributions

Conceptualization, methodology, software, validation, analysis, investigation, visualization, writing, original draft preparation—M.S. Writing—review and editing, supervision, project administration—A.V. Both authors have read and agreed to the published version of the manuscript.

Funding

This research received no external funding.

Acknowledgements

The authors gratefully acknowledge the Institute of Advanced Technologies of Togliatti State University, Russia, and, particularly, Dmitriy L. Merson for granting access to the experimental equipment. The authors also would like to thank the Institute of materials physics of the University of Münster, particularly, the group of Gerhard Wilde and Sergiy V. Divinski for the provision of materials and manufacturing facility for the fabrication of Pd-based metallic glasses.

Conflicts of Interest

The authors declare no conflict of interest.

References

  1. Demetriou, M.D.; Launey, M.E.; Garrett, G.; Schramm, J.P.; Hofmann, D.C.; Johnson, W.L.; Ritchie, R.O. A damage-tolerant glass. Nat. Mater. 2011, 10, 123–129. [Google Scholar] [CrossRef] [PubMed]
  2. Liu, Z.Q.; Zhang, Z.F. Strengthening and toughening metallic glasses: The elastic perspectives and opportunities. J. Appl. Phys. 2014, 115, 163505. [Google Scholar] [CrossRef]
  3. Schroers, J.; Kumar, G.; Hodges, T.M.; Chan, S.; Kyriakides, T.R. Bulk metallic glasses for biomedical applications. JOM 2009, 61, 21–29. [Google Scholar] [CrossRef]
  4. Trexler, M.M.; Thadhani, N.N. Mechanical properties of bulk metallic glasses. Prog. Mater. Sci. 2010, 55, 759–839. [Google Scholar] [CrossRef]
  5. Greer, A.L.; Cheng, Y.Q.; Ma, E. Shear bands in metallic glasses. Mater. Sci. Eng. R 2013, 74, 71–132. [Google Scholar] [CrossRef]
  6. Zhang, Y.; Greer, A.L. Thickness of shear bands in metallic glasses. Appl. Phys. Lett. 2006, 89, 071907. [Google Scholar] [CrossRef]
  7. Park, E.S. Understanding of the Shear Bands in Amorphous Metals. Appl. Microsc. 2015, 45, 63–73. [Google Scholar] [CrossRef]
  8. Maaß, R.; Birckigt, P.; Borchers, C.; Samwer, K.; Volkert, C.A. Long range stress fields and cavitation along a shear band in a metallic glass: The local origin of fracture. Acta Mater. 2015, 98, 94–102. [Google Scholar] [CrossRef]
  9. Qu, R.T.; Wu, F.; Zhang, Z.-F.; Eckert, J. Direct observations on the evolution of shear bands into cracks in metallic glass. J. Mater. Res. 2009, 24, 3130–3135. [Google Scholar] [CrossRef]
  10. Qu, R.T.; Wang, S.G.; Wang, X.D.; Liu, Z.Q.; Zhang, Z.F. Revealing the shear band cracking mechanism in metallic glass by X-ray tomography. Scr. Mater. 2017, 133, 24–28. [Google Scholar] [CrossRef]
  11. Das, J.; Tang, M.B.; Kim, K.B.; Theissmann, R.; Baier, F.; Wang, W.; Eckert, J. “Work-Hardenable” ductile bulk metallic glass. Phys. Rev. Lett. 2005, 94, 205501. [Google Scholar] [CrossRef] [PubMed] [Green Version]
  12. Wang, Z.T.; Pan, J.; Li, Y.; Schuh, C.A. Densification and strain hardening of a metallic glass under tension at room temperature. Phys. Rev. Lett. 2013, 111, 1–5. [Google Scholar] [CrossRef] [PubMed]
  13. Takayama, S. Work-hardening and susceptibility to plastic flow in metallic glasses (rolling deformation). J. Mater. Sci. 1981, 16, 2411–2418. [Google Scholar] [CrossRef]
  14. Wang, Y.; Li, M.; Xu, J. Toughen and harden metallic glass through designing statistical heterogeneity. Scr. Mater. 2016, 113, 10–13. [Google Scholar] [CrossRef]
  15. Ross, P.; Küchemann, S.; Derlet, P.M.; Yu, H.B.; Arnold, W.; Liaw, P.; Samwer, K.; Maaß, R. Linking macroscopic rejuvenation to nano-elastic fluctuations in a metallic glass. Acta Mater. 2017, 138, 111–118. [Google Scholar] [CrossRef]
  16. Hassani, M.; Lagogianni, A.E.; Varnik, F. Probing the degree of heterogeneity within a shear band of a model glass. Phys. Rev. Lett. 2019, 123, 195502. [Google Scholar] [CrossRef] [Green Version]
  17. Binkowski, I.; Schlottbom, S.; Leuthold, J.; Ostendorp, S.; Divinski, S.V.; Wilde, G. Sub-micron strain analysis of local stick-slip motion of individual shear bands in a bulk metallic glass. Appl. Phys. Lett. 2015, 107, 221909. [Google Scholar] [CrossRef] [Green Version]
  18. Rösner, H.; Peterlechner, M.; Kübel, C.; Schmidt, V.; Wilde, G. Density changes in shear bands of a metallic glass determined by correlative analytical transmission electron microscopy. Ultramicroscopy 2014, 142, 1–9. [Google Scholar] [CrossRef]
  19. Zhao, Y.; Zhang, G.; Estévez, D.; Chang, C.; Wang, X. Evolution of shear bands into cracks in metallic glasses. J. Alloys Compd. 2015, 621, 238–243. [Google Scholar] [CrossRef]
  20. Hufnagel, T.C.; Schuh, C.A.; Falk, M.L. Deformation of metallic glasses: Recent developments in theory, simulations, and experiments. Acta Mater. 2016, 109, 375–393. [Google Scholar] [CrossRef] [Green Version]
  21. Dahmen, K.A.; Ben-Zion, Y.; Uhl, J.T. A simple analytic theory for the statistics of avalanches in sheared granular materials. Nat. Phys. 2011, 7, 554–557. [Google Scholar] [CrossRef] [Green Version]
  22. Takeuchi, S.; Edagawa, K. Atomistic simulation and modeling of localized shear deformation in metallic glasses. Prog. Mater. Sci. 2011, 56, 785–816. [Google Scholar] [CrossRef]
  23. Shi, L.T. Dislocation-like defects in an amorphous Lennard-Jones solid. Mater. Sci. Eng. 1986, 81, 509–514. [Google Scholar] [CrossRef]
  24. Spaepen, F. A microscopic mechanism for steady state inhomogeneous flow in metallic glasses. Acta Metall. 1976, 25, 407–415. [Google Scholar] [CrossRef]
  25. Shrivastav, G.P.; Chaudhuri, P.; Horbach, J. Yielding of glass under shear: A directed percolation transition precedes shear-band formation. Phys. Rev. E 2016, 94, 1–10. [Google Scholar] [CrossRef] [Green Version]
  26. Vinogradov, A.; Seleznev, M.; Yasnikov, I.S. Dislocation characteristics of shear bands in metallic glasses. Scr. Mater. 2017, 130, 138–142. [Google Scholar] [CrossRef]
  27. Qu, R.T.; Liu, Z.Q.; Wang, G.; Zhang, Z.F. Progressive shear band propagation in metallic glasses under compression. Acta Mater. 2015, 91, 19–33. [Google Scholar] [CrossRef]
  28. Xu, Y.; Shi, B.; Ma, Z.; Li, J. Evolution of shear bands, free volume, and structure in room temperature rolled Pd40Ni40P20 bulk metallic glass. Mater. Sci. Eng. A 2015, 623, 145–152. [Google Scholar] [CrossRef]
  29. Huo, L.S.; Wang, J.Q.; Huo, J.T.; Zhao, Y.Y.; Men, H.; Chang, C.T.; Wang, X.M.; Li, R.W. Interactions of Shear Bands in a Ductile Metallic Glass. J. Iron Steel Res. Int. 2016, 23, 48–52. [Google Scholar] [CrossRef]
  30. Kovács, Z.; Schafler, E.; Szommer, P.; Révész, Á. Localization of plastic deformation along shear bands in Vitreloy bulk metallic glass during high pressure torsion. J. Alloys Compd. 2014, 593, 207–212. [Google Scholar] [CrossRef]
  31. Bouzakher, B.; Benameur, T.; Yavari, A.R.; Sidhom, H. In situ characterization of a crack trajectory and shear bands interaction in metallic glasses. J. Alloys Compd. 2007, 434–435, 52–55. [Google Scholar] [CrossRef]
  32. Haag, F.; Beitelschmidt, D.; Eckert, J.; Durst, K. Influences of residual stresses on the serrated flow in bulk metallic glass under elastostatic four-point bending—A nanoindentation and atomic force microscopy study. Acta Mater. 2014, 70, 188–197. [Google Scholar] [CrossRef]
  33. Merson, E.; Danilov, V.; Merson, D.; Vinogradov, A. Confocal laser scanning microscopy: The technique for quantitative fractographic analysis. Eng. Fract. Mech. 2017, 183, 147–158. [Google Scholar] [CrossRef]
  34. Huang, H.; Yan, J. Investigating shear band interaction in metallic glasses by adjacent nanoindentation. Mater. Sci. Eng. A 2017, 704, 375–385. [Google Scholar] [CrossRef]
  35. Nollmann, N.; Binkowski, I.; Schmidt, V.; Rösner, H.; Wilde, G. Impact of micro-alloying on the plasticity of Pd-based Bulk Metallic Glasses. Scr. Mater. 2015, 111, 119–122. [Google Scholar] [CrossRef] [Green Version]
  36. Li, H.F.; Zheng, Y.F.; Xu, F.; Jiang, J.Z. In vitro investigation of novel Ni free Zr-based bulk metallic glasses as potential biomaterials. Mater. Lett. 2012, 75, 74–76. [Google Scholar] [CrossRef]
  37. Vinogradov, A.; Danyuk, A.; Khonik, V.A. Localized and homogeneous plastic flow in bulk glassy Pd40Cu30Ni10P20: An acoustic emission study. J. Appl. Phys. 2013, 113, 153503. [Google Scholar] [CrossRef]
  38. Seleznev, M.; Vinogradov, A. Note: High-speed optical imaging powered by acoustic emission triggering. Rev. Sci. Instrum. 2014, 85, 076103. [Google Scholar] [CrossRef]
  39. Hirth, J.P.; Lothe, J. Theory of Dislocations, 2nd ed.; Wiley: New York, NY, USA, 1982. [Google Scholar]
  40. Volterra, V. On the equilibrum of multiply-connected elastic bodies. Ann. Sci. Éc. Norm. Supér.. 1907, 24, 401–517. [Google Scholar] [CrossRef] [Green Version]
  41. Zolotukhin, I.V.; Belyavskii, V.I.; Khonik, V.A.; Ryabtseva, T.N. Internal friction in cold-rolled metallic glasses Cu50Ti50 and Ni78Si8B14. Phys. Status Solidi Appl. Res. 1989, 116, 255–265. [Google Scholar] [CrossRef]
  42. Khonik, V.A.; Spivak, L.V. On the nature of low temperature internal friction peaks in metallic glasses. Acta Mater. 1996, 44, 367–381. [Google Scholar] [CrossRef]
  43. Khonik, V.A. Dislocation-like relaxations in cold deformed metallic glasses. J. Alloys Compd. 1994, 211–212, 114–117. [Google Scholar] [CrossRef]
  44. Liu, C.; Roddatis, V.; Kenesei, P.; Maaß, R. Shear-band thickness and shear-band cavities in a Zr-based metallic glass. Acta Mater. 2017, 140, 206–216. [Google Scholar] [CrossRef]
  45. Clouet, E.; Ventelon, L.; Willaime, F. Dislocation core energies and core fields from first principles. Phys. Rev. Lett. 2009, 102, 055502. [Google Scholar] [CrossRef] [Green Version]
  46. Liu, Y.H.; Wang, G.; Pan, M.X.; Yu, P.; Zhao, D.Q.; Wang, W.H. Deformation behaviors and mechanism of Ni-Co-Nb-Ta bulk metallic glasses with high strength and plasticity. J. Mater. Res. 2007, 22, 869–875. [Google Scholar] [CrossRef]
  47. Laureys, A.; Depover, T.; Petrov, R.; Verbeken, K. Influence of sample geometry and microstructure on the hydrogen induced cracking characteristics under uniaxial load. Mater. Sci. Eng. A 2017, 690, 88–95. [Google Scholar] [CrossRef]
  48. Wang, X.D.; Qu, R.T.; Liu, Z.Q.; Zhang, Z.F. Evolution of shear-band cracking in metallic glass under cyclic compression. Mater. Sci. Eng. A 2017, 696, 267–272. [Google Scholar] [CrossRef]
  49. Gilman, J.J. Flow via dislocations in ideal glasses. J. Appl. Phys. 1973, 44, 675–679. [Google Scholar] [CrossRef]
  50. Xie, S.; George, E.P. Hardness and shear band evolution in bulk metallic glasses after plastic deformation and annealing. Acta Mater. 2008, 56, 5202–5213. [Google Scholar] [CrossRef]
Figure 1. Examples of type III (Left) and type II (Right) shear bands (SBs) in the amorphous Pd40Cu30Ni10P20 deformed in compression. The displacement fields Uy (a,b) and Ux (e,f) were measured experimentally (a,e) and modelled as Volterra’s screw (b) and edge (f) dislocations [26]. The σxz and σxx components were calculated for the modelled screw (c) and edge (g) dislocations, respectively. The comparison of experimental (rounds) and model (red lines) displacements as well as stresses (blue lines) is presented in (d,h) for the depicted circular paths around the SB tips. Excellent agreement can be seen between the experimental data and model predictions within a ± 20 nm band (red dash lines). The insets on (c,g) represent the schemes of used samples geometry: the red line indicates the SB with a tip surrounded by an investigated circle cross-section.
Metals 10 00374 g001
Figure 2. Typical behaviour of primarily mode II shear bands (SBs) in the compressed Pd-based bulk metallic glass (BMG). The 3D surface map (330 × 300 µm2) obtained with the scanning white-light interferometry (SWLI) technique (a) shows three SBs (#1, #2, #3) and their topology features. The site of the collision of SB #1 and SB #3 is shown on the inset (a) and obtained with scanning electron microscopy (SEM) (b) for comparison. Shear steps No. 1 to 7 heights, measured by SWLI and pointed on (a) are represented on the bar chart (c). The slope map reveals the breaks in the fine scratch (marked with red arrows) by witnessing the mode II shear (d).
Metals 10 00374 g002
Figure 3. The typical behaviour of the mode III shear band (SB) in the compressed Pd-based bulk metallic glass (BMG) specimen. The 3D surface map obtained with the scanning white-light interferometry (SWLI) technique (a) shows a segmented nature of a mode III shear (275 µm length). The slope map reveals fine scratches (marked by red arrows) extending through SBs and showing the absence of a mode II shear component (b). The scanning electron microscope (SEM) image of the mode III SB shows 40° inclination to the surface (c). Shear offsets 1 to 7 measured by SWLI are represented on the bar chart (d). The schematic (e) illustrates a dislocation-based interpretation of the shear morphology formed in three consecutive steps I, II, and III, and the corresponding isometric and top views of the resulting shear. In this case, the circled arrows indicate the positions of screw dislocation lines, and the “plus”/“minus” signs indicate the tensile and compressive stress components of a macro-dislocation, respectively.
Metals 10 00374 g003
Figure 4. Fluctuations of the shear band (SB) steps on the polished surface of the Pd-based bulk metallic glass (BMG) specimen tested in compression. The 3D surface map obtained with the scanning white-light interferometry (SWLI) technique is represented as a slope map, clearly showing a wavy character of SB steps (a). A magnified view of the area in a black rectangular (a) is shown in the isometric view below (b), where colour scale represents height Z in the range of 750 nm. Profiles of the SB step in XY and XZ planes are shown qualitatively with the dashed lines (b) and quantitatively on graphs (c,d), respectively, including the shear strain introduced by shear step deviations (e).
Metals 10 00374 g004
Figure 5. The topology of the surface in the vicinity of the indenter footprint reflecting the different behaviour of shear bands (SBs) formed by the indentation of the polished surface of the Zr-based bulk metallic glass (BMG). The optical images (ad) and 3D surface maps (d,e) were obtained with the scanning white-light interferometry (SWLI) technique. The shear bands form regular arc-shaped steps when indentation is performed on a “fresh” non-deformed surface (marked as “1” on (ac,f)). Indenting the area near the previous indents forms the shear bands deviated from arc-shape (marked as “2” on (af)). The scale bar refers to 50 µm on (ac,f). 3D surfaces of images on (a) and (b) are coloured according to the height magnitude (d,e). The schematics of SB deflection due to the stress field gradient observed in (f) is shown in the subfigure (g).
Metals 10 00374 g005

