Droplet Formation and Dripping Behavior during the Electroslag Remelting Process with Two Series-Connected Electrodes

Abstract
1. Introduction
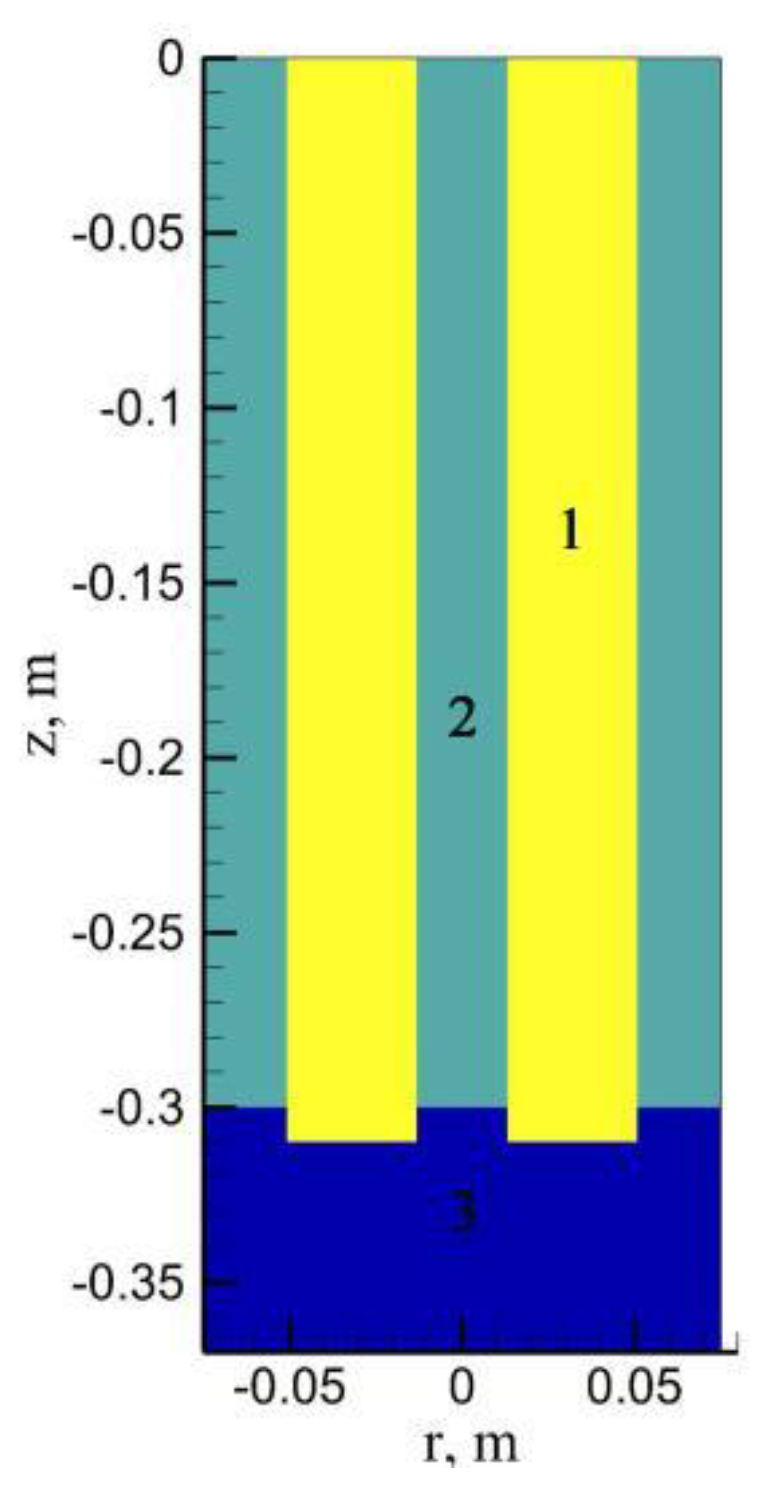
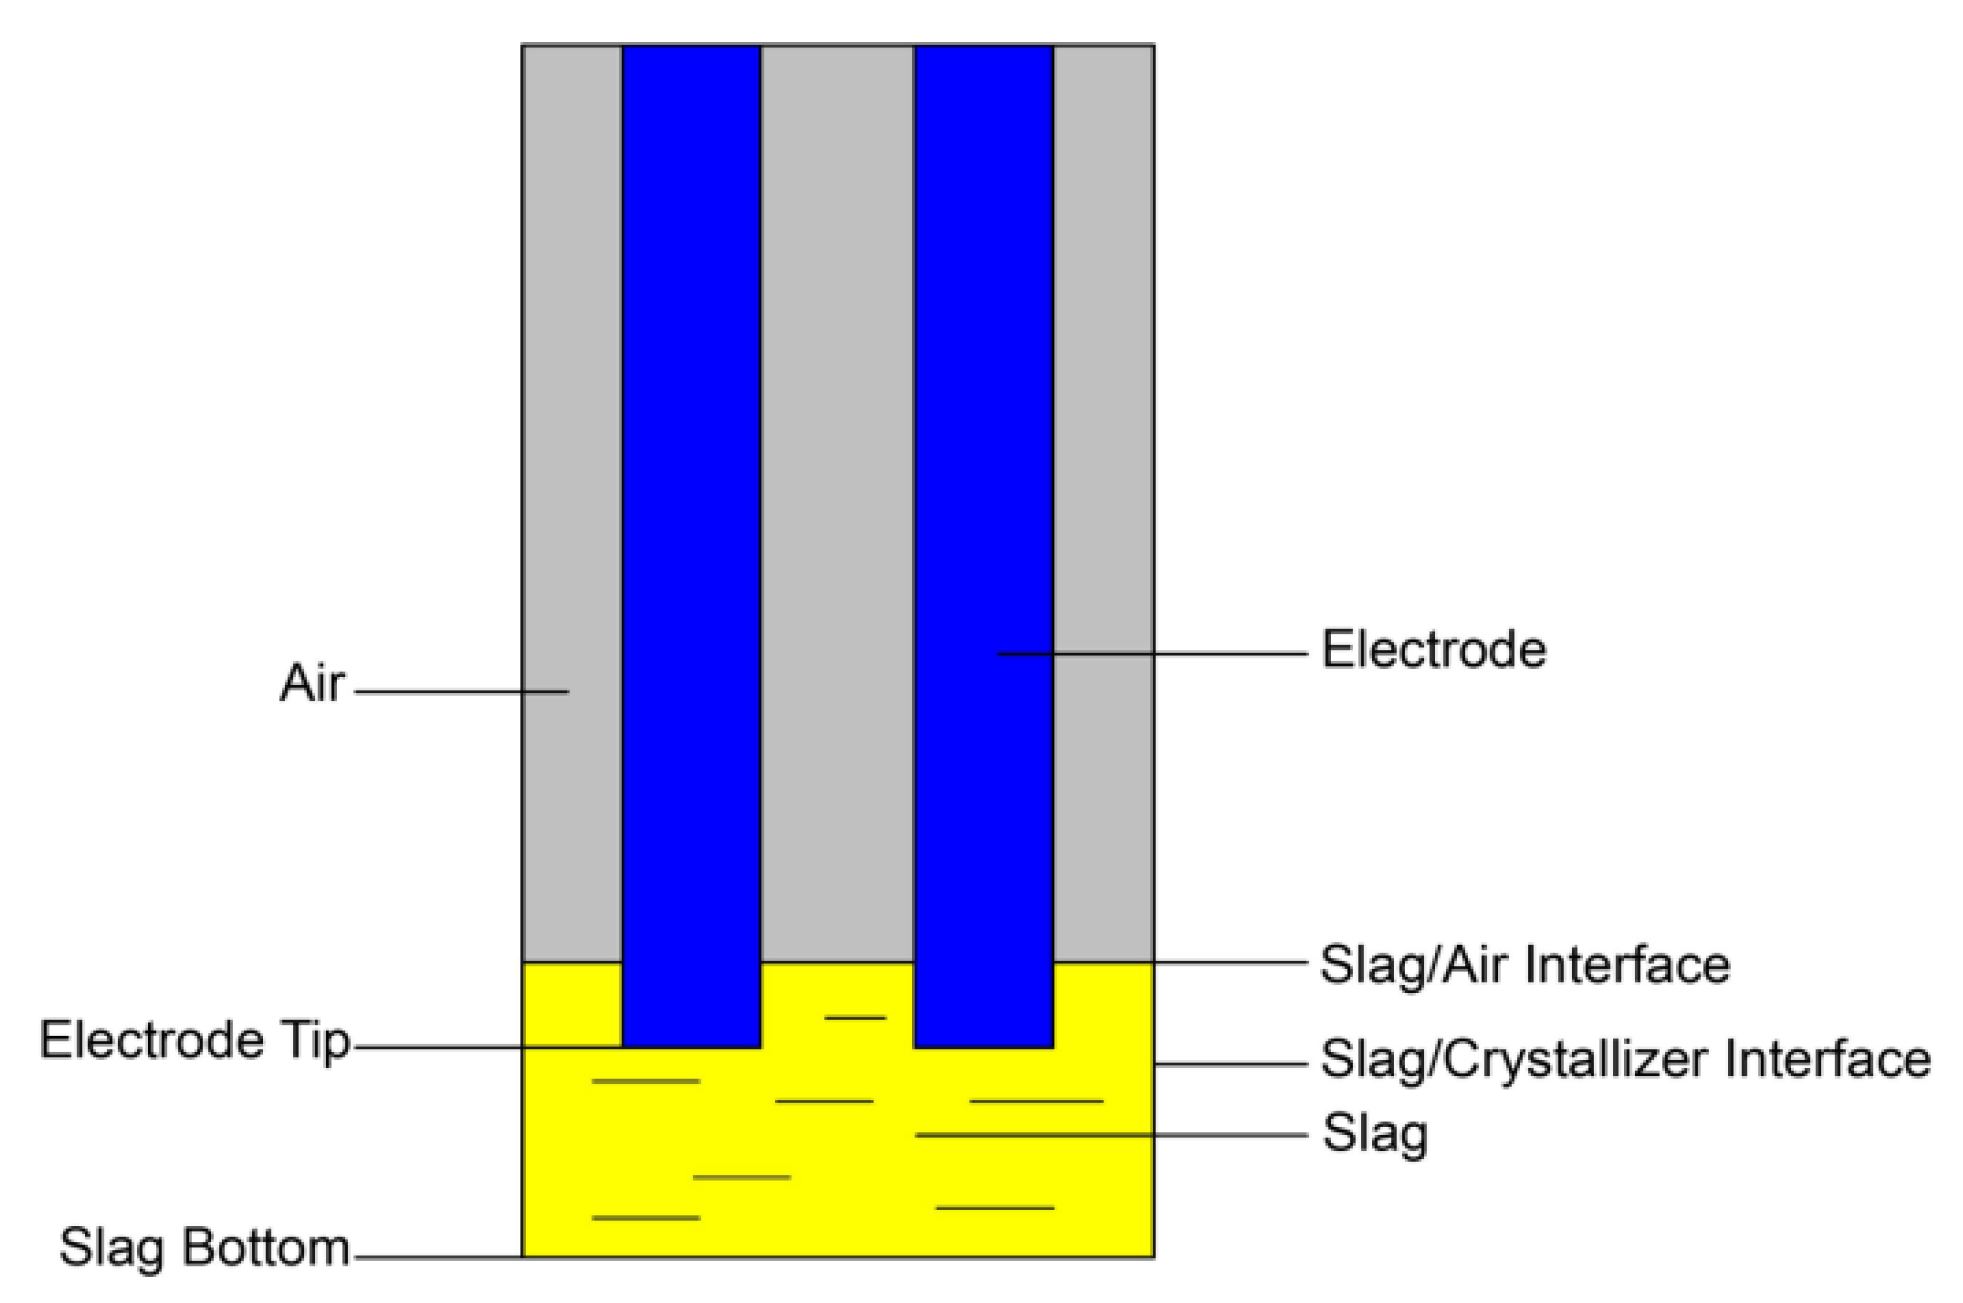
2. Numerical Model
2.1. Mathematical Modeling
2.1.1. Electromagnetic Field Control Equation
2.1.2. Fluid Control Equation
2.1.3. Multiphase Flow
2.1.4. Governing Equation for Droplet
2.1.5. Boundary Condition
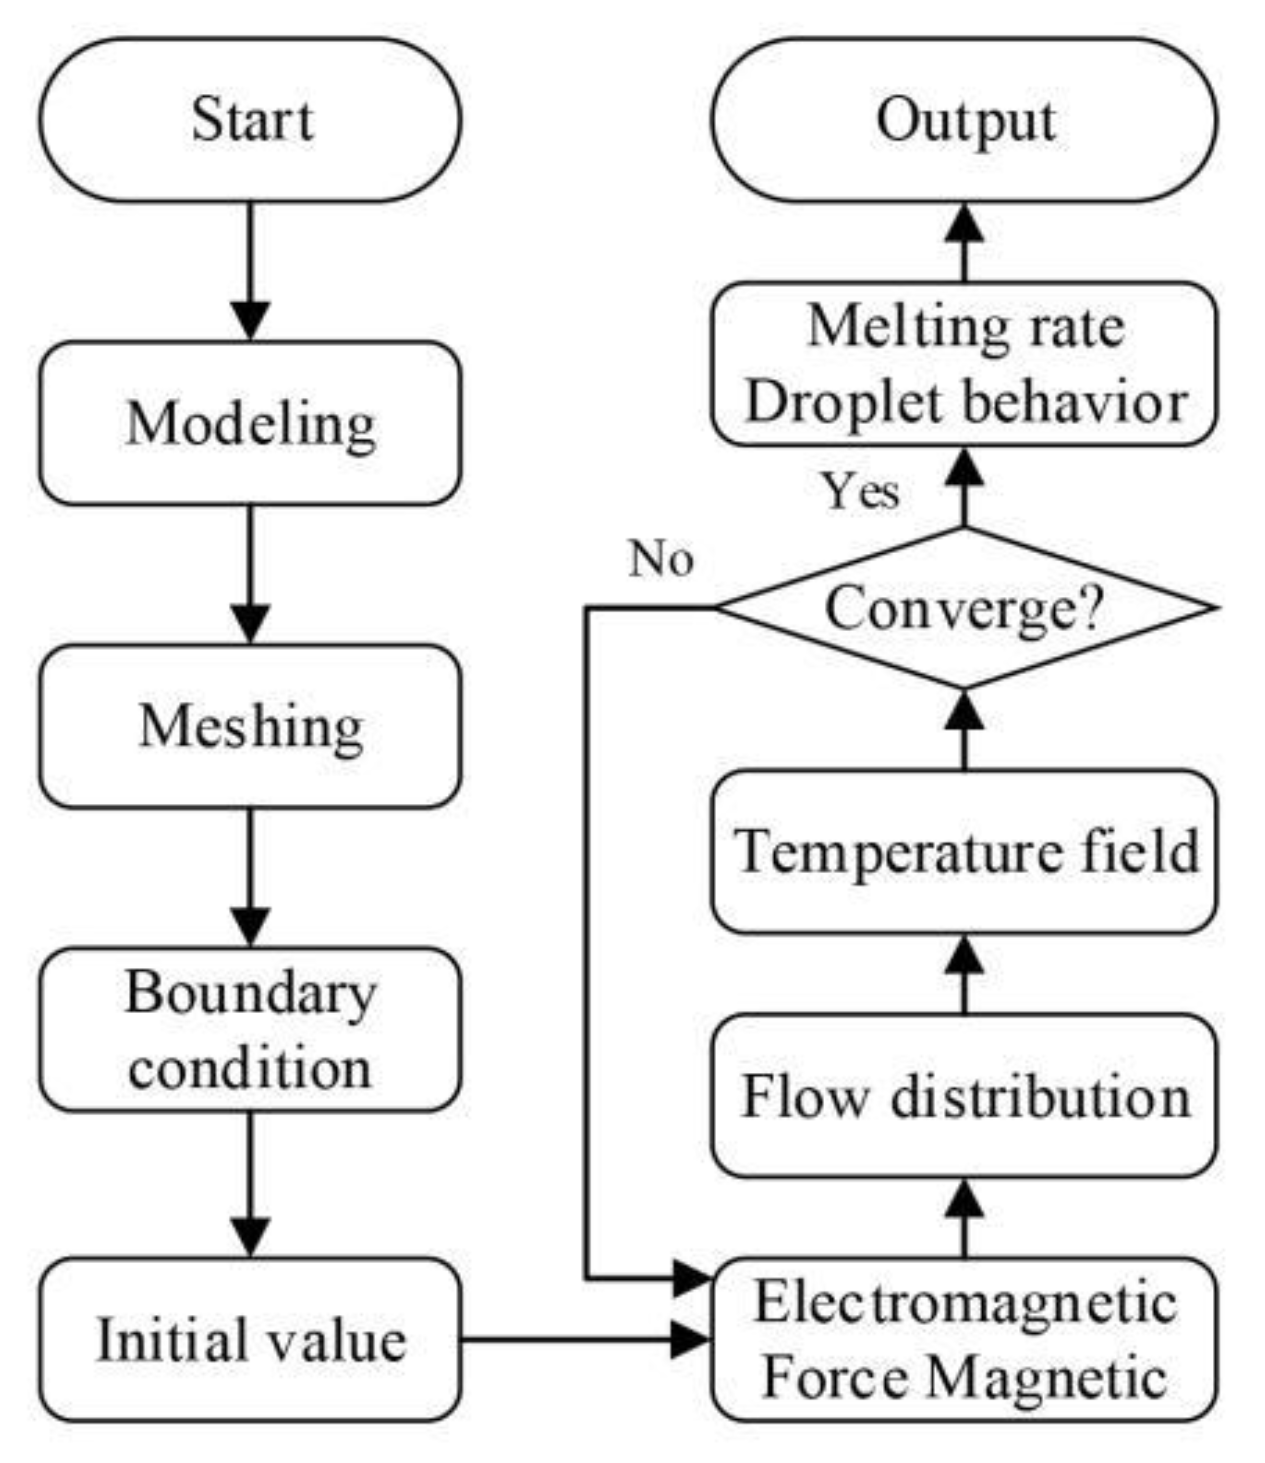
2.1.6. Calculation Strategy
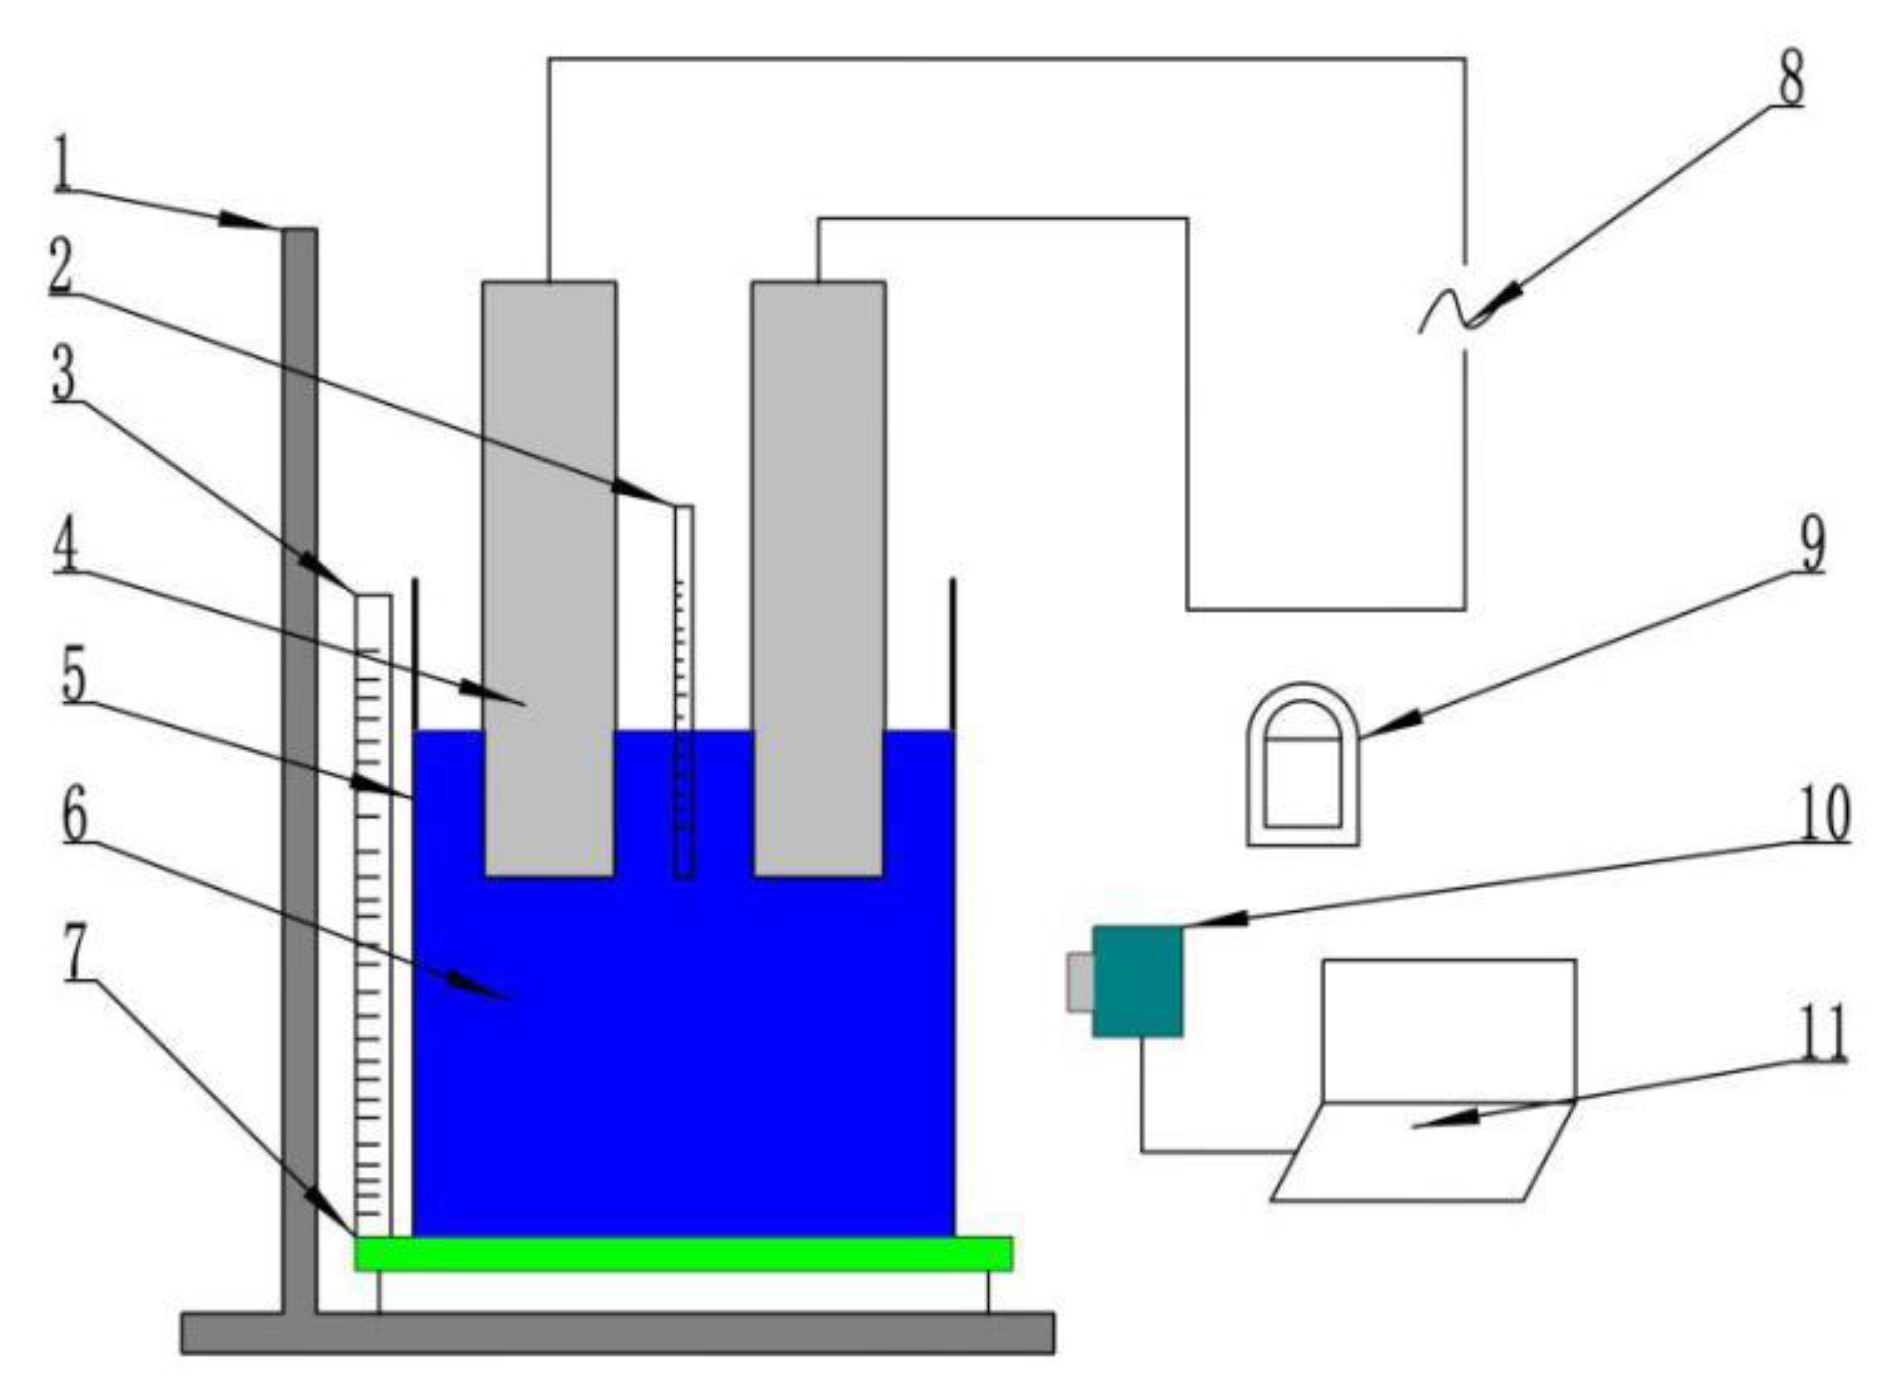
3. Experimental Setup
4. Results and Discussion
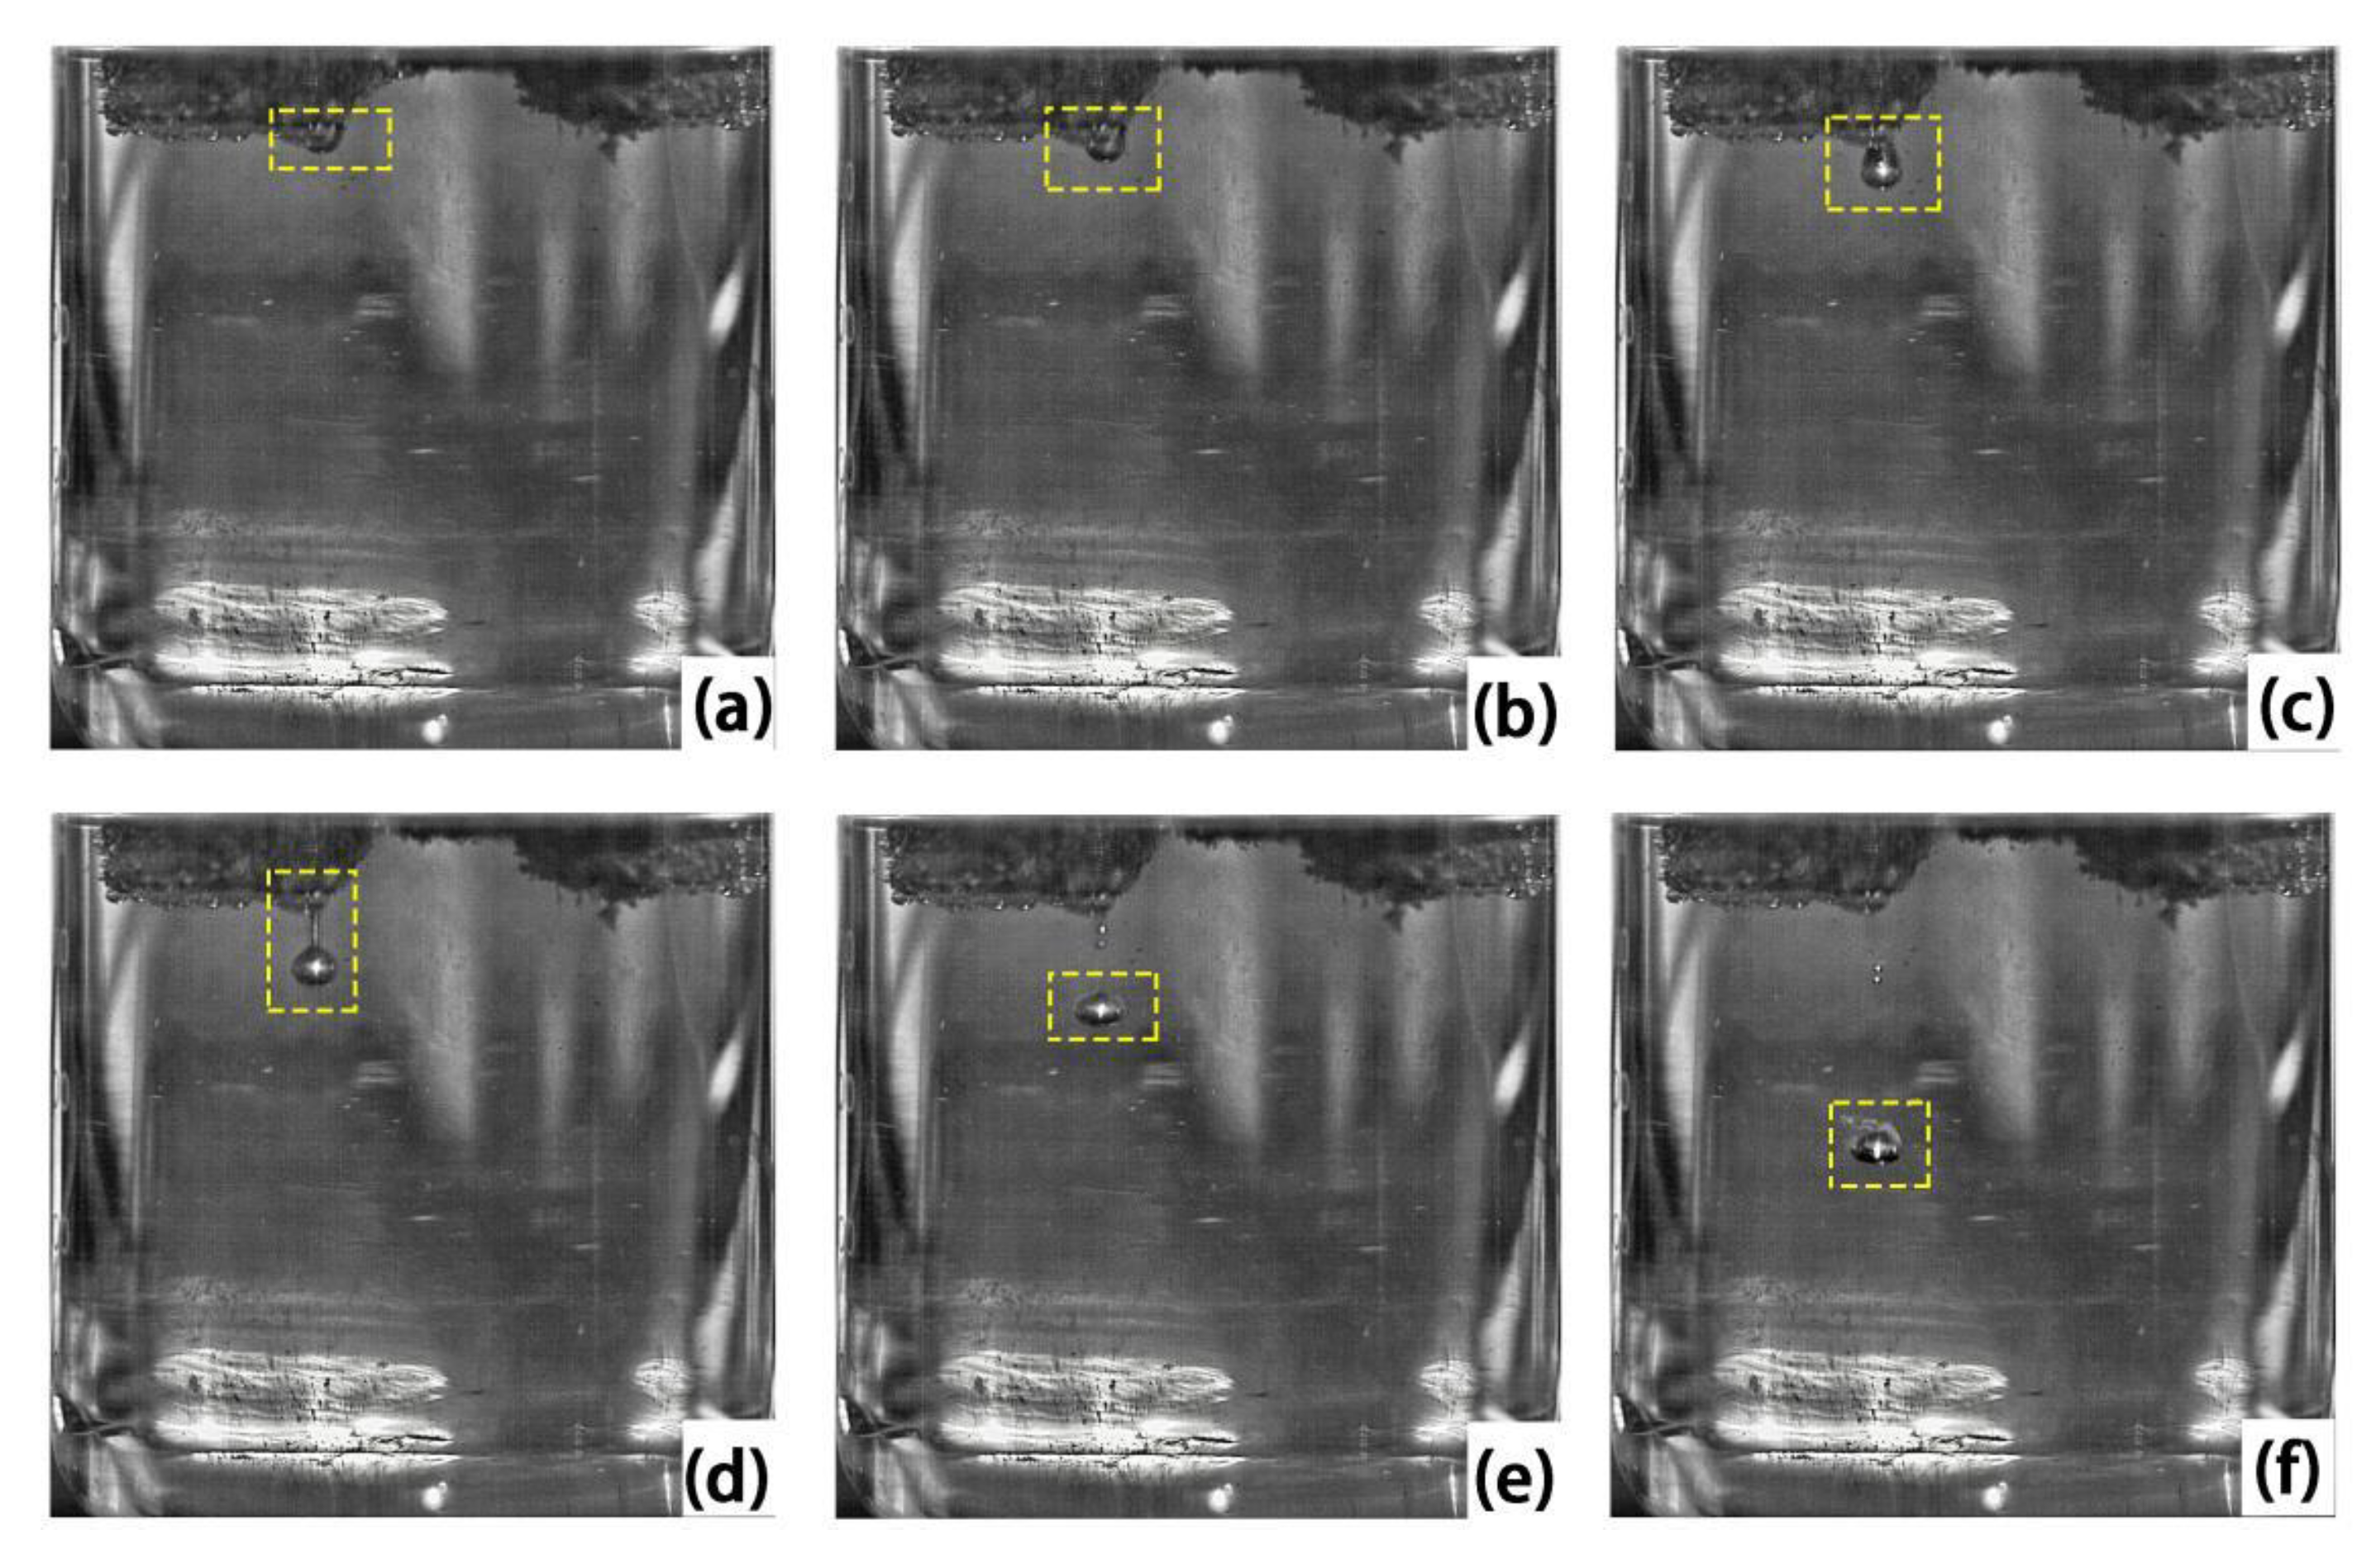
4.1. Validation of Mathematical Model
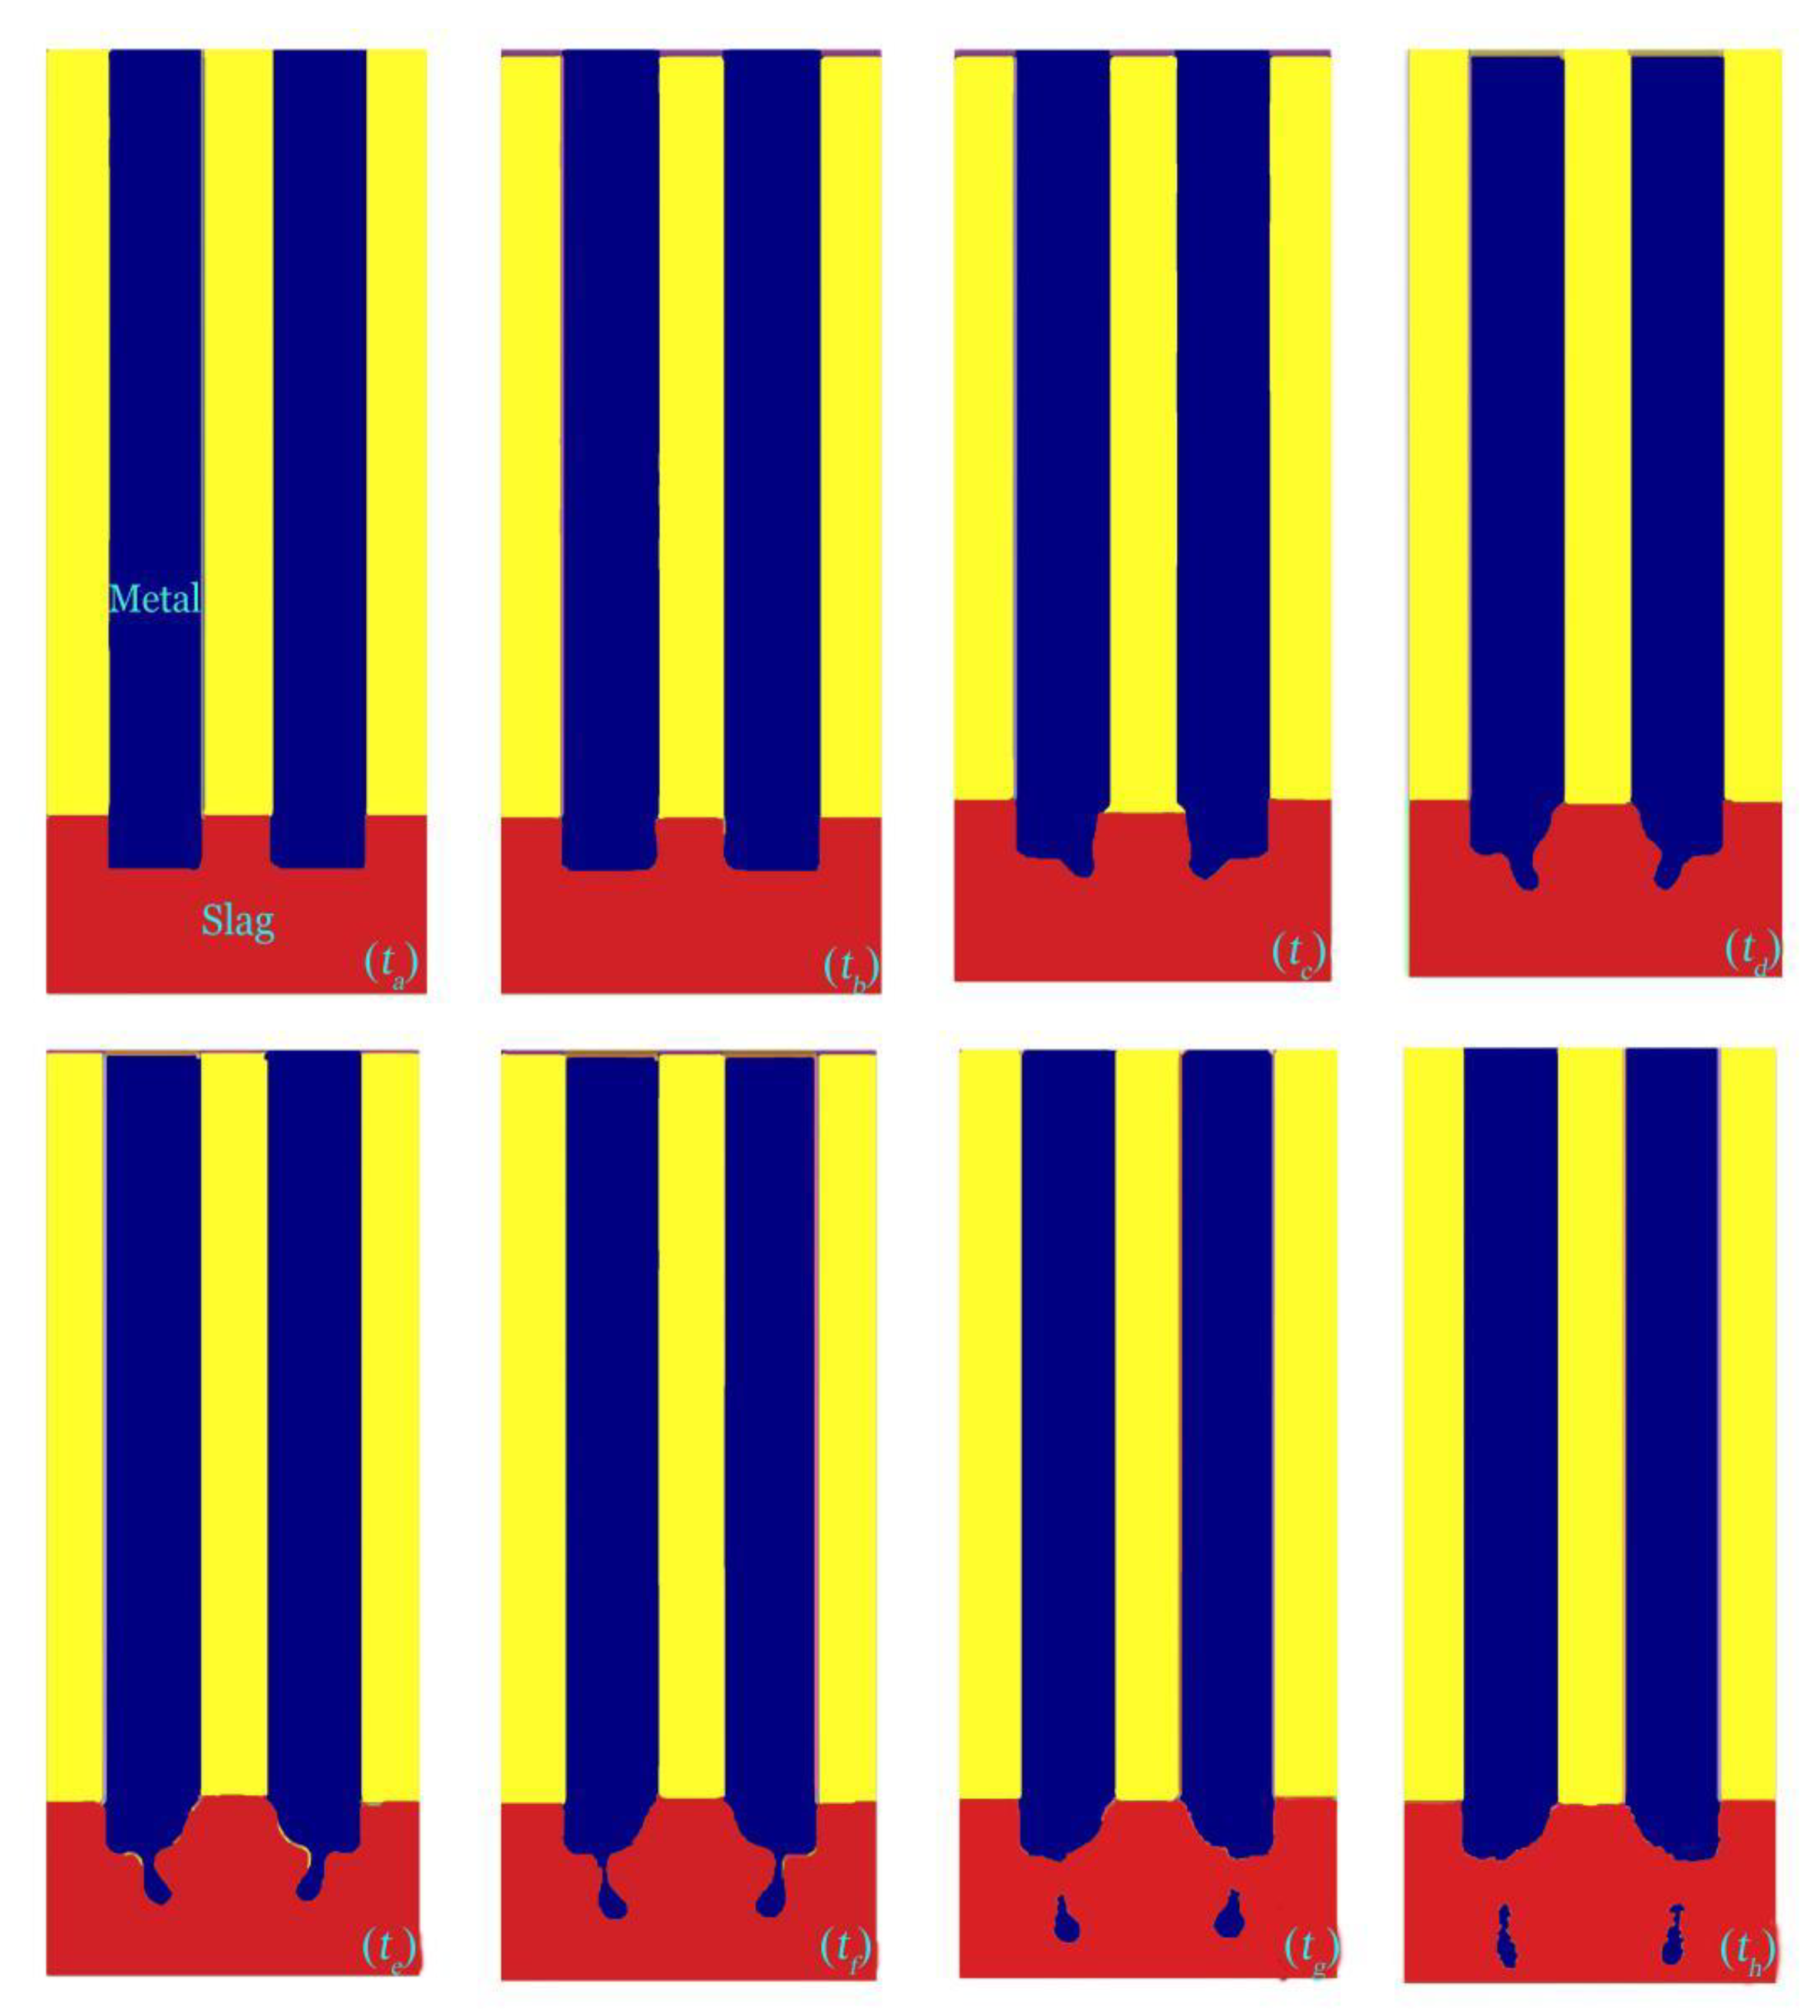
4.2. Droplet Formation and Dripping Process
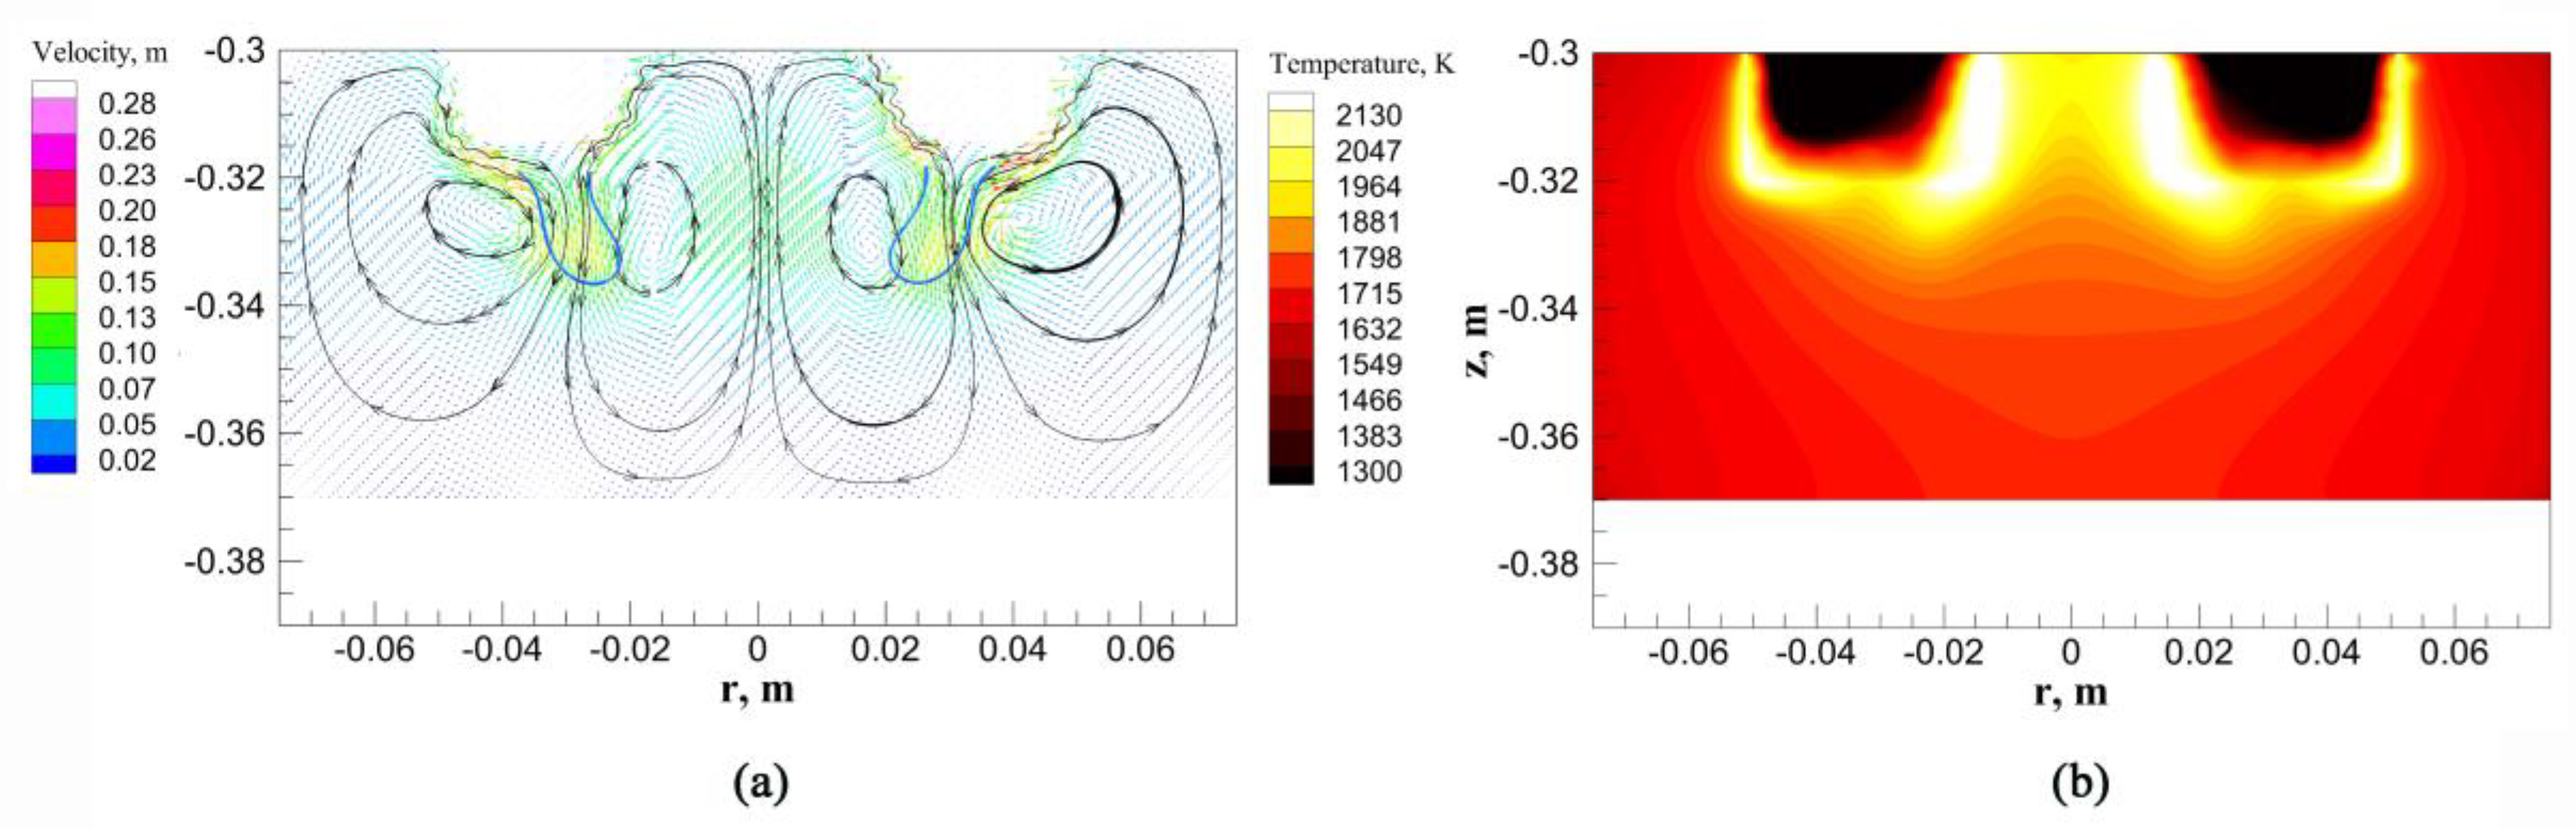
4.3. Velocity Field and Temperature Field
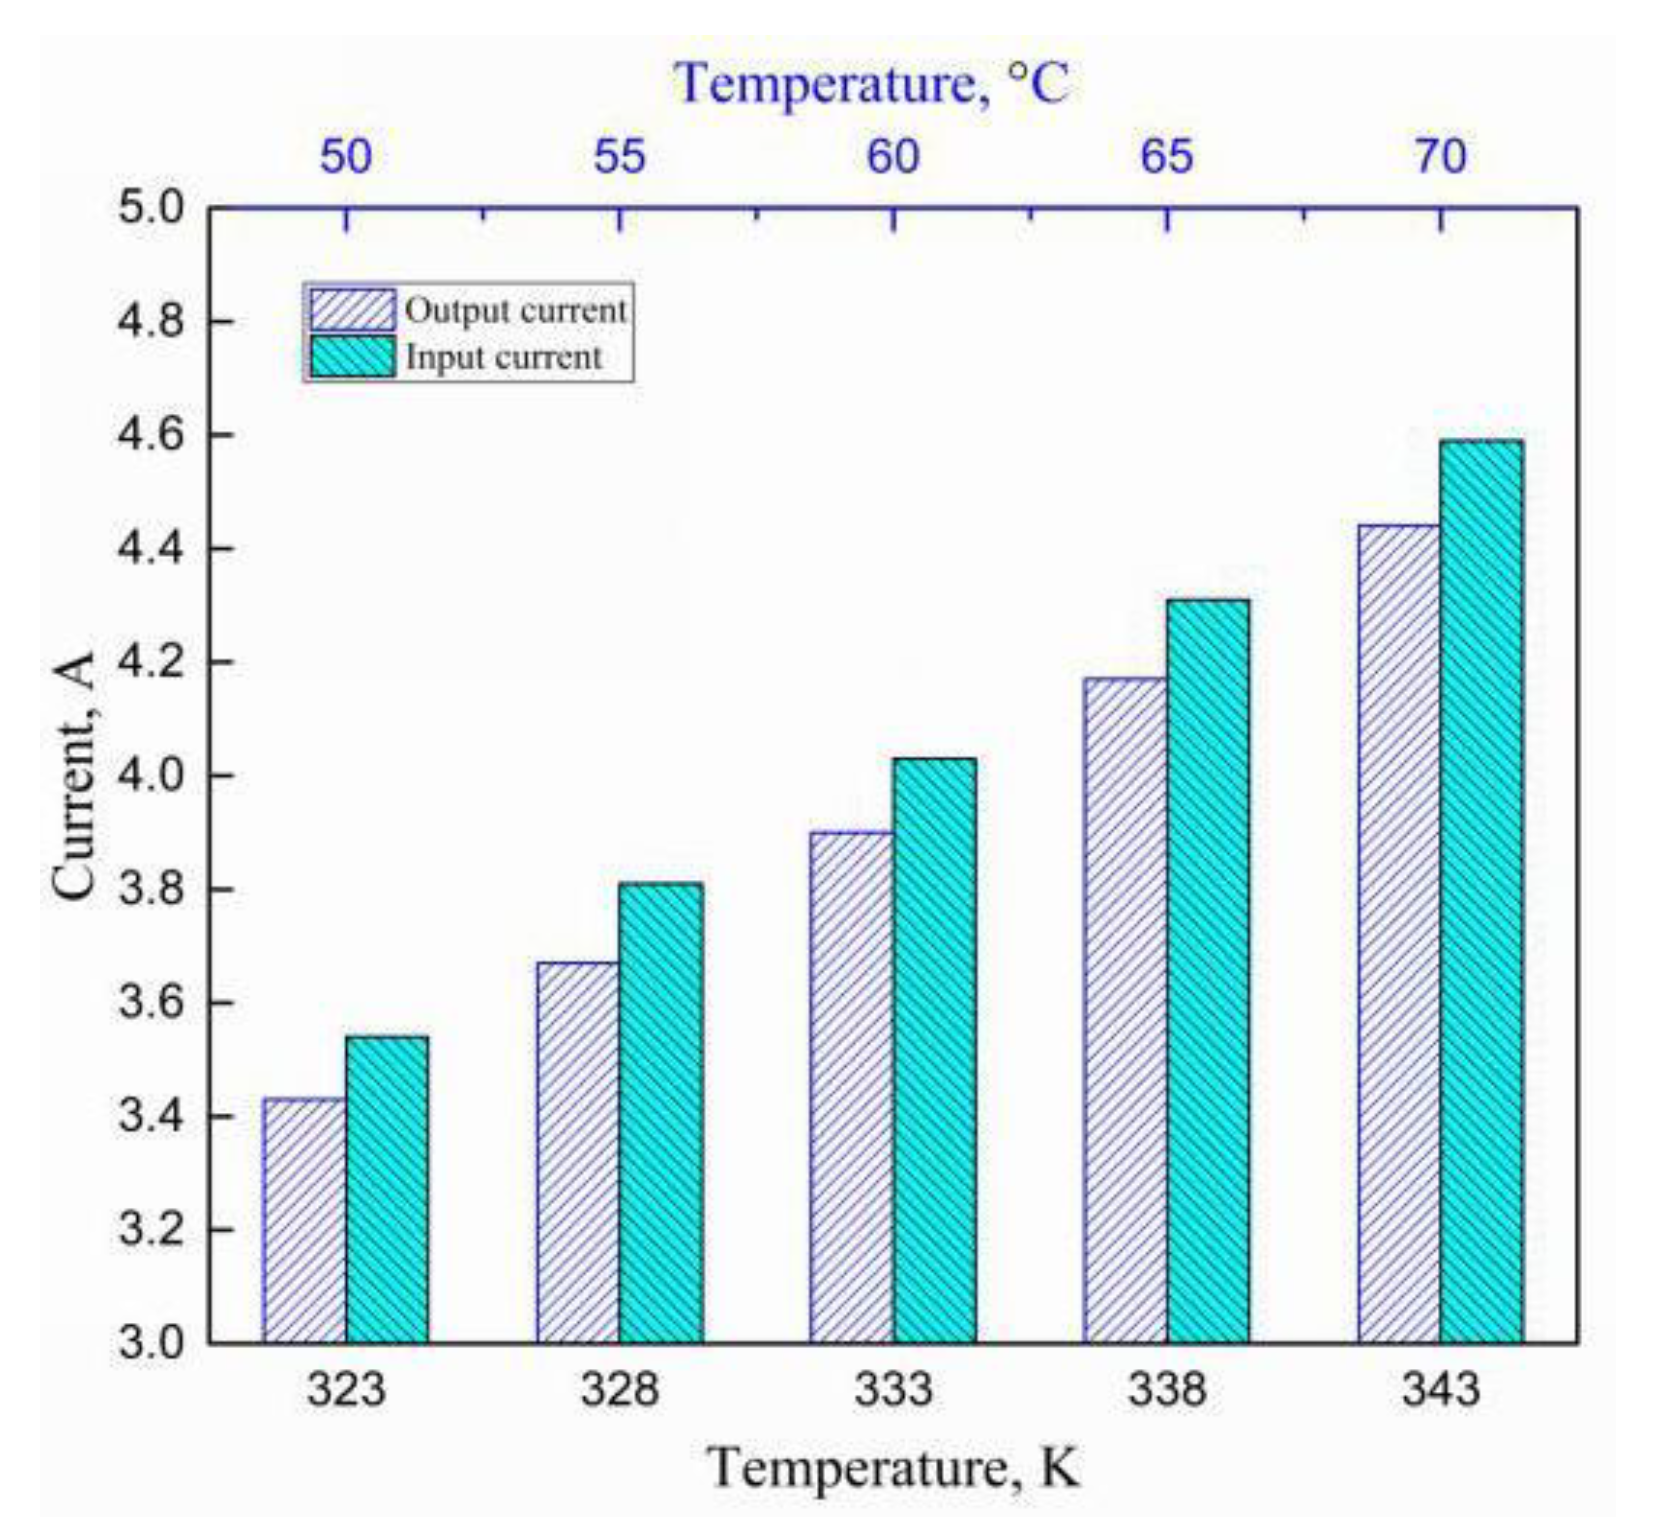
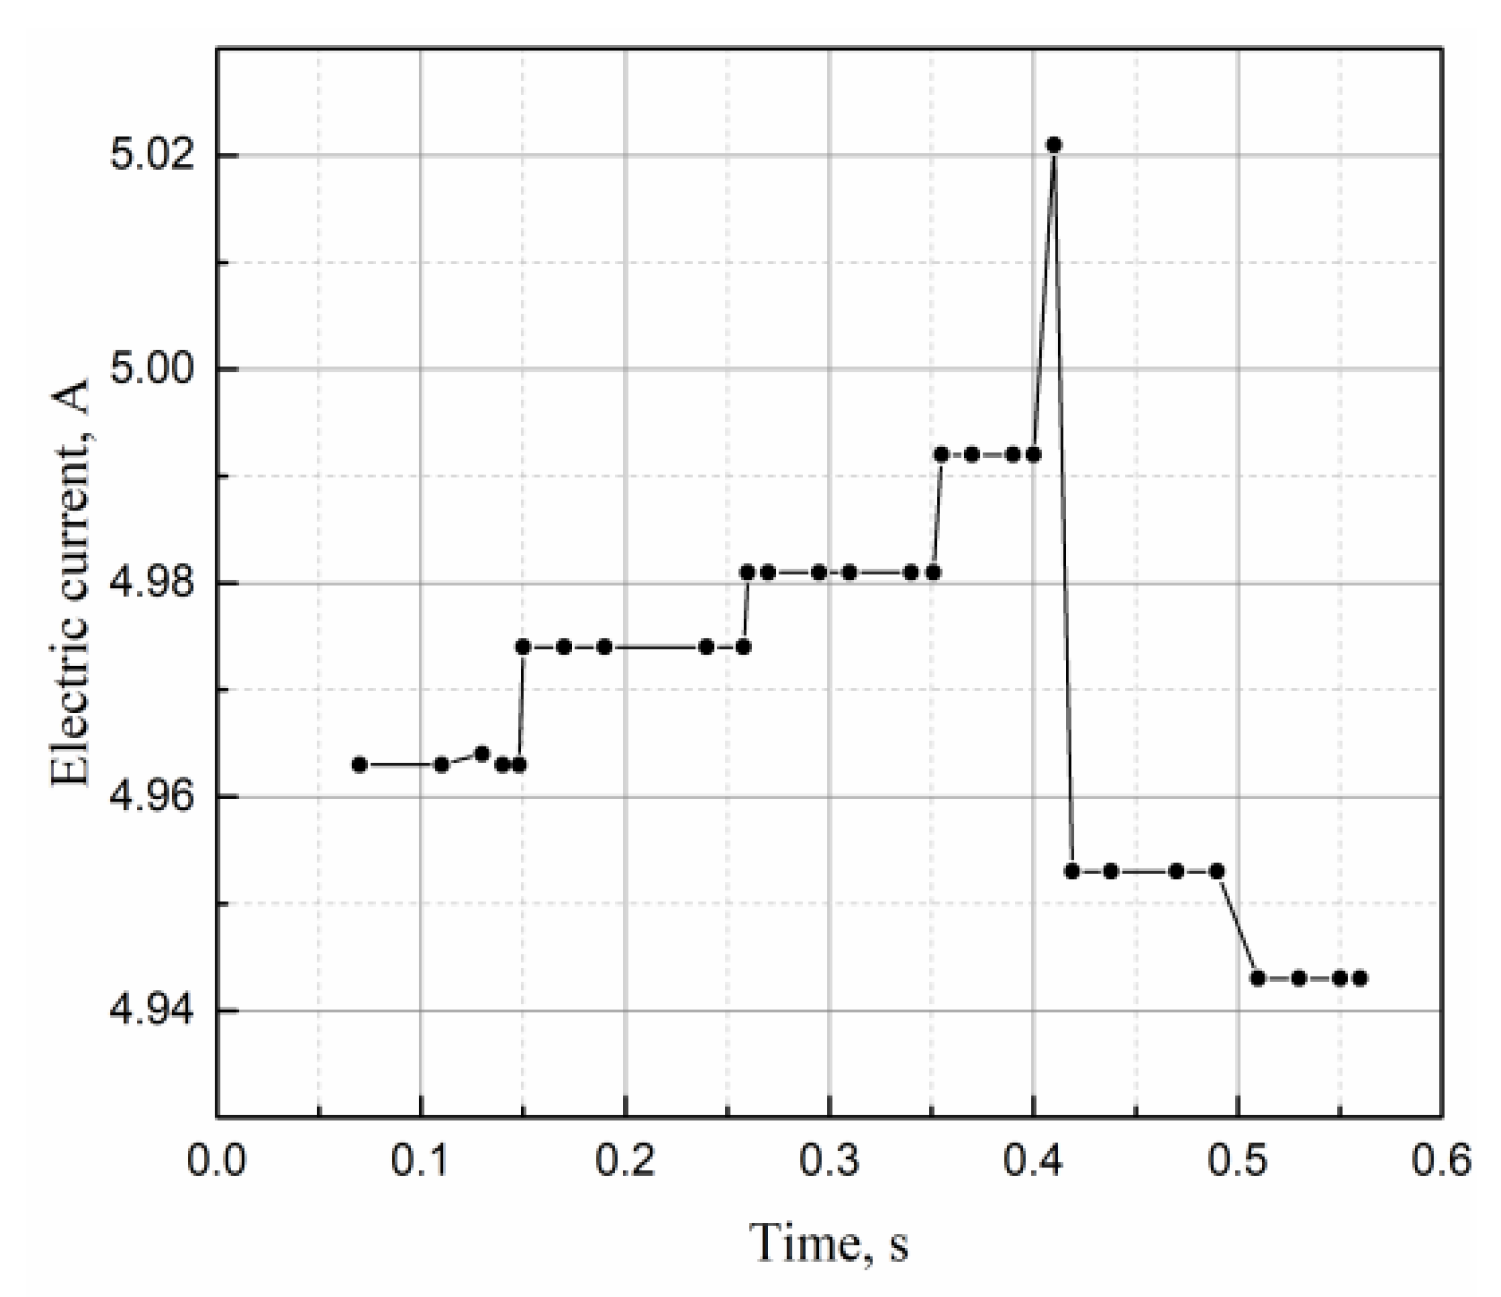
4.4. Variation of Electrical Parameters
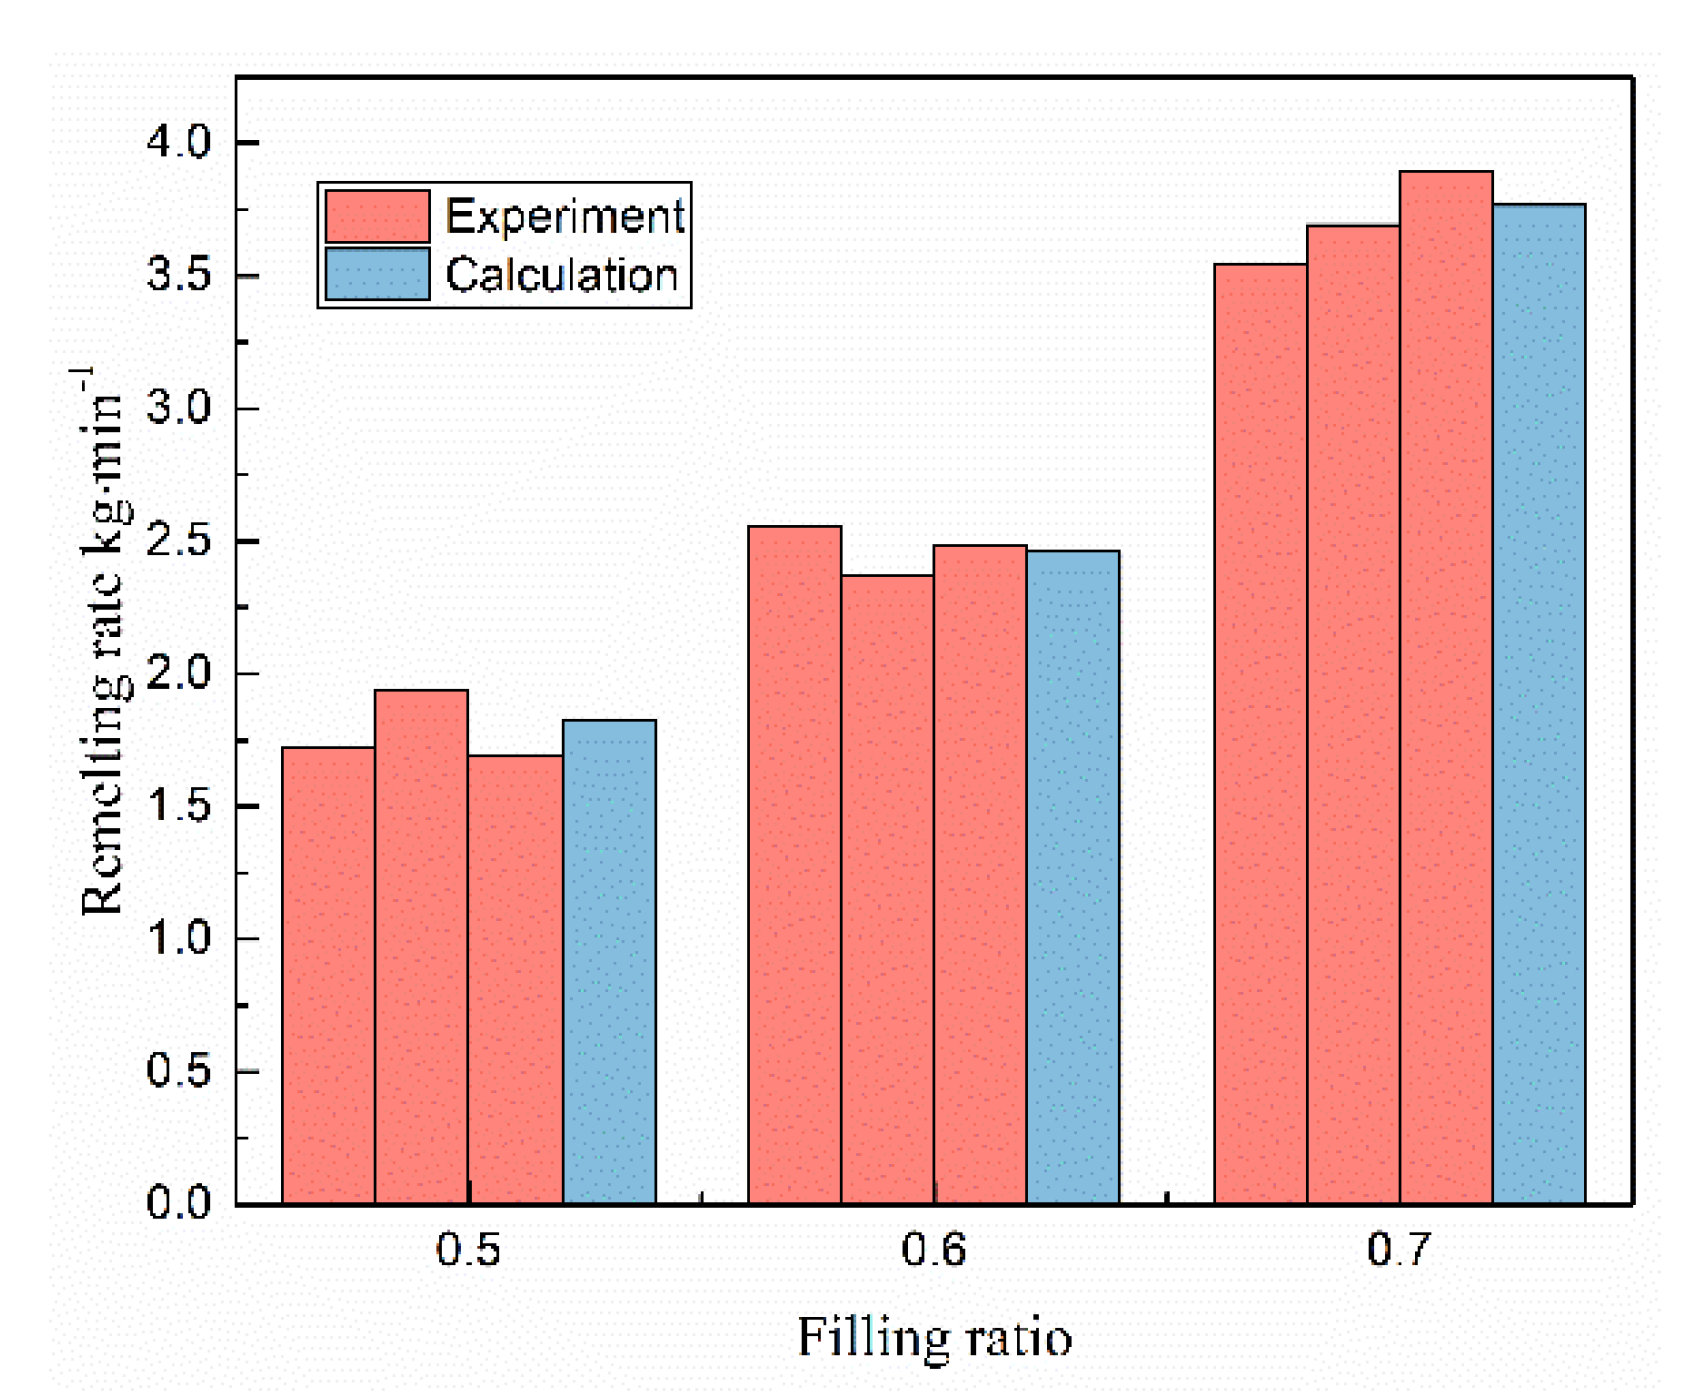
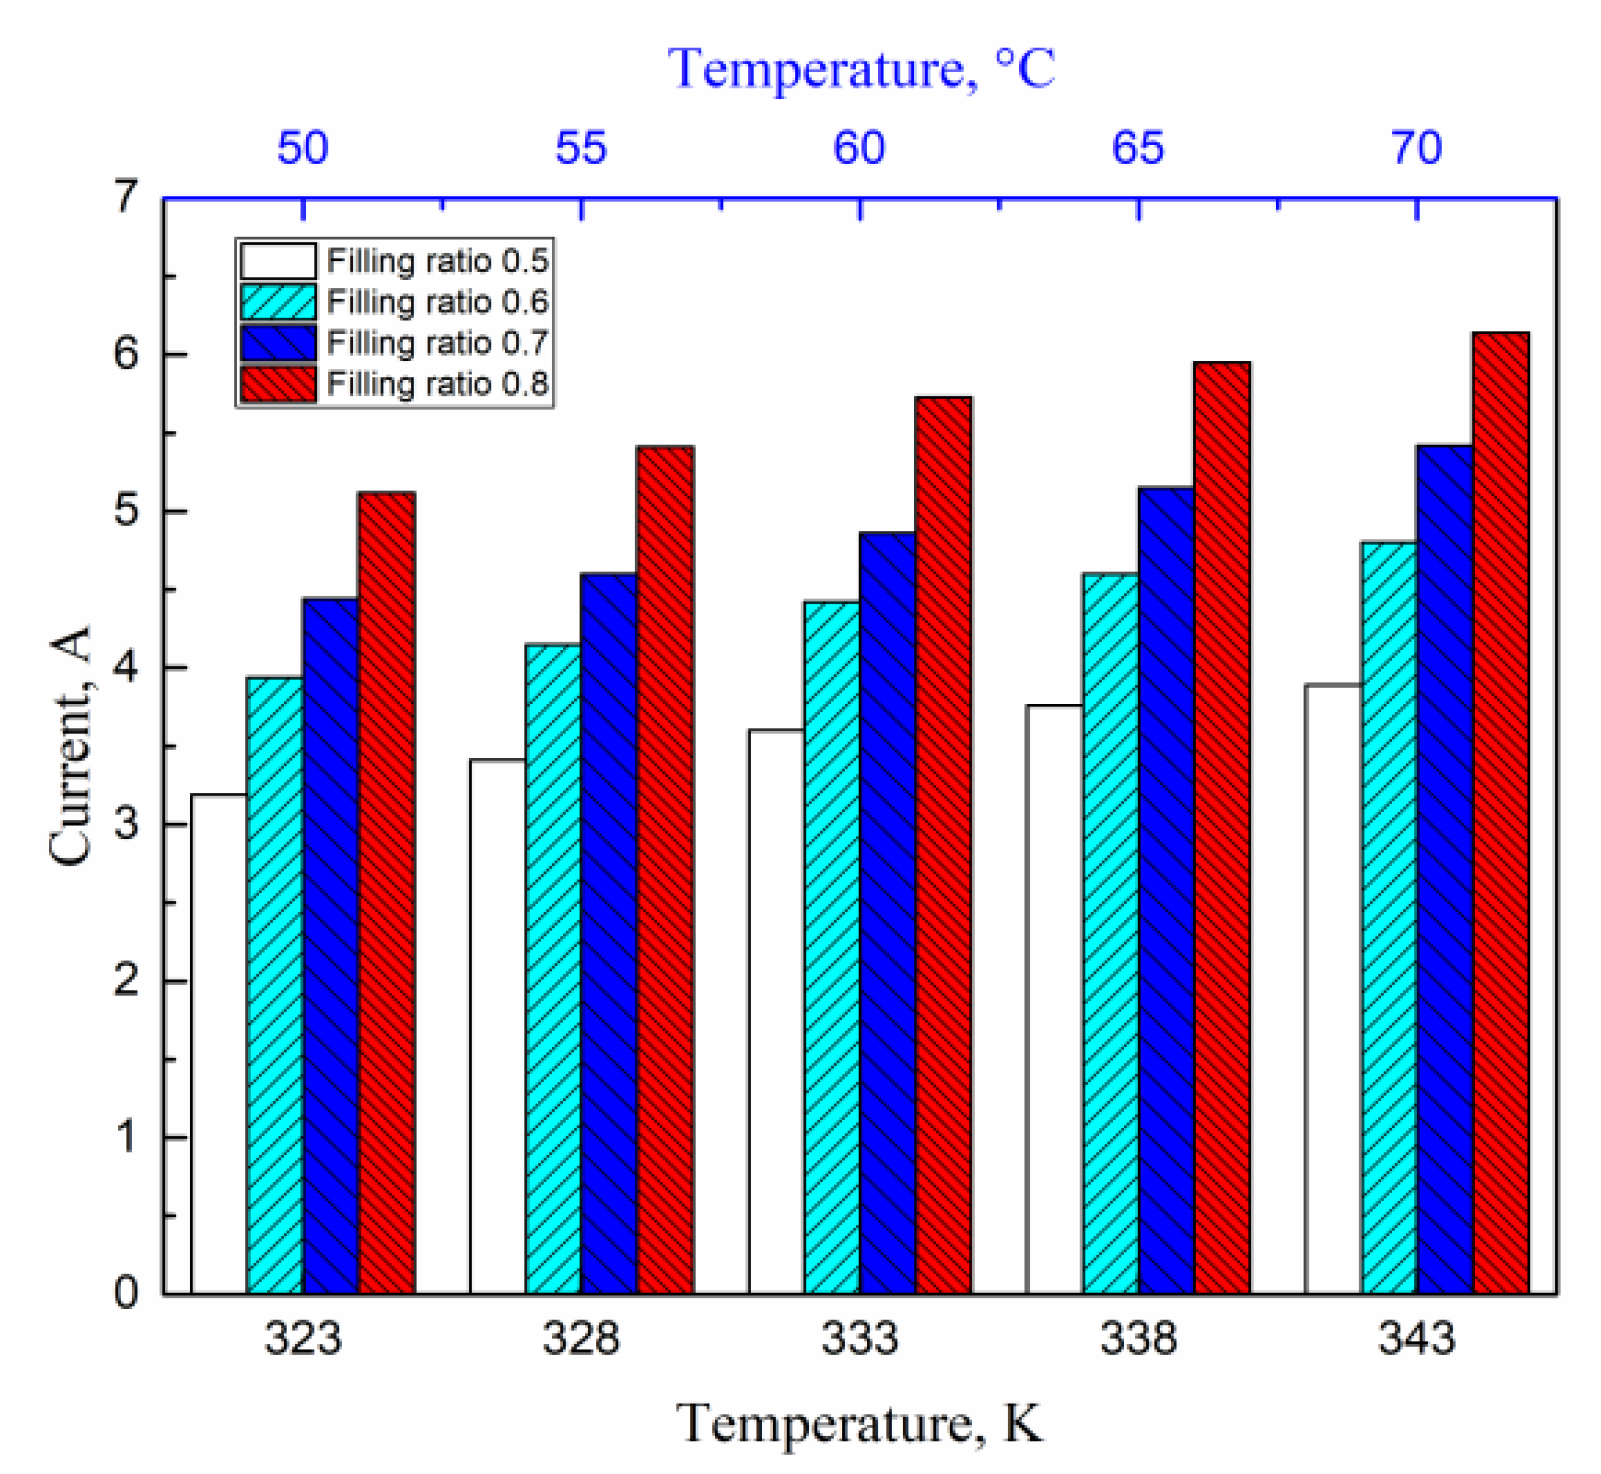
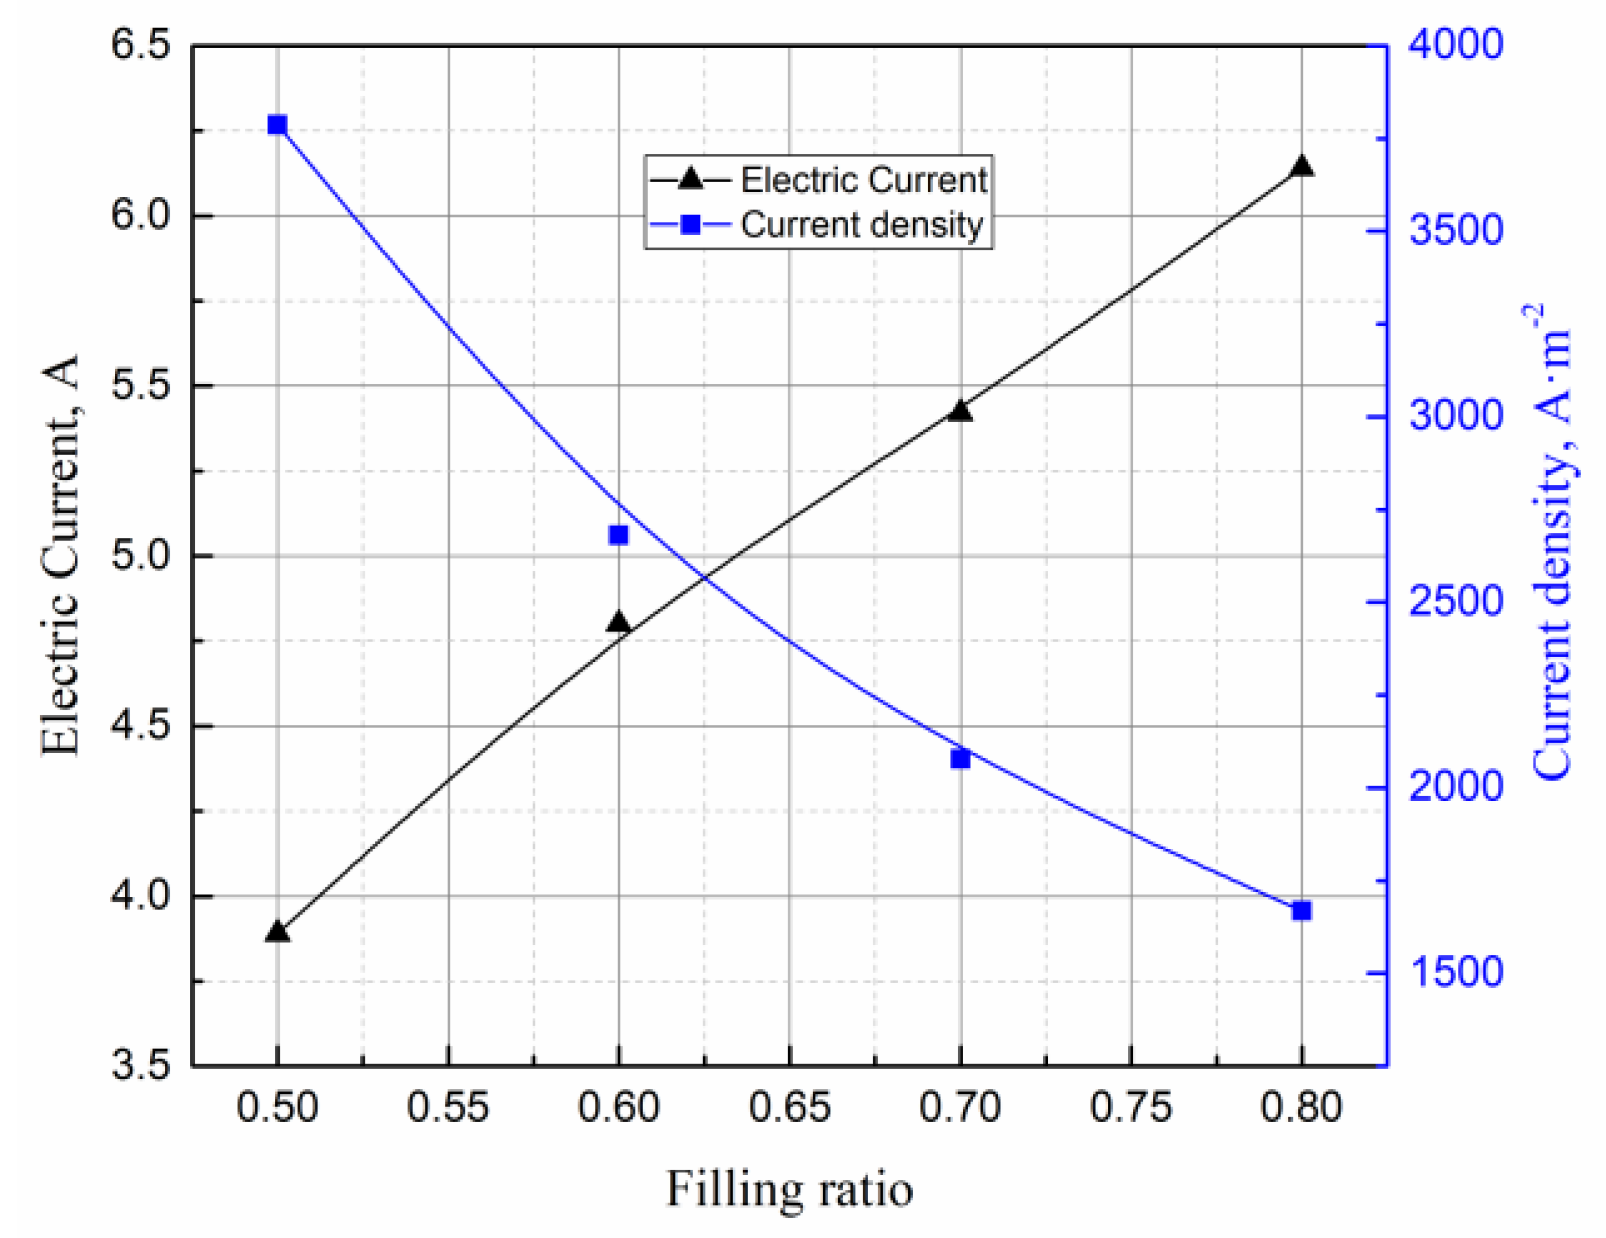
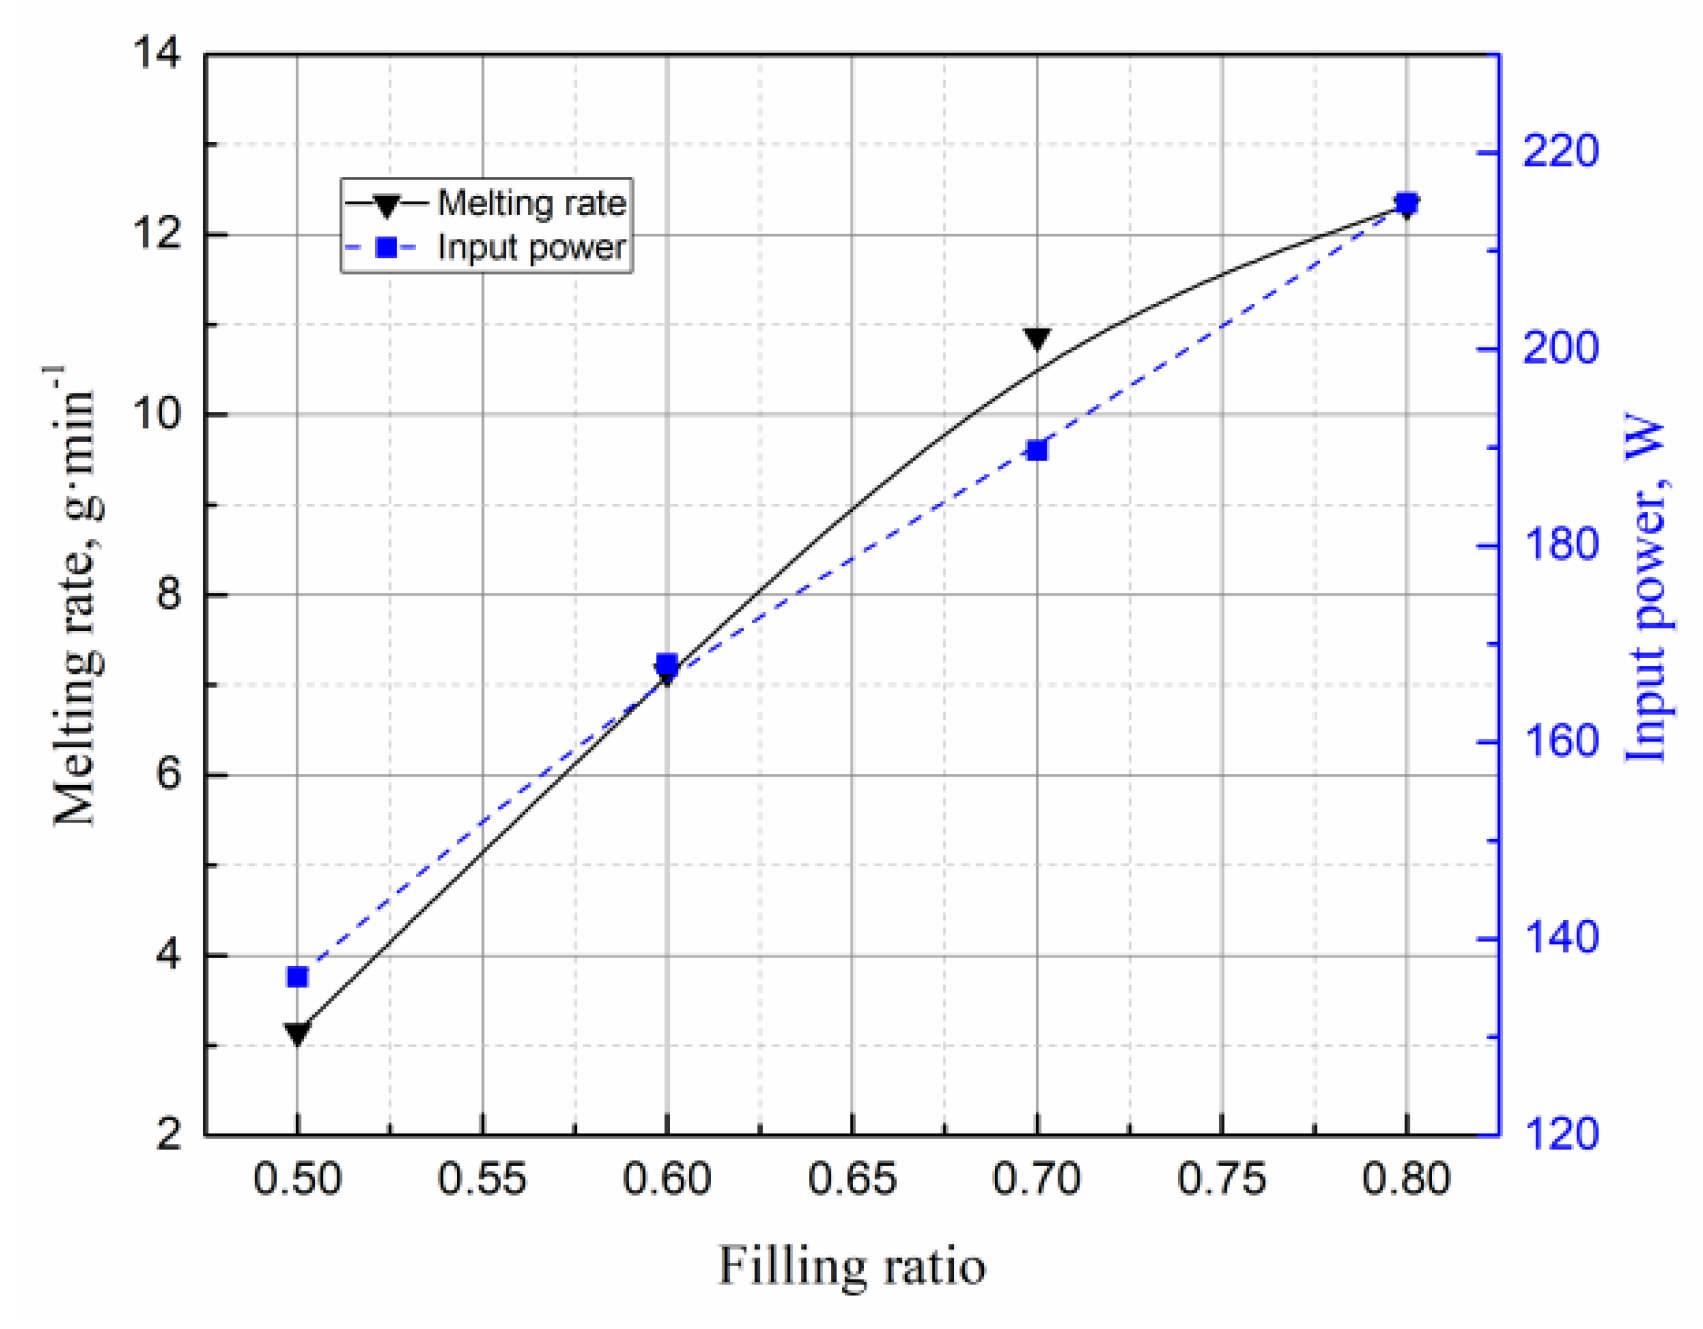
4.5. Effects of Filling Rate on the Droplet Behavior
5. Conclusions
Author Contributions
Funding
Conflicts of Interest
Abbreviations
| E | Electric field (V·m−1) |
| H | Magnetic field intensity (A·m−1) |
| J | Current density (A·m−2) |
| B | Magnetic flux density (T) |
| t | Time (s) |
| ρ | Density of fluid (kg·m−3) |
| v | Velocity (m·s−1) |
| P | Pressure (Pa) |
| μeff | Effective viscosity of the fluid (Pa·s) |
| Floc | Electromagnetic force (N·m−3) |
| μ0 | Vacuum permeability (H·m−1) |
| Qj | Joule heat per unit volume (W·m−3) |
| Electroconductibility (S−1·m−1) | |
| U | Velocity of droplet (m·s−1) |
| rd | Radius of droplet (m) |
| qd | Density of droplet (kg·m−3) |
| Cd | Resistance coefficient |
| Conductivity of slag (S·m−1) | |
| Cp | Heat capacity of liquid steel (J·kg·K−1) |
| Tdp | Temperature of droplet (K) |
| TL | Liquidus temperature (K) |
| Tme | Melting point of electrode (K) |
| I0 | Current (A) |
| Qc | Heat of convection heat transfer (W·m−2·K−1) |
| Qr | Heat transfer heat of the radiation (W·m−2·K−1) |
| A | Heat exchange area (m2) |
| h | Heat transfer coefficient (W·m−2·K−1) |
| TB | Average temperature of slag/metal interface (K) |
| CP,d | Heat capacity of the droplet (J·kg−1·K−1) |
| CP,l | Liquid heat capacity of steel (J·kg−1·K−1) |
| me | Melt rate (kg·s−1) |
| Dm | Diameter of the mold (m) |
| K | Filling rate |
| Ts | Surface temperature of slag (K) |
| re | Radius of electrode (m) |
| R | Radius of mold (m) |
| u | Melting rate of electrode (kg·s−1) |
| L | Electrode filling rate (m·s−1) |
References
- Jiang, Z.H. Electroslag Metallurgy, 1st ed.; Science Press: Beijing, China, 2015; p. 387. [Google Scholar]
- Ying, F.X.; Liang, Y.; Xiao, Z.X. Effects of electrode configuration on electroslag remelting process of M2 high-speed steel ingot. China Foundry 2019, 16, 126–134. [Google Scholar]
- Anon, J. High quality billets by electroslag rapid remelting. Steel Times Int. 1997, 21, 20–25. [Google Scholar]
- Kharicha, A.; Ludwig, A. Influence of an imposed vertical current on the droplet formation during a melting process. In Proceedings of the 7th International Conference on Multiphase, Tampa, FL, USA, 30 May–4 June 2010. [Google Scholar]
- Kharicha, A.; Ludwig, A.; Wu, M. Droplet formation in small electroslag remelting processes. Proc. LMPC 2011, 12, 113–119. [Google Scholar]
- Kharicha, A.; Ludwig, A.; Wu, M. On melting of electrodes during electro-slag remelting. ISIJ Int. 2014, 54, 1621–1628. [Google Scholar] [CrossRef]
- Wang, Q.; He, Z.; Li, B.K. A general coupled mathematical model of electromagnetic phenomena, two-phase flow, and heat transfer in electroslag remelting process including conducting in the mold. Metall. Trans. B 2014, 45, 2425–2441. [Google Scholar] [CrossRef]
- Liu, S.; Zhu, H.; Cai, H.; Wang, Q. Numerical simulation of the formation and the dripping of droplet in the Electroslag Remelting process. Therm. Sci. 2017, 21, 70. [Google Scholar] [CrossRef]
- Campbell, J. Fluid flow and droplet formation in the electroslag remelting process. JOM 1970, 22, 23–35. [Google Scholar] [CrossRef]
- Makropoulos, K.; Winterhager, H. Effect of electromagnetic fields on drop formation in the electroslag-remelting process. Eisenhuttenwes 1976, 47, 211–216. [Google Scholar]
- ElGammal, T.; VonHagen, I.; Mullenberg, R. Role Played by the Electric Current on Metal Droplet Formation in the ESR-Process. In Proceedings of the Fourth International Symposium on Electroslag Remelting Processes, Tokyo, Japan, 7–8 June 1973. [Google Scholar]
- Rao, L.; Zhang, Y.; Geng, M.P. Influence of melting droplet foming process by technology parameters on electrosalg casting process. Foundry Technol. 2010, 31, 154–157. [Google Scholar]
- Wang, Q.; Zhao, R.J.; Fafard, M.; Li, B.K. Three-dimensional magnetohydrodynamic two-phase flow and heat transfer analysis in electroslag remelting process. Appl. Therm. Eng. 2015, 80, 178–186. [Google Scholar] [CrossRef]
- Kharicha, A.; Ludwig, A.; Wu, M. Thermal state of the electrode during the electroslag remelting process. In Proceedings of the 2011 International Symposium on Liquid Metal Processing & Casting, Nancy, France, 25–28 September 2011. [Google Scholar]
- Martin, M.; Chaus, A.S.; Pokusa, A. The electroslag remelting of high-speed steel using a magnetic field. ISIJ Int. 2000, 40, 980–986. [Google Scholar]
- Li, Z.B. Electroslag Metallurgy Theory and Practice, 1st ed.; Metallurgical Industry Press: Beijing, China, 2011; p. 32. [Google Scholar]
- Cao, Y.L.; Dong, Y.W.; Jiang, Z.H. Research on droplet formation and dripping behavior during the electroslag remelting process. Int. J. Miner. Metall. Mater. 2016, 23, 399–407. [Google Scholar] [CrossRef]
- Dong, Y.W.; Jiang, Z.H.; Li, Z.B. Mathematical Model for Electroslag Remelting Process. J. Iron Steel Res. Int. 2007, 14, 7–12. [Google Scholar] [CrossRef]
- Tao, R. Numerical Simulation of Droplet Behavior of ESR Process and Study on Interfacial Properties of Slag Containing CaF2. Ph.D. Thesis, Northeastern University, Shenyang, China, 2012. [Google Scholar]
- Patel, A.D. Effect of electrode pipe and mold current on electromagnetic fields in ESR. In Proceedings of the International Symposium on Liquid Metal Processing and Casting LMPC, Nancy, France, 2–5 September 2007. [Google Scholar]
- Rückert, A.; Pfeifer, H. Mathematical modelling of the flow field, temperature distribution, melting and solidification in the electroslag remelting process. Magnetohydrodynamics 2009, 45, 527–533. [Google Scholar] [CrossRef]
- Hernandez-Morales, B.; Mitchell, A. Review of mathematical models of fluid flow, heat transfer, and mass transfer in electroslag remelting process. Ironmak. Steelmak. 1999, 26, 423–438. [Google Scholar] [CrossRef]
- Kharicha, A.; Schützenhöfer, W. Influence of the slag/pool interface on the solidification in an electro-slag remelting process. Mat. Sci. Forum 2010, 12, 229–236. [Google Scholar] [CrossRef]
- Kharicha, A.; Schützenhöfer, W. On the importance of electric currents flowing directly into the mould during an ESR process. Steel Res. Int. 2008, 79, 632–636. [Google Scholar] [CrossRef]
- Nastac, L.; Sundarraj, S. The stochastic modeling of solidification structures in alloy 718 remelt ingots. JOM 1998, 50, 30–35. [Google Scholar] [CrossRef]
- Sheng, Y.Y. Transport phenomena in electric smelting of nickel matte: Part II. Mathematical modeling. Metall. Trans. B 1998, 29, 85–94. [Google Scholar] [CrossRef]
- Chen, L.M.; Cheng, M.X. The measurement of relations of salt solution conductivity to concentratens and to temperatures. Res. Explor. Lab. 2010, 29, 39–42. [Google Scholar]
- Li, B.K.; Wang, B. Modeling of electromagnetic field and liquid metal pool shape in an electroslag remelting process with two series-connected electrodes. Metall. Trans. B 2014, 45, 1122–1132. [Google Scholar] [CrossRef]
- Melgaard, D.K.; Williamson, R.L. Controlling remelting processes for superalloys and aerospace Ti alloys. JOM 1998, 50, 13–17. [Google Scholar] [CrossRef]
- Yang, Y.; Tang, Z.T. Test and study on reducing esr power consumptions by large filling rate. China Foundry 2006, 55, 832–834. [Google Scholar]
- Kojima, Y.; Kato, M. Model Study on the Melting Phenomena of Consumable Electrode in Electroslag Remelting Process. In Proceedings of the 4th International Symposium on Electroslag Remelting Processes, Tokyo, Japan, 7–8 June 1973. [Google Scholar]


| Parameter | Value |
|---|---|
| Physical properties of slag | |
| Density, kg·m−3 | 2850 |
| Specific capacity, J·kg−1·K−1 | 1404 |
| Thermal conductivity, W·m−1·K−1 | 10.45 |
| Viscosity, kg·m−1·s−1 | 0.01 |
| Emissivity | 0.6 |
| Expansion coefficient, K−1 | 0.0001 |
| Physical properties of steel | |
| Density, kg·m−3 | 7200 |
| Specific capacity, J·kg−1·K−1 | 502 |
| Thermal conductivity, W·m−1·K−1 | 31.9 |
| Steel solidus temperature, K | 1723 |
| Steel liquidus temperature, K | 1693 |
| Latent heat of solidification, J·kg−1 | 247,000 |
| Process parameters | |
| Immersion depth of electrode, m | 0.02 |
| Mold diameter, m | 0.14 |
| Length of electrode, m | 0.32 |
| Voltage, V | 35 |
| Height of slag, m | 0.07 |
| Filling rate | 0.5, 0.6, 0.7, 0.8 |
| Distance between the two electrodes, m | 0.0265 |
| Parameter | Value |
|---|---|
| Length of electrode, m | 0.07 |
| Inner diameter of beaker, m | 0.085 |
| Resistance of resistor, Ω | 5 |
| Depth of electrode immersion, m | 0.007 |
| Height of slag, m | 0.056 |
| Viscosity of wood alloy, kg·m−1·s−1 | 0.0042 |
| Distance between the two electrodes, m | 0.001 |
© 2020 by the authors. Licensee MDPI, Basel, Switzerland. This article is an open access article distributed under the terms and conditions of the Creative Commons Attribution (CC BY) license (http://creativecommons.org/licenses/by/4.0/).
Share and Cite
Tong, W.; Li, W.; Zang, X.; Li, H.; Jiang, Z.; Han, Y. Droplet Formation and Dripping Behavior during the Electroslag Remelting Process with Two Series-Connected Electrodes. Metals 2020, 10, 386. https://doi.org/10.3390/met10030386
Tong W, Li W, Zang X, Li H, Jiang Z, Han Y. Droplet Formation and Dripping Behavior during the Electroslag Remelting Process with Two Series-Connected Electrodes. Metals. 2020; 10(3):386. https://doi.org/10.3390/met10030386
Chicago/Turabian StyleTong, Wenjie, Wanming Li, Ximin Zang, Huabing Li, Zhouhua Jiang, and Yu Han. 2020. "Droplet Formation and Dripping Behavior during the Electroslag Remelting Process with Two Series-Connected Electrodes" Metals 10, no. 3: 386. https://doi.org/10.3390/met10030386
APA StyleTong, W., Li, W., Zang, X., Li, H., Jiang, Z., & Han, Y. (2020). Droplet Formation and Dripping Behavior during the Electroslag Remelting Process with Two Series-Connected Electrodes. Metals, 10(3), 386. https://doi.org/10.3390/met10030386