Article

Methods to Determine Characteristics of AOD-Converter Decarburization-Slags

1
Division of Processes, KTH Royal institute of Technology, SE-100 44 Stockholm, Sweden
2
Outokumpu Stainless AB, Avesta Works, SE- 774 80 Avesta, Sweden
*
Author to whom correspondence should be addressed.
Metals 2020, 10(3), 308; https://doi.org/10.3390/met10030308
Submission received: 9 January 2020 / Revised: 21 February 2020 / Accepted: 23 February 2020 / Published: 26 February 2020
(This article belongs to the Special Issue Inclusion/Precipitate Engineering in Steels)

Abstract

:
Argon Oxygen Decarburization (AOD) converter slags are known to consist of both liquid and solid phases, but limited information on the slag characteristics has been published in the open literature. Therefore, a new methodology to study the characteristics of slag samples taken from the AOD converter process during production was developed based on petrography. The results show that the preparations of the slag samples using the borax method are suitable to use when determining the chemical composition of AOD slag samples using the X-ray fluorescence (XRF) method. The results also showed that both the light optical microscopy (LOM) method and a method combining scanning electron microscopy (SEM) with energy dispersive spectroscopy (EDS) can be used to characterize the slag samples and that the correlation between the methods was found to be good. This means that it is possible to use the faster LOM method instead of the more complicated SEM-EDS method to characterize AOD slag samples. Finally, the results show that the difference between calculated values based on stoichiometry and measured data for Ca and Cr in AOD slags are 11.7 mass% and 11.3 mass%, respectively. This is considered to be a good agreement for industrial samples.

1. Introduction

Since the development of the Argon Oxygen Decarburization (AOD) converter [1] for refining of stainless steel there has been extensive research to study the process, especially focused on modeling. The history and development is quite extensively summarized in the the Ph.D. thesis by Visuri [2].
Despite the above mentioned research, variations in processing time occur during production. These variations are partly thought to be due to variations in the top-slag composition and thus due to a variation of the slag properties during decarburization. Therefore, it is thought that more detailed knowledge on the slag characteristics and its variation throughout the process is necessary in order to obtain a better understanding of the AOD process as well as to create better conditions for process control. A few studies have treated different aspects on AOD slags. The melting behavior of AOD slags has been investigated [3], as well as the cooling behavior of slags [4]. Using physical modelling the slag effect on mixing time was investigated [5] and more recently [6]. Furthermore, a numerical model on the effect on the decarburization reaction [7] was investigated. Some preliminary findings have been presented in conferences the last few years [8,9,10,11] and preliminary results related to this work [12,13,14].
In general, the most common approach to treat the slag from a theoretical point-of-view is to assume that the slag is liquid [15,16,17] as well as homogeneous throughout the whole slag volume. However, from practical experience it is known that during the decarburization process in the AOD converter, the slag is both liquid and solid [7] and probably inhomogeneous [8]. No systematic investigations of such decarburization top-slag variations have been published in the open literature, to the author’s knowledge. However, some studies have been published where the slag composition is related to the process. More specifically, it has been shown that chromium oxide has a significant influence on the decarburization rate [18,19].
There is a need for more detailed studies of the characterization of top slag samples using petrography, which is commonly used in archaeological studies [20]. Such an approach has been described as a tool in problem solving for other metallurgical processes such as the continuous casting process [21], electric arc furnace process [22,23]. More specifically, previous studies were related to the wear of the tundish lining and the submerged entry nozzle. The examination methods were limited to light optical microscopy (LOM) and X-ray diffractometry (XRD). However, methods applicable to the determination of the chemical composition of slag specimens were not used.
The present work should be seen as a first attempt to determine the most suitable methods for determining slag characteristics of the complex AOD slags based on petrography. This is a relatively inexpensive equipment and has the potential of being used continuously and systematically during production in order to collect data that is otherwise lacking. In the first part of the paper, the experimental work and the methods are described. Thereafter, the results are presented and discussed.

2. Materials and Methods

Experiments were done at Outokumpu Steel’s plant in Avesta, Sweden. The stainless steel grade EN 1.4307, (ASTM 304L) was chosen for the experiments because it is frequently produced in the steel works. The main elements in this steel grade are the following: 18 mass% Cr, 8 mass% Ni, 1.5 mass% Mn and 0.4 mass% Si (Fe-balance). Slag and steel were sampled in the AOD converter during different stages of the process.

2.1. Plant Description

Outokumpu Stainless Avesta Works is a scrap-based steel plant with an annual production of approximately 500,000 metric tonnes per year. Scrap is melted in a 100 t electric arc furnace, where lime and alloys are added. Thereafter, steel is decarburized in an AOD converter. It is on these decarburizing slag conditions that this study focuses on. Subsequently, the slag is reduced, in order to recover alloys, mainly oxidized chromium. Sulfur refining is also carried out in the AOD converter. The steel is treated in a ladle furnace, where both temperature control and composition adjustment are performed. Finally, the steel is cast into slabs of dimensions 1035–2070 mm and 140–200 mm.

2.2. Sampling

Sampling was done in the AOD converter. Sampling of steel and slag was performed at the end of the decarburization period with a tilted converter vessel. Steel was sampled manually using a lollipop sampler and slag was sampled manually using a slag scoop. The temperature was also measured after the sampling, to ensure that the process conditions were similar for all sampling occasions.

2.3. Preparation of Samples

Preparation of petrographic specimens is fairly similar to that of metallographic micro specimens. However, due to the porous character of the slag samples, it was necessary to embed it in bakelite to keep it in place during the microscopy studies. The CaO-rich samples were first sorted out to be coarsely ground to a flat section of approximately 1–1.5 cm 2 . Thereafter, they were put on the bottom plate of the embedment mould (Buehler Simplimet 3). The embedment powder, which included graphite to obtain electrical conductivity, Buehler Konductomet, was filled into the mould. Moreover, an automatic preparation was used resulting in a final specimen with a diameter of 3.2 cm.
The specimens were ground and polished in an automatic grinding machine. The grinding sequence is summarized in Table 1. Also, the samples were polished with four different combinations of polishing felt and polishing agents, where each lasted for two minutes. In addition, the specimens were washed in ethanol between each polishing step.

2.4. Analysis Methods and Data Processing

To reveal the basic information on parameters describing the slag, several analysis and examination methods were chosen including X-ray fluorescence (XRF), light optical microscopy (LOM) and scanning electron microscopy (SEM) combined with energy dispersive spectroscopy (EDS).
Initially, XRF was used to quantify the amount of the different elements. The XRF specimens should be prepared as to give a flat surface for analysis. The compacted crushed powder specimen (borax) method was used. Here, the sample is crushed to powder and is thereafter compacted onto a borax plate. The analysis was performed using standardized instrument (ARL 8680, Thermo Electron Corporation, Waltham, MA, USA) setup and calibrations. In addition, repeated analyses were performed on the same sample to examine variations in the analysis. Also, the data were automatically converted to oxides by the steel work laboratory.
The petrographic studies in LOM were performed on specimens of a few centimeter sizes that had been ground and polished. A range of magnifications (50–400×) were used to get different views of the structure with respect to the distribution of structural elements such as metal, lime, etc. In addition, more detailed observations were made at the highest magnification.
The samples were also studied using SEM. The instrument was a Philips SEM 515 (Philips Electron Optics, Amsterdam, The Netherlands) equipped with EDS system including INCA feature. The following parameters were used: an accelerating voltage of 20 kV, secondary electrons (SE), and 30–40 s measurement times for the EDS determinations. Also, the EDS composition analysis was performed using a sampling depth of 1–2 μm. Each sample was analyzed in 10 positions minimum for each phase. The analyses of the compositions were given in atomic percent. In doing this, elements lighter than oxygen were removed from the analysis because of unreliable measurement accuracy for those elements. Thereafter, the composition was normalized to 100%. In doing this, minor concentrations of Mg, Al, and Mn were neglected.
Thereafter, the phases were determined based on the chemical composition of the slag using the reference book Slag Atlas [24] and the thermodynamic software Thermo-Calc [25] using the database SLAG4 for stainless steel systems. More specifically, the phases were identified from the stoichiometric compositions.
The images from the SEM were not clear enough to enable a direct comparison to the corresponding LOM pictures. However, the shape of different metallic features could be used for precise identifications of both the metallic and non-metallic features. The transfer of the analysis points from the SEM image to the LOM image is illustrated in Figure 1. The procedure was as follows: Two pictures, one from LOM showing the phase boundaries clearly (No. 1) and the other from SEM (No. 2), representing the same area were processed using the software Photoshop (Adobe Inc., San Jose, CA, USA). In picture No. 2 the measurement points are noted. Then, in picture No. 3 another layer of information is added. Finally, in picture No. 4 the SEM figure is removed to clearly illustrate the measurement positions in the LOM image. Thus, picture No. 4 illustrates exactly were the measurements have been done for the two layers.
Image analyses were made to investigate the amount of different phases. The software OPTIMAS 6.1 (Optimas Corporation, Bothell, WA, USA) was used to analyze the pictures. Images from the LOM were preferably used because they were in color. Hence, the different oxides were easier to separate. Several determinations were made for each sample to ensure reproducible results.

3. Results and Discussion

3.1. Microscopy

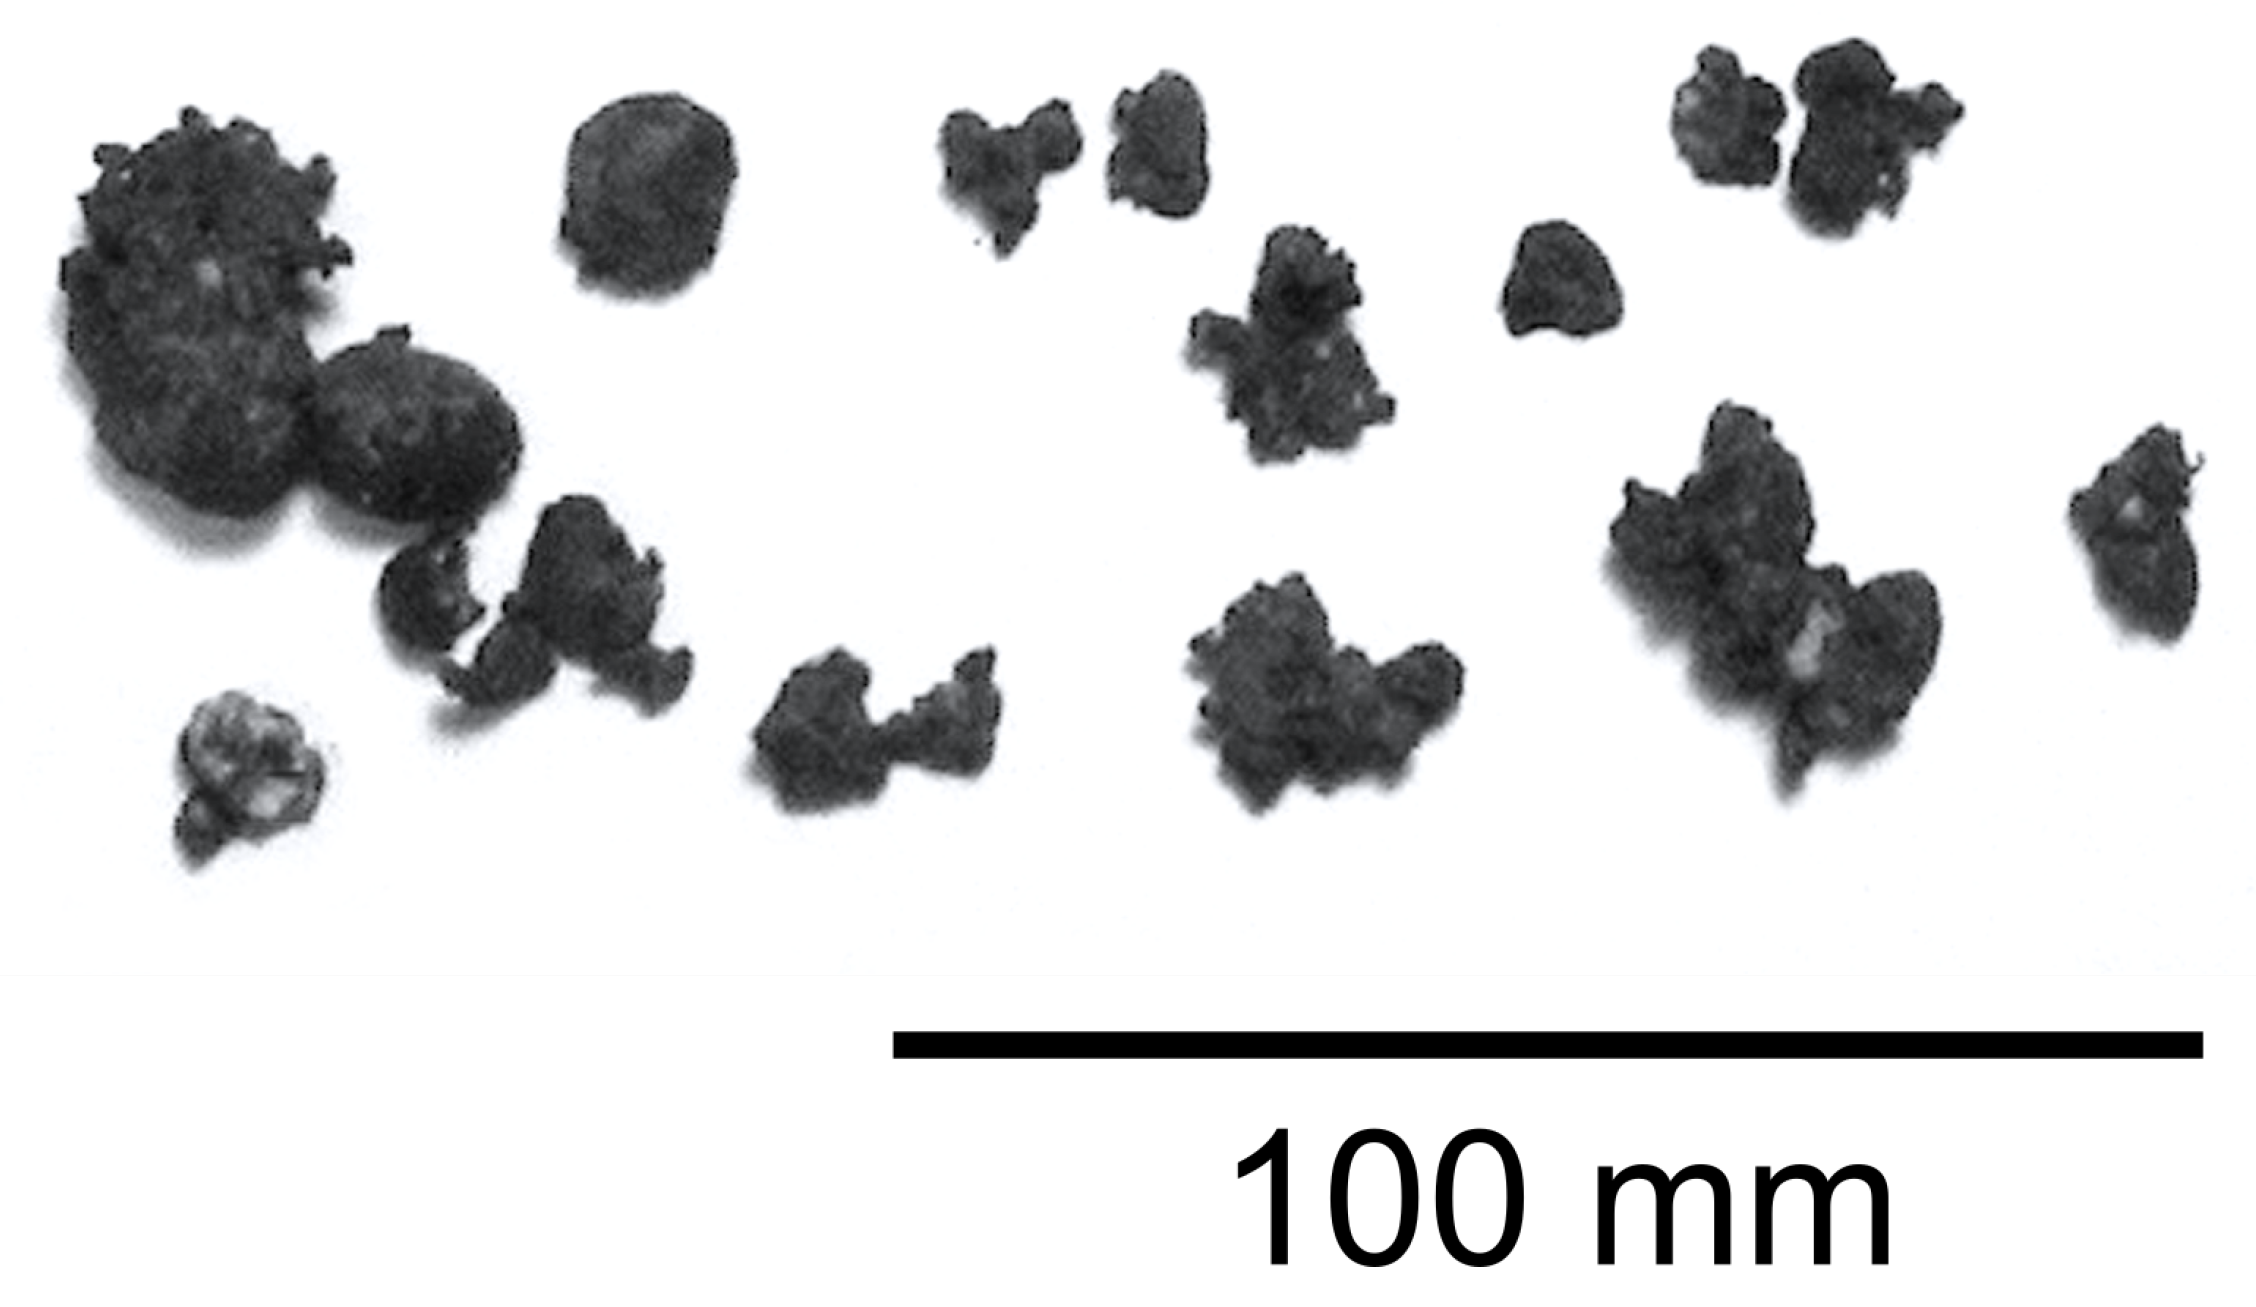
Slag samples were collected from the AOD converter at the end of the decarburization period. An example of a typical slag sample is seen in Figure 2. As can be seen, the sample consists of separate slag particles of approximately a 100 mm size. Here, it should be noted that the sizes of the slag particles were approximately the same as the size of the lime particles that were added. However, a study of the influence of size on the petrography results was not the focus of this study. Also, data for five heats are discussed in the present study.
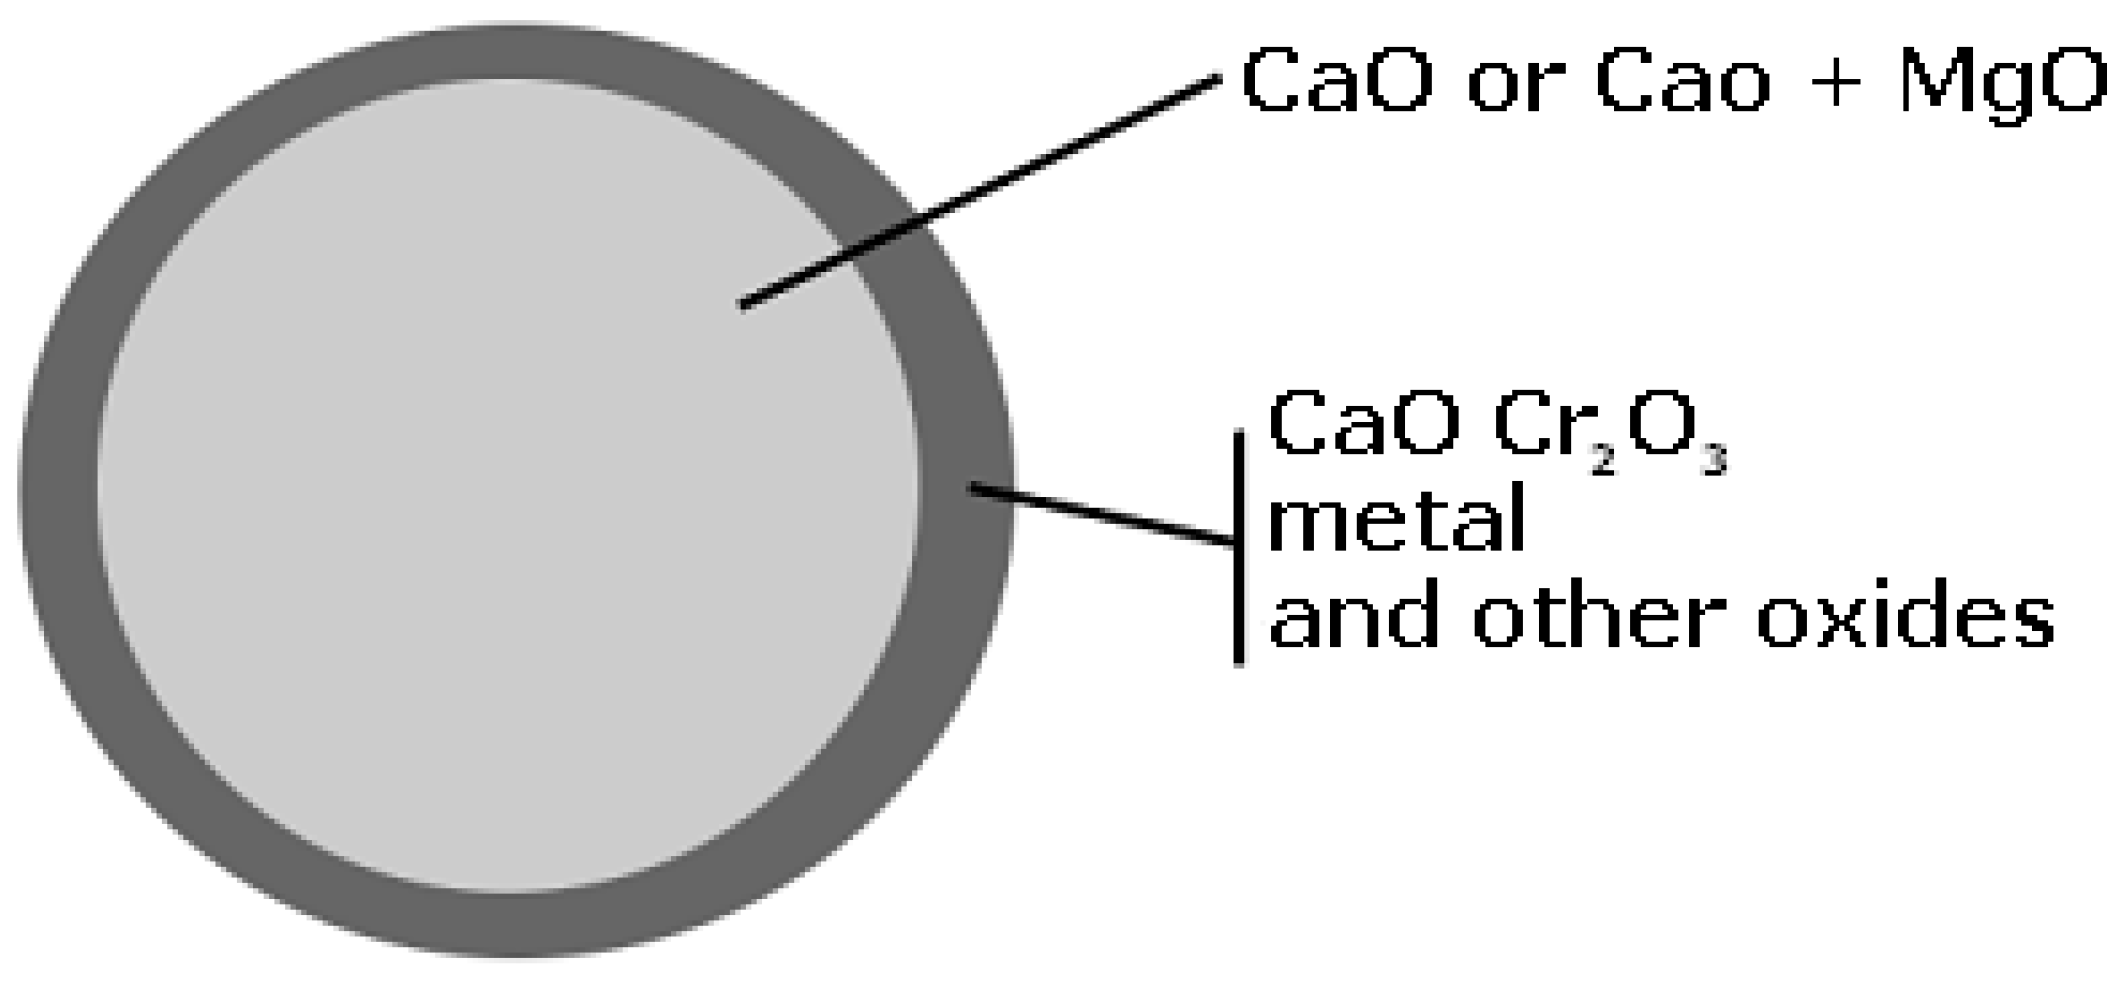
One particle of the slag sample is schematically shown in Figure 3. It contained a core of lime surrounded by a shell consisting of different oxides and metals. Furthermore, this is found as the mechanism for lime dissolution in liquid silicate slags [26,27] and experimentally found for AOD slags [28,29].
It should be mentioned that the polished specimen surface decomposed gradually over a period of 3–4 weeks. Thus, it was important to keep the samples in a vacuum container and to study them as soon as possible after finishing the sample preparation in order to obtain accurate results.
A typical result of an XRF determination of a slag sample is shown in Table 2. The main components in the slag were CaO ( 58.5 mass%) and Cr2O3 ( 27.0 mass%), as was expected. However, the slag also contained FeO, SiO2, MnO and MgO. In addition, smaller amounts of elements and components such as F, S and NiO were detected. However, these were neglected in the remaining evaluation of the slag data. The reasons are that they are deemed not to affect the results, since the contents are low. Moreover, if the number of components is fewer it is easier to determine the phases and melting points using phase diagrams.
After removing the elements and components, the XRF analyses for the remaining six components were normalized. The amounts of each component for all studied samples are given in weight percent in Table 3. Data are given for five heats denoted A–E. In addition, three sets of data are given for heat B where repetitive determinations were done. It can be seen that the amounts of the two main components in the slag CaO and Cr2O3 showed a variation of 49.6–71.0 mass% and 20.0–32.0 mass%, respectively.
It was mentioned earlier that it is generally believed that the slag samples from the AOD process are inhomogeneous with respect to the chemical composition. Thus, three repeated XRF determinations were made for one heat number (B-1 to B-3). It was seen that the Cr2O3 content varied between 20.0–32.0 mass% and the CaO content varied from 54.1–71.0 mass%. However, for a statistical significance an expanded study of more samples is needed. When interpreting these results it was discussed whether the slag is so in-homogeneous at this stage of the AOD process, so that it was too hard to determine a reliable composition using XRF. Thus, it was decided to study if alternative analysis methods could be developed to give more reliable and homogeneous data of the chemical slag compositions.
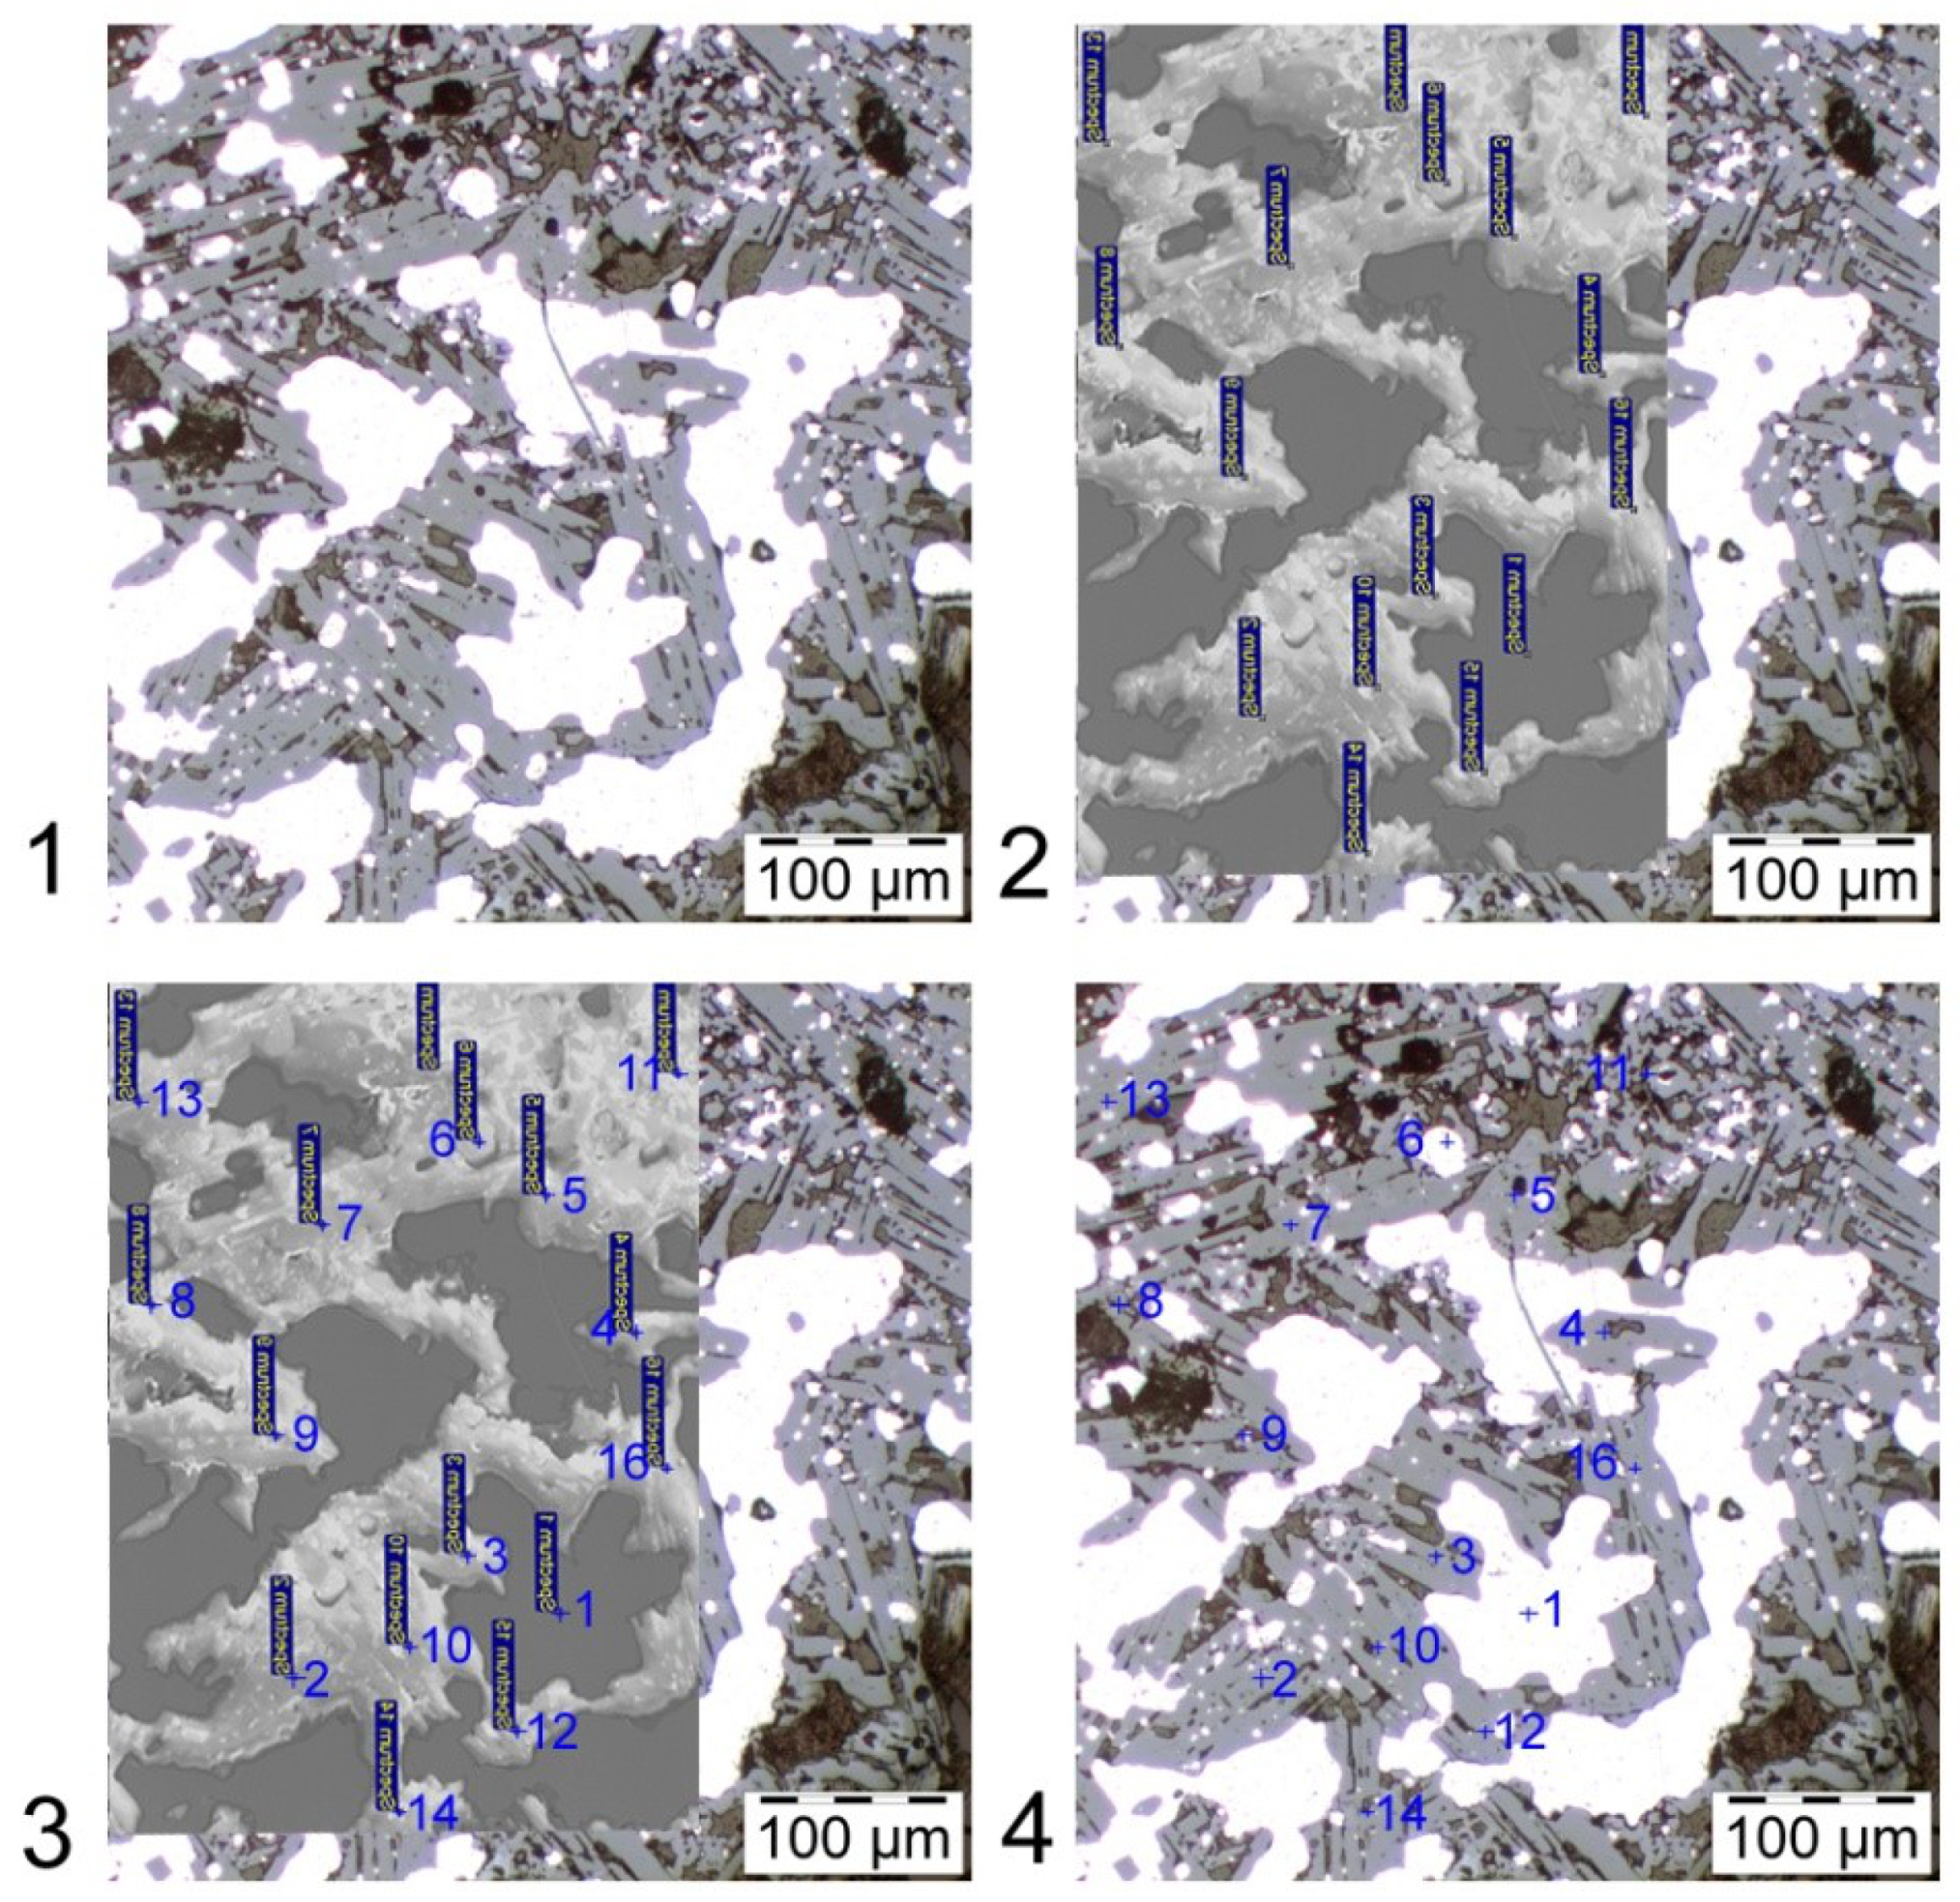
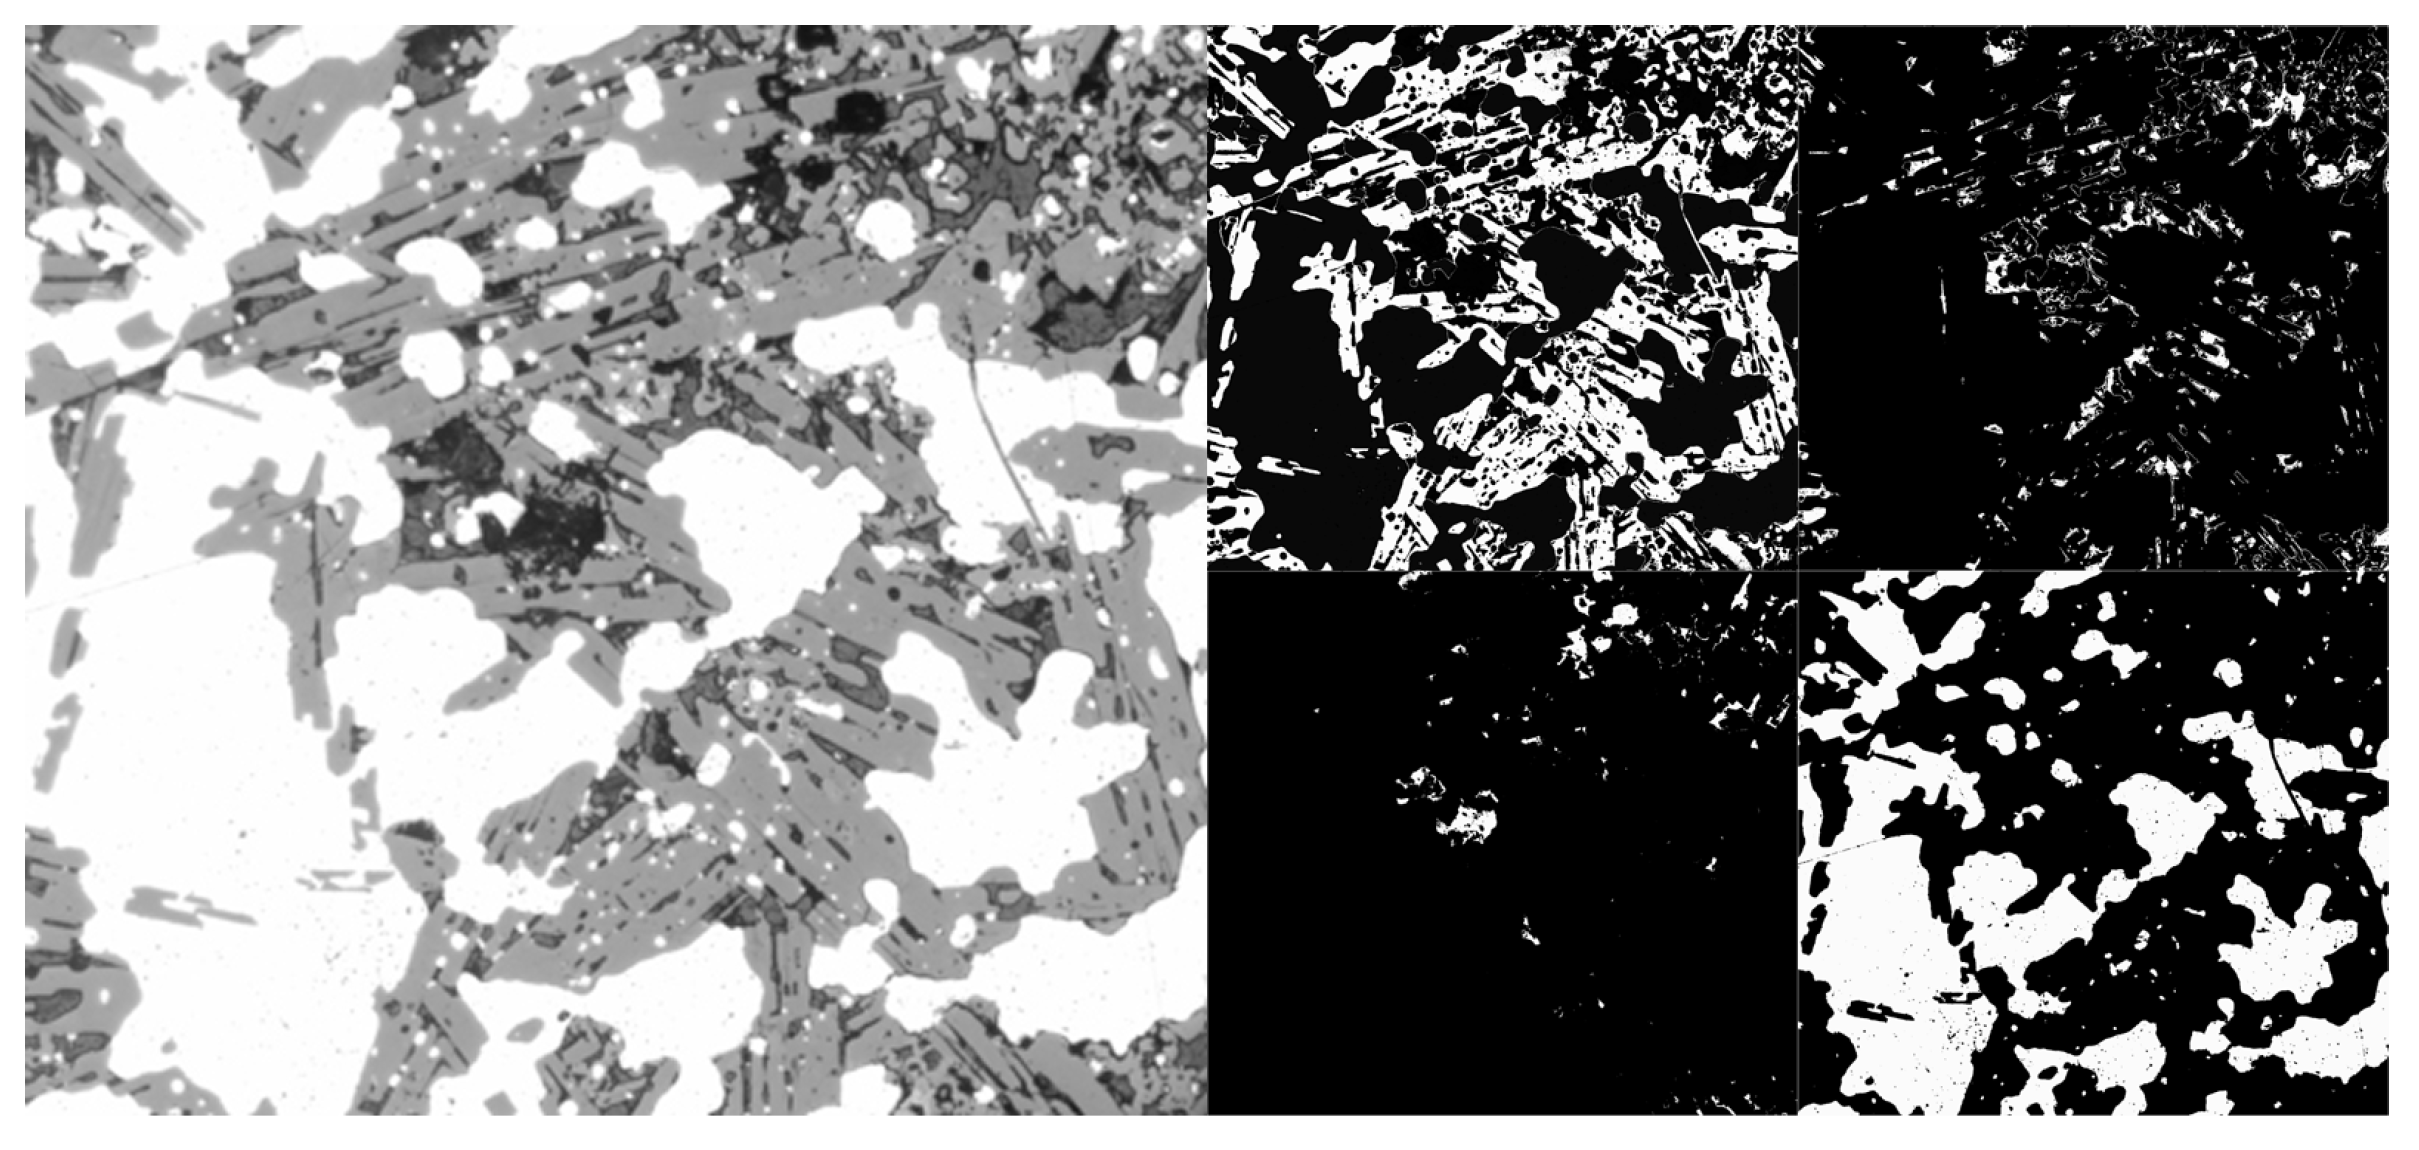
When studying the samples in a light optical microscope it is obvious that the samples contain both slag and “free” lime, as is shown in Figure 3. From this figure it is seen that the lime is concentrated in the center. Therefore, the data from Table 3 were further processed. The CaO and MgO contents were removed, since they are believed to represent the lime phase of the slag samples. Thereafter, the compositions of the remaining four components (Cr2O3, FeO, SiO2 and MnO) were normalized, as illustrated in Table 4. Similar to Table 3, this table presents data for five heats including repetitive determinations for heat B. Overall, the results show that the composition of the main component Cr2O3 varies from 49.0–72.7 mass% in the different slag samples taken from different heats (A–E). Thus, there is still a variation in chemical composition between the studied heats.
The results in Table 4 also show that when CaO and MgO are excluded from the XRF results and the remaining data are normalized, the Cr2O3 content only varies between 71.3–71.6 mass% for the repetitive composition determinations for heat B. Thus, the difference in composition determination is highly improved compared to when CaO and MgO are not excluded from the results (20.0–32.0 mass%). In addition, the results also show that the variation in composition determination is very small for the oxides FeO, SiO2 and MnO. Thus, based on these results it is concluded that the XRF method is suitable to use when determining the chemical composition of AOD slag samples. However, one needs to be careful when interpreting the results. It is especially important to separate the solid lime-phase (CaO and MgO) from the rest of the slag phase before presenting the data. From our experience the free lime is not homogenously distributed in the slag sample and also varies with sampling time and from process conditions.

3.2. Image Analysis

Light Optical Microscopy (LOM) was used in the image analysis. The microscope was operated with a magnification of 100 x. A pre-study showed that this magnification gave a proper area for the image analysis. In Figure 4, a typical picture of a LOM determination is shown in the left part of the figure. Four different phases can be identified, based on the different colors. The first one is the metal phase, which is seen as the white part of the picture. This phase is quite easy is to identify in a slag samples: This fact has also, for example, been reported by Ekengård et al. [30] for ladle slags and Gustavsson et al. [31] for blast furnace slags. The other three phases are different slag phases. They are named light gray (LG), dark gray (DG) and black (B). It is of interest to determine the fraction of each phase when studying a slag sample. On the right-hand side of Figure 4, the four phases extracted from the LOM picture using image analysis are shown. Specifically, they are denoted white, light grey, dark grey and black. From the total analyzed area of 0.24 mm2 the following percentages was found for each phase: white (metal phase) 47 area%, light gray (CaO·Cr2O3) 42 area%, dark gray 8 area% and black 2 area%.
In order to illustrate more specifically how the fractions of the different phases were determined from the slag phases some raw data are presented in Table 5. Thirty image analysis determinations were done for this sample. Thereby, it was possible to obtain a clear picture of how the fraction varied between the different phases within one sample and focusing on the CaO·Cr2O3 phase. If the average values and standard deviation was calculated for the 30 determinations the following values were obtained for Ca and Cr: ( 12.8 ± 0.7 ) at% and ( 25.7 ± 1.9 ) at%, respectively.
In Table 6, the calculated stoichiometric compositions of Ca, Cr, Si and O based on the given phases are shown to enable a comparison with the experimental determinations. For the CaO·Cr2O3 phase the Ca and Cr contents are 14.3 at% and 28.6 at%, respectively. This agreement is satisfactorily good. Thus, the rest of the image analysis determinations were also made by studying 30 pictures in the LOM per sample.
One possible explanation for the large standard deviations found in Table 6 is the presence of metal aggregates of different sizes in different parts of the slag sample (white phase). Ekengård et al. [30] has reported that the size distributions of metal droplets in ladle slags are typically between 4.7 μm and 18.7 μm, even though some larger metal particles also were found. Ladle and AOD slags are similar in the sense that in both cases strong stirring occur at the steel/slag interface, when injected gas pushes its way out of the bath. Thus, it is reasonable to assume that also the size distribution of metal droplets in AOD slags is quite large. Rubens and Koch et al. investigated decarburization slags from combined blowing AOD practise and differences between large metal droplets in the mm range and fine particles in the μm range, where the total amount of metal droplets where estimated to be 10–35 mass% of the slag. The large droplets showed a significantly lower carbon content to that of the bulk metal bath and the fine particles showed a lower chromium [29,32]. Lindstrand et al. studied the metal droplets for a converter with side-blown practise, the same conditions as for the present study, here the droplets only consists of about 2–7 mass%. Without a top-lance there seems to be lower amount of metal droplets in the slag. An estimate of the metal droplets can be made from the NiO content if it is assumed that no nickel oxide is formed. Thus, the slag in Table 2 corresponds to 2.5 mass%. However, this was not studied more in-depth in the current work since the focus was on the slag itself.

3.3. Summarized Discussion

As the sampling from the converter must be performed manually, the specimens were checked regarding variable appearance. A fairly good reproducibility was obtained based on ocular inspections of the samples. However, the high content of lime leads to difficulties in the sample preparation as well as in examination of the samples. More specifically, samples with large CaO contents will disintegrate during storage and sample preparation. Thus, to get the best performance when examining the different slag phases the specimens with high CaO contents were sorted out. Overall, these findings made it clear that it is important to discuss how it is possible to estimate the CaO- and MgO contents in a reliable manner, when making an overall evaluation of the results.
The procedure of using normalizations of the XRF data in the present study seems to be useful when comparing the slag components between different heats. However, there are some uncertainties in the XRF determinations. For example, the accuracy in determining the Cr-content using XRF is affected by the lack of high chromium-containing reference materials for determinations of chemical compositions of slags. Further, an in-homogeneous distribution of CaO/MgO causes a scatter in the chromium determinations.
Errors can also occur in the SEM-EDS determination of the oxides, due to charging of non-conductive phases. However, these expected errors seem to be small and negligible, as shown by the low standard deviation values within a specimen and between specimens in Table 6. Specifically, the measurements for Ca and Cr were ( 12.8 ± 0.7 ) at% and ( 25.7 ± 1.9 ) at%, respectively.
The possible phases in the slag samples were evaluated based on data of the chemical composition of the slag samples (Table 3). In addition, some XRD measurements were done to verify that the slag contained the following phases: CaO·Cr2O3, 3CaO·2SiO2 and 3CaO·Cr2O3·3SiO2. Thereafter, the percentage of Ca, Cr, Si and O were determined based on stoichiometry, se Table 6. Overall, the agreement between the stoichiometric and measured values was found to be good. More specifically, as is shown in Table 5 and Table 6 the SEM-EDS determination show that the CaO·Cr2O3 phase contained 25.7 at% chromium and the stoichiometric calculations in Table 6 suggest that the chromium content should be 28.6 at%. Thus, the difference between the calculated value based on stoichiometry and measured data for Ca and Cr are 11.7 % (14.3/12.8) and 11.3 % (28.6/25.7), respectively. This is considered to be a good agreement for industrial samples. The differences from stoichiometry is likely due to solubility of other elements in the oxides.
Overall, it is believed that the current procedure of determining the slag characteristics based on petrography is suitable to use for AOD converter decarburization slags.
Figure 5 illustrates the phase fractions of different chemical compounds found in a typical AOD slag as a function of the temperature calculated using Thermo-Calc. The calculations were done as follows, based on the SLAG4 database. First, the average slag composition for sample B-1 in Table 3 was used as input to the calculations. This was to include the major chemical driving forces in the process and what phases that are expected to be stable. Thereafter, simulations were done at different temperatures ranging from 1500–2300 K in order to simulate what phases that will be present during a lowering of the temperature. A similar approach was used to good agreement with experiments where slow cooling of slags was studied [33].
At 2300 K, the fraction of liquid slag is approximately 0.82 and the other two phases are a solid CaO phase 0.1 and a CaO·Cr2O3 phase 0.08. At 2250 K , a solid MgO·Cr2O3 phase is formed. Finally, the 3CaO·SiO2 phase will precipitate as a solid phase at a temperature of 2040 K . The predicted slag component compositions were found to have a reasonable good stoichiometric agreement with data found in the slag atlas literature [24]. The phases present are also in accordance with the experimental findings [28,32]. In contrast, the predicted liquid fraction is much less than [8]. This is most likely due to a much higher CaO content used for the calculations in this study.
Figure 5 also shows that the molten slag fraction decreases rapidly from 2300–2040 K and that then it continues to decease until it reaches a value of 0.07 at 1500 K . During steelmaking conditions the slag temperatures in an AOD are typically 1800–2100 K. Specifically, the solid fraction in a slag is approximately 90% at 1800 K and 57% at 2100 K . Thus, the fraction of liquid phase is very low in comparison to the majority of the slags found in other steel making reactors.
It should be pointed out that only the dark gray edges of a sample shown in Figure 3 were studied. This is due to the fact that it is mainly this region that will take part in the decarburization reactions. Moreover, this surface may also be in contact with the steel melt under the formation of a liquid/solid interface. This was also observed by Münchberg et al. [28]. It is also of interest to mention that CaO or MgO compounds were only detected in the center of the petrographic samples.
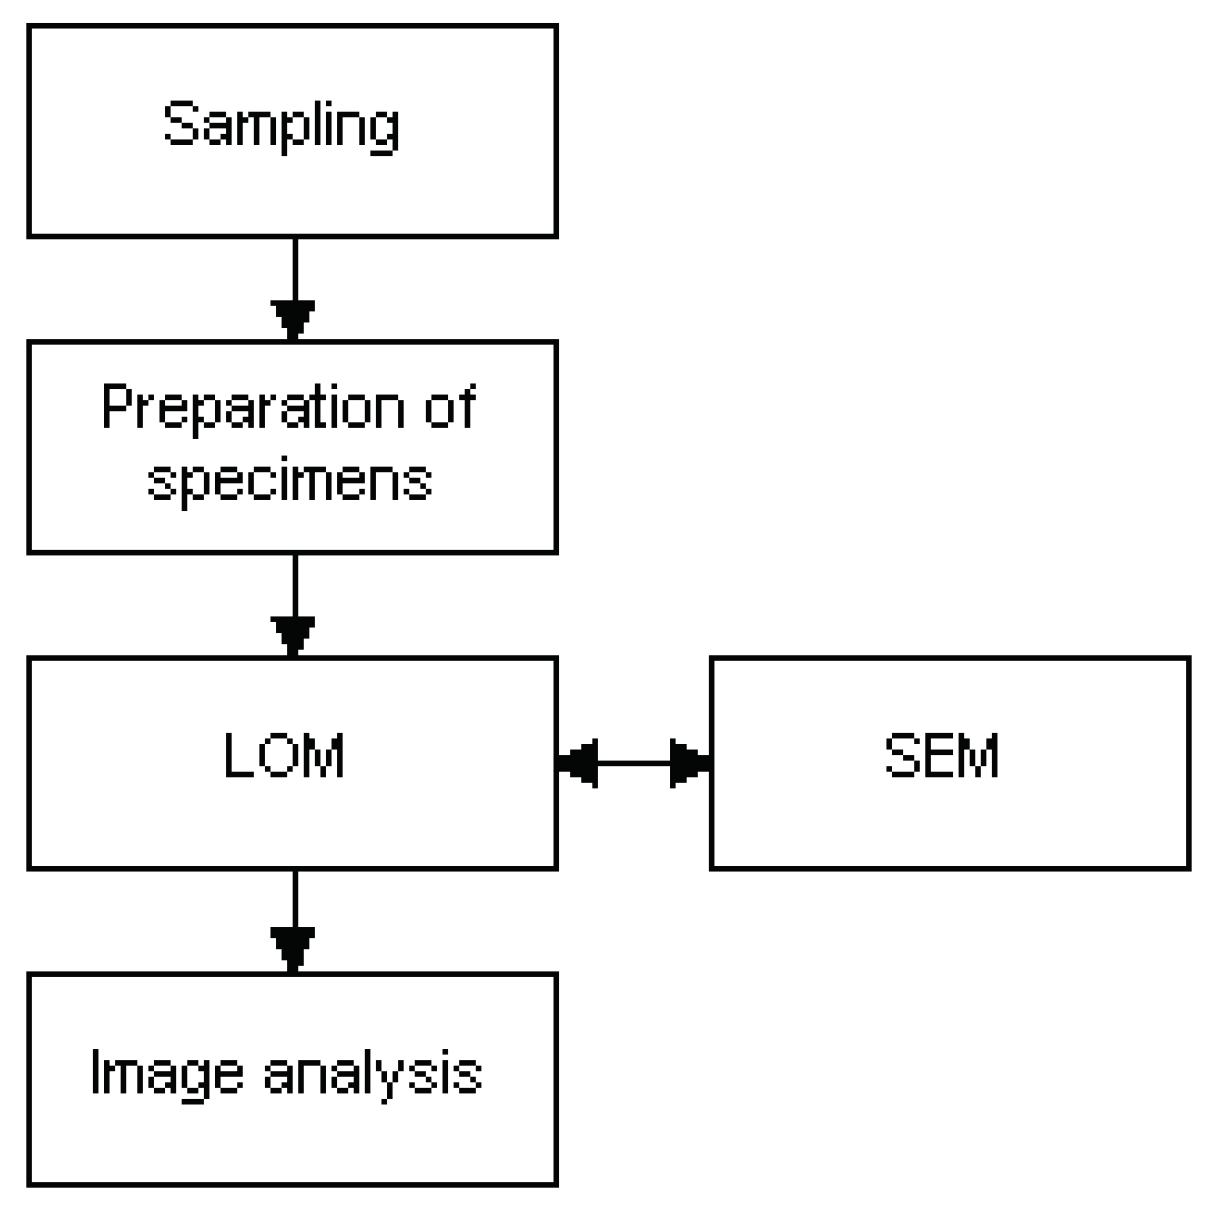
Figure 6 shows a sketch over the methodology to study slag characteristics in AOD slag samples, which was developed based on the results in this study. First, a slag sample is taken using a scoop from the desired part of the AOD process. From this sample, a slag piece is selected which does not contain a lot of undissolved CaO pieces. Thereafter, the slag piece is baked into Bakelite. During the final sample preparation, a careful grinding is carried out in order to obtain a plain surface which is suitable for accurate microscopy determinations.
The initial microscopy studies are carried out by using LOM. For each sample, 30 views are selected. These are saved before image analysis determinations are made. Here, SEM in combination with EDS is used for a verification of the phases identified using LOM. During the image analysis studies, the different phases in the samples are studied. In the end, the purpose is to get reproducible data with respect to the phases in the slag samples.

4. Conclusions

A new methodology to study the characteristics of slag samples taken from the AOD converter process during production was developed based on petrography. First, a new method for sample preparations was established. Thereafter, microscopy studies were carried out by using LOM. This was followed by studies based on SEM in combination with EDS to verify the phases identified using LOM. The overall conclusion of this research is that the current procedure of determining the slag characteristics based on petrography is suitable to determine the characteristics of AOD converter slags. In addition, the most important specific conclusions from the work may be summarized as follows:
  • The XRF method is suitable to use when determining the chemical composition of AOD slag samples. However, it is important to separate the solid lime-phase from the rest of the slag phase since it is not homogeneously distributed in the slag samples. Specifically, if CaO and MgO are removed from the XRF results and the remaining data are normalized, the Cr2O3 content varied between 71.3–71.6 mass% for three repeated determinations on the same slag sample.
  • The correlation between the LOM and SEM-EDS results were good, which means that it is possible to use the faster LOM method instead of the more complicated SEM-EDS method to characterize slag samples. This could be beneficial for a relatively fast and routine characterization technique that could potentially be automated to a high degree.
  • The differences between the calculated values based on stoichiometry of the chemical slag composition and measured data using a combination of SEM and EDS for Ca and Cr are 11.7% and 11.3%, respectively. This is considered to be a good agreement for industrial slag samples.

Author Contributions

Conceptualization, G.R. and J.J.; methodology, P.T.; software, P.T. and N.A.; validation, P.T. and G.R.; formal analysis, P.T. and G.R.; investigation, P.T.; resources, J.J.; data curation, P.T. and G.R.; writing–original draft preparation, P.T.; writing–review and editing, N.Å.I.A.; A.T. and P.G.J.; visualization, P.T. and N.Å.I.A.; supervision, A.T. and P.G.J.; project administration, A.T.; funding acquisition, A.T. and P.G.J.; All authors have read and agreed to the published version of the manuscript.

Funding

This research received no external funding.

Acknowledgments

The financial support by Outokumpu Stainless Research Foundation is gratefully acknowledged.

Conflicts of Interest

The authors declare no conflict of interest.

Abbreviations

The following abbreviations are used in this manuscript:
AODArgon oxygen decarburization
EDSEnergy dispersive spectroscopy
LOMLight optical microscopy
SEMScanning electron microscopy
XRFX-ray fluorescence

References

  1. Sjöberg, P Some aspects on stainless steel production. Ph.D. Thesis, KTH Royal Institute of Technology, Stockholm, Sweden, 1994.
  2. Visuri, V.V. Mathematical Modelling of Chemical Kinetics and Rate Phenomena in the AOD Process. Ph.D. Thesis, University of Oulu, Oulu, Finland, 2017. [Google Scholar]
  3. Heikkinen, E.P.; Fabritius, T.M.; Kokkonen, T.M.; Härkki, J.J. An experimental and computational study on the melting behaviour of AOD and chromium converter slags. Steel Res. Int. 2004, 75, 800–806. [Google Scholar] [CrossRef]
  4. Pandelaers, L.; D’alfonso, A.; Jones, P.T.; Blanpain, B. A quantitative model for slag yard cooling. ISIJ Int. 2013, 53, 1106–1111. [Google Scholar] [CrossRef] [Green Version]
  5. Haas, T.; Visuri, V.V.; Kärnä, A.; Isohookana, E.; Sulasalmi, P.; Eriç, R.H.; Pfeifer, H.; Fabritius, T. Physical Modelling of the Effect of Slag and Top-Blowing on Mixing in the AOD Process. In Advances in Molten Slags, Fluxes, and Salts, Proceedings of the 10th International Conference on Molten Slags, Fluxes and Salts 2016, Seattle, WA, USA, 22–25 May 2016; Springer: Cham, Switzerland, 2016; pp. 999–1008. [Google Scholar]
  6. Ternstedt, P.; Ni, P.; Lundqvist, N.; Tilliander, A.; Jönsson, P.G. A physical modelling study to determine the influence of slag on the fluid flow in the AOD converter process. Ironmak. Steelmak. 2018, 45, 944–950. [Google Scholar] [CrossRef]
  7. Andersson, N.Å.; Tilliander, A.; Jonsson, L.T.; Jönsson, P.G. Investigating the effect of slag on decarburization in an AOD converter using a fundamental model. Steel Res. Int. 2013, 84, 169–177. [Google Scholar] [CrossRef]
  8. Heikkinen, E.P.; Leinonen, V.; Tanskanen, P.; Fabritius, T. A Computational study to estimate the possibilities to improve utilisation of stainless steelmaking slags. In Proceedings of the 1st International Conference on Energy and Material Efifciency and CO2 Reduction in the Steel Industry, Kobe, Japan, 11–13 October 2017; Volume 1, pp. 86–89. [Google Scholar]
  9. Visuri, V.V.; Mattila, R.; Kupari, P.; Fabritius, T. A comparative study on refractory wear associated with fluxes for AOD slags. In Proceedings of the 7th International Congress on Science and Technology of Steelmaking, Venice, Italy, 13–15 June 2018. [Google Scholar]
  10. Heikkinen, E.P.; Visuri, V.V.; Fabritius, T. On the heterogeneity of AOD slags in different stages of blowing. In Proceedings of the 8th European Oxygen Steelmaking Conference, Taranto, Italy, 10–12 October 2018; Volume 8. [Google Scholar]
  11. Kärnä, A.; Sulasalmi, P.; Visuri, V.V.; Fabritius, T.; Torvinen, P.; Koskinen, J. Numerical modelling of slag cooling. In Proceedings of the 4th European Steel Technology and Application Days, Düsseldorf, Germany, 24–28 June 2019; Volume 4. [Google Scholar]
  12. Ternstedt, P.; Runnsjö, G.; Lindstrand, G. Top slag influence on the decarburization in the AOD process. In Proceedings of the 3rd International Conference on Process Development in Iron and Steelmaking, Luleå, Sweden, 8–11 June 2008; Volume 3, pp. 149–153. [Google Scholar]
  13. Ternstedt, P.; Gyllenram, R.; Bengtsson, J.; Jönsson, P.G. Simulating continuous decarburization control with an AOD simulation Workbench. In Proceedings of the 6th European Oxygen Steelmaking Conference, Stockholm, Sweden, 7–9 September 2011; Volume 6, pp. 1–5. [Google Scholar]
  14. Lindstrand, G.; Jönsson, P.; Tilliander, A. Studies of Metal Droplets in AOD Production Decarburisation Slags. In Proceedings of the ISIJ-VDEh-Jernkontoret Joint Symposium, Osaka, Japan, 15–16 April 2013; pp. 106–113. [Google Scholar]
  15. Tilliander, A.; Jonsson, L.T.; Jönsson, P.G. A Three-D imensional Three-P hase Model of Gas Injection in AOD Converters. Steel Res. Int. 2014, 85, 376–387. [Google Scholar] [CrossRef]
  16. Andersson, N.Å.I.; Tilliander, A.; Jonsson, L.T.; Jönsson, P.G. Fundamental decarburisation model of AOD process. Ironmak. Steelmak. 2013, 40, 390–397. [Google Scholar] [CrossRef]
  17. Andersson, N.Å.; Tilliander, A.; Jonsson, L.T.; Jönsson, P.G. An in-Depth Model-Based Analysis of Decarburization in the AOD Process. Steel Res. Int. 2012, 83, 1039–1052. [Google Scholar] [CrossRef]
  18. Nakamura, Y.; Ohno, T.; Segawa, K. Carbon and O in molten high-Cr-Fe alloys in equilibrium with chromium oxide. In Proceedings of the International Conference on the Science and Technology of Iron and Steel, Tokyo, Japan, 7–11 September 1971; Volume 1, pp. 456–459. [Google Scholar]
  19. Xiao, Y.; Holappa, L. Determination of activities in slags containing chromium oxides. ISIJ Int. 1993, 33, 66–74. [Google Scholar] [CrossRef] [Green Version]
  20. Warchulski, R.; Juszczuk, P.; Gawęda, A. Geochemistry, petrology and evolutionary computations in the service of archaeology: Restoration of the historical smelting process at the Katowice–Szopienice site. Archaeol. Anthropol. Sci. 2018, 10, 1023–1035. [Google Scholar] [CrossRef] [Green Version]
  21. Sergi, R.; Neal, J.; Day, S. Petrography as a problem solving tool in continuous casting. In Proceedings of the 57th Electric Furnace Conference, New Orleans, LA, USA, 14–16 November 1999; pp. 349–360. [Google Scholar]
  22. Mostafaee, S.; Andersson, M.; Jönsson, P. Petrographic and thermodynamic study of slags in EAF stainless steelmaking. Ironmak. Steelmak. 2010, 37, 425–436. [Google Scholar] [CrossRef]
  23. Mostafaee, S.; Andersson, M.; Jönsson, P. Petrographical study of microstructural evolution of EAF duplex stainless steelmaking slags. Ironmak. Steelmak. 2011, 38, 90–100. [Google Scholar] [CrossRef]
  24. Kowalski, M.; Spencer, P.; Neuschütz. Slag Atlas, 2nd ed.; Verlag Stahleisen GmbH: Düsseldorf, Germany, 1995; pp. 56, 63, 120. [Google Scholar]
  25. Andersson, J.O.; Helander, T.; Höglund, L.; Shi, P.; Sundman, B. Thermo-Calc & DICTRA, computational tools for materials science. Calphad 2002, 26, 273–312. [Google Scholar]
  26. Maruoka, N.; Ishikawa, A.; Shibata, H.; Kitamura, S.y. Dissolution rate of various limes into steelmaking slag. High Temp. Mater. Process. 2013, 32, 15–24. [Google Scholar] [CrossRef]
  27. Kadrolkar, A.; Andersson, N.Å.; Dogan, N. A Dynamic Flux Dissolution Model for Oxygen Steelmaking. Metall. Mater. Trans. B 2017, 48, 99–112. [Google Scholar] [CrossRef]
  28. Münchberg, W.; Koch, K.; Rubens, W.; Zorcher, H. Verschleißder feuerfesten Ausmauerung und Kalkauflösung beim modifizierten AOD-Verfahren. Stahl Und Eisen 1992, 112, 49–58. [Google Scholar]
  29. Koch, K.; Rubens, W.; Münchberg, W.; Zorcher, H. Zusammensetzung von Metallbad, Schlacken und Granalien beim modifizierten AOD-Verfahren. Stahl Und Eisen 1992, 112, 91–99. [Google Scholar]
  30. Ekengård, J.; Andersson, A.; Jönsson, P.G. Distribution of metal droplets in top slags during ladle treatment. Ironmak. Steelmak. 2008, 35, 575–588. [Google Scholar] [CrossRef]
  31. Gustavsson, J.; Shoyeb, M.; Sarma, D.S.; Jönsson, P.G. Characteristics of metal droplets in slag tapped from the blast furnace. Steel Res. Int. 2006, 77, 5–13. [Google Scholar] [CrossRef]
  32. Rubens, W. Untersuchung der Schlackenwege und des Verschleisses der Feuerfesten Ausmauerung beim Modifizierten AOD-Verfahren zur Erzeugung Nichtrostender Stähle. Ph.D. Thesis, Clausthal University of Technology, Clausthal-Zellerfeld, Germany, 1989. [Google Scholar]
  33. Kriskova, L.; Pontikes, Y.; Pandelaers, L.; Cizer, Ö.; Jones, P.T.; Van Balen, K.; Blanpain, B. Effect of high cooling rates on the mineralogy and hydraulic properties of stainless steel slags. Metall. Mater. Trans. B 2013, 44, 1173–1184. [Google Scholar] [CrossRef]
Figure 1. Transfer of analysis points from a scanning electron microscopy (SEM) image to a light optical microscopy (LOM) image, where 4 represents the final result. (1) Original LOM image, (2) Overlay of SEM image on top of LOM image, (3) Mapping SEM measurement points to LOM image and (4) LOM image with SEM measurement points.
Metals 10 00308 g001
Figure 2. Example of a typical Argon Oxygen Decarburization (AOD) slag sample taken at the end of the decarburization period.
Metals 10 00308 g002
Figure 3. Schematic overview of a typical particle in a slag sample taken at the end of the decarburization period (Figure 2).
Metals 10 00308 g003
Figure 4. (Left) A LOM picture. (Right) extraction of four phases from the LOM figure using image analysis.
Metals 10 00308 g004
Figure 5. Phases in a typical AOD decarburization slag in the temperature interval 1500–2300 K calculated by using Thermo-Calc [25].
Metals 10 00308 g005
Figure 6. Method for characterization of AOD slag samples.
Metals 10 00308 g006
Table 1. Grinding sequence for petrographic samples.
StepPolishing FeltPolishing AgentPressure (kPa)Time (s)
1Lam Plan Cameo Platinum 1Water20–30120
2Lam Plan Cameo Platinum 2Water20–30120
3Lam Plan Cameo GoldLam Plan 6 MPe20–30120
4Lam Plan MM 414Lam Plan MM 14020–30120
Table 2. A typical X-ray fluorescence (XRF) chemical composition for slags including all analyzed elements (mass%).
SFSiO2MnOP2O5Cr2O3NiOTiO2V2O5Al2O3CaF2CaOFeOMgO
0.030.75.12.1027.00.250.010.320.31.558.53.62.8
Table 3. The normalized XRF chemical composition for slags from five heats, where trace elements have been excluded (mass%).
Heat No.Cr2O3FeOSiO2MnOCaOMgO
A26.95.15.23.954.74.1
B-127.23.65.12.159.02.8
B-220.02.73.51.871.01.0
B-332.04.26.22.554.11.1
C26.03.96.81.759.81.7
D22.64.31.62.665.63.3
E27.93.710.63.249.64.9
Table 4. Normalized chemical composition for slags from five heats, where CaO and MgO have been excluded (mass%).
Heat No.Cr2O3FeOSiO2MnO
A65.512.412.79.5
B-171.69.513.45.5
B-271.49.612.56.4
B-371.39.413.85.6
C67.710.217.74.4
D72.713.85.18.4
E61.58.123.37.0
Table 5. Chemical composition of phases in slags given in Figure 4, determined using energy dispersive spectroscopy (EDS) (at-%).
PhaseCaCrSiO
CaO·Cr2O3 12.8 ± 0.7 25.7 ± 1.9 - 61.5 ± 2.0
3CaO·2SiO2 23.0 - 14.2 62.8
3CaO·Cr2O3·3SiO2 11.0 8.1 10.1 70.8
Table 6. Stoichiometric theoretical chemical compositions of elements in the given phases (at%) and their melting points (°C) [24].
PhaseCaCrSiOMelting Point (°C)
CaO·Cr2O3 14.3 28.6 - 57.1 >1965
3CaO·2SiO2 25.0 - 16.7 58.3 ≈1460
3CaO·Cr2O3·3SiO215101560>1900

