Article

Review of the Energy Consumption and Production Structure of China’s Steel Industry: Current Situation and Future Development

1
School of Energy and Environmental Engineering, University of Science and Technology Beijing, Beijing 100083, China
2
China ENFI Engineering Corporation, Beijing 100038, China
3
Beijing Engineering Research Center for Energy Saving & Environmental Protection, Beijing 100083, China
*
Author to whom correspondence should be addressed.
Metals 2020, 10(3), 302; https://doi.org/10.3390/met10030302
Submission received: 17 January 2020 / Revised: 3 February 2020 / Accepted: 11 February 2020 / Published: 26 February 2020
(This article belongs to the Special Issue Challenges and Prospects of Steelmaking Towards the Year 2050)

Abstract

:
China produced 49.2% of the world’s total steel production in 2017. From 1990 to 2017, the world’s total steel production increased by 850 Mt, of which 87% came from China. After 30 years of rapid expansion, China’s steel industry is not expected to increase its production in the medium and long term. In fact, the industry is currently in the stage of industrial restructuring, and great changes will arise in production structure and technical level to solve pressing issues, such as overcapacity, high energy intensity (EI), and carbon emission. These changes will directly affect the global energy consumption and carbon emissions. Thus, a review of China’s steel industry is necessary to introduce its current situation and development plan. Therefore, this paper presents an overview of the Chinese steel industry, and factors involved include steel production, production structure, energy consumption, technical level, EI, carbon emission, scrap consumption, etc. In addition, four determinants are analyzed to explain the EI gap between China and the world’s advanced level. In addition, comparison of steel industries between China and the world, development plans for energy savings, and emission reduction are also included in this paper to give readers a clear understanding of China’s steel industry.

1. Introduction

Steel production is an energy-, resource-, and pollution-intensive process [1,2]. China is currently the world’s largest steel producer; indeed, the country’s steel production accounted for 49.2% of the world’s total steel production in 2017 [3]. The energy consumption of China’s steel industry accounted for over 20% of the national industry energy consumption in 2017, and the CO2 emissions from steel enterprises also accounted for over 10% of the country’s total CO2 emissions [4,5,6]. As such, improving the energy efficiency of steel production should be a primary concern for China, especially in times of high energy price volatility.
The rapid development of China’s steel industry began in the 1990s. From 1990 to 2017, the world’s total steel production increased by 850 Mt, of which 87% came from China [7]. Rapid expansion of production capacity has had generally positive effects on the energy efficiency of the industry, and the energy intensity (EI) of China’s steel industry decreased by 11.5% from 2006 to 2017 [8]. However, there is still a gap between the EI of China′s steel industry and the world′s advanced level.
In 2018, the production of China’s steel industry increased to 928 Mt. After years of rapid expansion, China’s steel industry is currently at the end of the stage of production growth. In fact, the industry is facing numerous pressures, such as overcapacity and resources, energy, and environmental issues. These issues must be solved under the condition of ensuring an adequate steel supply, and this is a challenge for the Chinese government.
There are various energy-efficiency opportunities that exist in China, and many existing research works on the steel industry from a technical point of view are available in the literature, and the energy saving potential of China has been assessed in scientific papers [9,10,11,12,13,14,15]. However, currently, a comprehensive review of China’s steel industry is still necessary to give readers a clear understanding of the present situation and development plan to realize the production structure adjustment and technical level upgrade.
The work presented in this paper is a unique study for the steel industry, as an extensive review of China’s steel industry was conducted in this study. This paper specifically discusses (1) the development and present situation of steel production and consumption in China; (2) the implementation rate of major energy-saving technologies, gas recovery and utilization, and secondary energy generation in key enterprises in the country; (3) the development of the overall energy intensity (EI), specific process EIs, and the EI gap in key steel enterprises between China and the world; and (4) the carbon emissions of China’s steel production and its main sources.
This paper also presents an analysis of the reasons behind the EI gap between China’s and the world’s steel industries. The factors considered include scrap ratio (SR), production structure, energy structure, and industrial concentration. In addition, development plans for major energy conservation in China’s steel industry are also introduced and analyzed. These plans include eliminating backward production capacity, developing and implementing energy-saving technologies, and adjusting production structures by increasing scrap consumption in steel production.
We hope this study could be a useful reference for global policy makers, researchers, and industrial energy users, and be helpful for energy conservation and emission reduction work of China’s steel industry.

2. Development and Present Situation of China’s Steel Industry

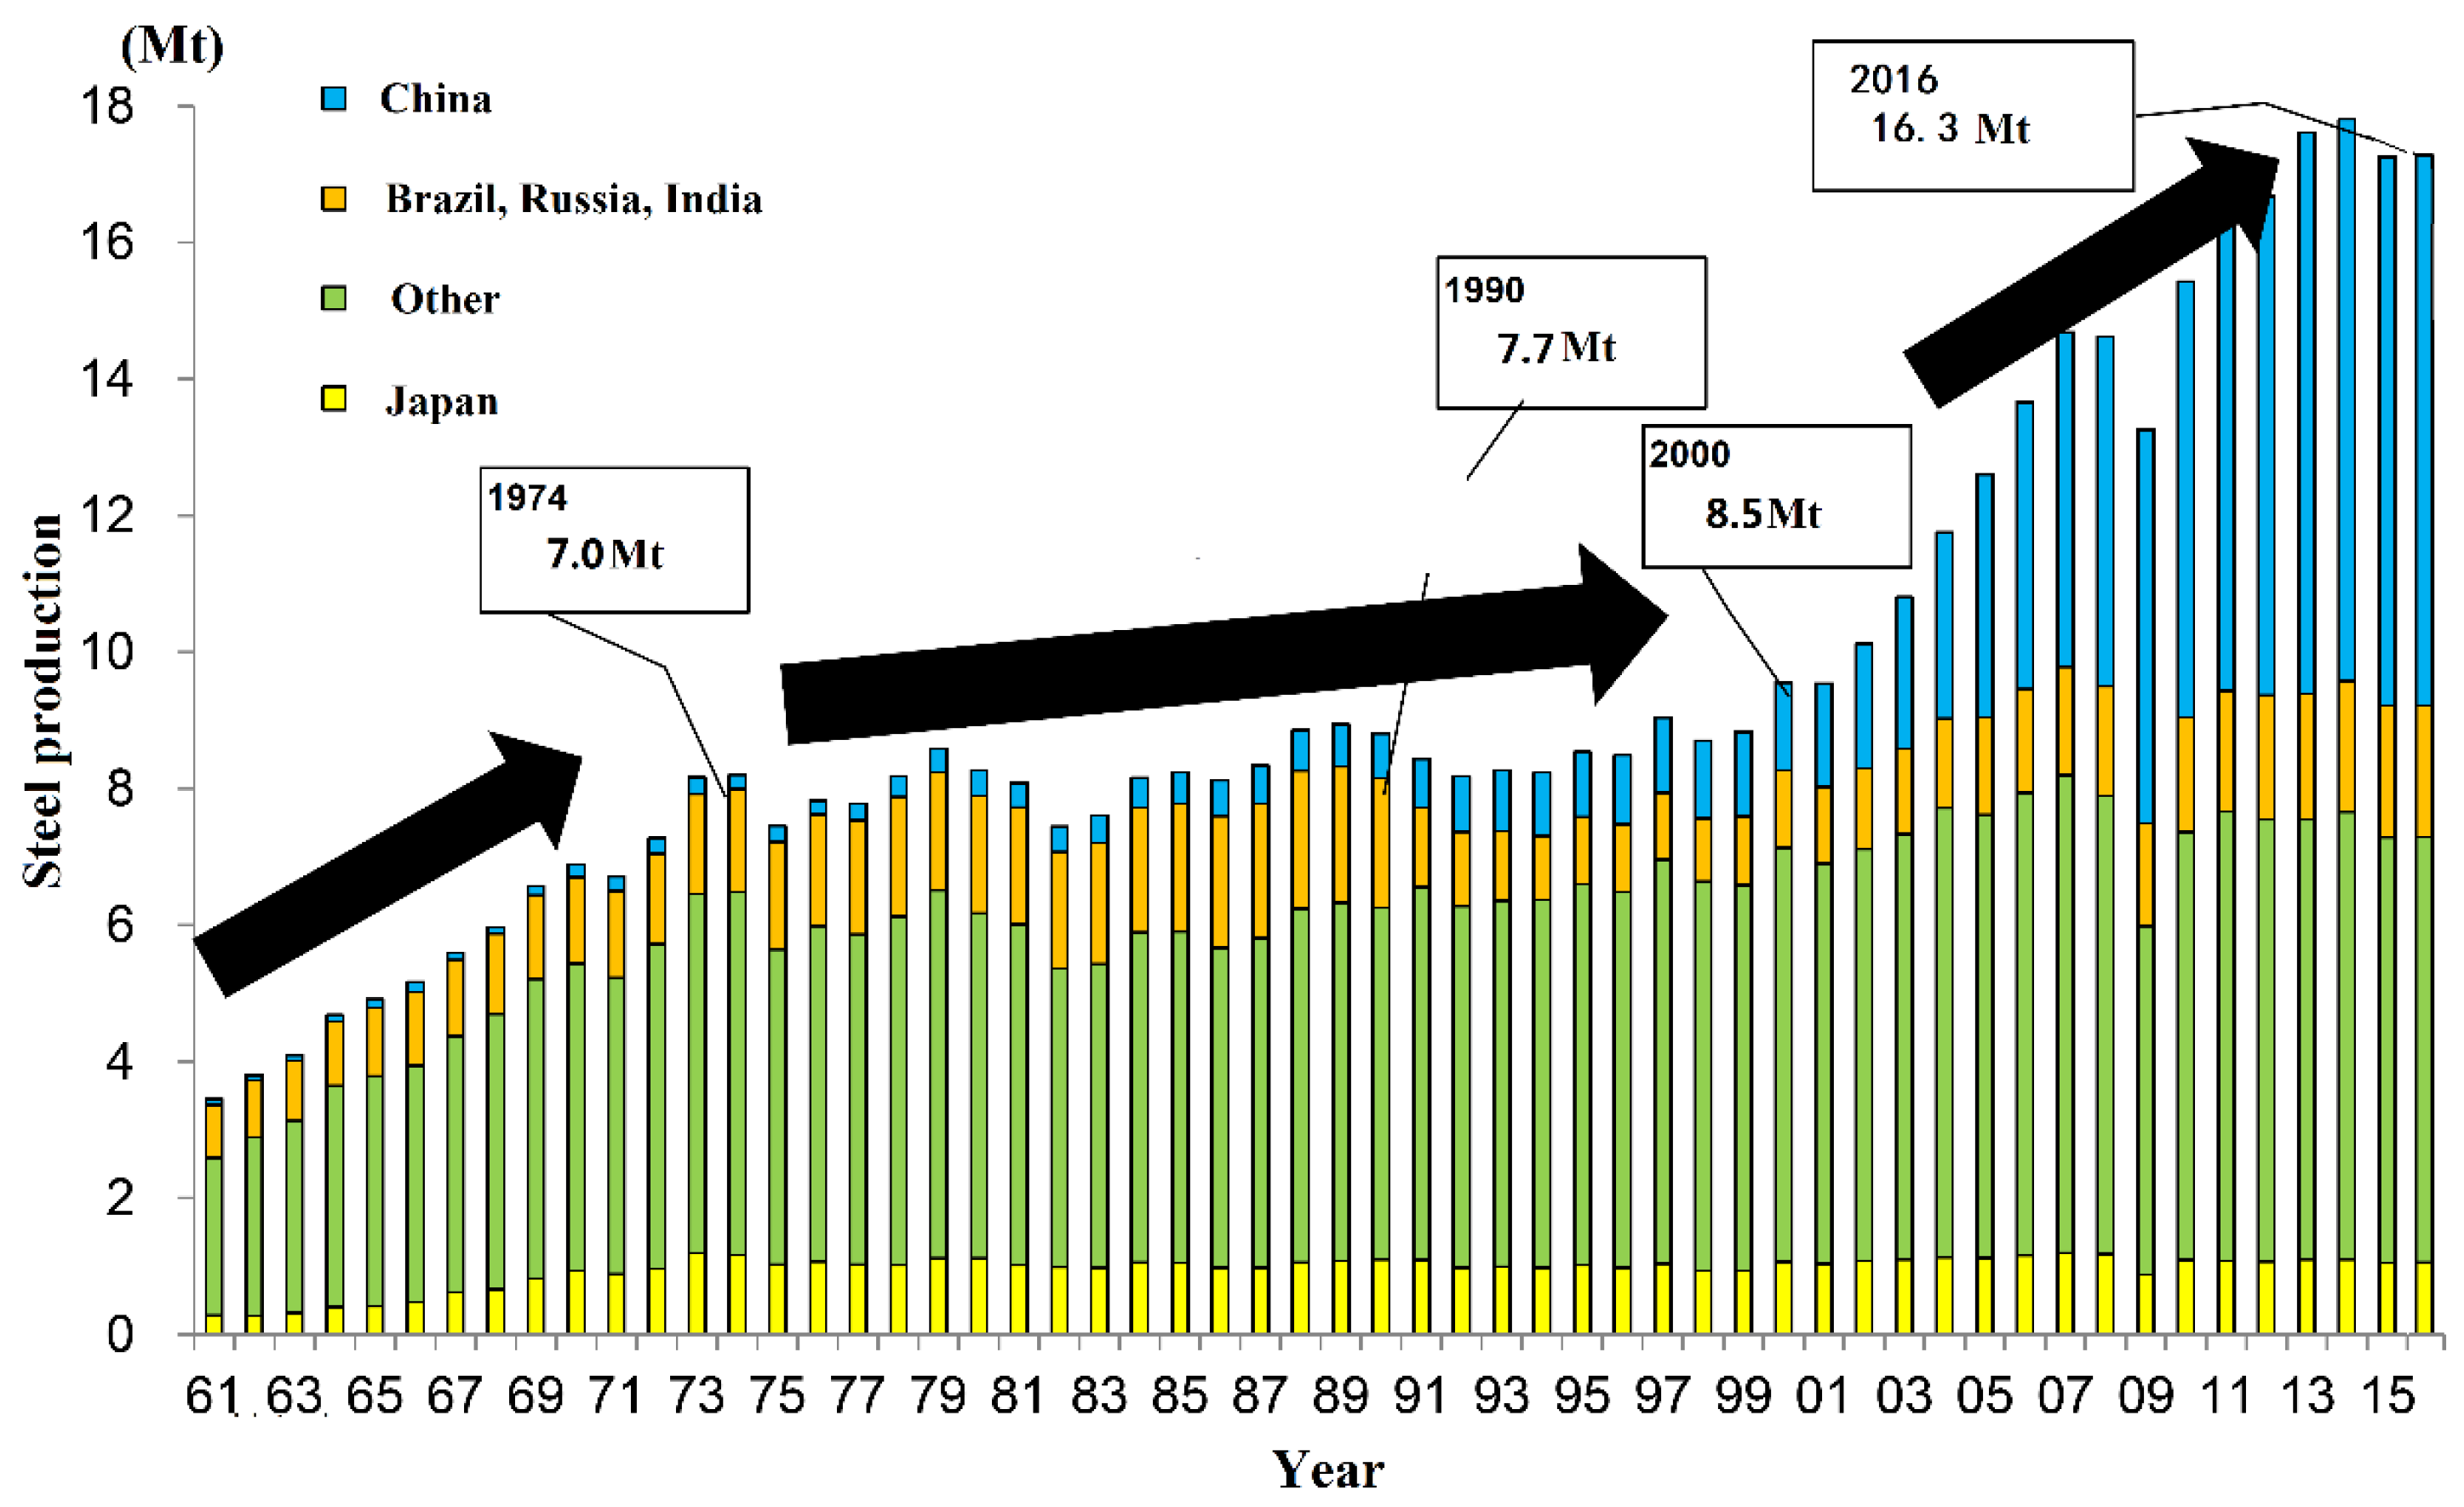
2.1. Steel Production and Consumption

The rapid development of China’s steel industry began in the 1990s, and the rise of this industry has had an important impact on the development of the global steel production (Figure 1). China became the world’s largest steel producer in 1996 and has retained this status thus far. From 1990 to 2017, the world’s total steel production increased by 850 Mt, of which 87% came from China [7].
In 2017, the world’s total steel production was 1689.4 Mt (Figure 2), and the top 10 steel producers included China (831.7 Mt), Japan (104.7 Mt), India (101.4 Mt), the United States, (81.6 Mt), Russia (71.3 Mt), South Korea (71.0 Mt), Germany (43.4 Mt), Turkey (37.5 Mt), Brazil (34.4 Mt), and Italy (24.1 Mt) [16].
As the world’s largest steel producer, China is also the world’s largest steel consumer. In 2017, China’s steel consumption accounted for 46.4% of the world’s total steel consumption; by comparison, European Union (EU) countries and North American Free Trade Agreement (NAFTA) countries accounted for 10.2% and 8.9% of the world’s total steel consumption, respectively [16]. In addition, Japan accounted for 4.1% of the world’s total steel consumption, and other Asian countries consumed 15.9% of the world’s total steel (Figure 3).

2.2. Production Route

Iron and steel industry has a complex structure. However, only a limited number of routes are applied worldwide, and these production routes use similar energy resources and raw materials (Figure 4). Globally, steel is produced via two main routes, namely, the blast furnace–basic oxygen furnace (BF–BOF) route and the electric arc furnace (EAF) route.
In the BF–BOF route, iron ore is first processed into iron, also known as molten or pig iron. Then, the molten iron is converted into steel in a converter. After refining, casting, and rolling, the steel is delivered in the form of steel plates, section steel, or steel bars.
The EAF route uses electricity to melt scrap steel in an electric arc furnace. Additives, such as alloys, can be added during steelmaking to adjust the required chemical composition of the steel, and oxygen can be injected into the EAF. The downstream processing stages of this route, such as casting, reheating, and rolling, are similar to those of the BF–BOF route.
The key difference between the BF–BOF and EAF routes is the type of raw materials consumed. The main raw material of the BF–BOF route is iron ore (generally accounting for 70%–100% of the total raw material); scrap, pig iron, and hot-pressed iron are also added. By comparison, the EAF route produces steel using mainly recycled steel (generally accounting for over 70% of the total raw material consumed) [18]. Depending on the plant configuration and availability of recycled steel, other sources of metallic iron, such as direct reduction iron (DRI) or hot metal, can also be used in the EAF route.
In 2017, the BF–BOF and EAF routes respectively accounted for 71.6% and 28.0% of the world’s total steel production; another 0.4% of the world’s steel production was derived from the open-hearth route [3]. China, Japan, Russia, Korea, Germany, Brazil, and Ukraine, as some of the world’s major steel producers, use the BF–BOF route as their main route of steel production; the EAF route is used as the main mode of steel production in the United States, India, and Turkey (Table 1).

2.3. Production Technology Development

Given the rapid growth of China’s steel production began in the 1990s, the country’s energy consumption has also increased dramatically. Therefore, China attaches great importance to energy conservation in the steel industry. Implementing energy-saving technology is an effective way to reduce energy consumption in steel production. Over the past 30 years, China has made remarkable progress in the development of energy-saving technologies in steel production, and the technical indicators of China’s steel industry have considerably improved.

2.3.1. Implementation Rates of Coke Dry Quenching and Top Pressure Recovery Turbine Technologies

Coking and blast furnace (BF) are the highest energy-consuming processes in steel production. Using coke dry quenching (CDQ) and top-pressure recovery turbine (TRT) technologies can effectively reduce the EI of coking and BF. In 2000, the implementation rates of CQD and TRT technologies of China’ steel industry were only 12% and 14%, respectively (Table 2). After years of development, the implementation rates of CQD and TRT technologies increased to 90% and 99% in 2015, respectively, and the total number of CDQ units in China now exceeds 200 sets (processing capacity 25,000 t/h). Approximately 700 TRT-equipped BFs exist in China, of which 597 are gas dry dedusting equipment [19,20].

2.3.2. By-Product Gas Recovery and Utilization

By-product gas resources are the most important secondary energy resource in steel production. A large amount of energy can be saved by recycling and utilizing by-product gas resources. The recovery and utilization rates of China’s key steel enterprises are relatively high (Table 3), and over 98% of the BF gas and coke oven gas produced was recycled, and converter gas recovery was 114 m3/t in 2017 [19,20].

2.3.3. Power Generation from Secondary Energy

Energy consumption for steel production only accounts for 30% of the total energy consumption, and the remaining 70% of the energy consumed is converted into various forms of waste heat and residual energy, such as by-product gas resources, the sensible heat of slag, and the waste heat of products [20,21]. These waste heat and residual energy resources can be used to preheat materials, generate steam or self-contained power plants, and generate power.
In 2017, power generation from secondary energy resources in China’s key steel enterprises accounted for approximately 41.3% of the total electricity consumption (Figure 5), of which 57.8% originated from by-product gas, 16.2% from TRT, 11.7% from CDQ, 5.0% from sintering waste heat, and 9.3% from other secondary energy sources [19].

2.4. Energy Consumption

Steel enterprises use numerous energy evaluation indicators, such as comprehensive EI and comparable EI, as well as EI indicators for coking, sintering, pelletizing, ironmaking, steelmaking, and rolling process. In this section, the EI of China’s steel industry is comprehensively described through an exhaustive analysis of various indicators.

2.4.1. Overall Energy Consumption

The comprehensive EI includes all forms of energy directly consumed by steel enterprises and their auxiliary production systems and the total amount of energy actually consumed by subsidiary production systems directly serving the production of steel enterprises [22]. The comprehensive EI is calculated as follows:
e Comprehensive = E i P ,
where E i is the energy consumption of the i category energy, kgce; P is the steel production, t.
From 2006 to 2017, the comprehensive EI of China’s steel industry decreased from 645 kgce/t to 571 kgce/t (decrease by 11.5%) [19,23,24]. This reduction shows that China’s steel enterprises have made remarkable progress in increasing their overall energy efficiency (Figure 6).

2.4.2. EI of the Production Process

The EI of the production process reflects the energy consumption of the main production processes in steel production. From 2006 to 2017, the EI of the production process of China’s key steel enterprises decreased dramatically: The EI of sintering, pelletizing, coking, BF, and steel processing respectively decreased by 12.8%, 20.1%, 19.0%, 9.6%, and 5.0%, respectively (Table 4) [19,23,24,25].

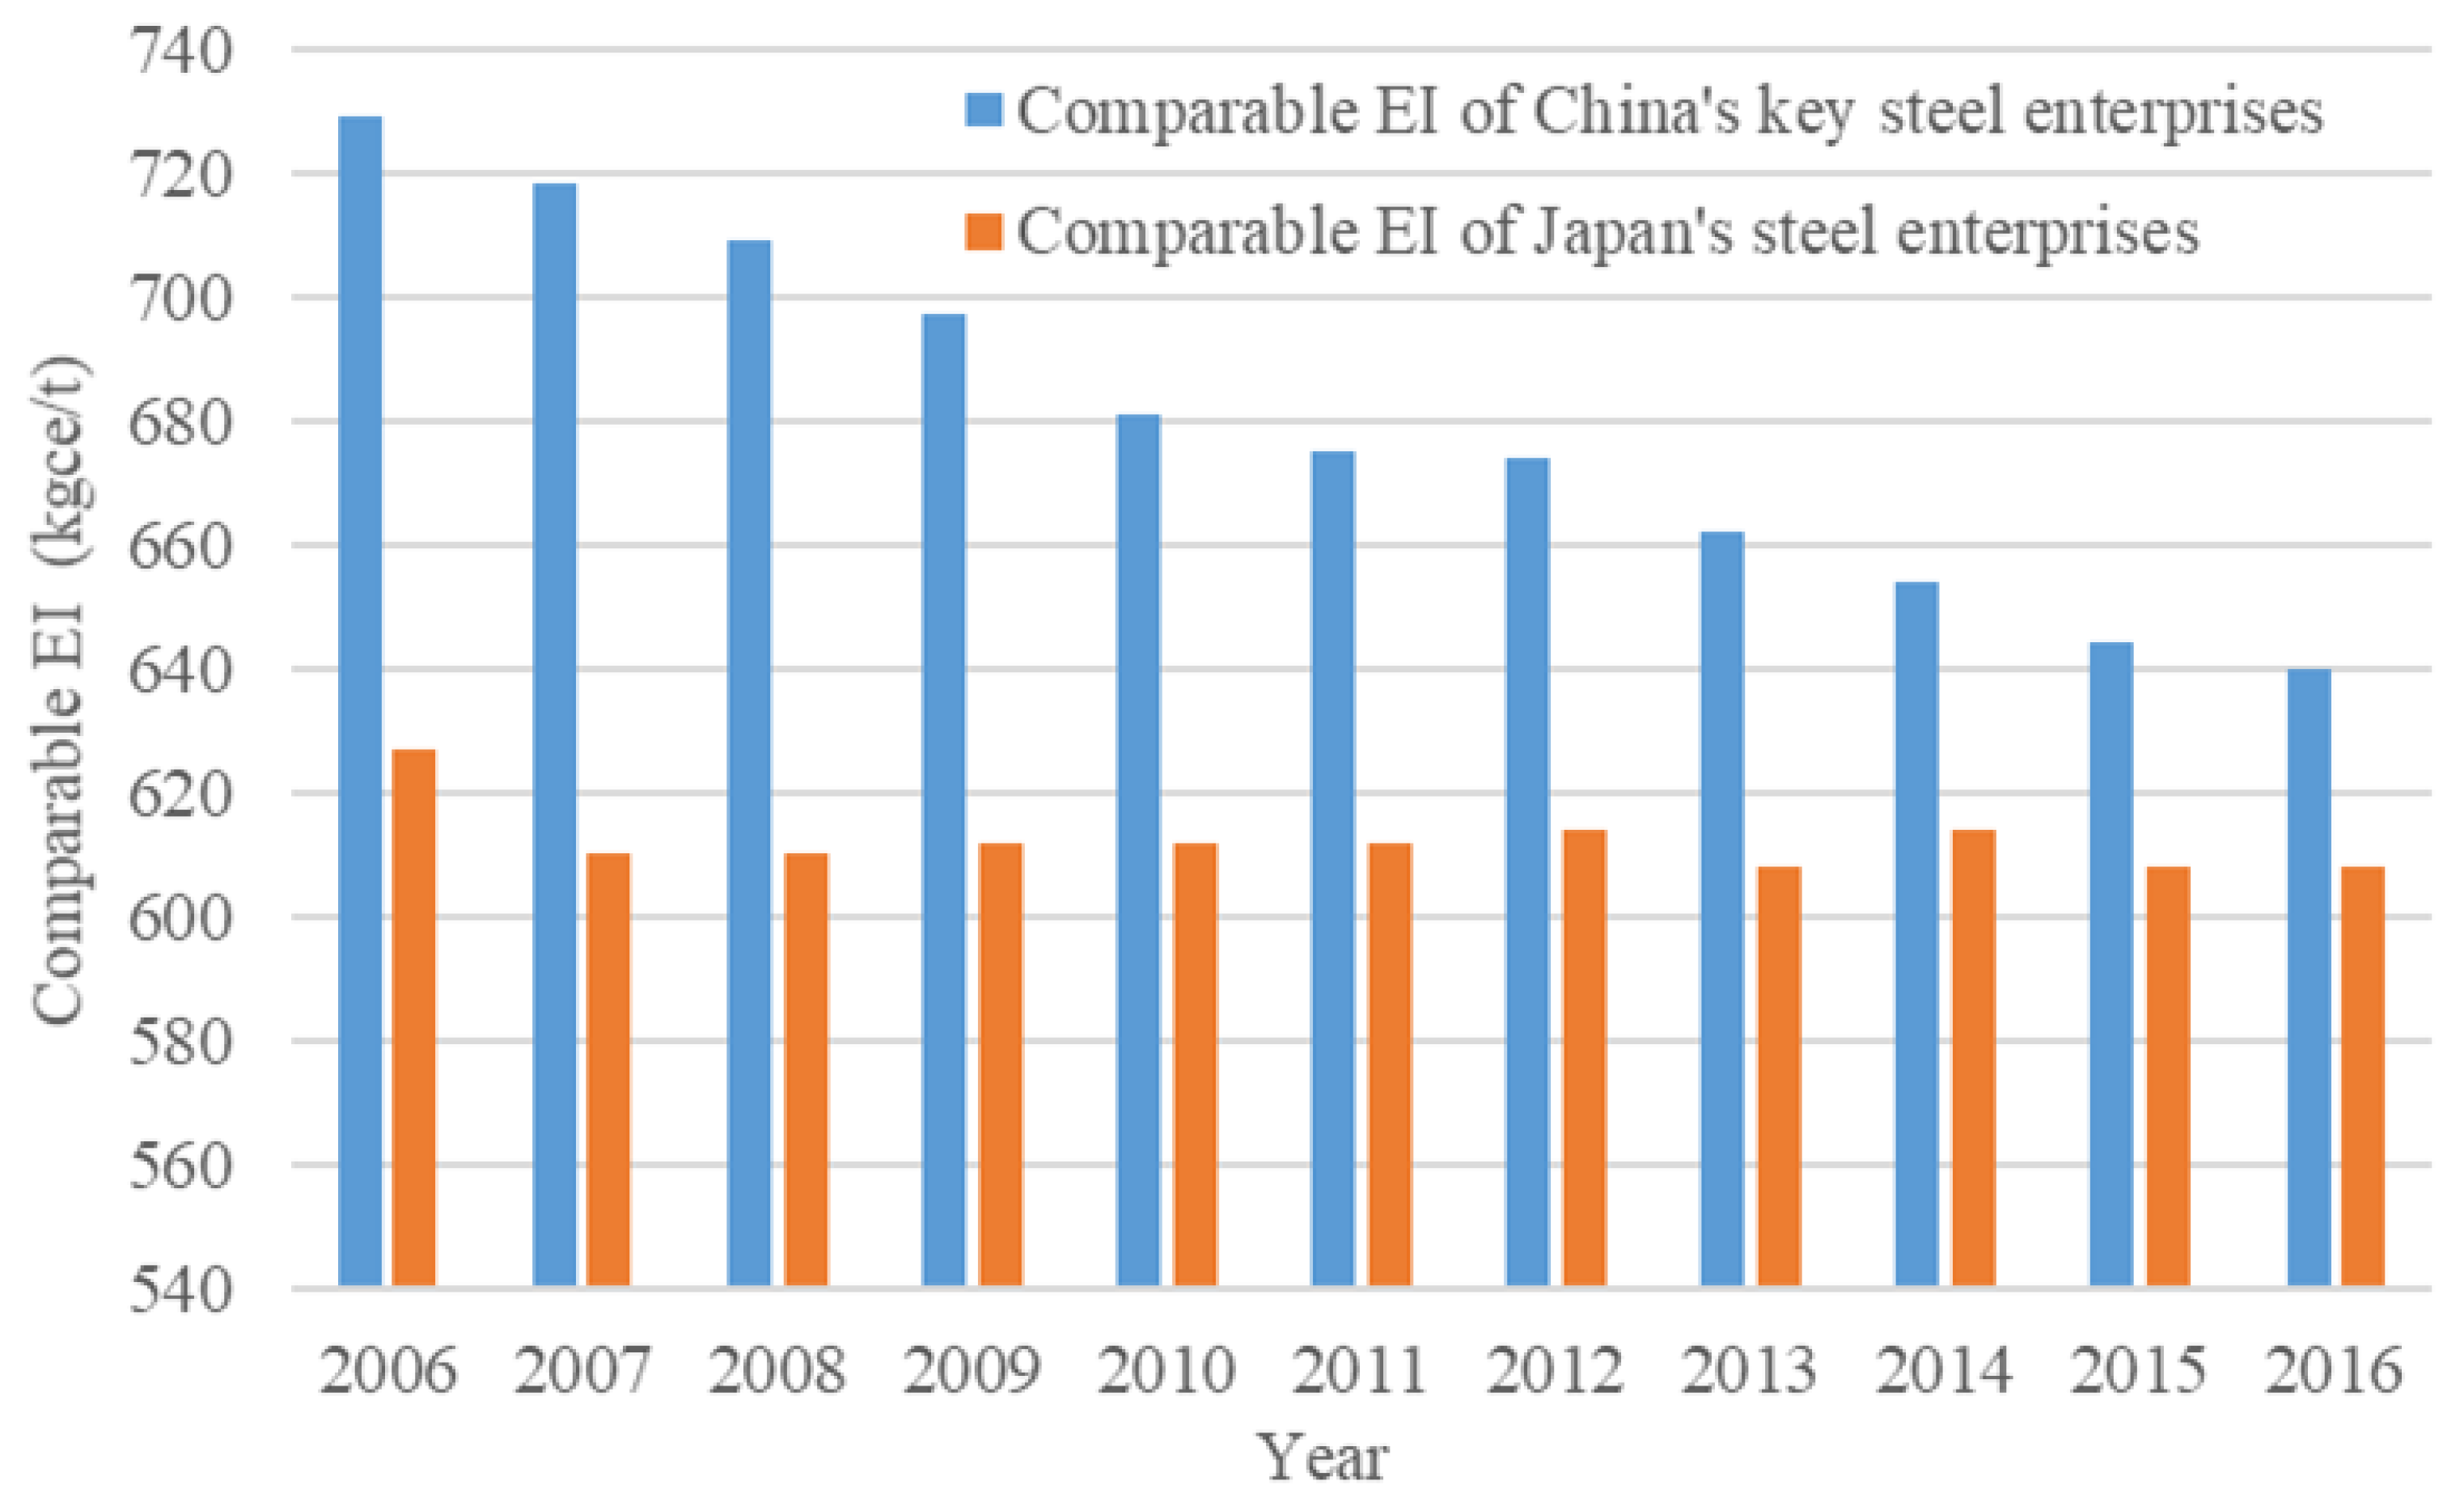
2.4.3. Comparison of EIs between Steel Industries in China and the World

Comparable EI is used to compare the energy consumption of steel production in different enterprises or countries; this parameter represents the sum of energy consumption in each production process [26]. The Comparable EI is calculated as:
e Comparable = ( 1 / P ) ( P i × e i + I + J + K ) ,
where P i is the production of i process, t;
e i is the average energy consumption of the i process, kgce/t product;
I ,   J , and K are the energy consumption for processing and transportation of fuel, energy consumption for locomotive transportation, and changes in enterprise energy stock, respectively.
According to the International Energy Agency (IEA) and the Research Institute of Innovative Technology for the Earth [27,28], Japan possesses the world’s most energy-efficient steel industry. All steel mills in Japan use existing technologies with minimal potential for further energy-conservation measures.
China’s steel industry has achieved good results in reducing energy consumption over the last 20 years (Figure 7). However, a wide gap remains between the steel industries of China and Japan [8].

2.5. CO2 Emissions

Traditional steel production relies heavily on fossil fuels, such as coal and coke. Therefore, China’s steel industry has become the second largest national emitter of CO2 after the power industry. In 2015, CO2 emitted by China’s steel enterprises accounted for over 15% of the country’s total CO2 emissions [5,6].
CO2 emission from steel enterprises is mainly caused by coal combustion. Coal accounts for approximately 80% of the energy consumption structure in China’s steel enterprises [4]. According to statistics, CO2 emissions from China’s iron-making system (sintering, pelletizing, coking, and blast furnace) account for approximately 85% of the total emissions from the steel industry [29,30]. Therefore, reducing CO2 emissions from the iron front process is imperative.
In 2015, at the Paris Climate Conference, the Chinese government proposed reducing CO2 emissions per unit GDP by 65% compared with 2005 levels by 2030 and establishing a national carbon emissions trading market in 2017 [30]. The latter proposal will integrate eight industries, including electricity, steel, and cement, into one system to promote overall carbon emission reduction. Therefore, China’s steel enterprises are facing the severe situation of CO2 emission reduction.
Using scrap instead of iron ore can directly reduce the production of the iron-making system and drastically reduce energy consumption and CO2 emissions. The EI of direct steel-making with scrap is only 30% that of the BF–BOF route. This finding indicates that using one ton of scrap in China’s steel production can save 350 kgce and reduce CO2 emissions by 1.4 tons [31].
At present, scrap consumption per ton of steel in China is far below the world’s average level (specific description is in Section 3.1). In the future, China’s recyclable scrap resources will increase substantially as the scrap consumed in previous decades gradually reaches their recycling cycle, and increasing the use of scrap steel in steel production will become an inevitable trend.

3. Comparison of Steel Industries between China and the World

Over the last two decades, China’s steel industry has made remarkable achievements in reducing its EI by improving technology levels and promoting energy-saving technologies; these efforts have resulted in considerable reductions in the energy consumption of steel production. However, a gap still remains between the EIs of key enterprises between China and the world’s advanced level. Therefore, in the future, reducing energy consumption will remain a key issue for China’s steel industry. In this section, the main reasons behind this EI gap are analyzed by comparing steel production in China and other countries.

3.1. Difference in Scrap Ratio

Iron ore and scrap steel are the two main raw materials for steel production. Compared with that of iron ore, using scrap in steel production can save energy and resources by reducing the production of iron-making systems. SR is used to define scrap consumption in steel production:
S crap   ratio = S crap   consumption steel   production
Over the last 10 years, the SR of the global steel industry remained at 35%–40%, and is approximately 37% on average. Among the world’s major steel-producing countries, the United States has the highest SR of 75%, which fluctuates considerably. The EU’s SR is also high at approximately 55%–60%, South Korea’s average is approximately 50%, and Japan’s average is approximately 35% [32]. The SR of China’s steel industry was only 11.2% in 2016. The consumption of scrap resources per ton of steel in China is considerably lower than the global average, and this gap has a negative impact on energy conservation because processing of iron ore into hot metal requires a large amount of energy and resources.
A low SR leads to the dependence of China’s steel enterprises on iron ore as the main raw material. The SR and iron–steel ratios of key steel enterprises in China from 2006 to 2016 are calculated according to China Steel Yearbook [33]. As shown in this Figure 8, the scrap ratio of China’s key enterprises declined from 2006 to 2016, and the corresponding iron–steel ratio showed an opposite increasing trend. This dependence explains why the iron–steel ratio of the country’s iron-making system is higher than that of other countries.
In 2016, China’s iron–steel ratio was 0.867; by comparison, the global average iron–steel ratio was 0.734. The global average was only 0.573 after deducting China’s iron–steel ratio [20]. The iron–steel ratios of the United States and Germany are 0.333 and 0.646, respectively. Generally, if the iron-steel ratio increases by 0.1, the comprehensive EI of steel production will increase by about 50 kgce/t, so the comprehensive EI of China is about 110–250 kgce/t higher than the advanced level just because of the high iron-steel ratio [20].

3.2. Differences in Production Structure

Energy consumption and pollutant emissions in steel enterprises are mainly concentrated in iron-making systems (from the iron ore entering the plant to coking, sintering, pelletizing, and ironmaking). Therefore, the energy consumption of the BF–BOF route is generally higher than that of the EAF route (Figure 9). Compared with the BF–BOF route, direct steelmaking with scrap via the EAF route can save approximately 60% of the energy expenditure to produce steel and reduce CO2 emissions by 80% [34,35,36,37].
Increasing the use of the EAF route can reduce energy consumption in steel production. However, production through EAF is limited by the availability of scrap steel resources. The actual situation of scrap resources varies greatly in different countries and regions around the world. Some countries (regions) have abundant scrap resources and low prices; in this case, additional EAF steel plants can be built and additional scrap steel can be consumed in converters. For example, in the United States, the proportion of EAF steel accounts for over 60% of the total crude steel production. In some developing countries with insufficient scrap resources, the BF–BOF route remains the main mode of steel production. For example, in China, the EAF steel ratio has hovered at approximately 10% over the last few years [7].
Insufficient scrap storage is the main reason behind the low SR in China. Scrap recycling has a certain cycle, and China began to use a large number of steel products in 2000. Thus, a large gap in scrap resources exists in China. Therefore, over the last 30 years, China’s steel production growth has mainly originated from the BF–BOF route, and the production of EAF steel has been stable due to the limitation of scrap quantity.
From 2000 to 2017, the production of China’s BF–BOF route rose by over 800%; thus, the proportion of the EAF route in China has continuously declined (Figure 10). In 2017, China’s BF–BOF production accounted for 90.7% of total steel production, while its EAF production accounted for only 9.3%, which is far below the world average level (28%) [3].

3.3. Differences in Energy Structure

According to IEA statistics, the energy consumption of the steel industry in 2017 accounted for 17% of the world’s total industrial energy consumption. In terms of total energy consumption, coal is the main energy source (64% of the total energy consumption), followed by electricity (20% of the total energy consumption) and natural gas (11% of the total energy consumption) [4]. Oil contributes only 1% of the energy consumption. The remaining energy consumption is provided by other types of energy, such as biomass (Figure 11).
The energy structures of different countries vary remarkably. For example, coal and natural gas account for 76% and 2% of energy consumption in China’s steel industry, respectively [4]. By contrast, only 24% of the energy consumption of the United States comes from coal; 47% comes from natural gas (Figure 12). The energy structures of different steel-producing countries differ, and the industrial conversion efficiencies of different kinds of energy vary. Thus, differences in energy structure will have a certain impact on the energy efficiency of steel production.
In industrial production, the energy efficiency of natural gas is higher than that of coal regardless of their use in fuel or power generation, and the carbon emission of natural gas is lower than that of coal. Using 1 m3 of natural gas can save 0.76–1.19 kgce and reduce carbon emissions by 3.33–5.01 g compared with the using coal [38]. At present, the main energy source of steel production in China is coal, and the proportion of natural gas in the energy consumption of China’s steel industry is drastically lower than the world average; this situation is unfavorable for energy savings and carbon emission reduction.

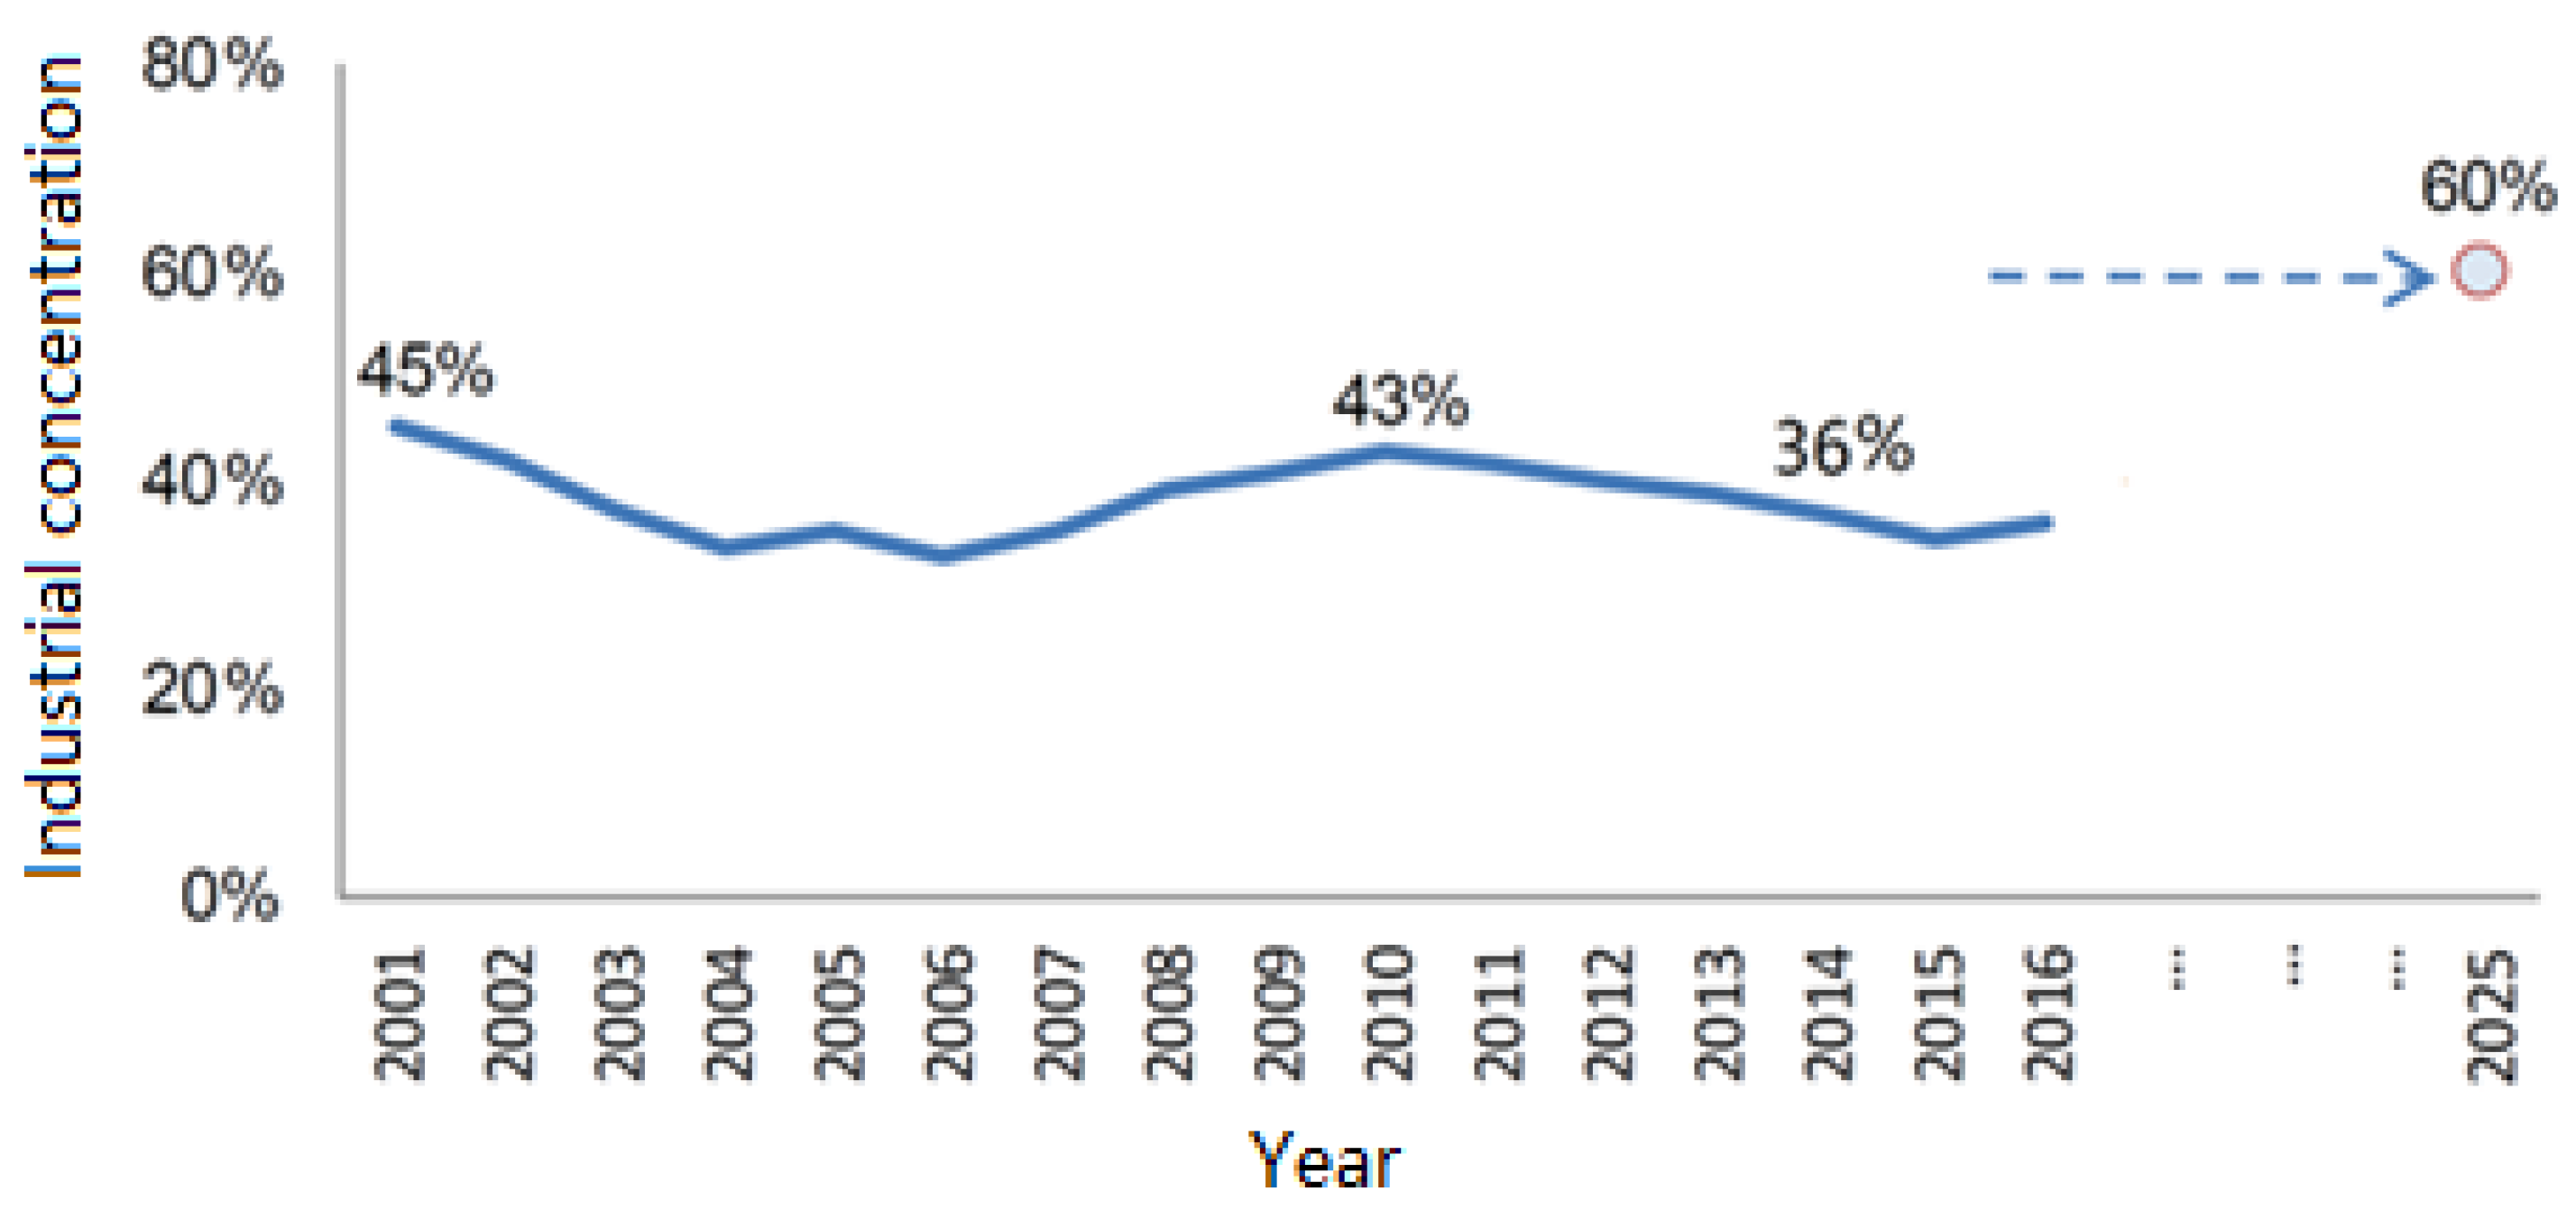
3.4. Differences in Industrial Concentration

In China, EI varies among steel enterprises of different scales, and the EI of small steel enterprises is generally higher than that of key steel enterprises, due to small size production equipment being mostly used in small steel enterprises, which are of high production energy consumption [39]. In addition, the management and technological advantages of large-scale steel enterprises allow them to consume less energy than small-scale enterprises.
Over the past decade, the concentration of China’s steel industry has shown a downward trend (Figure 13), with the concentration of the top 10 enterprises declining from 45% in 2001 to 36% in 2016. By contrast, in Japan, the concentration of the top five enterprises accounted for over 80% of the country’s total steel production, and the large-scale production of steel industry has been achieved [7,40,41].
Increasing the production proportion of large-scale enterprises is a development trend in China’s steel industry. According to “Adjustment Policy of Iron and Steel Industry” published in 2015, the concentration of the top 10 steel enterprises in China should not be less than 60% by 2025, and three or five super-large steel enterprise groups with strong competitiveness in the global scope should be formed.

4. Development Directions for Energy Savings and Emission Reduction in China’s Steel Industry

After decades of rapid development, China’s steel production has entered the peak arc region, and, in the medium and long term, overall steel production is not expected to increase. According to relevant plans published by the Chinese government, in the future, China’s steel industry will focus on industrial restructuring to solve problems arising from previous rapid development stage. Eliminating backward production capacity (technological upgrading), promoting energy-saving technologies, and restructuring production are key directions for energy savings and emission reduction.

4.1. Eliminating Dackward Production Capacity

Overcapacity, a common problem currently faced by the global steel industry, presents a very serious challenge to China. In 2015, the excess capacity of China’s steel industry was 336.2 Mt, accounting for 46% of the global excess capacity [42]. At the same time, China also retains backward capacity, which affects the total energy consumption of steel production. Against this background, the Chinese government published “Opinions on the Iron and Steel Industry to Eliminate Overcapacity and Realize Development from Difficulties,” which demands the following: the crude steel production capacity should be reduced by 10–150 Mt within five years from 2016, and future development should aim at industry merging and reorganization, industrial structure optimization, and resource utilization efficiency improvement.
China strictly enforces the energy conservation law and defines backward production capacity in accordance with process energy consumption. Steel production capacity that fails to meet mandatory standards, such as “Energy Consumption Limit for Products of Major Processing Units in Crude Steel Production”, should be reformed and upgraded within six months (Table 5). The steel production involved in this effort is estimated to range from 10 Mt and 150 Mt; this amount will effectively improve the energy efficiency of China’s steel industry.
China’s steel industry eliminated backward production capacity by 65 Mt in 2016 and by 55 Mt in 2017. The productivity utilization rate has increased from approximately 70% in 2015 to over 85% in 2017 [44], as shown in Table 6.

4.2. Research and Promotion of Energy-Saving and Emission-Reduction Technologies

The promotion and application of energy-saving and secondary energy-recovery technologies in steel production has always been the focus of the energy-saving work of China’s steel industry. After years of development, some major energy-saving technologies have been widely implemented in China. These technologies include sintering waste heat recovery, TRT power generation capacity, and converter gas recovery.
In the future, the progress of research and development of energy-saving technologies will further decrease the EI of steel production in China. Several domestic steel industry researchers have begun to actively pay attention to research on topics such as high-temperature and pressure dry quenching, heat recovery from coke oven riser waste, coal humidification, heat recycling from sintering waste gas waste, heat recovery from slag washing water waste, heat recovery from converter flue gas waste, comprehensive utilization of pure dry dust removal, and high-parameter gas-generating units [44] (Table 7).

4.3. Production Structure Transformation

A large amount of scrap steel resources accumulated by China is expected to reach their recycling cycle in recent years. Under these conditions, utilization of scrap steel could be expected to increase over the next few years.
According to estimations of recyclable period of steel products in China, during the 13th Five-Year Plan period, in addition to scrap vehicles, many bridges, houses and military equipment have reached the scrap period. This phenomenon will further increase China’s scrap stock. The amount of recyclable scrap steel is expected to reach approximately 200 Mt in 2020, 272.2 Mt in 2025, and 346 Mt in 2030 [37] (Figure 14). Therefore, increasing the scrap ratio is an inevitable trend in the development of China’s iron and steel industry.
The 13th Five-Year Plan is anticipated to be a major turning point for the scrap industry. Efforts to rationally utilize scrap steel resources, increase the proportion of EAF steel, and realize structural and energy savings will have tremendous potential for growth and development.
China’s crude steel production has been in the downward zone of the peak arc, and steel production is not expected to increase in the medium and long term. Pig iron production shows the same characteristics, and, given the gradual increase in scrap resources, the average decline rate of pig iron production over the long run will be higher than that of crude steel. At present, over 65% of China’s total iron production is produced by imported iron ore [33]. From a long-term perspective, the demand for iron ore will continue to decline [44] (Figure 15).
At present, 70% of energy consumption and 85% of CO2 emissions of China’s steel industry are concentrated in converting iron ore into molten iron [29,30]. The SR of China’s steel industry hovering between 10% and 15% over the last decade, and it will be not less than 25% in 2025 according to the development plan of China′s steel industry. This will make a significant contribution to reducing the energy consumption of China′s steel industry.

5. Results and Discussion

5.1. Conclusions

This paper presents a comprehensive overview of the development and current situation of China’s steel industry, including steel production, steel consumption, production structure development, energy-saving technology development, overall energy consumption, process energy consumption, and carbon emissions. The future development of the energy-saving work of China’s steel industry is also analyzed.
At present, China’s steel production is not expected to increase in the medium and long term. Pig iron production shows the same characteristics, and the demand for coke and iron ore will also continue to decline. Over the next few years, China can reduce its energy consumption and carbon emissions by eliminating backward production capacity (technological upgrading), implementing energy-saving technologies, increasing scrap consumption, and reducing the production of iron-making systems.

5.2. Policy Implications

5.2.1. Scientifically and Rationally Elimination of Backward Production Capacity

Scientific and reasonable methods should be used to achieve the capacity removal of China’s steel industry. First, uneconomical and low value-added production capacity should be reduced. Second, illegal and irregular steel enterprises should be investigated and punished in accordance with the law. Third, industry regulations should be conscientiously implemented to eliminate backward production capacity. These regulations include “Standard Conditions for Iron and Steel Industry” (revised in 2015) and “Standardized Enterprise Management Measures for Iron and Steel Industry.”

5.2.2. Improvement of the Production Technology Level

Special funds should be allocated to support the research and development of key energy-saving technologies. Energy savings and emission reduction in the steel industry should be treated as key aspects of national technological transformation. The government should increase their support for key special projects related to energy saving and emission reduction. For example, technology research should focus on key issues, such as insufficient power self-generation, low power generation efficiency, taxes and fees of power network, and the poor utilization of low-temperature waste heat in summer.

5.2.3. Normalization of the Scrap Steel Market

The consumption of scrap resources in steel production will dramatically increase as the availability of recyclable scrap in China increases. At present, China’s scrap industry has four main problems: (1) the capacity of scrap processing only accounts for 30% of the social scrap volume; this value is far from the demand of the steel industry; (2) the quality of equipment available for scrap processing is low, and dismantling lines for automobiles has not yet been extensively established; (3) reliable statistical data for the classification of scrap resources and technical standards for the scrap processing products industry are lacking; and (4) the taxation of scrap import and distribution enterprises is not conducive to scrap recycling. Therefore, management of the scrap steel industry should be improved, and scientific processing and classified sales should be implemented to meet the needs of various users and provide strong support for the transformation of the production structure of the steel industry.

Author Contributions

K.H. and X.L. prepared and revised the manuscript under the supervision of L.W. All authors contributed to the general discussion. All authors have read and agreed to the published version of the manuscript.

Funding

This work is financially supported by the National Key R&D Program of China (Grant No. 2016YFB0601101).

Conflicts of Interest

The authors declare no conflict of interest.

References

  1. Quadera, M.; Ahmed, S.; Ghazillaa, R.; Ahmed, S.; Dahari, M. A comprehensive review on energy efficient CO2 breakthrough technologies for sustainable green iron and steel manufacturing. Renew. Sustain. Energy Rev. 2015, 50, 594–614. [Google Scholar] [CrossRef]
  2. Mousa, E.; Wang, C.; Riesbeck, J.; Larsson, M. Biomass applications in iron and steel industry: An overview of challenges and opportunities. Renew. Sustain. Energy Rev. 2016, 65, 1247–1266. [Google Scholar] [CrossRef]
  3. World Steel Association. Steel Statistics Yearbook 2018; World Steel Association: Belgium, Brussels, 2019. [Google Scholar]
  4. International Energy Agency (IEA). Energy Balance Flows 2015. Available online: http://www.iea.org/Sankey/index.html (accessed on 11 January 2020).
  5. Zhang, Q.; Xu, J.; Wang, Y.; Hasanbeigi, A.; Zhang, W.; Lu, H.; Arens, M. Comprehensive assessment of energy conservation and CO2 emissions mitigation in China’s iron and steel industry based on dynamic material flows. Appl. Energy 2018, 209, 251–265. [Google Scholar] [CrossRef]
  6. Liu, H.; Fu, J.; Liu, S.; Xie, X.; Yang, X. Calculation methods and application of carbon dioxide emission during steel-making process. Iron Steel 2016, 51, 74–82. [Google Scholar]
  7. World Steel Association. Statistics. 2018. Available online: https://www.worldsteel.org/steel-by-topic/statistics.html (accessed on 11 January 2020).
  8. National Bureau of Statistics of China. China Energy Statistics Yearbook 2016–2017; China Statistics Press: Beijing, China, 2018. [Google Scholar]
  9. Tan, X.; Li, H.; Guo, J.; Gu, B.; Zeng, Y. Energy-saving and emission-reduction technology selection and CO2 emission reduction potential of China’s iron and steel industry under energy substitution policy. J. Clean. Prod. 2019, 222, 823–834. [Google Scholar] [CrossRef]
  10. Wang, X.; Wen, X.; Xie, C. An evaluation of technical progress and energy rebound effects in China’s iron & steel industry. Energy Policy 2018, 123, 259–265. [Google Scholar]
  11. Hasanbeigi, A.; Price, L.; Zhang, C.; Nathaniel, A.; Li, X.; Shangguan, F. Comparison of iron and steel production energy use and energy intensity in China and the U.S. J. Clean. Prod. 2014, 65, 108–119. [Google Scholar] [CrossRef] [Green Version]
  12. Li, Y.; Zhu, L. Cost of energy saving and CO2 emissions reduction in China’s iron and steel sector. Appl. Energy 2014, 130, 603–616. [Google Scholar] [CrossRef]
  13. Zhang, S.; Worrell, E.; Crijns, G.; Wagner, F.; Cofala, J. Co-benefits of energy efficiency improvement and air pollution abatement in the Chinese iron and steel industry. Energy 2014, 78, 333–345. [Google Scholar] [CrossRef]
  14. Wen, Z.; Meng, F.; Chen, M. Estimates of the potential for energy conservation and CO2 emissions mitigation based on Asian-Pacific Integrated Model (AIM): The case of the iron and steel industry in China. J. Clean. Prod. 2014, 65, 120–130. [Google Scholar] [CrossRef]
  15. He, F.; Zhang, Q.; Lei, J.; Fu, W.; Xu, X. Energy efficiency and productivity change of China’s iron and steel industry: Accounting for undesirable outputs. Energy Policy 2013, 54, 204–213. [Google Scholar] [CrossRef]
  16. World Steel Association. World Steel in Figures 2018; World Steel Association: Belgium, Brussels, 2019. [Google Scholar]
  17. World Steel Association. Sustainable Steel at the Core of a Green Economy; World Steel Association: Belgium, Brussels, 2012. [Google Scholar]
  18. International Energy Agency. Energy Technology Perspectives 2012; International Energy Agency: Paris, France, 2012. [Google Scholar]
  19. The Editorial Board of China Steel Yearbook. China Steel Yearbook 2018; Metallurgical Industry Press: Beijing, China, 2019. [Google Scholar]
  20. Wang, W. Energy consumption and energy saving potential analysis of China’s iron and steel industry. Metall. Manag. 2017, 8, 50–58. [Google Scholar]
  21. Ding, Y.; Deming, S. High-efficiency utilization of waste heat at fully integrated steel plant. Iron Steel 2011, 46, 88–98. [Google Scholar]
  22. Zhang, G. Research and Application of Index System for Evaluating Energy Consumption in Iron and Steel Enterprises; Northeastern University: Shenyang, China, 2013. [Google Scholar]
  23. China Iron and Steel Industry Association. Energy-Saving and Emission-Reduction. 2018. Available online: http://www.chinaisa.org.cn/gxportal/login.jsp (accessed on 11 January 2020).
  24. He, K.; Wang, L.; Zhu, H.; Ding, Y. Energy-Saving Potential of China’s Steel Industry According to Its Development Plan. Energies 2018, 11, 948. [Google Scholar] [CrossRef] [Green Version]
  25. Hao, Y. Study on Machanism and Model of Circular Economy in China’s Iron and Steel Industry. Ph.D. Thesis, University of Science and Technology, Beijing, China, 2014. [Google Scholar]
  26. National Bureau of Statistics. Handbook of Energy Statistics; China Statistics Press: Beijing, China, 2010. [Google Scholar]
  27. The Research Institute of Innovative Technology for the Earth. Estimated Energy Unit Consumption in 2010. Available online: https://www.rite.or.jp/system/en/global-warming-ouyou/download-data/E-Comparison_EnergyEfficiency2010steel.pdf (accessed on 11 January 2020).
  28. The Japanese Iron and Steel Federation. Activities of Japanese steel industry to Combat Global Warming. 2017. Available online: http://www.jisf.or.jp/en/activity/climate/documents/ActivitiesofJapanesesteelindustrytoCombatGlobalWarming.pdf (accessed on 11 January 2020).
  29. Cai, J. Air consumption and waste gas emission of steel industry. Iron Steel 2019, 54, 7–14. [Google Scholar]
  30. Wang, H.; Zhang, J.; Wang, G.; Jiang, X. Analysis of carbon emission reduction before ironmaking. China Metall. 2018, 28, 1–6. [Google Scholar]
  31. Wang, P.; Jiang, Z.; Zhang, X.; Geng, X.; Hao, S. Long-term scenario forecast of production routes, energy consumption and emissions for Chinese steel industry. J. Univ. Sci. Technol. Beijing 2014, 36, 1683–1693. [Google Scholar]
  32. Bureau of International Recycling. World steel recycling in Figure 2017; Bureau of International Recycling: Belgium, Brussels, 2018. [Google Scholar]
  33. The Editorial Board of China Steel Yearbook. China Steel Yearbook 2010–2017; Metallurgical Industry Press: Beijing, China, 2018. [Google Scholar]
  34. International Energy Agency (IEA). Energy Use in the Steel Industry. Available online: https://www.iea.org/media/workshops/2014/industryreviewworkshopoct/8_Session2_B_WorldSteel_231014.pdf? (accessed on 11 January 2020).
  35. United States Environment Protection Agency (EPA). Available and Emerging Technologies for Reducing Greenhouse Gas Emissions from the Iron and Steel Industry; EPA: Research Triangle Park, NC, USA, 2012.
  36. Zang, Y.; Liu, W.; Zhang, J. Accelerating the utilization of scrap to promote energy-saving and emission-reduction of China’s iron and steel industry. Res. Iron Steel 2010, 38, 43–46. [Google Scholar]
  37. World Steel Association. Global Steel Industry Outlook, Challenges and Opportunities. 2017. Available online: https://www.worldsteel.org/en/dam/jcr:d9e6a3df-ff19-47ff-9e8f-f8c136429fc4/International+Steel+Industry+and+Sector+Relations+Conference+Istanbul_170420.pdf.? (accessed on 11 January 2020).
  38. Sun, H.; Li, W. Natural Gas Play an Important Role in the Energy Conservation and Emissions Reduction. Pet. Plan. Eng. 2009, 20, 7–9. [Google Scholar]
  39. Zhang, C. Potential Analysis and Synergy Approaches of Energy Saving and Pollution Reduction: Case in Iron Industry; Tsinghua University: Beijing, China, 2015. [Google Scholar]
  40. Editorial Department of Metallurgical Management. Ranking of crude steel production of global steel enterprises in 2017. Metall. Manag. 2018, 6, 4–15. [Google Scholar]
  41. Lin, B.; Wu, Y.; Zhang, L. Estimates of the potential for energy conservation in the Chinese steel industry. Energy Policy 2011, 39, 3680–3689. [Google Scholar] [CrossRef]
  42. Lukas, B. Overcapacity in Steel-China’s Role in a Global Problem 2016; Alliance for American Manufacturing: Washington, DC, USA, 2016. [Google Scholar]
  43. Ministry of Industry and Information Technology of the People’s Republic of China. Steel Industry Standard Conditions 2015. Available online: http://www.miit.gov.cn/n1146285/n1146352/n3054355/n3057569/n3057577/c3571380/content.html (accessed on 11 January 2020).
  44. Research group of China Iron and Steel Industry Association. Supply Side Structural Reform of Iron and Steel Industry; China Iron and Steel Industry Association: Beijing, China, 2018. [Google Scholar]
Figure 1. Development of global steel production.
Metals 10 00302 g001
Figure 2. Top 15 global steel producers.
Metals 10 00302 g002
Figure 3. Global steel consumption in 2017 [16], with permission from World Steel Association 2019.
Metals 10 00302 g003
Figure 4. Steel production routes [17], with permission from World Steel Association 2012.
Metals 10 00302 g004
Figure 5. Power generation from secondary energy resources in China’s key steel enterprises.
Metals 10 00302 g005
Figure 6. Comprehensive EI of China’s steel industry.
Metals 10 00302 g006
Figure 7. Comparable EI of steel enterprises in China and Japan.
Metals 10 00302 g007
Figure 8. Scrap ratio and iron–steel ratio of China’s key steel enterprises.
Metals 10 00302 g008
Figure 9. Energy intensity of the BF–BOF and EAF routes.
Metals 10 00302 g009
Figure 10. Development of the BF–BOF and EAF routes in China.
Metals 10 00302 g010
Figure 11. Energy structure of the world’s steel industry.
Metals 10 00302 g011
Figure 12. Energy structures of the steel industries of China (left) and the United States (right) in 2017.
Metals 10 00302 g012
Figure 13. Industrial concentration of China’s steel industry.
Metals 10 00302 g013
Figure 14. Amount of recyclable scrap resources [37], with permission from World Steel Association 2017.
Metals 10 00302 g014
Figure 15. Trend of iron ore and scrap consumption by China’s steel industry.
Metals 10 00302 g015
Table 1. Crude steel production by process in 2017.
CountryBF–BOFEAFOpen-Hearth
(%)(%)(%)
China90.79.3-
Japan75.824.2-
U.S.31.668.4-
India44.255.8-
Russia66.930.72.4
South Korea67.132.9-
Germany70.030.0-
Turkey30.869.2-
Brazil77.621.0-
Ukraine71.86.821.5
World71.628.00.4
Table 2. Implementation rates of CDQ and TRT in China.
YearCDQTRT
200012%14%
200526%74%
201085%95%
201590%99%
Table 3. Recovery and utilization of by-product gas in China’s key steel enterprises.
YearUtilization Rate of BF Gas (%)Utilization Rate of Coke Oven Gas (%)Converter Gas Recovery (m3/t)
201698.2698.16115
201798.3498.77114
Table 4. The EI of production process of China’s key steel enterprises. (Unit: kgce/t).
YearSinteringPelletizingCokingBFConverterEAFProcessing
200655.6133.08123.11433.089.0981.2664.98
200755.2130.12121.72426.846.0381.3463.08
200855.4930.49119.97427.725.7481.5259.58
200954.5229.96113.97410.552.7873.4457.66
201052.6529.39105.89407.76−0.1673.9861.69
201154.3429.60106.65404.07−3.2169.0060.93
201250.6028.75102.72401.82−6.0867.5357.31
201349.7628.5899.87399.88−7.8162.3860.32
201449.4827.1298.15388.70−8.7366.0663.30
201548.5326.7299.66384.43−11.8960.3863.44
201647.7826.1697.46387.75−12.2465.9061.78
201748.4926.1799.67391.37−14.2660.2261.73
Table 5. Energy consumption requirements for new and reformed steel enterprises [43].
Types of EnterprisesCokingSinteringBlast FurnaceConverterCommon Steel EAFSpecial Steel EAF
New construction and transformation enterprises≤122 (Top loading)≤50≤370≤−25≤90≤159
≤127 (Tamping)
Existing enterprises≤150 (Top loading)≤55≤435≤−10≤92≤171
≤155 (Tamping)≤485 (Vanadic titanomagnetite)
Table 6. Effect of the elimination of backward productivity.
Parameter2014201520162017
Capacity (Mt)1151113410691019
Capacity reduction (Mt)31.117.16550
Capacity utilization rate (%)71.570.975.686.65
Table 7. Major technological progress and their energy-saving effect in the future.
No.TechnologyEnergy Saving EffectDevelopment PlanCoal Saving (Mtce)
1High temperature and pressure CDQ40kgce/t cokeadd more than 30 new equipments, involving 57 Mt of coke production capacity2.28
2Waste heat recovery of coke oven riser90 kg steam (0.6 MPa)/t coke (equivalent to 9 kgce/t)add more than 30 new waste heat recovery equipments, involving 57 Mt of coke production capacity0.51
3Coal moisture control6 kgce/t cokeadd more than 10 new equipments, involving 20 Mt of coke production capacity0.12
4Recycling of waste heat from sintering4 kgce/t sinterabout 40 new units, involving 80 Mt of sintering production capacity0.32
5Waste heat recovery of slag washing water40 ktce/heating cycle (1 million m2 of heating area) add more than 7000 m2 heating area, of which 2300 m2 have been added in 20162.80
6Comprehensive utilization of waste heat from converter flue gas- pure dry dedusting8 kgce/t steelapplied to 200 converters, involving 300 Mt of steel production2.40
7High parameter gas power generator unitthermal efficiency increased by over 5%, 40 ktce compared with medium temperature and medium pressure unit (enterprises with steel production of 10 Mt/year)applied to 135/65/54 MW high parameter gas generator units in 30 enterprises (steel production over 5 Mt/year), involving 250 Mt of steel production 1.00
Total9.43

