Article

Shear Band Formation in Amorphous Materials under Oscillatory Shear Deformation

by
Nikolai V. Priezjev
Department of Mechanical and Materials Engineering, Wright State University, Dayton, OH 45435, USA
Metals 2020, 10(3), 300; https://doi.org/10.3390/met10030300
Submission received: 7 January 2020 / Revised: 13 February 2020 / Accepted: 21 February 2020 / Published: 26 February 2020

Abstract

:
The effect of periodic shear on strain localization in disordered solids is investigated using molecular dynamics simulations. We consider a binary mixture of one million atoms annealed to a low temperature with different cooling rates and then subjected to oscillatory shear deformation with a strain amplitude slightly above the critical value. It is found that the yielding transition occurs during one cycle but the accumulation of irreversible displacements and initiation of the shear band proceed over larger number of cycles for more slowly annealed glasses. The spatial distribution and correlation function of nonaffine displacements reveal that their collective dynamics changes from homogeneously distributed small clusters to a system-spanning shear band. The analysis of spatially averaged profiles of nonaffine displacements indicates that the location of a shear band in periodically loaded glasses can be identified at least several cycles before yielding. These insights are important for the development of novel processing methods and prediction of the fatigue lifetime of metallic glasses.

1. Introduction

Understanding the relationship between atomic structure and elastic and plastic deformation properties of metallic glasses and other disordered solids is important for numerous structural and biomedical applications [1,2]. One major drawback that prevents the widespread use of metallic glasses is the formation of narrow, extended regions where strain becomes localized, the so-called shear bands, which lead to structural failure of the material [3,4]. It has long been recognized that localized plastic events in deformed amorphous materials involve collective rearrangements of small clusters of atoms, or shear transformations [5,6]. In recent years, the processes of shear band initiation and propagation have been extensively studied at the atomic level during startup uniaxial [7,8,9,10,11] and shear [12,13,14] deformation with a constant strain rate. While the initiation of a shear band typically occurs at a free surface during tension or compression, the transition to plastic flow in a sheared periodic domain involves the formation of a percolating cluster of mobile regions at the critical strain [12]. Remarkably, it was recently found that the structure of shear bands in metallic glasses consists of alternating dilated and densified regions, which originate from the alignment of Eshelby-like quadrupolar stress fields [15,16]. Even though strain localization is a common phenomenon in amorphous systems, the complete description of structural processes leading to material failure under imposed deformation is still missing.
In the last few years, a number of atomistic simulation studies were carried out to investigate the failure mechanism and structural relaxation in amorphous materials subjected to periodic deformation [17,18,19,20,21,22,23,24,25,26,27,28,29,30,31,32,33,34]. Notably, it was found that rapidly quenched glasses can be mechanically annealed to lower energy states during a number of subyield cycles, depending on the strain amplitude and temperature [18,24,28,29]. More recently, it was shown that even lower energy states can be accessed if the orientation of periodic shear is alternated every one or several cycles leading to the increase in strength and shear-modulus anisotropy [34]. On the other hand, if the strain amplitude is above the critical value, the yielding transition in well-annealed glasses occurs after a number of shear cycles, followed by the shear band formation and stress-strain hysteresis [25]. It was further demonstrated that sufficiently large samples under strain-controlled, tension-compression loading exhibit cyclic softening and reduced fatigue lifetime [27]. Moreover, upon cyclic loading after strain localization, the potential energy within the shear band increases and the particle motion becomes diffusive, whereas the glass outside the shear band continues annealing and particle motions are subdiffusive [33]. However, despite extensive research, the exact mechanism of the shear band initiation and growth during oscillatory deformation needs to be further clarified.
In this paper, the yielding transition and shear band formation in cyclically deformed binary glasses are studied using molecular dynamics simulations. The model glass is first annealed well below the glass transition temperature with different cooling rates, and then subjected to periodic shear with the strain amplitude greater than the critical value. It will be shown that while the yielding transition, marked by the decrease in shear stress and potential energy amplitudes, takes place during one shear cycle, the fatigue time is longer for more slowly annealed glasses. Moreover, the temporal evolution of spatial distributions and averaged profiles of nonaffine displacements indicates that the location of a shear band can be predicted at least several cycles before yielding.
The reminder of the paper is organized as follows. The next section contains a description of molecular dynamics simulations and the deformation procedure. The time dependence of the potential energy and shear stress, spatial distribution of nonaffine displacements, as well as the analysis of the nonaffinity correlation function and nonaffine displacement profiles are presented in Section 3. Brief conclusions are provided in the last section.

2. Molecular Dynamics (MD) Simulations

In our study, the model glass is represented by the Kob-Andersen (KA) binary mixture of two types of atoms, α , β = A , B , with strongly non-additive interaction between different types of atoms, which prevents formation of the crystalline phase [35]. The parametrization of the KA binary mixture is similar to the model of the amorphous metal-metalloid alloy Ni 80 P 20 studied by Weber and Stillinger [36]. Here, we consider a relatively large system that consists of 800,000 atoms of type A and 200,000 atoms of type B, with the total number of atoms equal to 10 6 . These atoms interact via the pairwise Lennard-Jones (LJ) potential, as follows:
V α β ( r ) = 4 ε α β σ α β r 12 σ α β r 6 ,
with the standard parametrization ε A A = 1.0 , ε A B = 1.5 , ε B B = 0.5 , σ A A = 1.0 , σ A B = 0.8 , σ B B = 0.88 , and m A = m B [35]. In order to speed up computation of the interaction forces, the LJ potential was truncated at the cutoff radius r c , α β = 2.5 σ α β . For convenience, the simulation results are presented in the LJ units of length, mass, energy, and time: σ = σ A A , m = m A , ε = ε A A , and, consequently, τ = σ m / ε . The simulations were carried out using the LAMMPS parallel code [37,38], where the equations of motion were solved numerically using the velocity-Verlet algorithm with the time step t M D = 0.005 τ [39].
The binary mixture was first equilibrated in the liquid state at the temperature T L J = 1.0 ε / k B , where k B is the Boltzmann constant. The system temperature was regulated via the Nosé-Hoover thermostat [37,39]. The MD simulations were conducted in a periodic box at constant volume and the corresponding density ρ = ρ A + ρ B = 1 . 2 σ 3 . It was previously demonstrated that at this density, the critical temperature of the KA model is T c = 0.435 ε / k B [35]. After equilibration, the binary mixture was linearly cooled to the low temperature T L J = 0.01 ε / k B with the rates 10 2 ε / k B τ , 10 3 ε / k B τ , 10 4 ε / k B τ , and 10 5 ε / k B τ , while keeping the volume constant. The linear size of the simulation box is 94.10 σ .
Once the system was brought to the low temperature T L J = 0.01 ε / k B , it was subjected to oscillatory shear deformation at constant volume, as follows:
γ ( t ) = γ 0 sin ( 2 π t / T ) ,
where T = 5000 τ is the oscillation period and γ 0 = 0.075 is the strain amplitude. The periodic strain was imposed along the x z plane using the Lees-Edwards periodic boundary conditions [37,39]. The corresponding frequency of the applied deformation is ω = 2 π / T = 1.26 × 10 3 τ 1 . As discussed below, the strain amplitude, γ 0 = 0.075 , was chosen to be slightly above the critical value for the yielding transition at the density ρ = 1.2 σ 3 [24,25]. For each value of the cooling rate, the simulations were performed only in one sample. During oscillatory deformation, the potential energy, stress components, system dimensions, and atomic configurations were regularly saved for the post-processing analysis.

3. Results

A number of recent molecular dynamics simulations studies have shown that disordered solids under cyclic loading either continue exploring deeper energy states at sufficiently small strain amplitudes or eventually undergo a transition to plastic flow within a shear band if the strain amplitude is above a certain value [18,19,24,25,28,29,33,34]. The precise determination of the critical strain amplitude, however, is a challenging problem because the number of cycles required to reach a dynamic steady state appears to diverge upon approaching the critical value [18,19]. In addition, the estimate of the critical amplitude for binary glasses was shown to be system size [18] and temperature [17,29,33] dependent. Therefore, in the present study, the MD simulations were performed at the strain amplitude, γ 0 = 0.075 , which is slightly larger than the critical value for the KA binary mixture at the density ρ = 1.2 σ 3 and temperatures well below the glass transition point [24,25,29,33].
The time dependence of the potential energy per atom, U / ε , is presented in Figure 1 for binary glasses initially prepared with the cooling rates 10 2 ε / k B τ , 10 3 ε / k B τ , 10 4 ε / k B τ , and 10 5 ε / k B τ . It can be seen that with decreasing cooling rate, the glasses settle at deeper potential energy minima, U ( t = 0 ) , as expected. Following the annealing process, the oscillatory shear deformation was imposed during 100 cycles with the strain amplitude γ 0 = 0.075 at the temperature T L J = 0.01 ε / k B . In all cases, the deformation first proceeds during a number of cycles with relatively large amplitudes of the potential energy variation, which is followed by the abrupt yielding transition and oscillations with a reduced amplitude. Except for the sample quenched with the fastest rate 10 2 ε / k B τ , the number of cycles to reach the yielding transition increases, and the slope of the potential energy minima versus cycle number is reduced upon decreasing cooling rate. Further insight can be gained by examining irreversible displacements of atoms over consecutive snapshots, as discussed below.
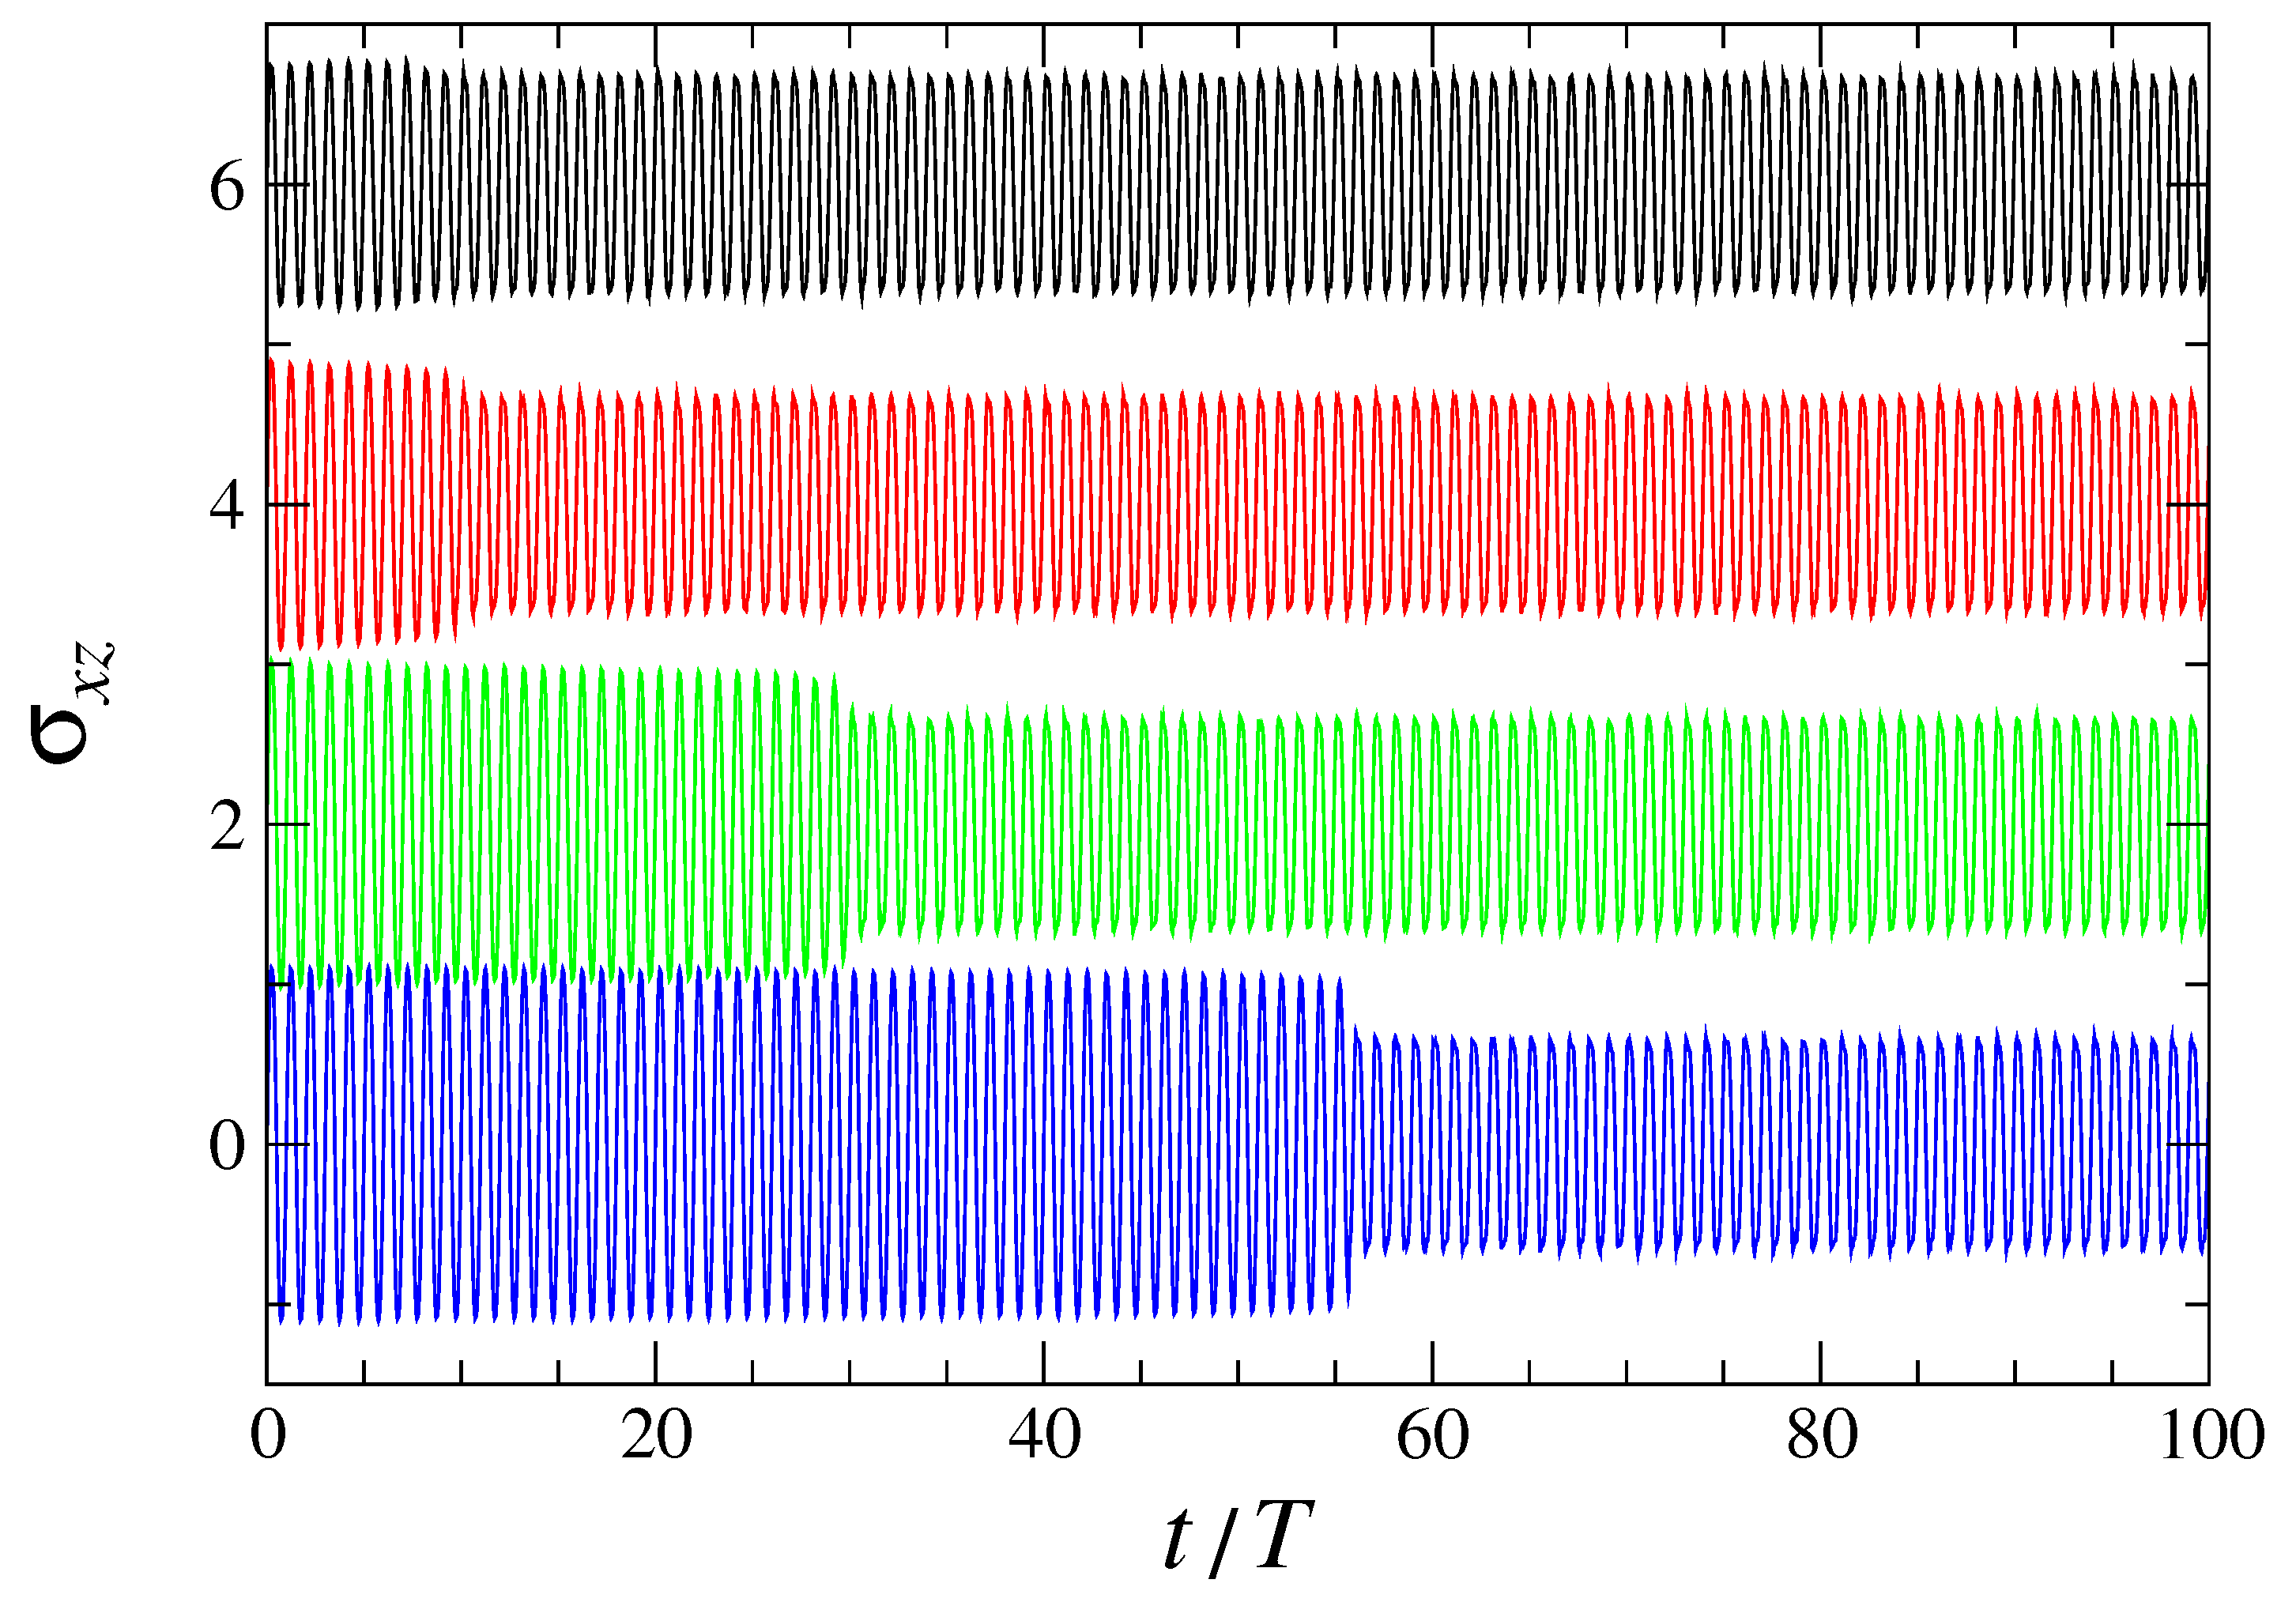
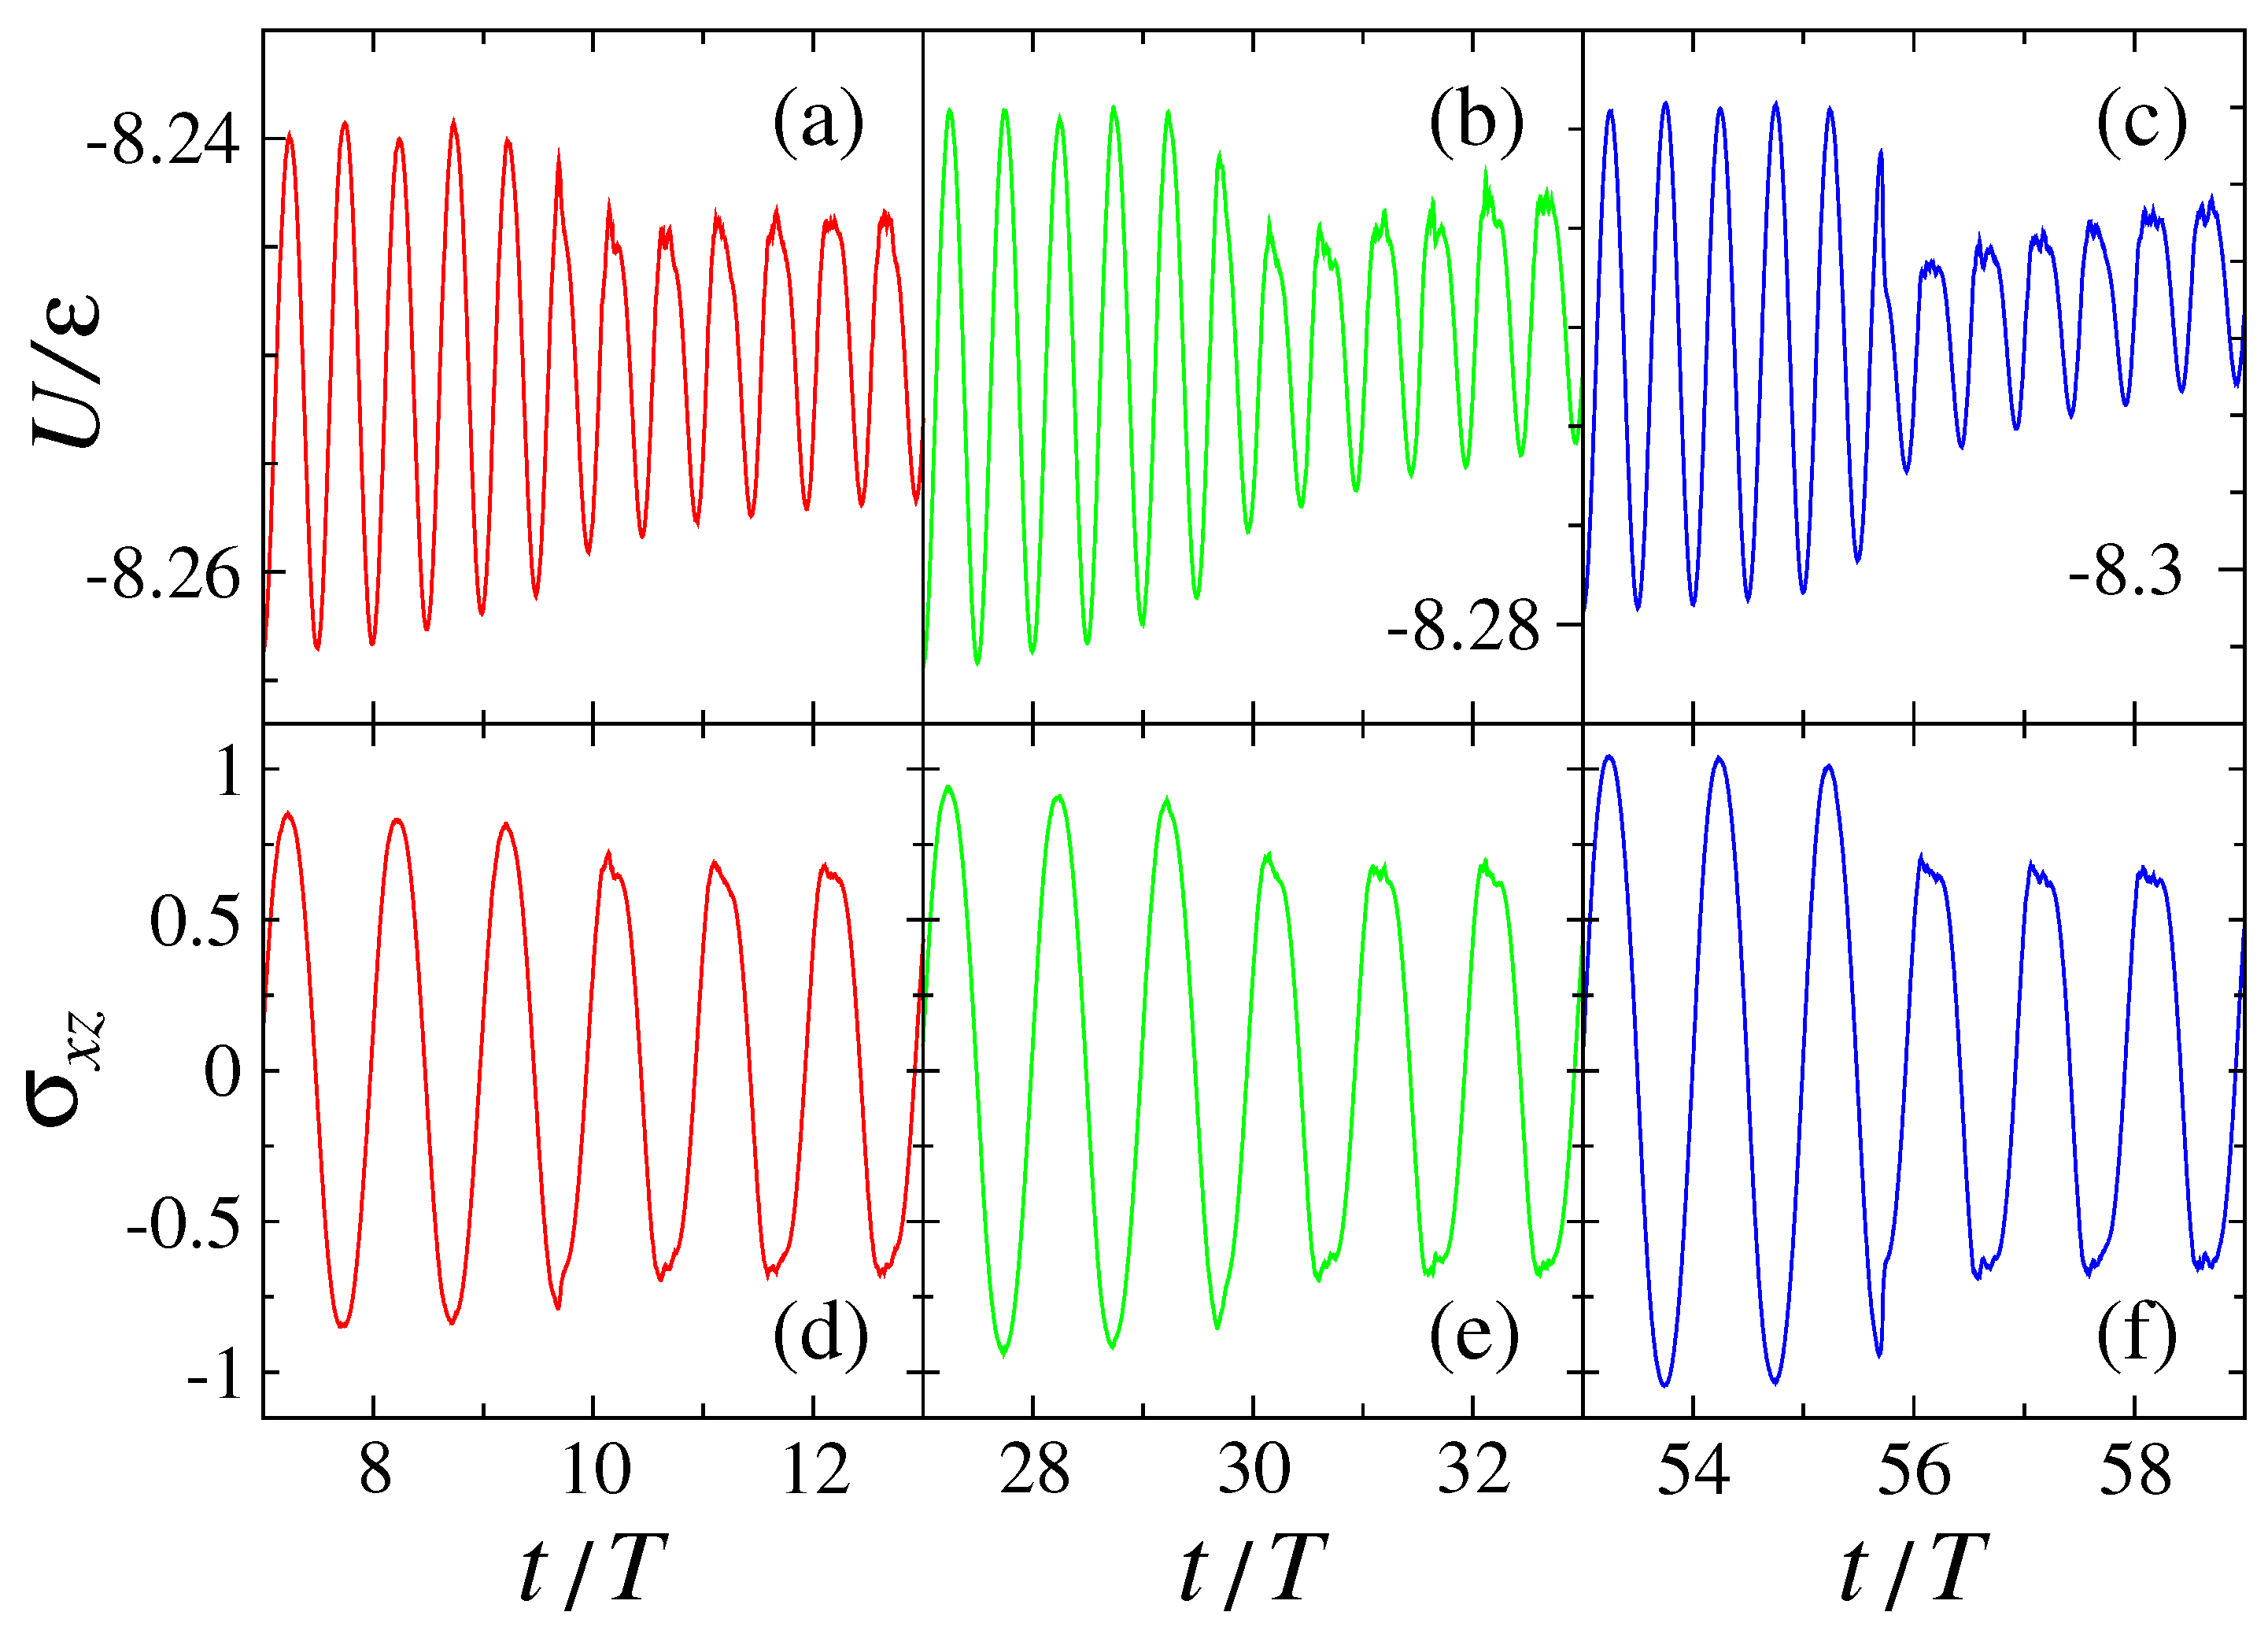
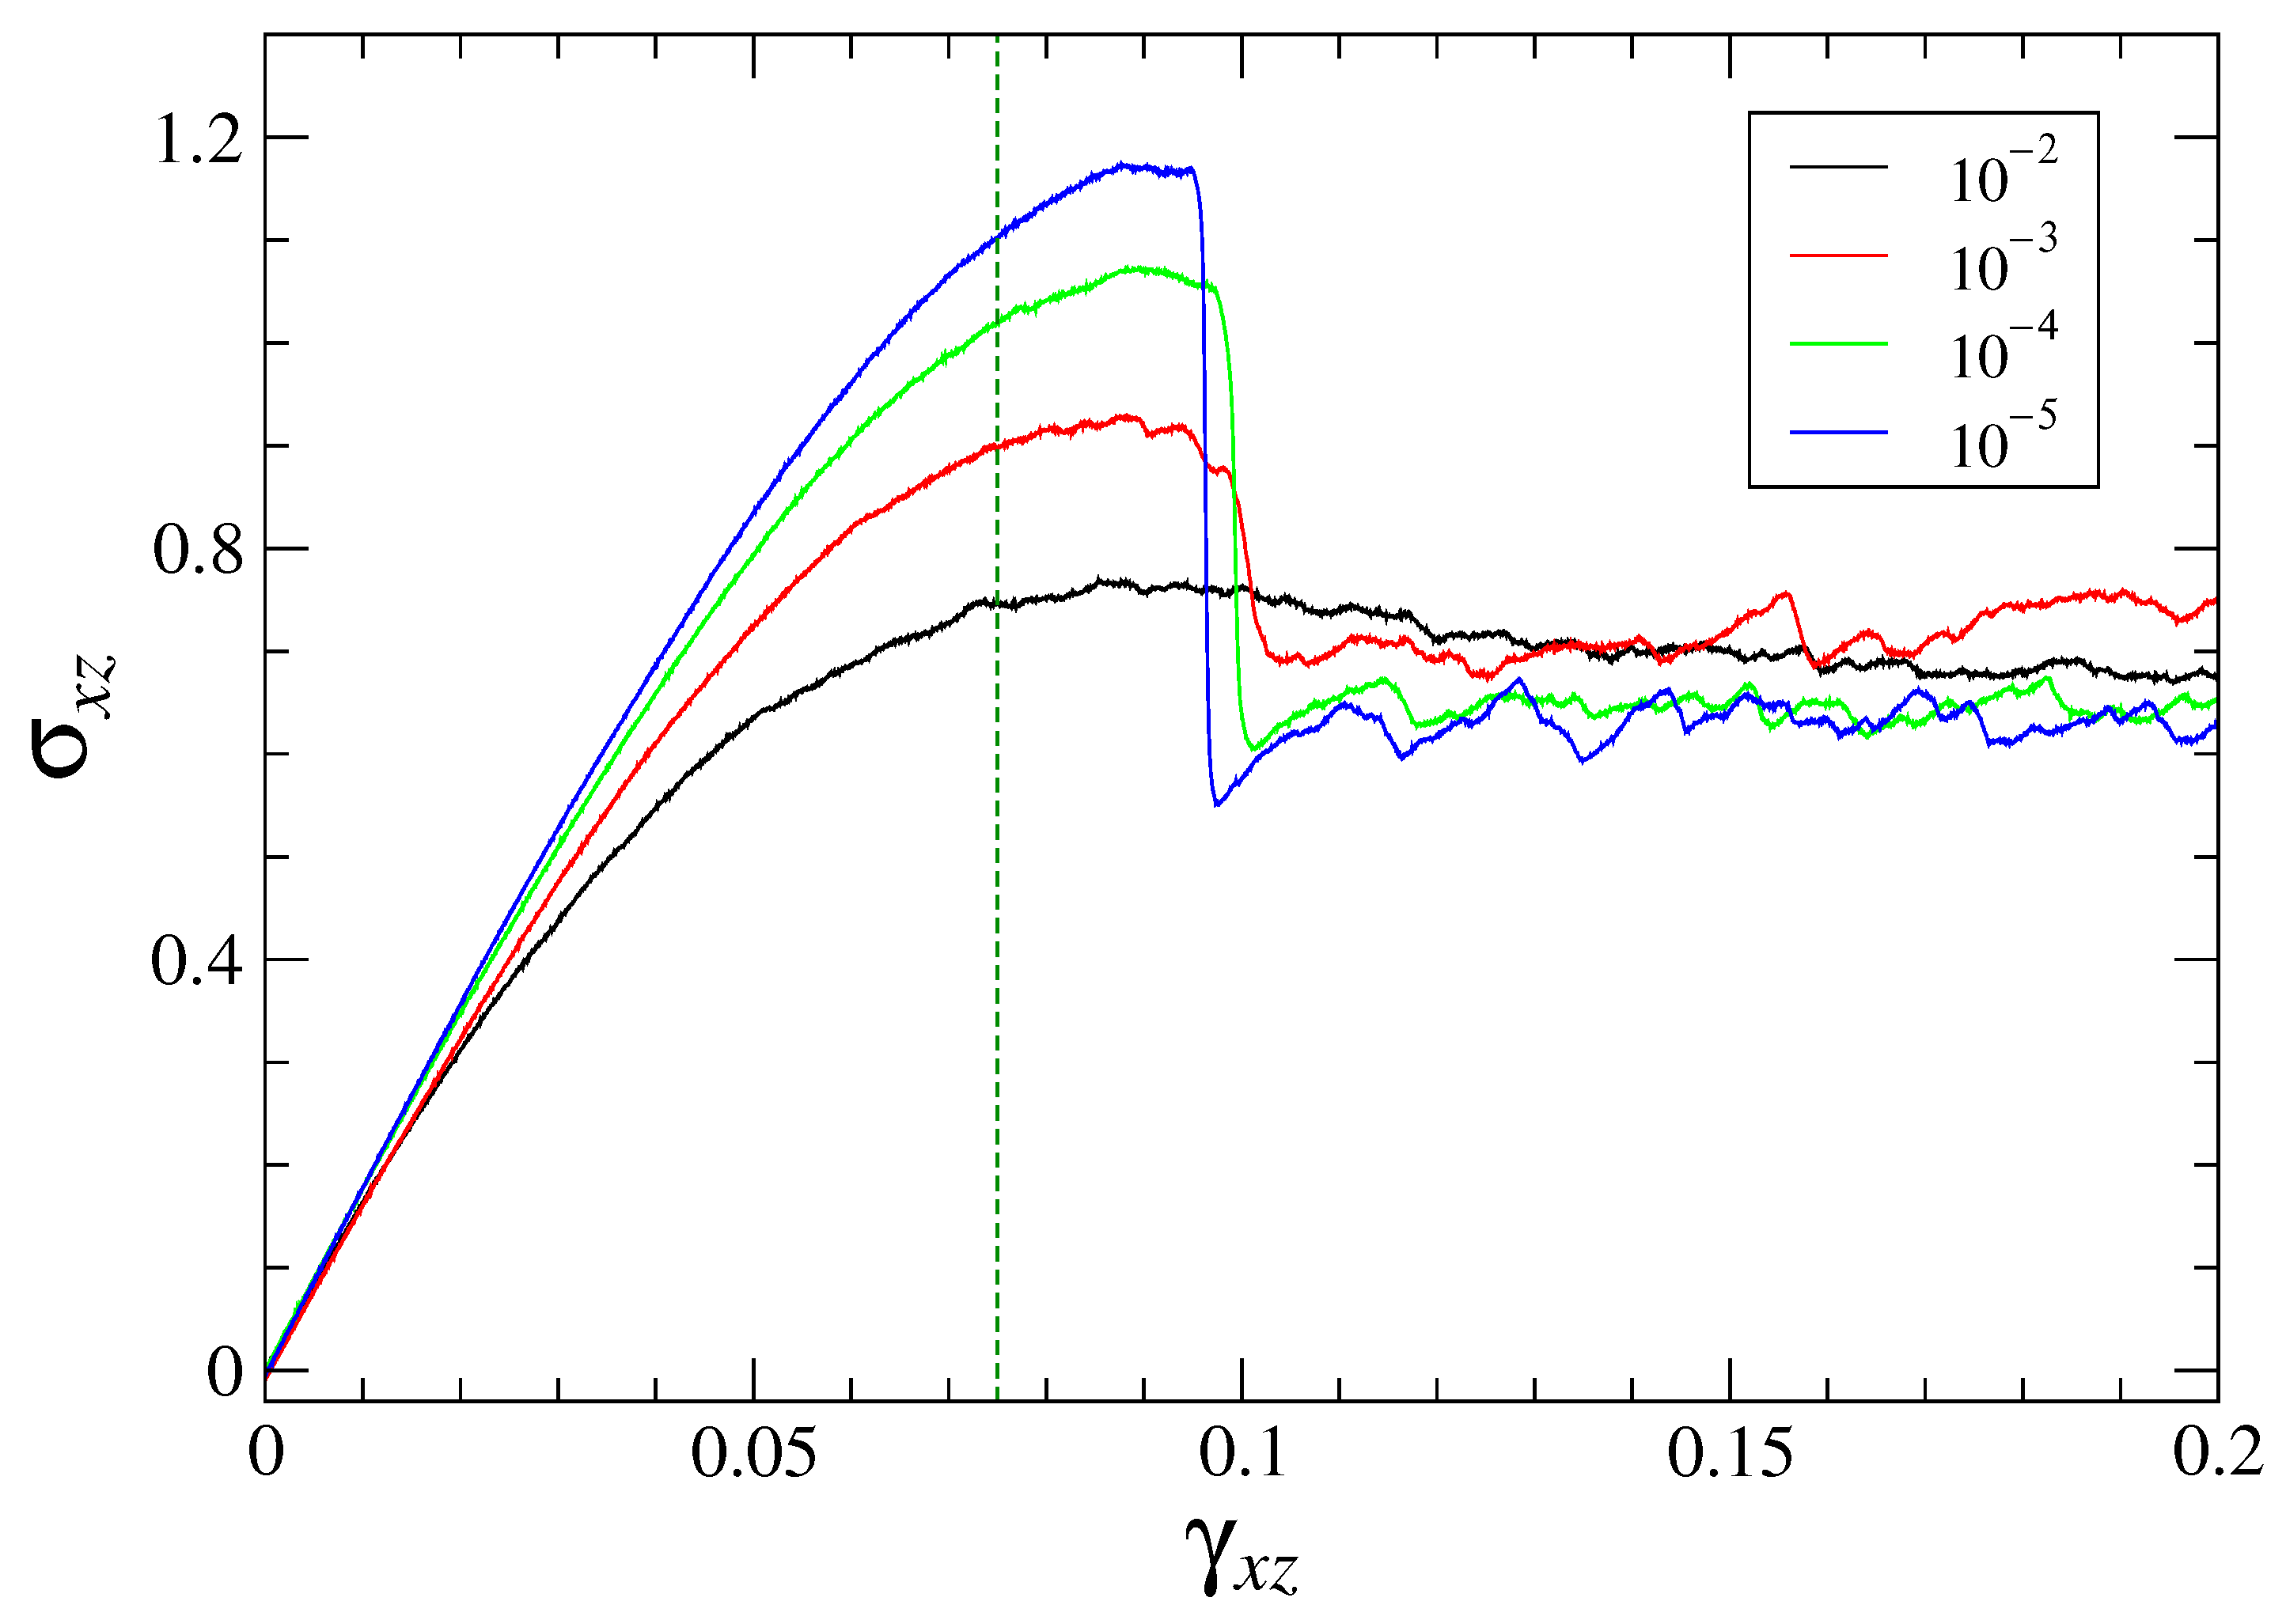
Next, the variation of shear stress for the same samples is displayed in Figure 2 during the first 100 oscillation periods. It can be clearly observed that, after a certain number of cycles, the stress amplitude undergoes a transition, typically during one period, which correlates well with the abrupt drop in amplitude of the potential energy reported in Figure 1. The enlarged view of the potential energy and shear stress near the yielding transition is shown in Figure 3. Note also that the stress amplitude after 100 cycles is nearly the same in all cases, which implies that the shear band becomes fully developed and it can support the same maximum stress at the given strain amplitude γ 0 = 0.075 . For reference, the shear stress during startup deformation with the constant strain rate 10 5 τ 1 is shown in Figure 4. Similar to periodic loading, the glasses were also strained at constant volume and temperature T L J = 0.01 ε / k B . In particular, it can be seen that the stress overshoot becomes increasingly pronounced for more slowly annealed glasses; the corresponding value of the shear strain γ x z 0.09 is greater than the strain amplitude γ 0 = 0.075 (denoted by the vertical dashed line in Figure 4) of the oscillatory deformation.
A more detailed analysis of the shear band formation can be performed by considering the spatial and temporal evolution of the nonaffine displacements [40]. Recall that the nonaffine displacement of an atom can be evaluated via the matrix J i , which linearly transforms positions of its neighbors during the time interval Δ t and minimizes the quantity:
D 2 ( t , Δ t ) = 1 N i j = 1 N i r j ( t + Δ t ) r i ( t + Δ t ) J i r j ( t ) r i ( t ) 2 ,
where the sum is taken over atoms within a sphere with the radius 1.5 σ located at the position of the i-th atom r i ( t ) . This definition was first introduced by Falk and Langer and used to identify accurately the location of shear transformations in strained disordered solids [40]. More recently, the spatiotemporal analysis of nonaffine displacements was applied to investigate shear band formation in steadily [12,13,14,41] and periodically [21,23,25,29,30,34] driven amorphous solids, as well as the structural relaxation in thermally cycled [42,43] and elastostatically loaded [44] glasses.
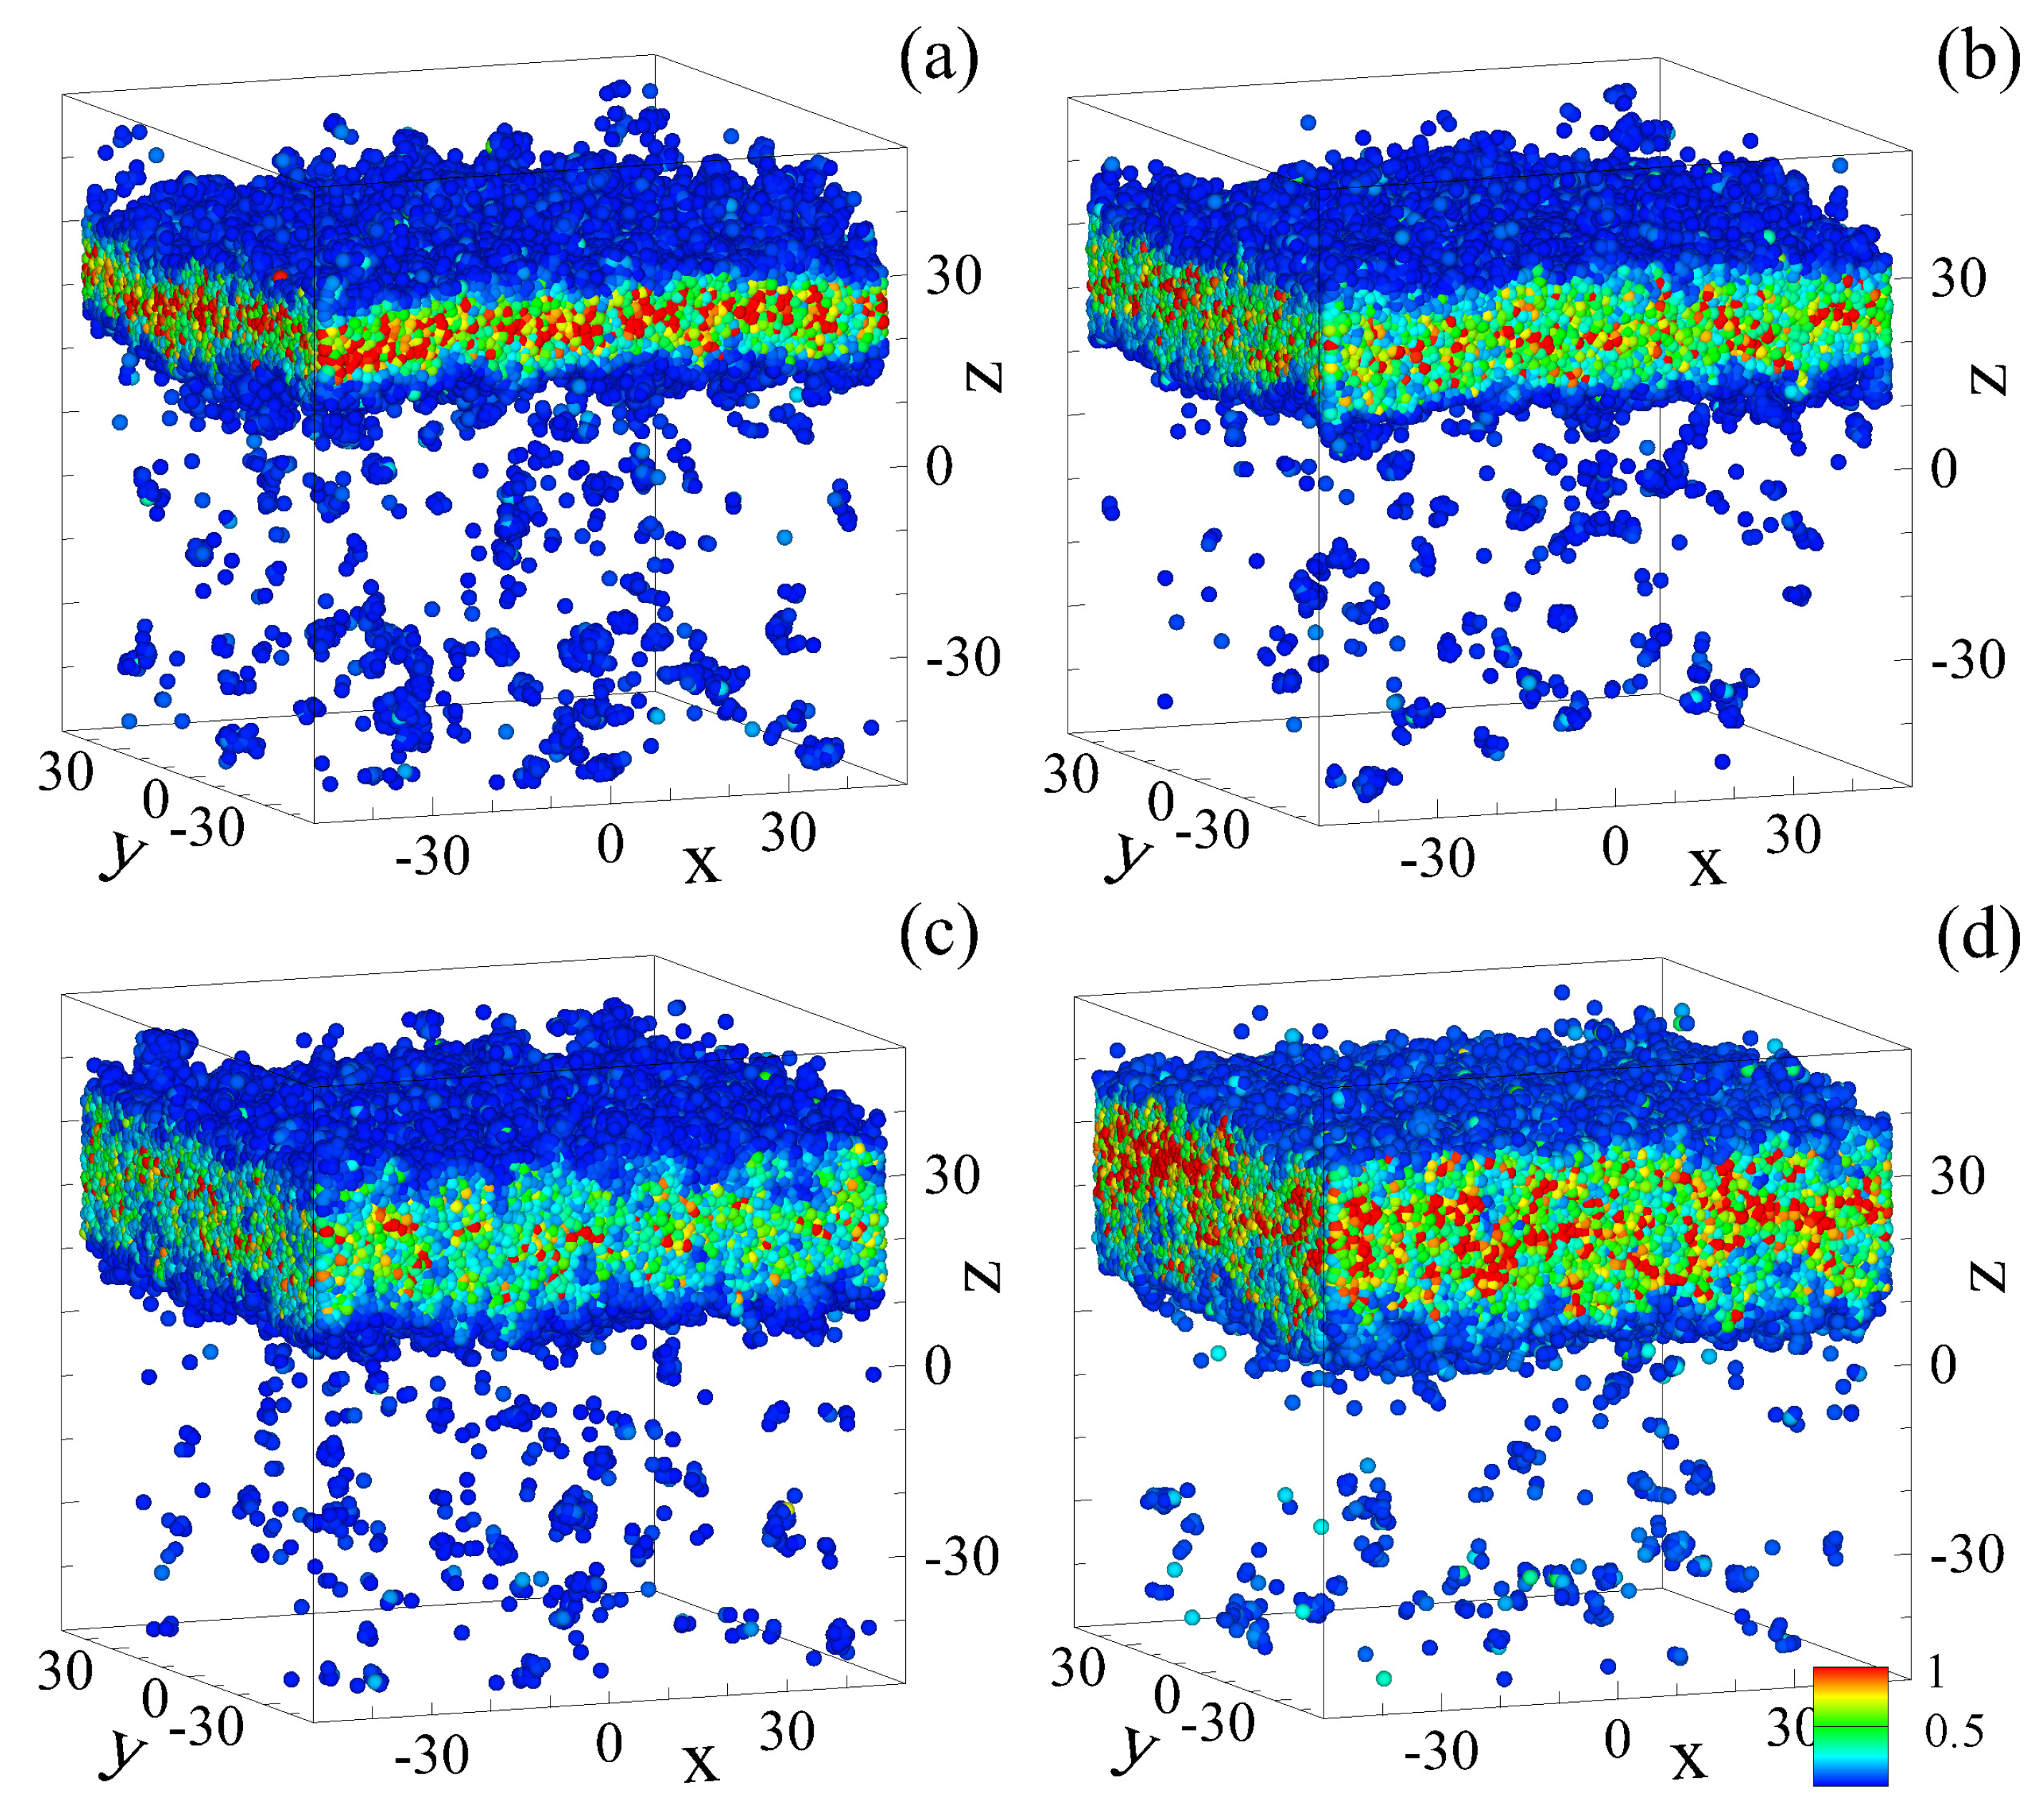
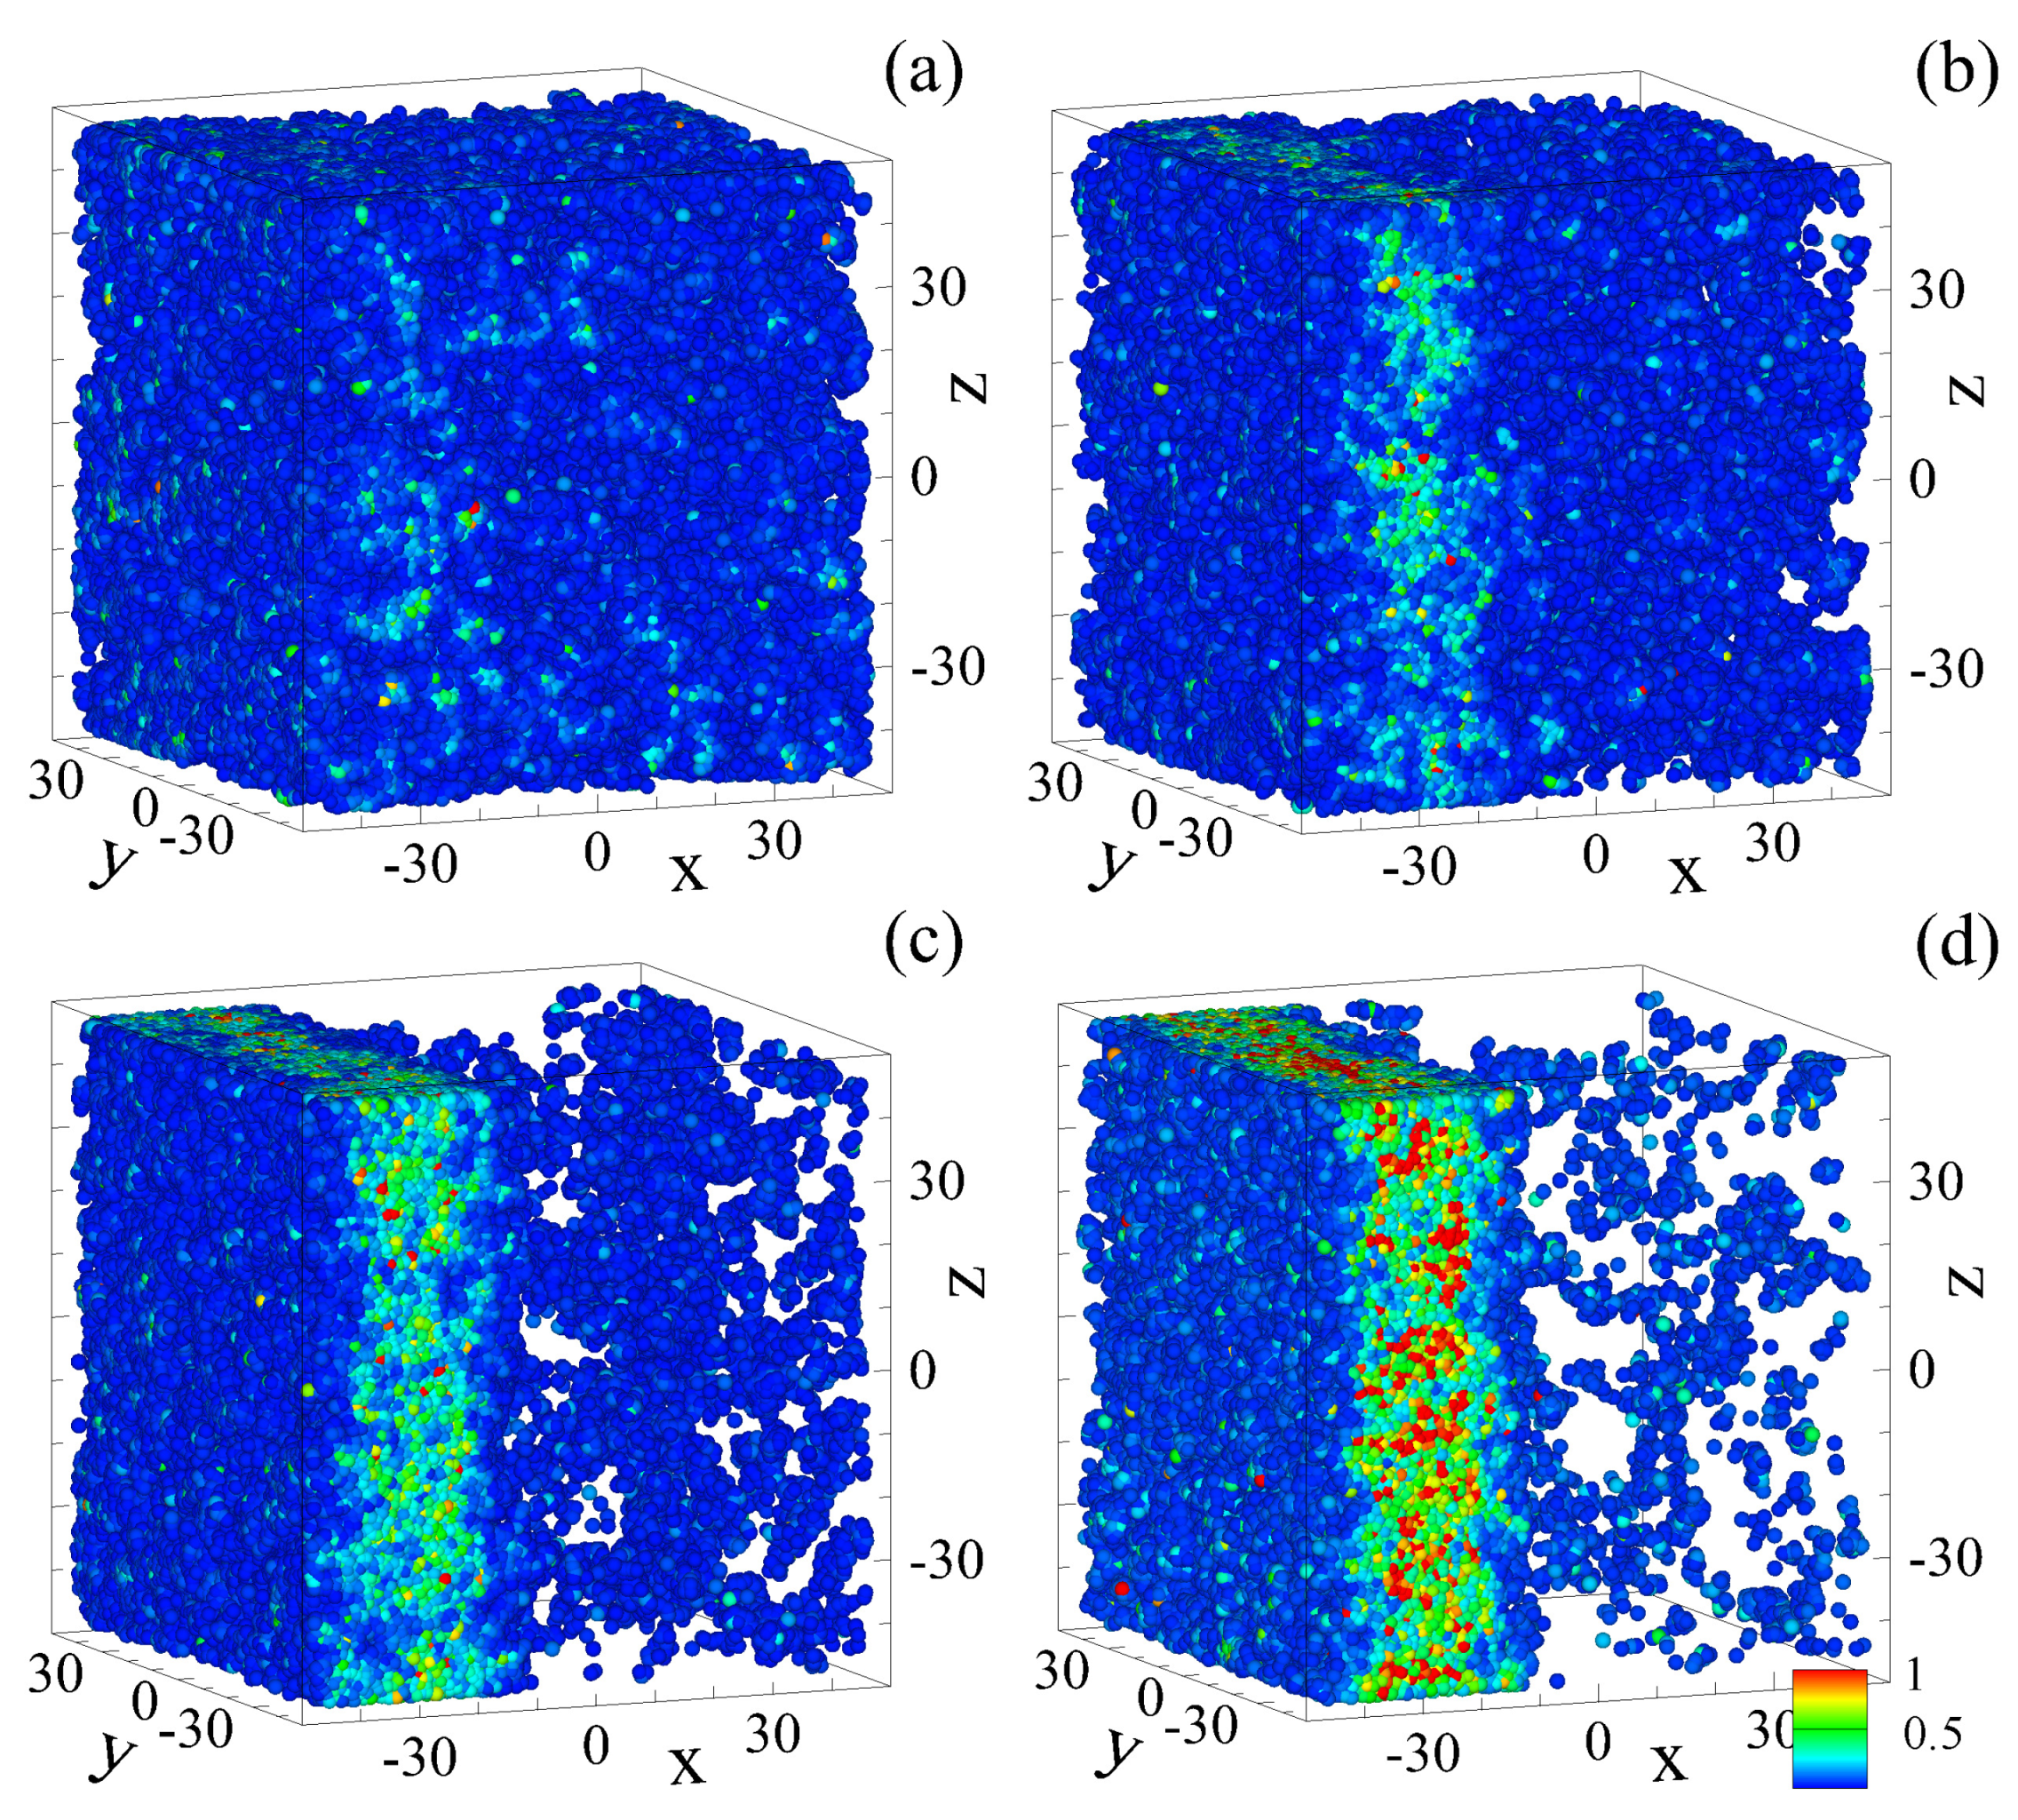
The atomic configurations and the values of the nonaffine measure D 2 ( n T , T ) are displayed for selected cycles in Figure 5 and Figure 6 for the binary glass initially cooled with the slowest rate 10 5 ε / k B τ . In our analysis, the quantity, D 2 ( n T , T ) , was computed for any two consecutive configurations at zero strain separated by the time interval Δ t = T . For visualization of irreversible displacements, the atoms with relatively small nonaffine displacements during one cycle, D 2 ( n T , T ) < 0.04 σ 2 , are not shown. For comparison, the typical cage size at this density is r c 0.1 σ . It can be clearly observed in Figure 5a that during the first 10 cycles, the mobile atoms are organized into small clusters that are homogeneously distributed in the sample. With increasing cycle number, the shear band starts to form at z 30 σ and it become fully developed after 100 cycles.
Interestingly, the accumulation of atoms with large nonaffine displacements along the x y plane, shown in Figure 5b,c, occurs before the yielding transition marked by the abrupt changes in amplitudes of U ( t ) and σ x z ( t ) . As is evident from Figure 3c,f, the transition takes place during the 56-th cycle, and the corresponding atomic configuration at the end of this cycle is shown in Figure 5d. Therefore, these results demonstrate that the location of the shear band can be predicted at least several periods before the yielding transition. This is in sharp contrast to the shear band formation during the startup deformation, where the strain localization in well-annealed glasses becomes apparent only at the critical strain [14].
Furthermore, the snapshots at larger cycle numbers shown in Figure 6 reveal two effects. First, the thickness of the shear band increases during the next 40 cycles. Second, the typical size of clusters of mobile atoms outside the shear band becomes smaller than before the yielding transition. This can be explained by realizing that the amplitude of shear stress is reduced to the maximum stress that can be supported by the shear band, and, as a result, the solid part of the sample is strained with a smaller amplitude. A more quantitative description of the spatial distribution of nonaffine displacements for the same sample is presented in Figure 7. Thus, the averaged profiles of D 2 ( n T , T ) indicate that the location of the shear band becomes apparent after about 30–40 shear cycles. The yielding transition corresponds to the abrupt increase of the peak height of D 2 ( n T , T ) , from n = 54 to 55 in Figure 7. Notice that upon further loading, the peak first becomes higher, and then it widens to about 20 σ at the half peak height. At the same time, the average value of the quantity D 2 ( n T , T ) outside the shear band is significantly reduced after the yielding transition, which correlates well with the appearance of smaller clusters in Figure 6. It can also be concluded that the increase in the potential energy for n > 56 (the blue curve in Figure 1) is associated with the increase in volume of the shear band.
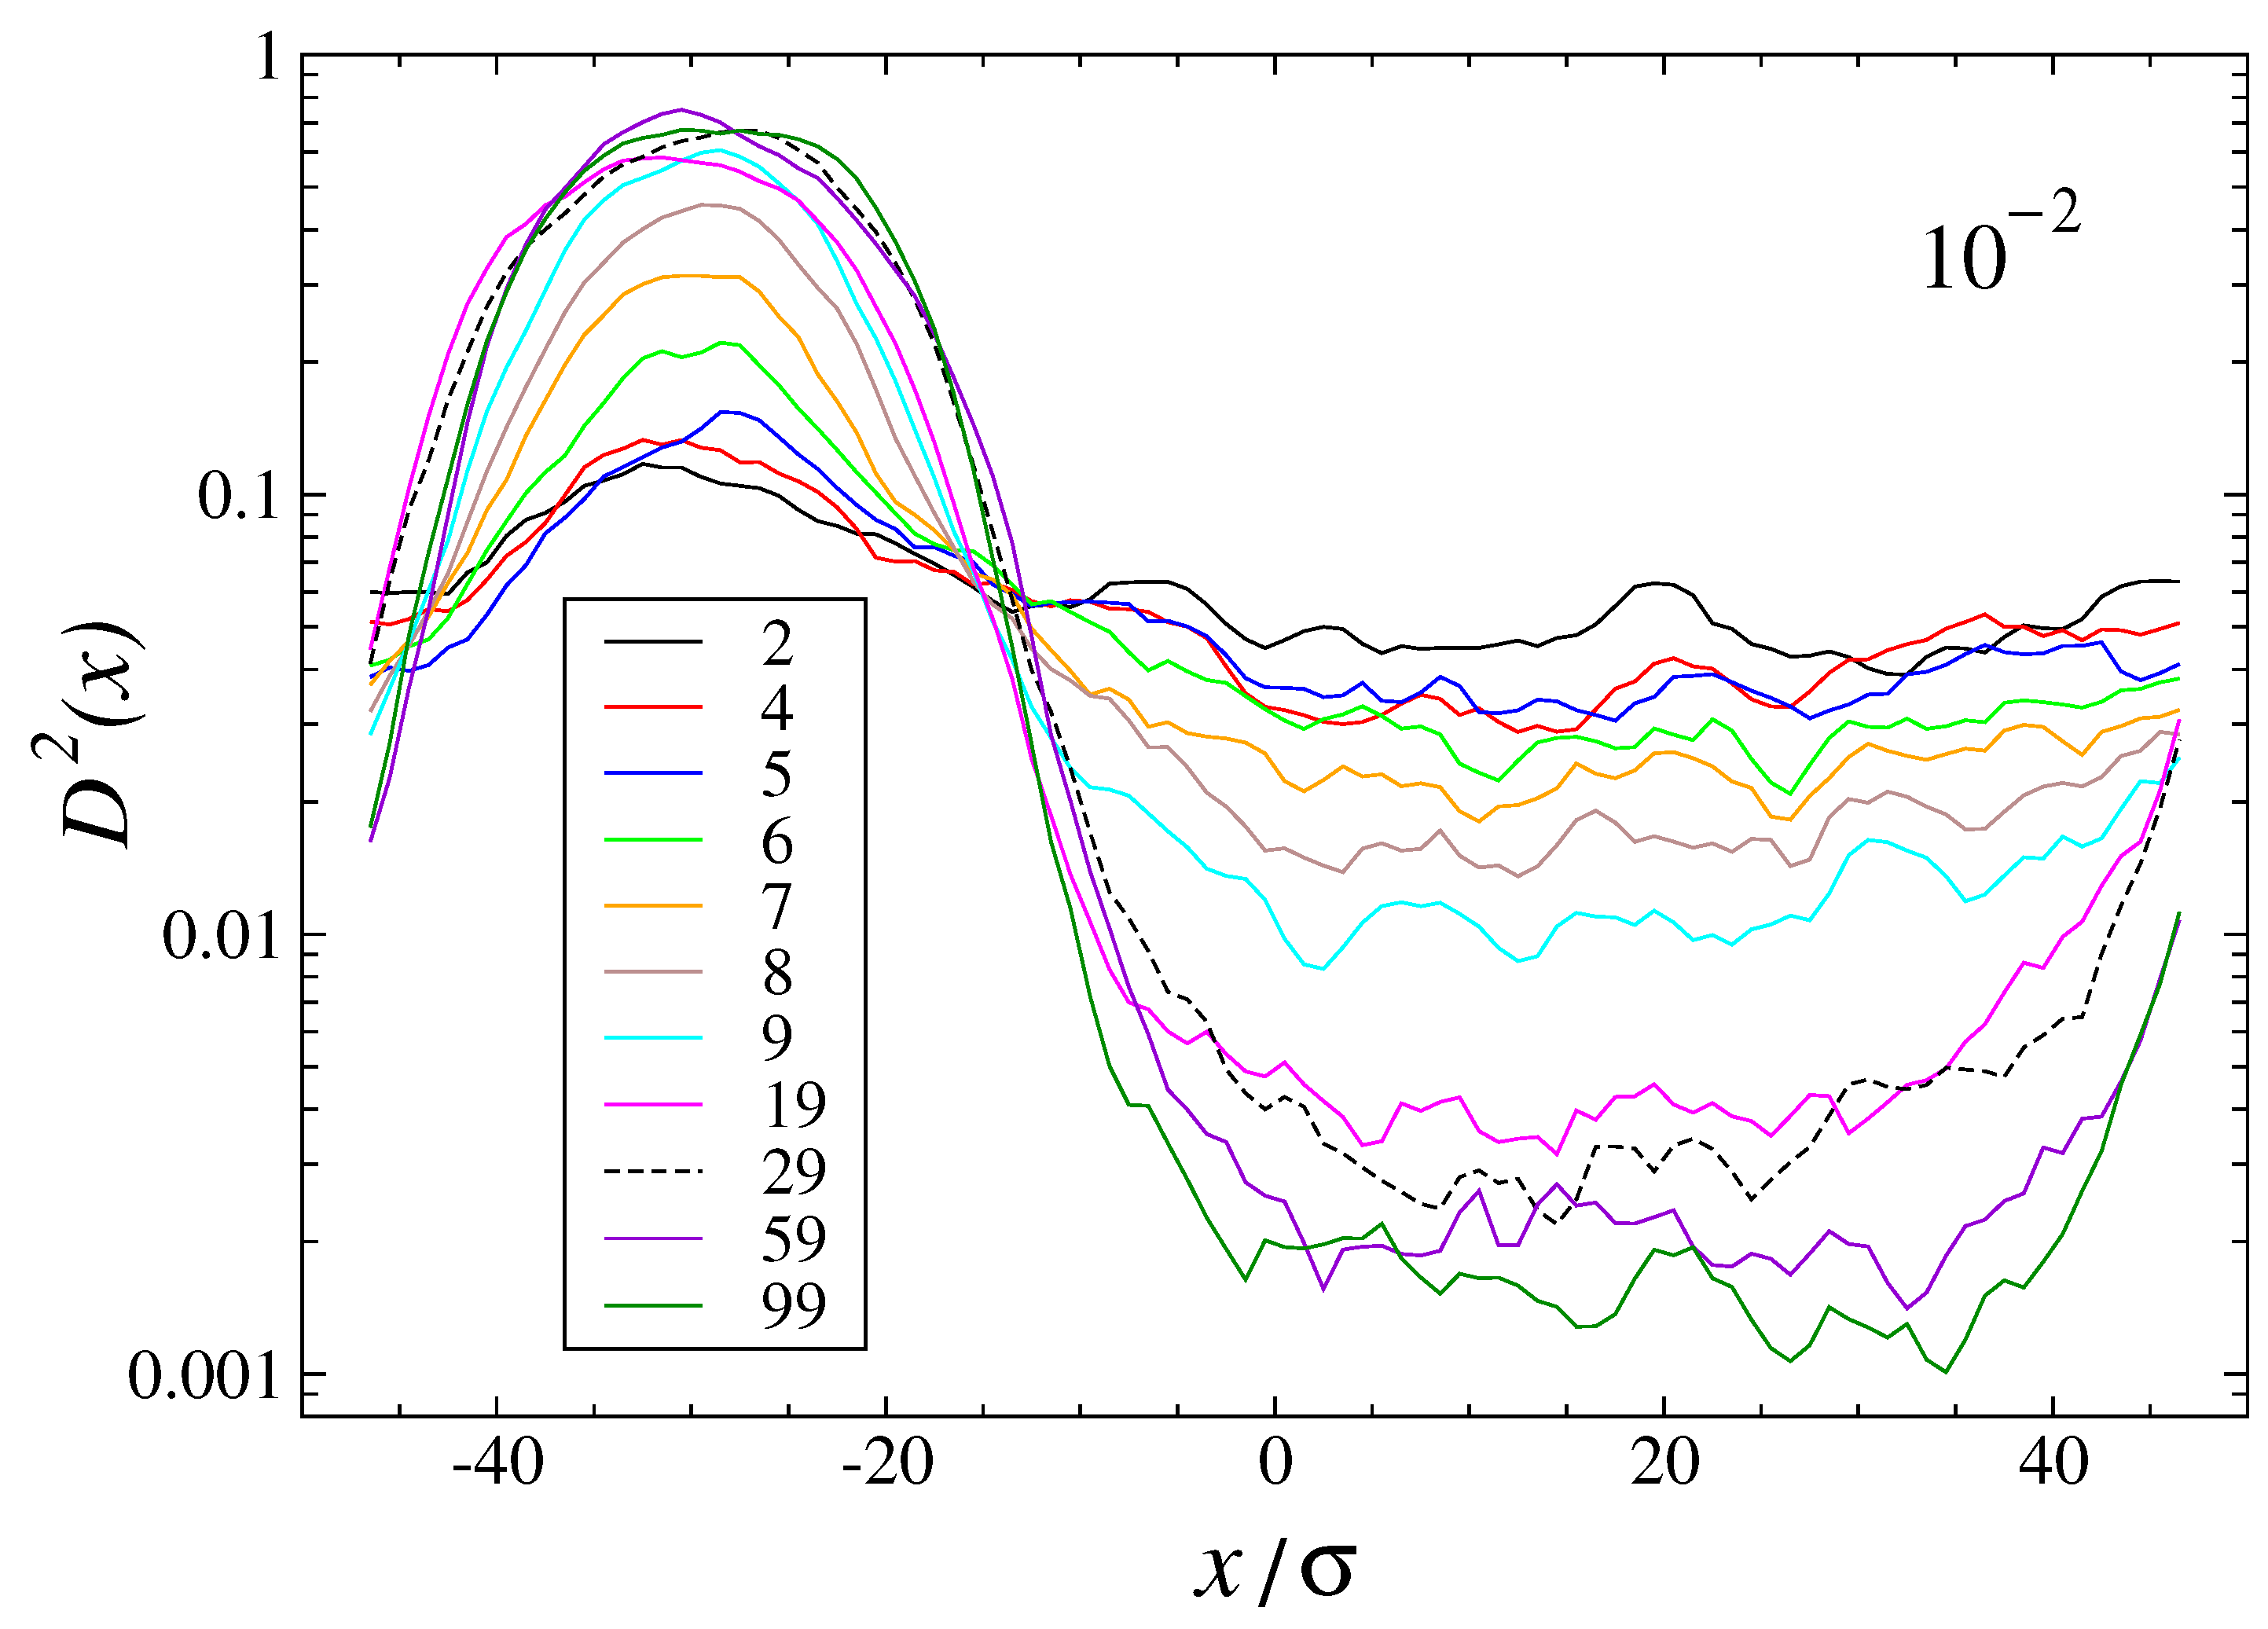
The distribution of the nonaffine measure for the poorly annealed glass (cooling rate 10 2 ε / k B τ ) is illustrated in Figure 8. It can be observed that initially most of the atoms undergo irreversible displacements, followed by widening of the shear band and relaxation of the adjacent material over consecutive cycles. The corresponding profiles of D 2 ( n T , T ) averaged in narrow bins along the y z plane are shown in Figure 9. In this case, the yielding transition occurs within the first few cycles, and the shear band is formed by the 10-th cycle. This is consistent with the results for U ( t ) and σ x z ( t ) in Figure 1 and Figure 2.
It can be noticed in Figure 9 that the average quantity D 2 ( n T , T ) outside the shear band is significantly reduced during 100 cycles, which implies that the solid part continues to relax to lower energy states. Therefore, the gradual decay of U ( t ) for n ≳ 10 in Figure 1 contains two contributions; the first one comes from the widening of the shear band (leading to higher energy) and the other one originates from the mechanical annealing of the solid domain where the potential energy is reduced. Recent studies have shown that the relaxation process in poorly annealed glasses might continue during hundreds of subyield cycles at a finite temperature [28,33,34,34]. Thus, it can be expected that upon further loading, the potential energy minima for the poorly annealed glass (cooling rate 10 2 ε / k B τ ) will continue approaching the energy level of the well annealed sample (cooling rate 10 5 ε / k B τ ). The long time behavior of periodically deformed glasses, however, is not the main focus of the present study, and, thus, it was not explored, partly due to computational limitations.
The spatial distribution of nonaffine displacements during the loading process can be further analyzed by considering the normalized, equal-time correlation function [45], as follows:
C D 2 ( Δ r ) = D 2 ( r + Δ r ) D 2 ( r ) D 2 ( r ) 2 D 2 ( r ) 2 D 2 ( r ) 2 ,
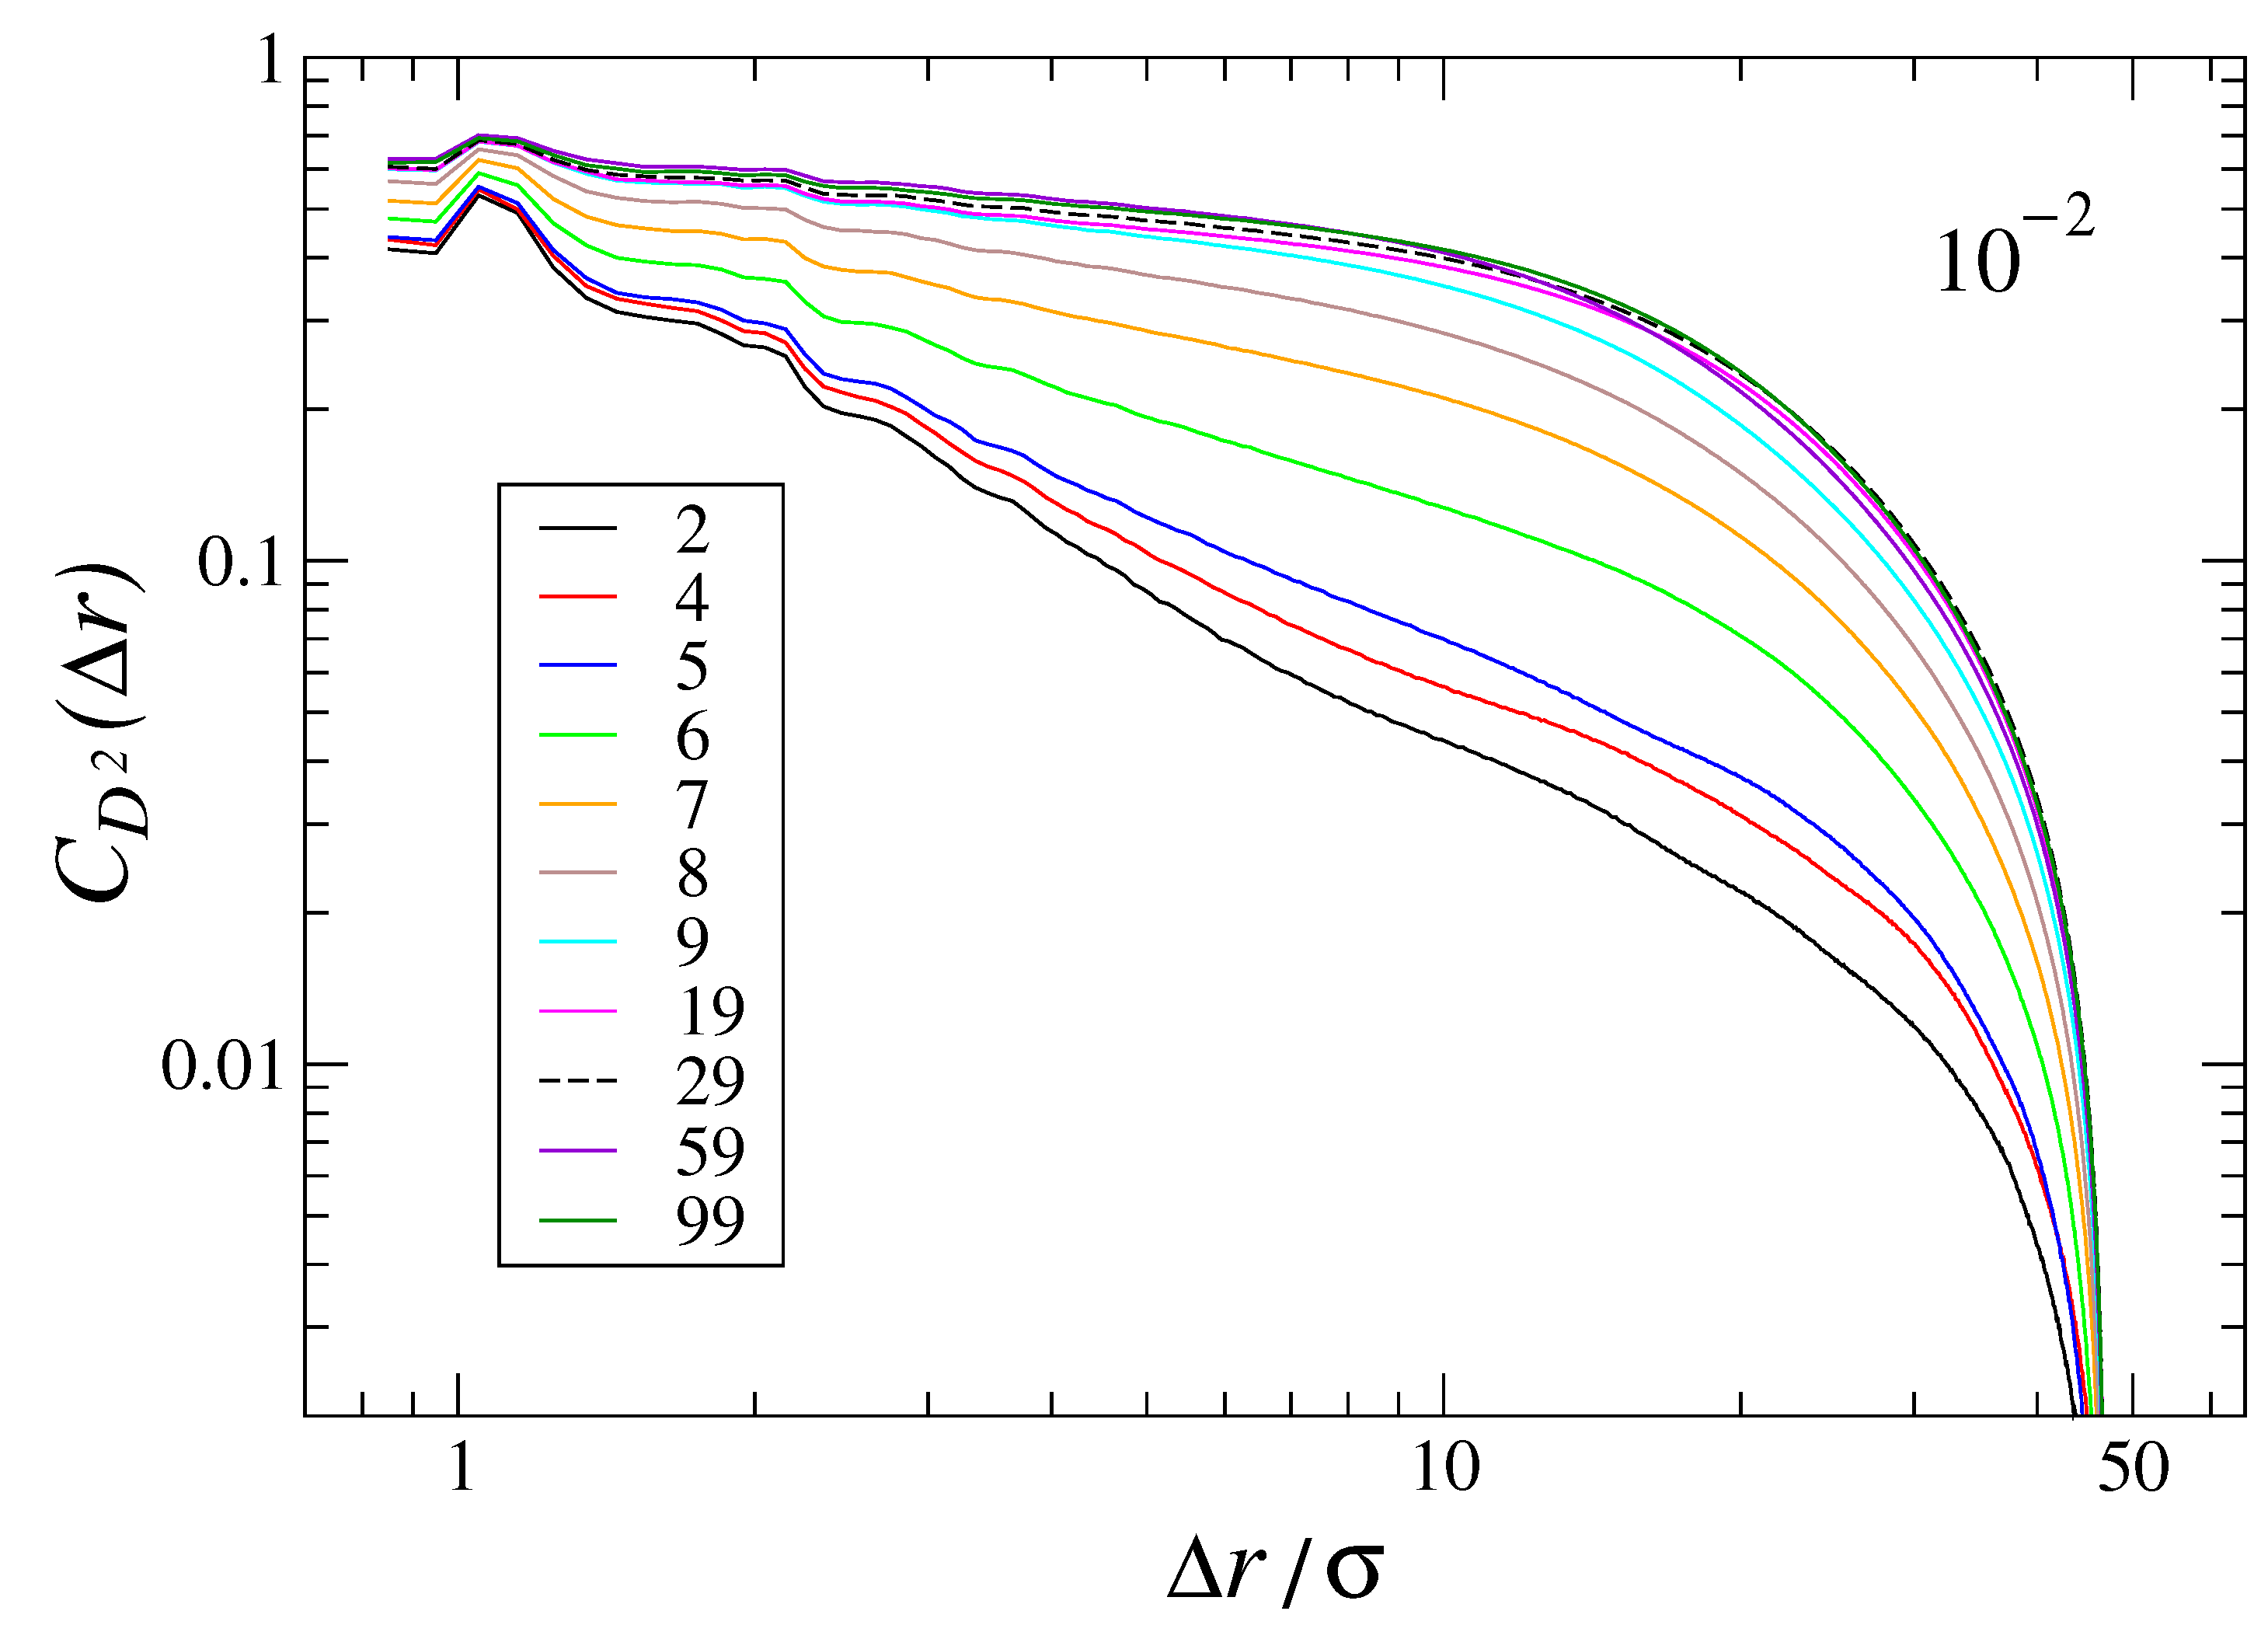
where the averaging is performed over all pairs of atoms, and D 2 ( n T , T ) is computed for two configurations at zero strain separated by Δ t = T , similar to the analysis in Figure 7 and Figure 9. The results for the limiting cases of well and poorly annealed glasses are presented in Figure 10 and Figure 11, respectively. It can be observed that the function C D 2 ( Δ r ) decays over short distances for the cycles n = 9 and 19 in Figure 10, which is consistent with the formation of small-size clusters in the well annealed sample shown in Figure 5a. Upon increasing cycle number, the correlation of nonaffine displacements becomes increasingly long ranged; although the precise cycle number for the yielding transition (detected via drop in U or σ x z when n = 55 ) can hardly be identified from these data. Similar trends are also evident in Figure 11 for the poorly annealed glass, except that C D 2 ( Δ r ) decays relatively slowly even at small n when most of the atoms undergo irreversible displacements, as shown, for example, in Figure 8a. Overall, these results indicate that during strain localization, the dynamics of nonaffine displacements becomes correlated over larger distances, which is reflected in the shape of the nonaffinity correlation function.

4. Conclusions

In summary, the process of shear band formation and yielding transition in disordered solids subjected to periodic shear deformation is investigated using molecular dynamics simulations. The binary glass consists of one million atoms, and it is formed via annealing from the liquid state to a low temperature with different cooling rates. It was demonstrated that more slowly cooled glasses undergo a transition to plastic flow after larger number of cycles with the strain amplitude slightly above the critical value. In contrast to startup deformation, the location of a shear band can be predicted from the spatial distribution and averaged profiles of nonaffine displacements at least a few cycles before the yielding transition. It was also shown that the collective dynamics of nonaffine displacements during shear band formation is reflected in the evolution of the spatial correlation function, which gradually changes from a fast to slow decay that is nearly independent of the cycle number when the shear band is fully developed.

Funding

Financial support from the National Science Foundation (CNS-1531923) and the ACS Petroleum Research Fund (60092-ND9) is gratefully acknowledged.

Acknowledgments

The numerical simulations were performed at Wright State University’s Computing Facility and the Ohio Supercomputer Center. The molecular dynamics simulations were performed using the LAMMPS open-source code developed at Sandia National Laboratories [37].

Conflicts of Interest

The author declares no conflict of interest.

References

  1. Hufnagel, T.C.; Schuh, C.A.; Falk, M.L. Deformation of metallic glasses: Recent developments in theory, simulations, and experiments. Acta Mater. 2016, 109, 375–393. [Google Scholar] [CrossRef] [Green Version]
  2. Li, H.F.; Zheng, Y.F. Recent advances in bulk metallic glasses for biomedical applications. Acta Biomater. 2016, 36, 1–20. [Google Scholar] [CrossRef]
  3. Parisi, G.; Procaccia, I.; Rainone, C.; Singh, M. Shear bands as manifestation of a criticality in yielding amorphous solids. Proc. Natl. Acad. Sci. USA 2017, 114, 5577–5582. [Google Scholar] [CrossRef] [PubMed] [Green Version]
  4. Wisitsorasak, A.; Wolynes, P.G. Dynamical theory of shear bands in structural glasses. Proc. Natl. Acad. Sci. USA 2017, 114, 1287–1292. [Google Scholar] [CrossRef] [PubMed] [Green Version]
  5. Spaepen, F. A microscopic mechanism for steady state inhomogeneous flow in metallic glasses. Acta Metall. 1977, 25, 407. [Google Scholar] [CrossRef]
  6. Argon, A.S. Plastic deformation in metallic glasses. Acta Metall. 1979, 27, 47–58. [Google Scholar] [CrossRef]
  7. Shi, Y.; Falk, M.L. Strain localization and percolation of stable structure in amorphous solids. Phys. Rev. Lett. 2005, 95, 095502. [Google Scholar] [CrossRef] [PubMed] [Green Version]
  8. Cao, A.J.; Cheng, Y.Q.; Ma, E. Structural processes that initiate shear localization in metallic glass. Acta Mater. 2009, 57, 5146–5155. [Google Scholar] [CrossRef]
  9. Ju, S.-P.; Huang, H.-H.; Wu, T.-Y. Investigation of the local structural rearrangement of Mg67Zn28Ca5 bulk metallic glasses during tensile deformation: A molecular dynamics study. Comput. Mater. Sci. 2015, 96, 56–62. [Google Scholar] [CrossRef]
  10. Tercini, M.; Veiga, R.G.d.; Zuniga, A. Local atomic environment and shear banding in metallic glasses. Comput. Mater. Sci. 2018, 155, 129–135. [Google Scholar] [CrossRef]
  11. Feng, S.-D.; Chan, K.K.C.; Zhao, L.; Wang, L.-M.; Liu, R.-P. Molecular dynamics simulation of structural signals of shear-band formation in Zr46Cu46Al8 metallic glasses. Materials 2018, 11, 2564. [Google Scholar] [CrossRef] [PubMed] [Green Version]
  12. Shrivastav, G.P.; Chaudhuri, P.; Horbach, J. Yielding of glass under shear: A directed percolation transition precedes shear-band formation. Phys. Rev. E 2016, 94, 042605. [Google Scholar] [CrossRef] [PubMed] [Green Version]
  13. Jana, R.; Pastewka, L. Correlations of non-affine displacements in metallic glasses through the yield transition. J. Phys. Mater. 2019, 2, 045006. [Google Scholar] [CrossRef] [Green Version]
  14. Priezjev, N.V. Spatiotemporal analysis of nonaffine displacements in disordered solids sheared across the yielding point. arXiv 2019, arXiv:1910.01543. [Google Scholar]
  15. Hieronymus-Schmidt, V.; Rosner, H.; Wilde, G.; Zaccone, A. Shear banding in metallic glasses described by alignments of Eshelby quadrupoles. Phys. Rev. B 2017, 95, 134111. [Google Scholar] [CrossRef] [Green Version]
  16. Hassani, M.; Lagogianni, A.E.; Varnik, F. Probing the degree of heterogeneity within a shear band of a model glass. Phys. Rev. Lett. 2019, 123, 195502. [Google Scholar] [CrossRef] [Green Version]
  17. Priezjev, N.V. Heterogeneous relaxation dynamics in amorphous materials under cyclic loading. Phys. Rev. E 2013, 87, 052302. [Google Scholar] [CrossRef] [Green Version]
  18. Fiocco, D.; Foffi, G.; Sastry, S. Oscillatory athermal quasistatic deformation of a model glass. Phys. Rev. E 2013, 88, 020301(R). [Google Scholar] [CrossRef] [Green Version]
  19. Regev, I.; Lookman, T.; Reichhardt, C. Onset of irreversibility and chaos in amorphous solids under periodic shear. Phys. Rev. E 2013, 88, 062401. [Google Scholar] [CrossRef] [Green Version]
  20. Priezjev, N.V. Dynamical heterogeneity in periodically deformed polymer glasses. Phys. Rev. E 2014, 89, 012601. [Google Scholar] [CrossRef] [Green Version]
  21. Priezjev, N.V. Reversible plastic events during oscillatory deformation of amorphous solids. Phys. Rev. E 2016, 93, 013001. [Google Scholar] [CrossRef] [PubMed] [Green Version]
  22. Kawasaki, T.; Berthier, L. Macroscopic yielding in jammed solids is accompanied by a non-equilibrium first-order transition in particle trajectories. Phys. Rev. E 2016, 94, 022615. [Google Scholar] [CrossRef] [PubMed] [Green Version]
  23. Priezjev, N.V. Nonaffine rearrangements of atoms in deformed and quiescent binary glasses. Phys. Rev. E 2016, 94, 023004. [Google Scholar] [CrossRef] [PubMed] [Green Version]
  24. Leishangthem, P.; Parmar, A.D.S.; Sastry, S. The yielding transition in amorphous solids under oscillatory shear deformation. Nat. Commun. 2017, 8, 14653. [Google Scholar] [CrossRef] [Green Version]
  25. Priezjev, N.V. Collective nonaffine displacements in amorphous materials during large-amplitude oscillatory shear. Phys. Rev. E 2017, 95, 023002. [Google Scholar] [CrossRef] [Green Version]
  26. Fan, M.; Wang, M.; Zhang, K.; Liu, Y.; Schroers, J.; Shattuck, M.D.; O’Hern, C.S. The effects of cooling rate on particle rearrangement statistics: Rapidly cooled glasses are more ductile and less reversible. Phys. Rev. E 2017, 95, 022611. [Google Scholar] [CrossRef] [Green Version]
  27. Sha, Z.; Wong, W.H.; Pei, Q.; Branicio, P.S.; Liu, Z.; Wang, T.; Guo, T.; Gao, H. Atomistic origin of size effects in fatigue behavior of metallic glasses. J. Mech. Phys. Solids 2017, 104, 84–95. [Google Scholar] [CrossRef]
  28. Priezjev, N.V. Molecular dynamics simulations of the mechanical annealing process in metallic glasses: Effects of strain amplitude and temperature. J. Non-Cryst. Solids 2018, 479, 42–48. [Google Scholar] [CrossRef] [Green Version]
  29. Priezjev, N.V. The yielding transition in periodically sheared binary glasses at finite temperature. Comput. Mater. Sci. 2018, 150, 162–168. [Google Scholar] [CrossRef] [Green Version]
  30. Priezjev, N.V. Slow relaxation dynamics in binary glasses during stress-controlled, tension-compression cyclic loading. Comput. Mater. Sci. 2018, 153, 235–240. [Google Scholar] [CrossRef] [Green Version]
  31. Priezjev, N.V.; Makeev, M.A. The influence of periodic shear on structural relaxation and pore redistribution in binary glasses. J. Non-Cryst. Solids 2019, 506, 14–20. [Google Scholar] [CrossRef] [Green Version]
  32. Priezjev, N.V.; Makeev, M.A. Structural transformations during periodic deformation of low-porosity amorphous materials. Model. Simul. Mater. Sci. Eng. 2019, 27, 025004. [Google Scholar] [CrossRef] [Green Version]
  33. Parmar, A.D.S.; Kumar, S.; Sastry, S. Strain localization above the yielding point in cyclically deformed glasses. Phys. Rev. X 2019, 9, 021018. [Google Scholar] [CrossRef] [Green Version]
  34. Priezjev, N.V. Accelerated relaxation in disordered solids under cyclic loading with alternating shear orientation. J. Non-Cryst. Solids 2019, 525, 119683. [Google Scholar] [CrossRef] [Green Version]
  35. Kob, W.; Andersen, H.C. Testing mode-coupling theory for a supercooled binary Lennard-Jones mixture: The van Hove correlation function. Phys. Rev. E 1995, 51, 4626. [Google Scholar] [CrossRef] [PubMed] [Green Version]
  36. Weber, T.A.; Stillinger, F.H. Local order and structural transitions in amorphous metal-metalloid alloys. Phys. Rev. B 1985, 31, 1954. [Google Scholar] [CrossRef] [PubMed] [Green Version]
  37. Plimpton, S.J. Fast parallel algorithms for short-range molecular dynamics. J. Comput. Phys. 1995, 117, 1. [Google Scholar] [CrossRef] [Green Version]
  38. Morozov, I.V.; Kazennov, A.M.; Bystryi, R.G.; Norman, G.E.; Pisarev, V.V.; Stegailov, V.V. Molecular dynamics simulations of the relaxation processes in the condensed matter on GPUs. Comput. Phys. Commun. 2011, 182, 1974–1978. [Google Scholar] [CrossRef]
  39. Allen, M.P.; Tildesley, D.J. Computer Simulation of Liquids; Clarendon: Oxford, UK, 1987. [Google Scholar]
  40. Falk, M.L.; Langer, J.S. Dynamics of viscoplastic deformation in amorphous solids. Phys. Rev. E 1998, 57, 7192. [Google Scholar] [CrossRef] [Green Version]
  41. Priezjev, N.V. The effect of thermal history on the atomic structure and mechanical properties of amorphous alloys. Comput. Mater. Sci. 2020, 174, 109477. [Google Scholar] [CrossRef] [Green Version]
  42. Priezjev, N.V. The effect of cryogenic thermal cycling on aging, rejuvenation, and mechanical properties of metallic glasses. J. Non-Cryst. Solids 2019, 503, 131–138. [Google Scholar] [CrossRef] [Green Version]
  43. Liu, Q.-L.; Priezjev, N.V. The influence of complex thermal treatment on mechanical properties of amorphous materials. Comput. Mater. Sci. 2019, 161, 93–98. [Google Scholar] [CrossRef] [Green Version]
  44. Priezjev, N.V. Aging and rejuvenation during elastostatic loading of amorphous alloys: A molecular dynamics simulation study. Comput. Mater. Sci. 2019, 168, 125–130. [Google Scholar] [CrossRef] [Green Version]
  45. Chikkadi, V.; Schall, P. Nonaffine measures of particle displacements in sheared colloidal glasses. Phys. Rev. E 2012, 85, 031402. [Google Scholar] [CrossRef] [PubMed]
Figure 1. (Color online) The potential energy series during the first 100 oscillation periods for samples prepared with the cooling rates 10 2 ε / k B τ (black), 10 3 ε / k B τ (red), 10 4 ε / k B τ (green), and 10 5 ε / k B τ (blue). The oscillation period is T = 5000 τ and the strain amplitude is γ 0 = 0.075 .
Metals 10 00300 g001
Figure 2. (Color online) The time dependence of shear stress σ x z (in units of ε σ 3 ) during the first 100 oscillation cycles. The glasses were initially annealed with the rates 10 2 ε / k B τ (black), 10 3 ε / k B τ (red), 10 4 ε / k B τ (green), and 10 5 ε / k B τ (blue). For clarity, the data are displaced vertically by 2.0 ε σ 3 (green), by 4.0 ε σ 3 (red), and by 6.0 ε σ 3 (black). The strain amplitude is γ 0 = 0.075 and the period of oscillations is T = 5000 τ .
Metals 10 00300 g002
Figure 3. (Color online) The enlarged view of the data for the potential energy (ac) and shear stress (df) during 6 periods ( T = 5000 τ ) near the yielding transition. The samples were prepared with the cooling rates 10 3 ε / k B τ (a, d), 10 4 ε / k B τ (b, e), and 10 5 ε / k B τ (c,f). The same data as in Figure 1 and Figure 2.
Metals 10 00300 g003
Figure 4. (Color online) The shear stress σ x z (in units of ε σ 3 ) as a function of strain during startup deformation with the constant strain rate 10 5 τ 1 up to γ x z = 0.20 . The samples were initially prepared with the cooling rates 10 2 ε / k B τ (black), 10 3 ε / k B τ (red), 10 4 ε / k B τ (green), and 10 5 ε / k B τ (blue). The vertical dashed line indicates the value of shear strain γ x z = 0.075 .
Metals 10 00300 g004
Figure 5. (Color online) The snapshots of the binary glass at zero strain after periodic deformation with the strain amplitude γ 0 = 0.075 during (a) 10, (b) 50, (c) 55, and (d) 56 shear cycles. The color denotes D 2 ( n T , T ) after a full cycle, as indicated in the legend. The oscillation period is T = 5000 τ . Only atoms with relatively large nonaffine displacements during one cycle, D 2 ( n T , T ) > 0.04 σ 2 , are displayed. The initial cooling rate is 10 5 ε / k B τ . The atoms are not depicted to scale.
Metals 10 00300 g005
Figure 6. (Color online) The atomic configurations at zero strain after oscillatory deformation with the strain amplitude γ 0 = 0.075 during (a) 57, (b) 60, (c) 70, and (d) 100 cycles. The colorcode and the deformation protocol are the same as in Figure 5. The cooling rate is 10 5 ε / k B τ .
Metals 10 00300 g006
Figure 7. (Color online) The variation of the nonaffine measure D 2 ( n T , T ) for the indicated values of the cycle number, n. The oscillation period is T = 5000 τ . The quantity D 2 ( n T , T ) was computed in narrow slices parallel to the x y plane. The sample was initially cooled with the rate 10 5 ε / k B τ .
Metals 10 00300 g007
Figure 8. (Color online) The configurations of atoms at zero strain after cyclic loading with the strain amplitude γ 0 = 0.075 during (a) 5, (b) 9, (c) 30, and (d) 100 cycles. The colorcode for D 2 ( n T , T ) after one cycle ( T = 5000 τ ) is specified in the legend. The atoms with D 2 ( n T , T ) < 0.04 σ 2 are not shown. The glass was cooled with the rate 10 2 ε / k B τ .
Metals 10 00300 g008
Figure 9. (Color online) The nonaffine quantity D 2 ( n T , T ) as a function of the x coordinate for the indicated cycle numbers, n. The oscillation period is T = 5000 τ . The quantity D 2 ( n T , T ) was averaged in narrow bins parallel to the y z plane. The initial cooling rate is 10 2 ε / k B τ .
Metals 10 00300 g009
Figure 10. (Color online) The correlation function C D 2 ( Δ r ) defined by Equation (4) for the sample initially cooled with the rate 10 5 ε / k B τ . The values of the cycle number for the nonaffine measure D 2 ( n T , T ) are listed in the legend. The same cycle numbers as in Figure 7.
Metals 10 00300 g010
Figure 11. (Color online) The spatial variation of the correlation function C D 2 ( Δ r ) for the indicated values of the cycle number. Before cyclic loading, the binary glass was annealed to the temperature T L J = 0.01 ε / k B with the rate 10 2 ε / k B τ .
Metals 10 00300 g011