Optimizing Mandrel Dimensions for a Fixture Hardening Process of High-Strength Steel Aerospace Parts by Finite Element Simulation

Abstract
:1. Introduction
2. Materials and Methods
2.1. Mathematical Framework
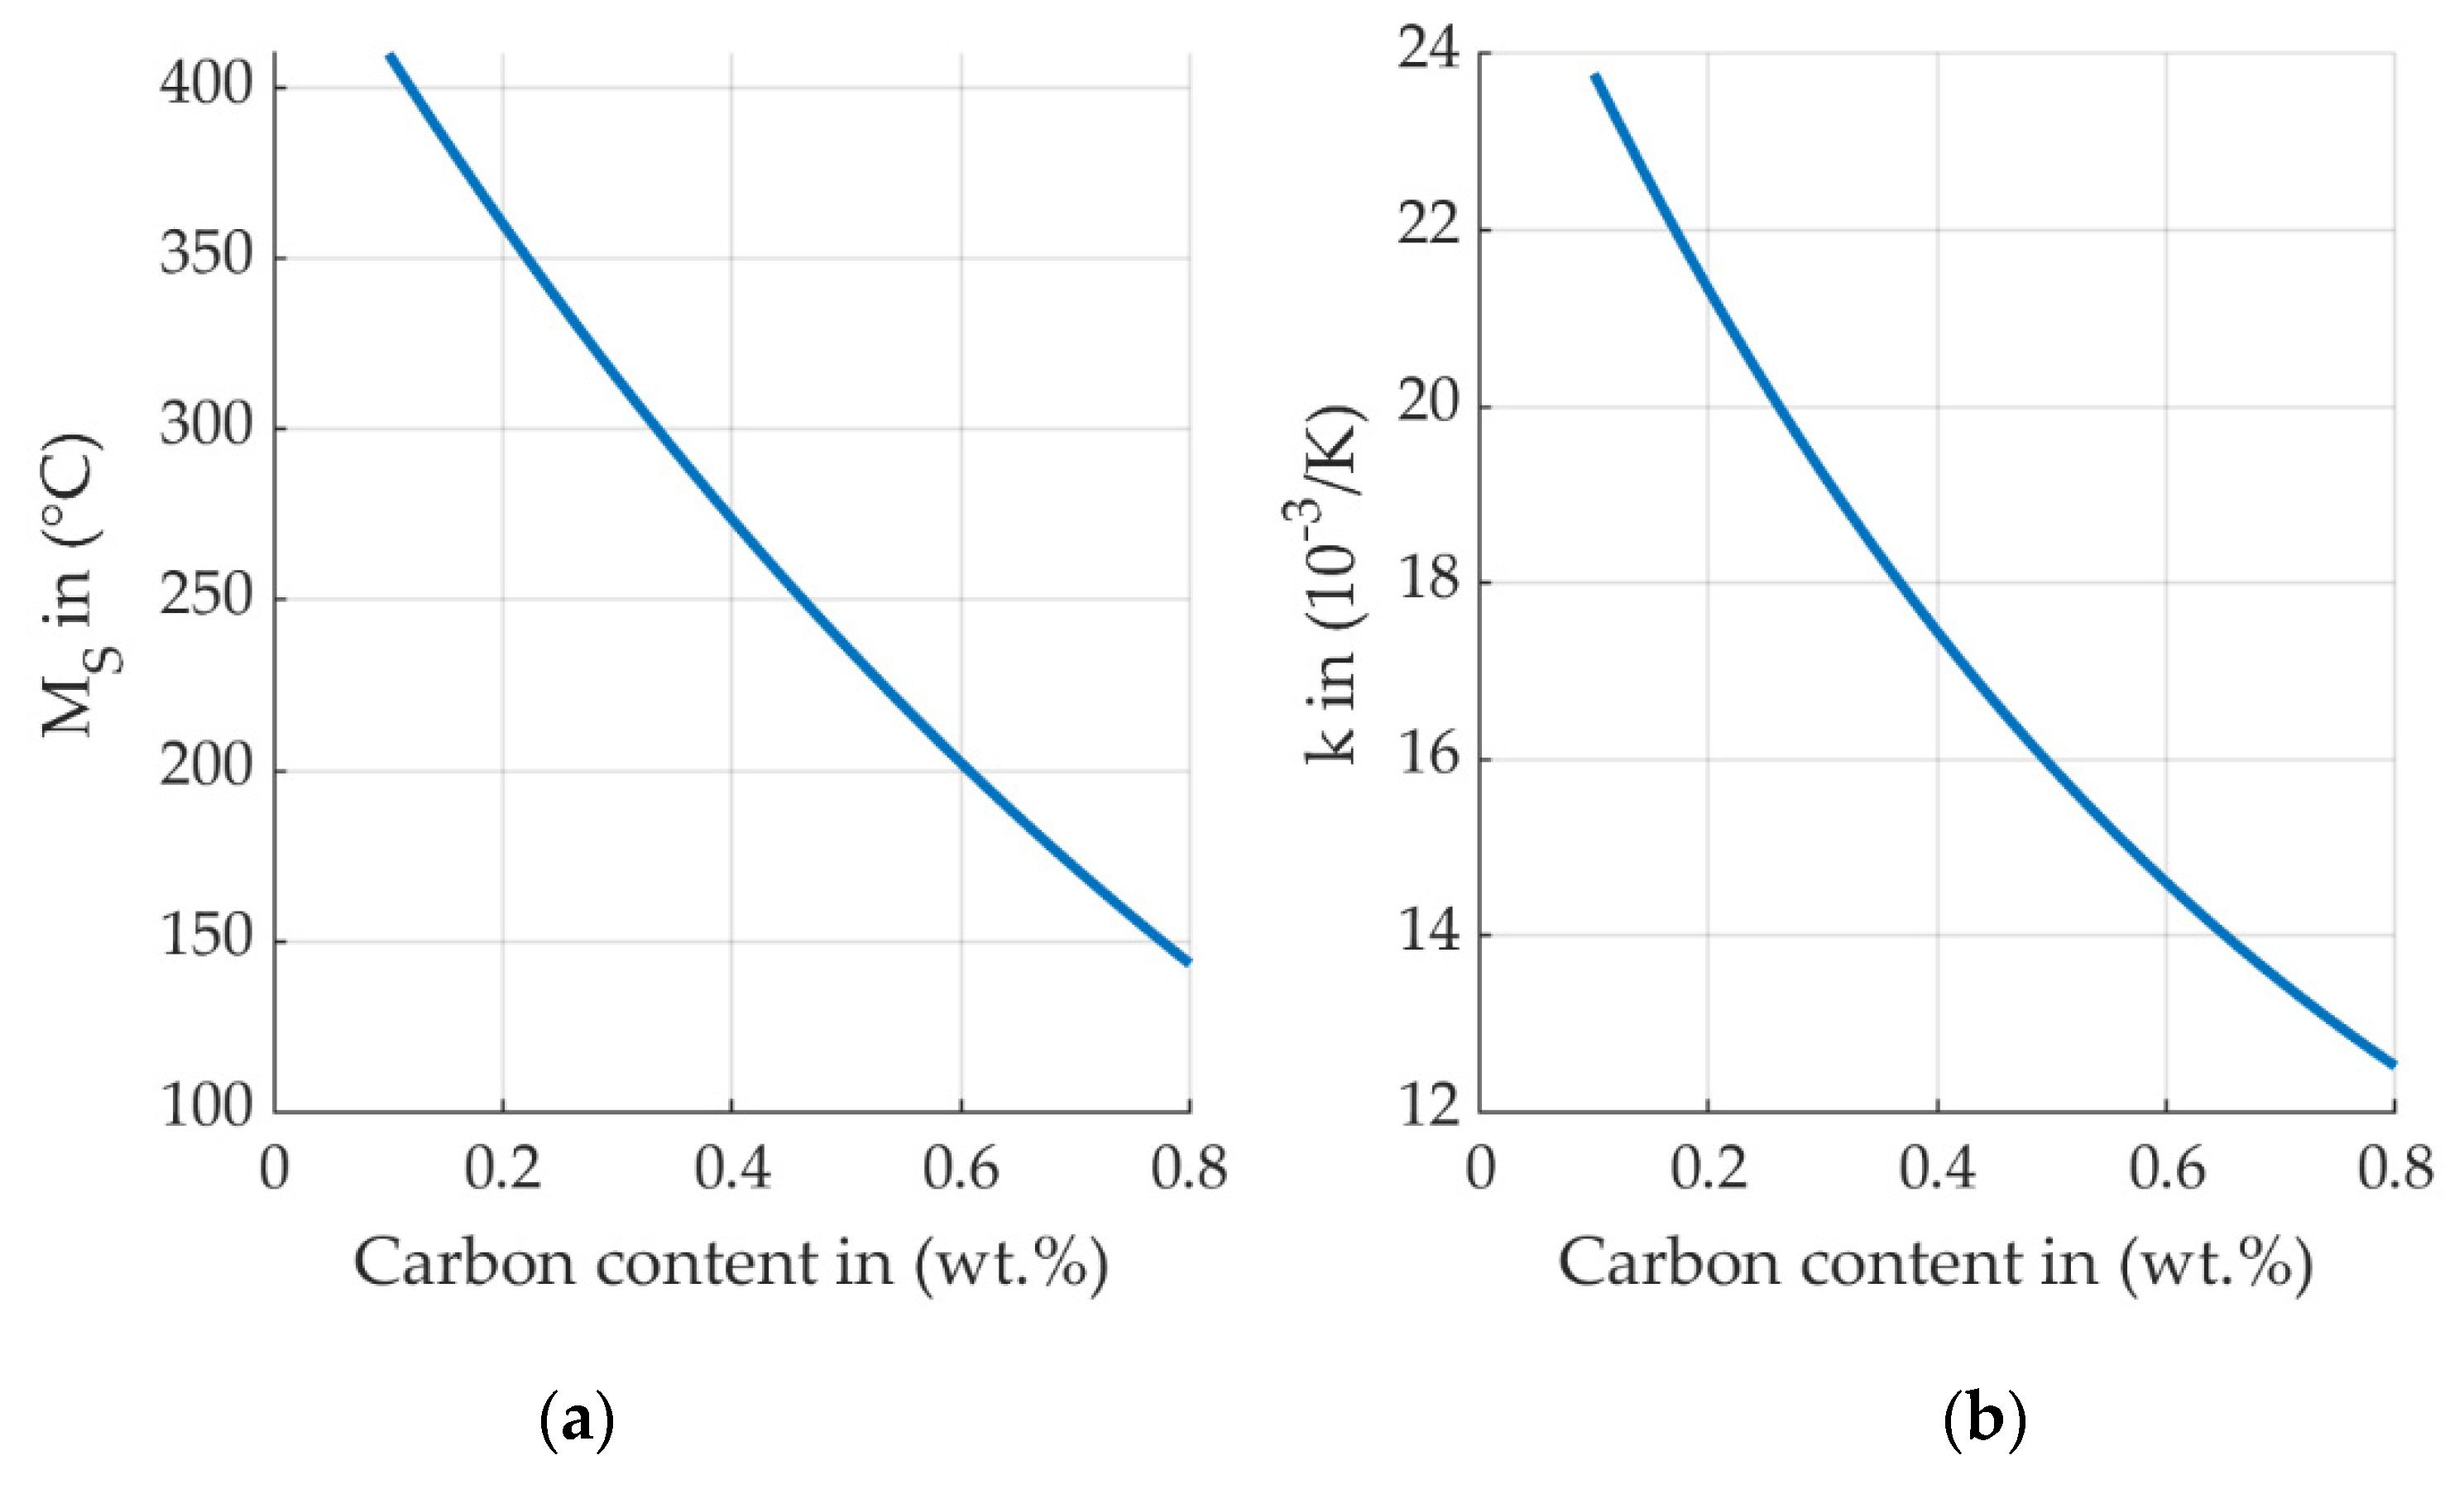
2.2. Material Data
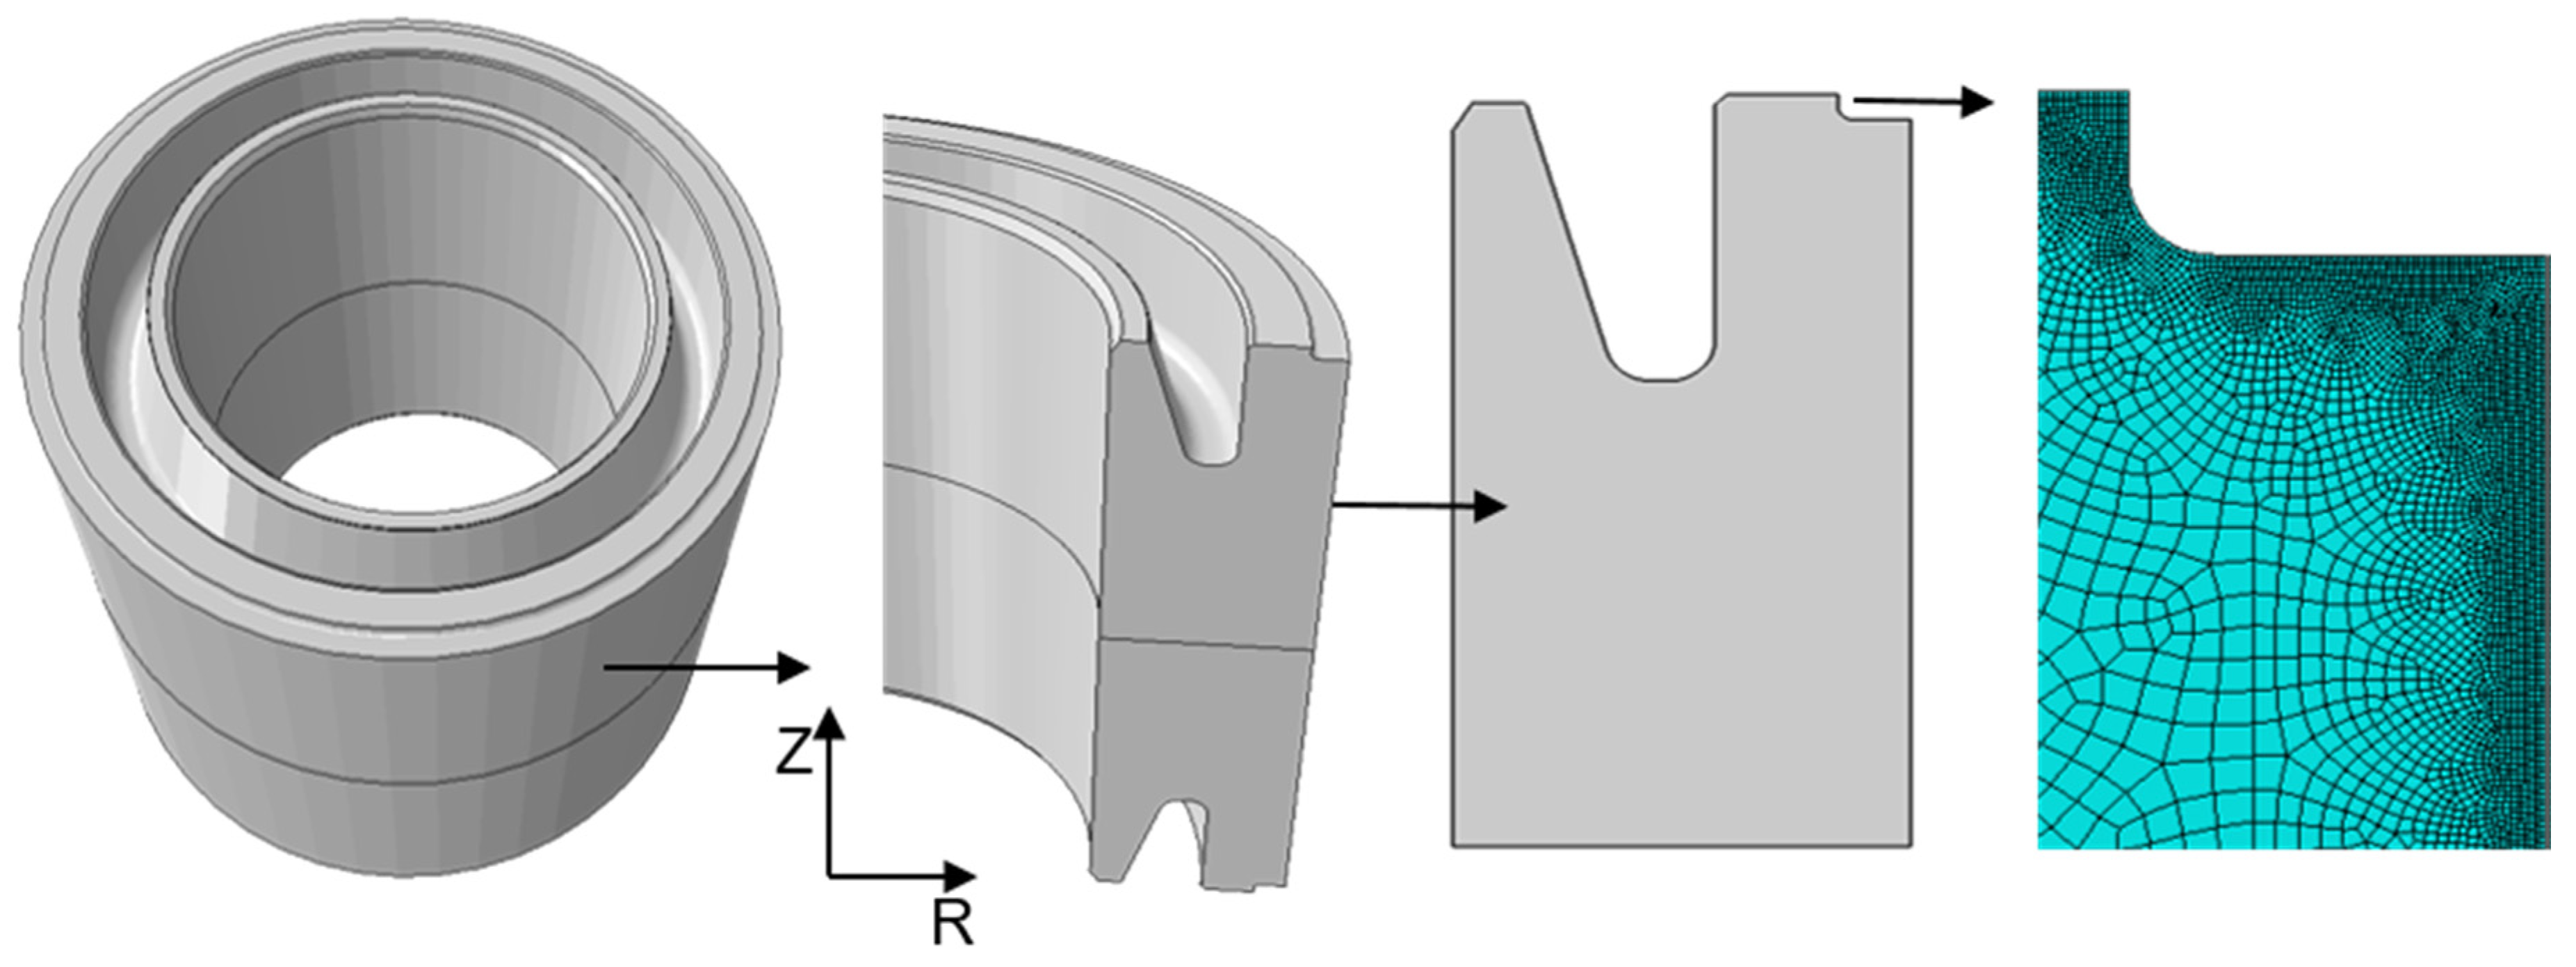
2.3. Model Geometry
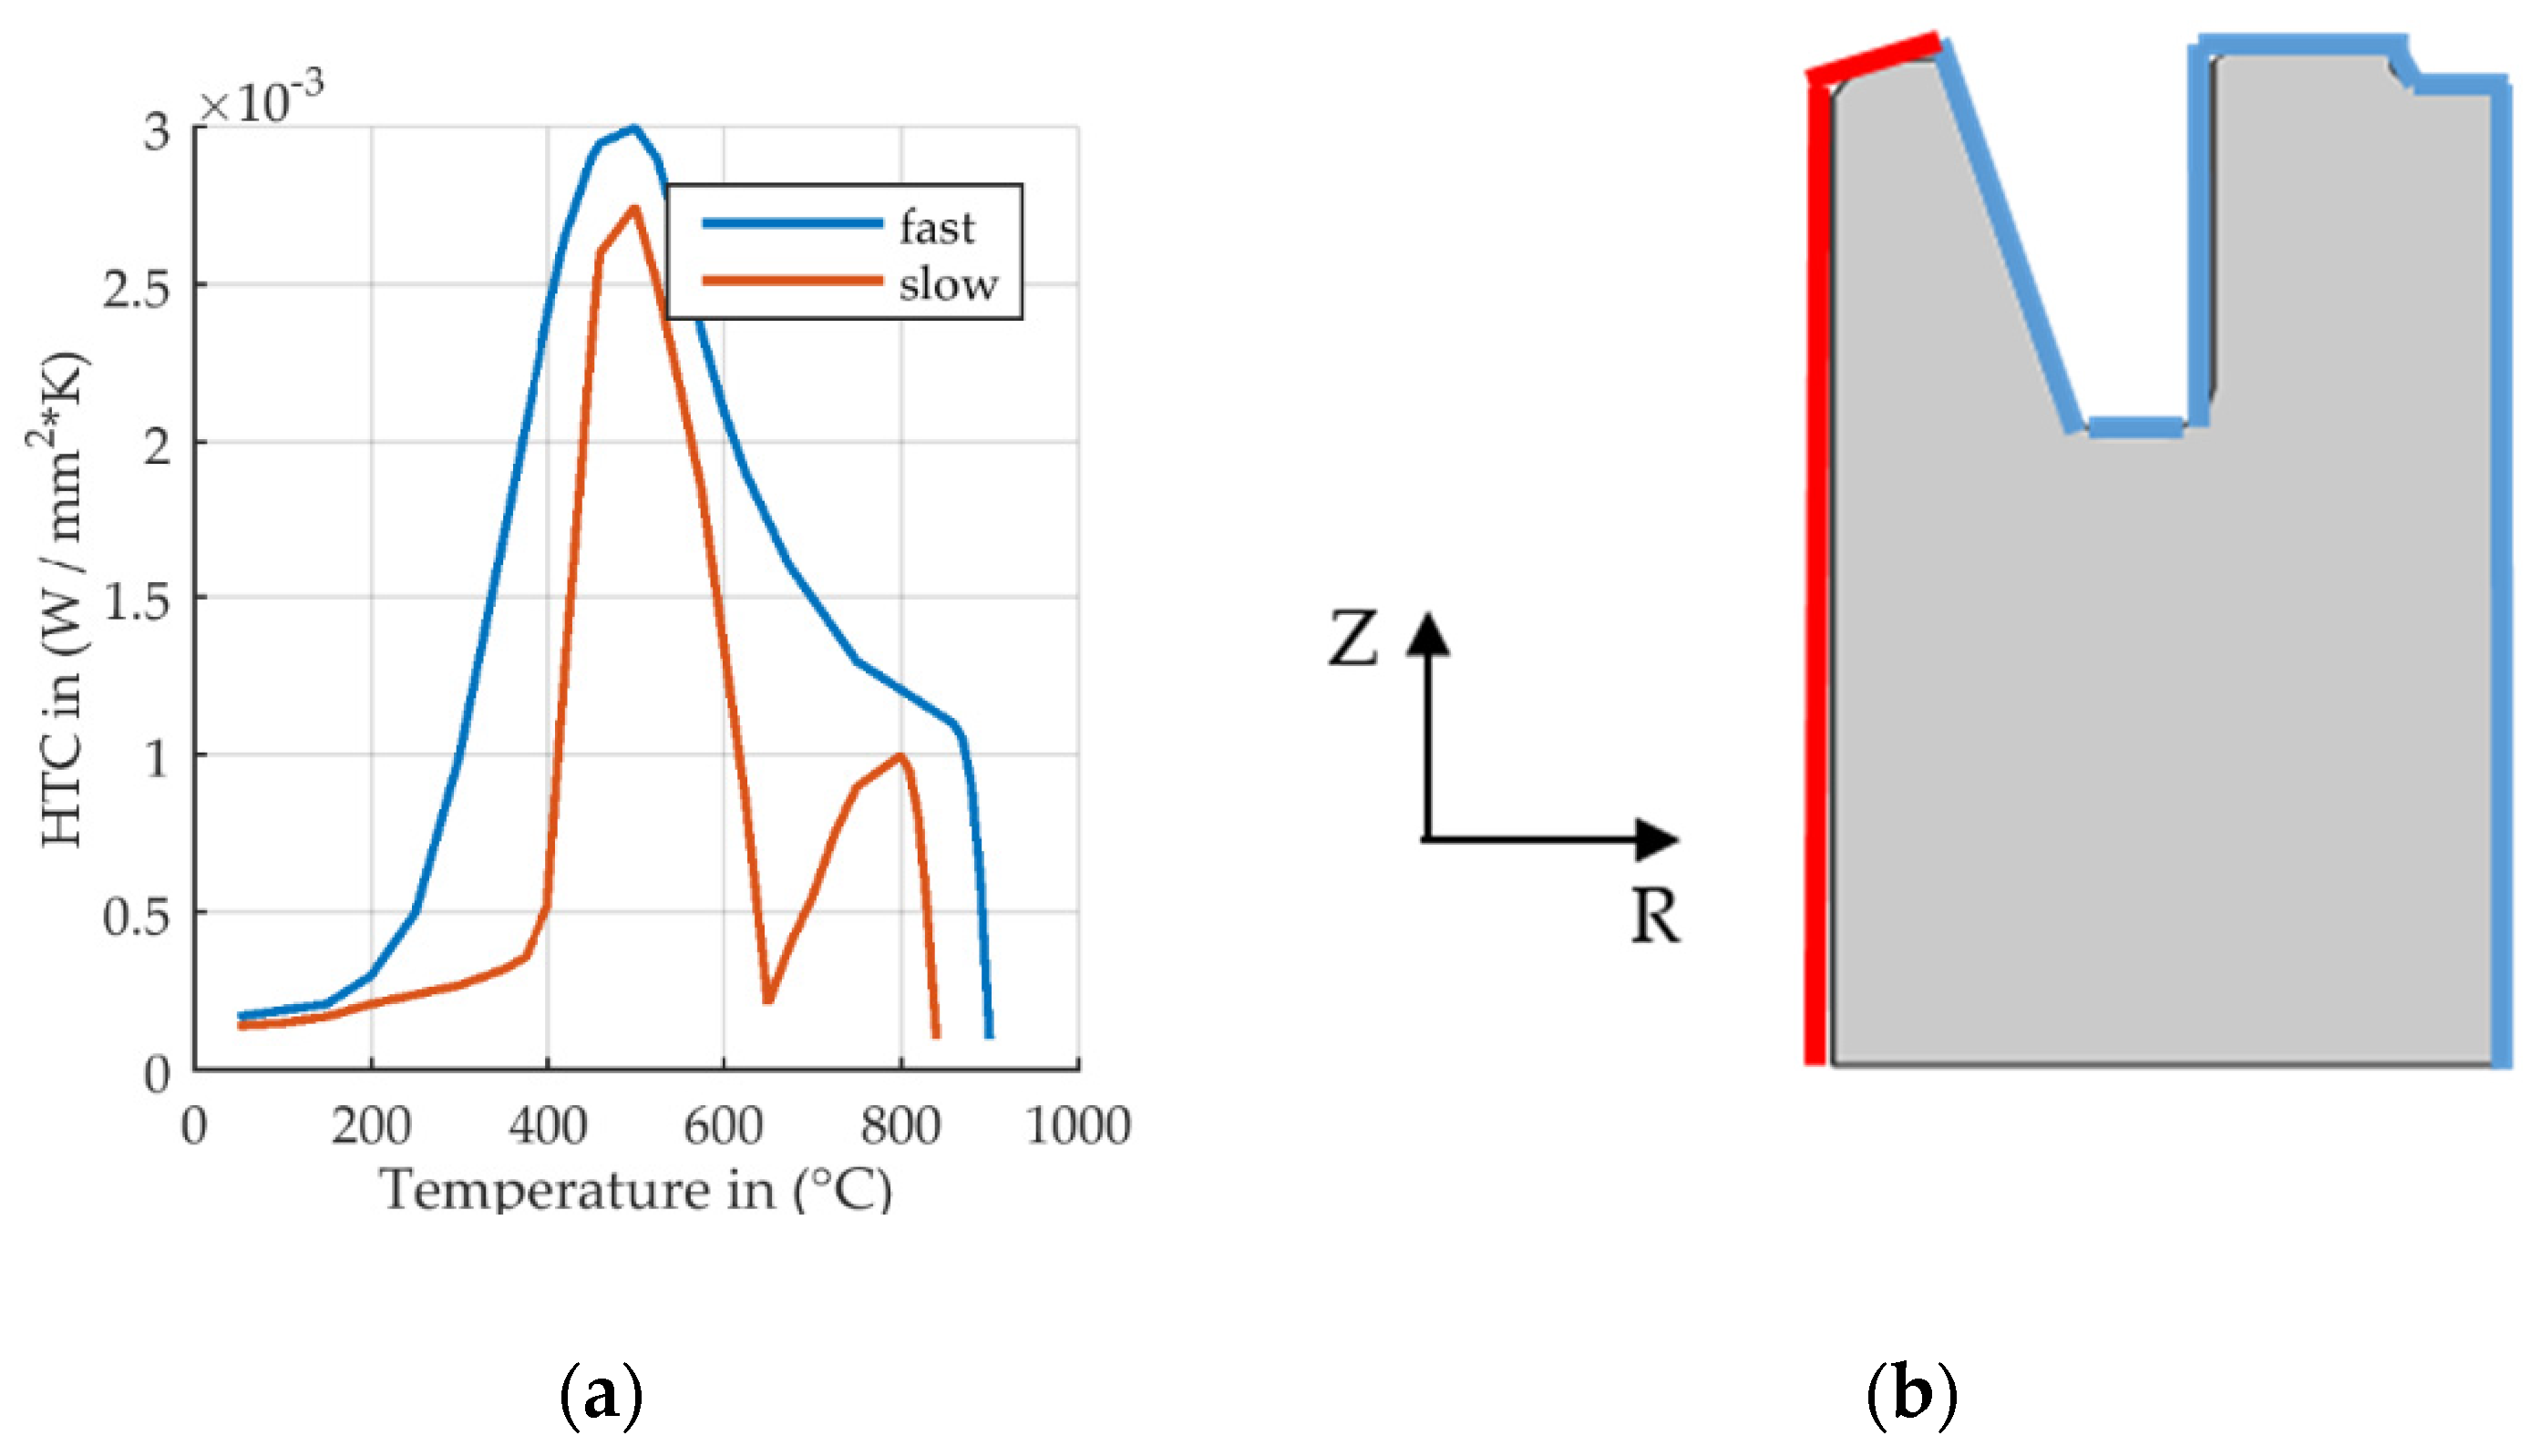
2.4. Boundary and Initial Conditions
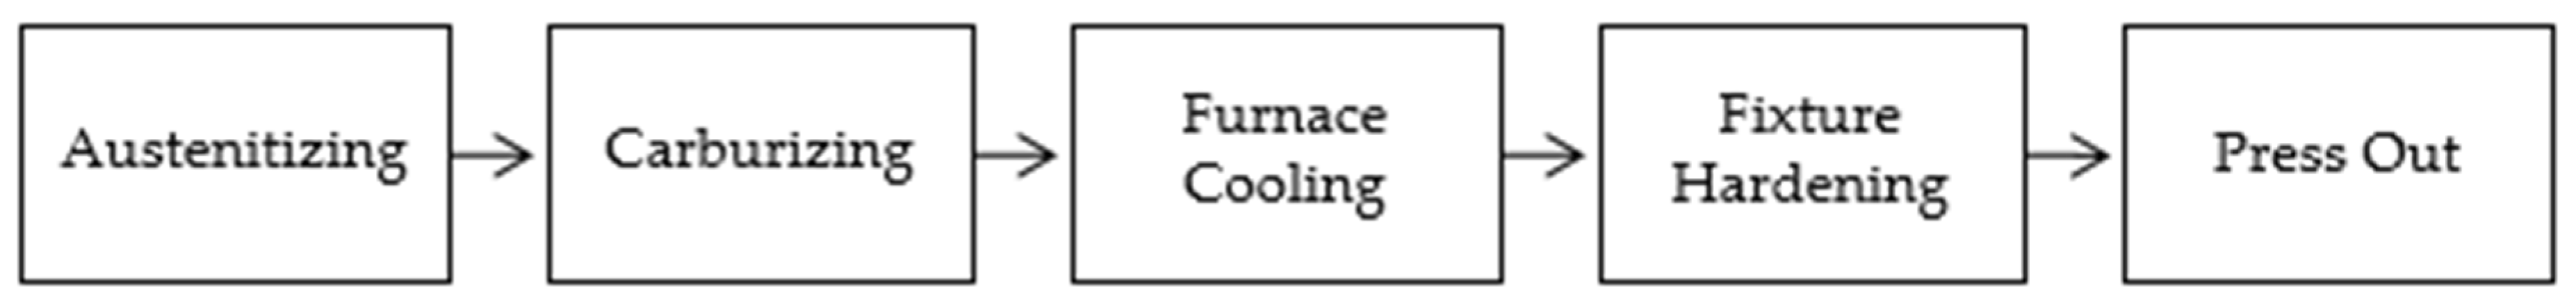
2.5. Simulated Process Steps
2.6. Study Parameter
2.7. Numerical Aspects
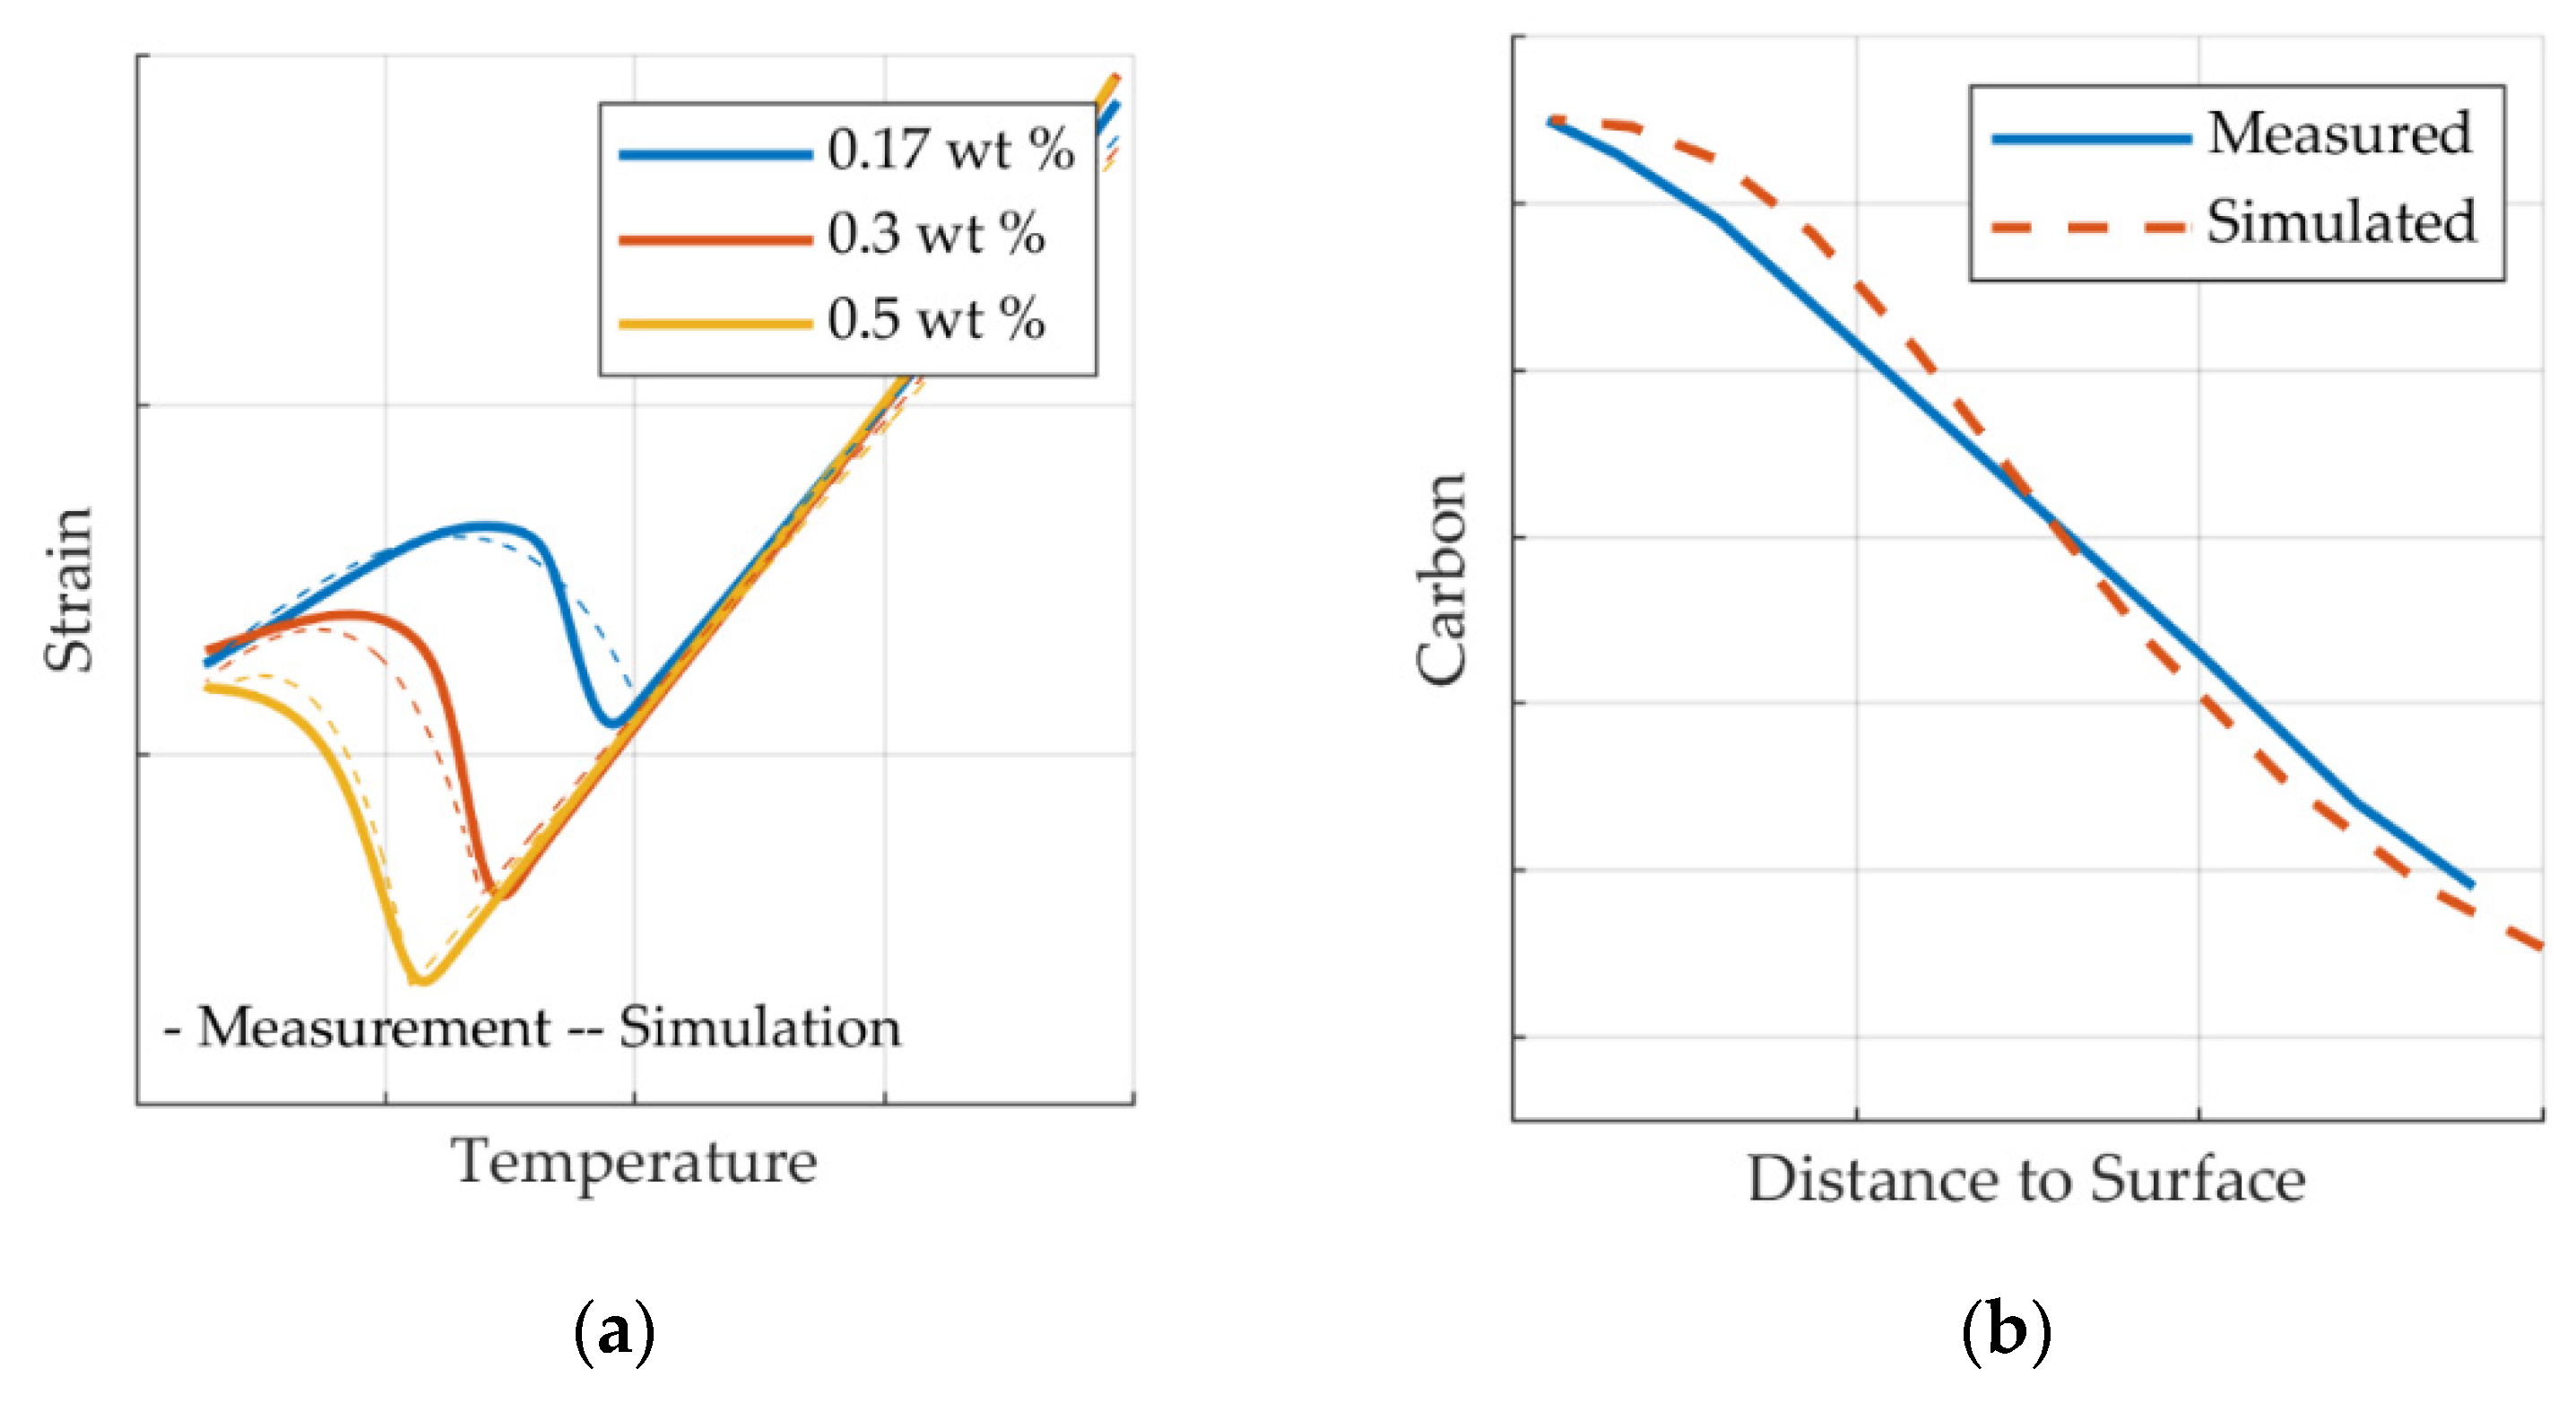
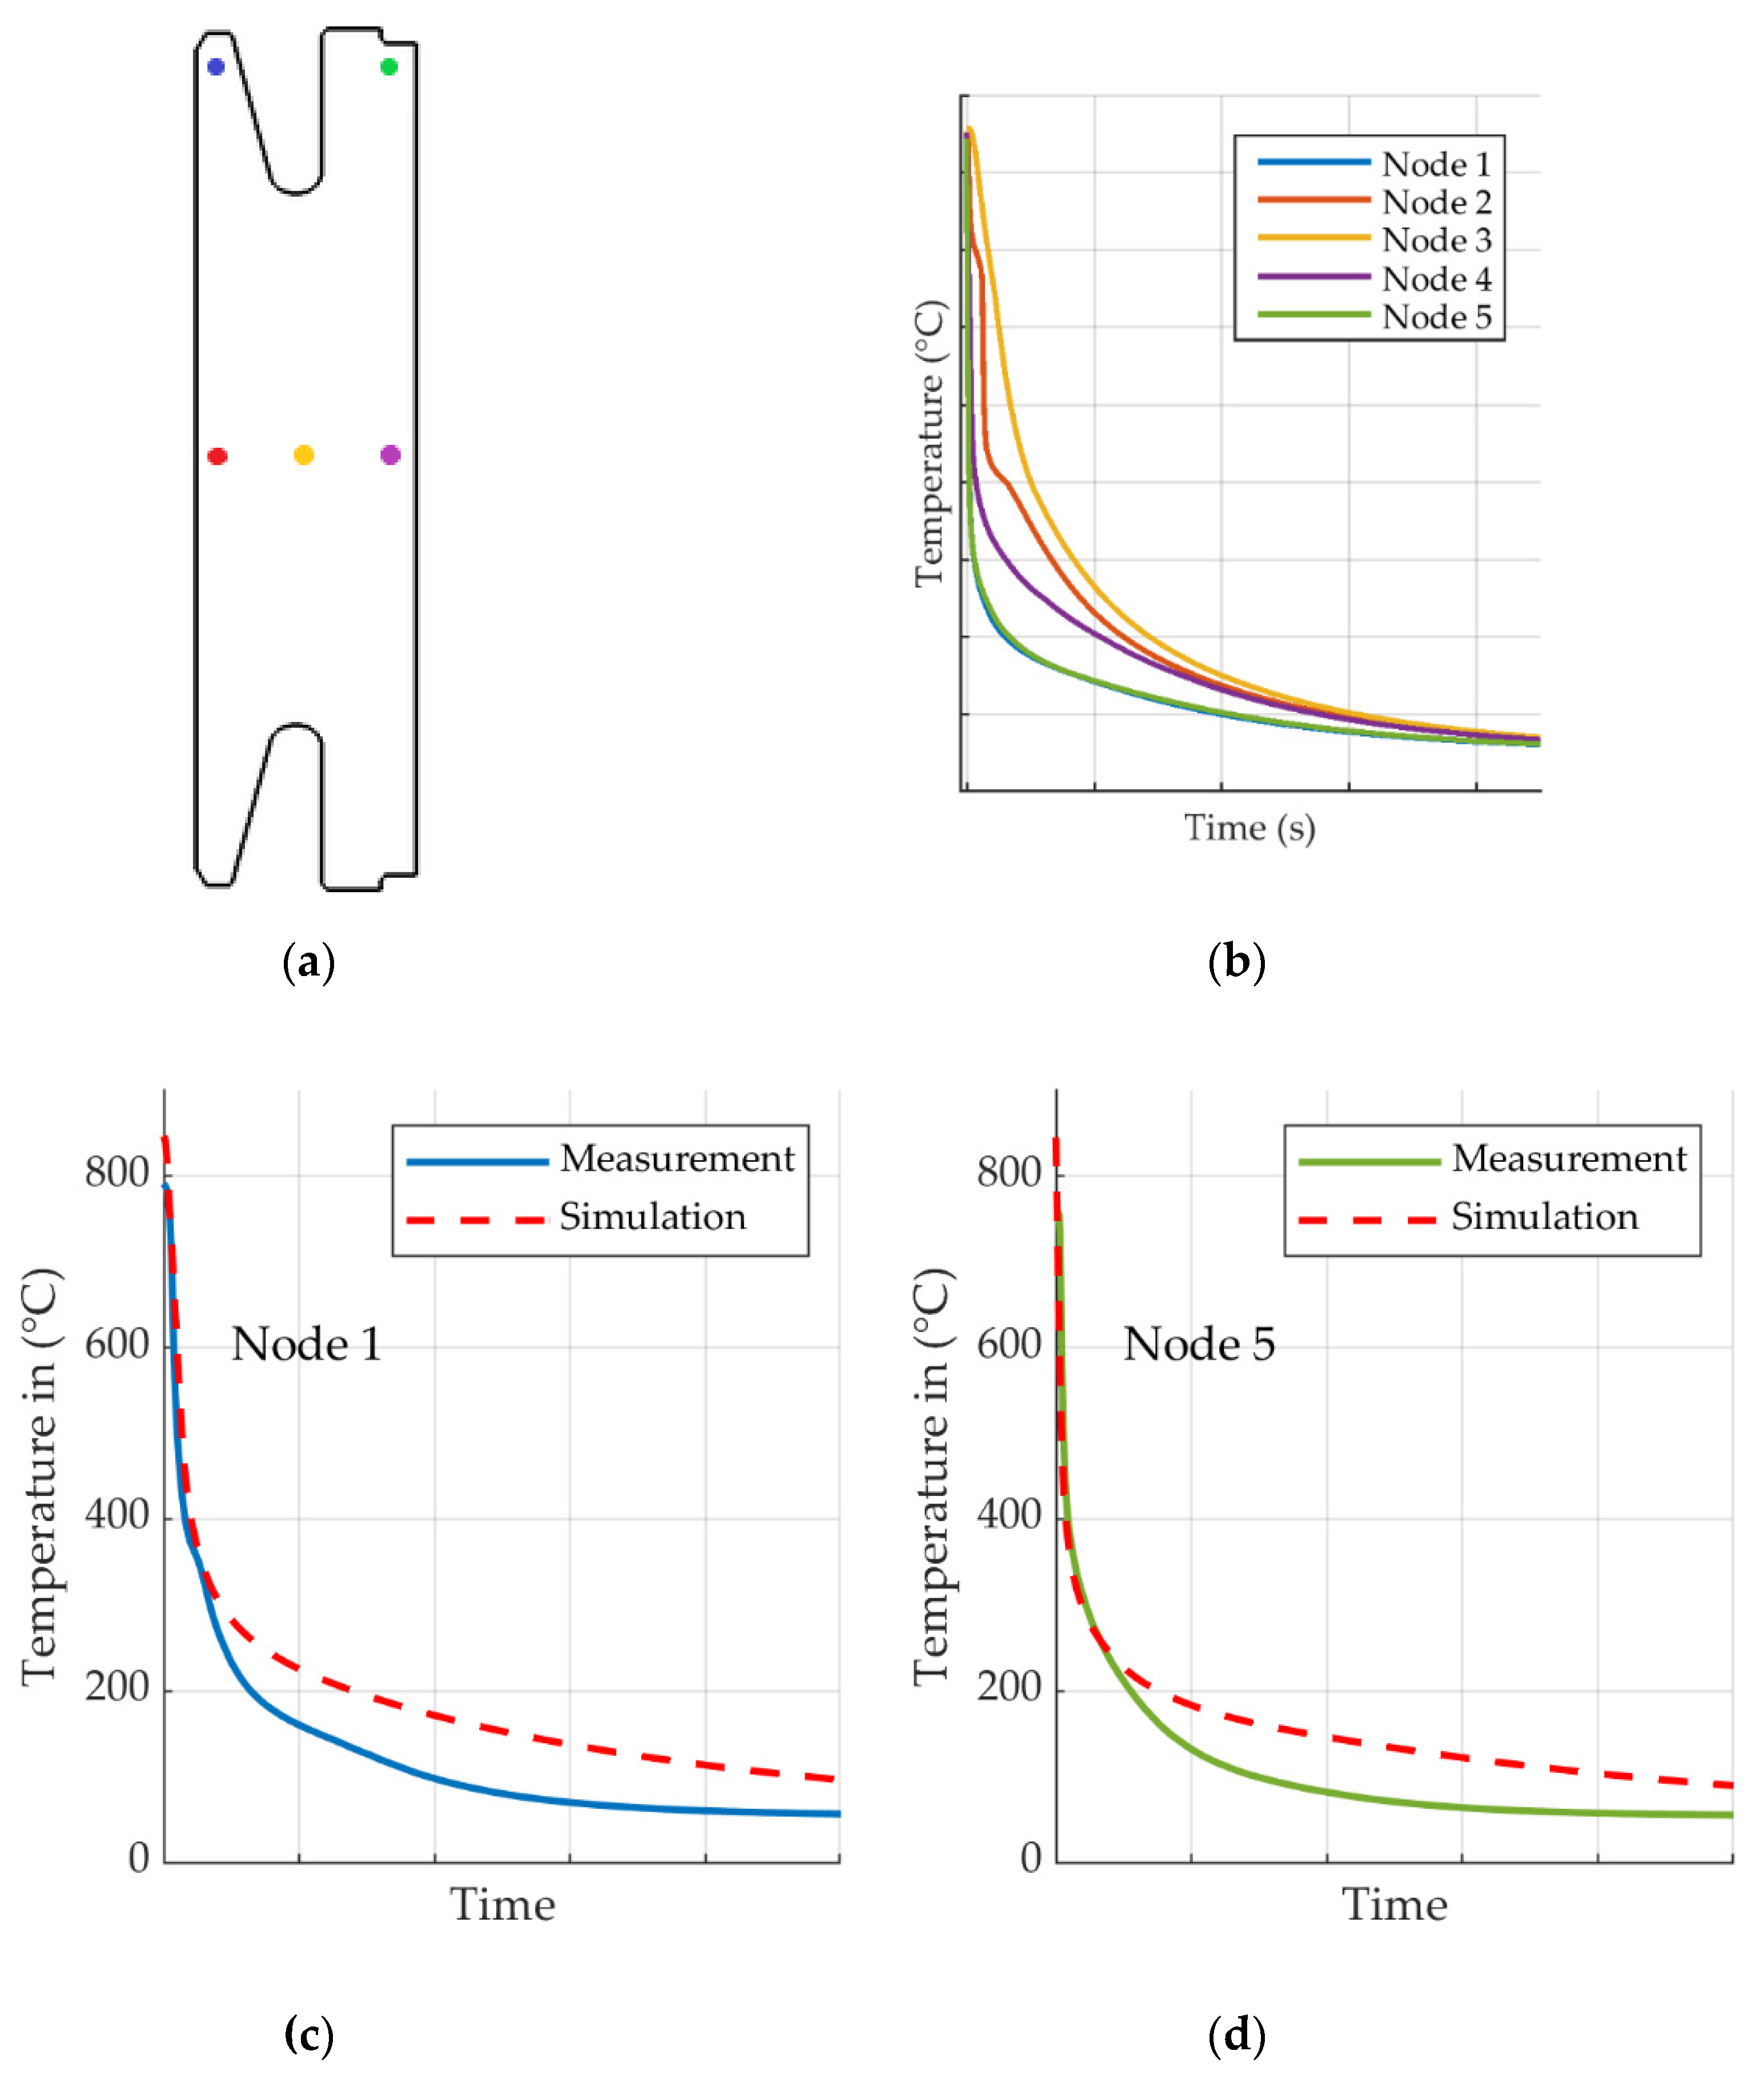
2.8. Model Validation
3. Results
3.1. Temperature Curves
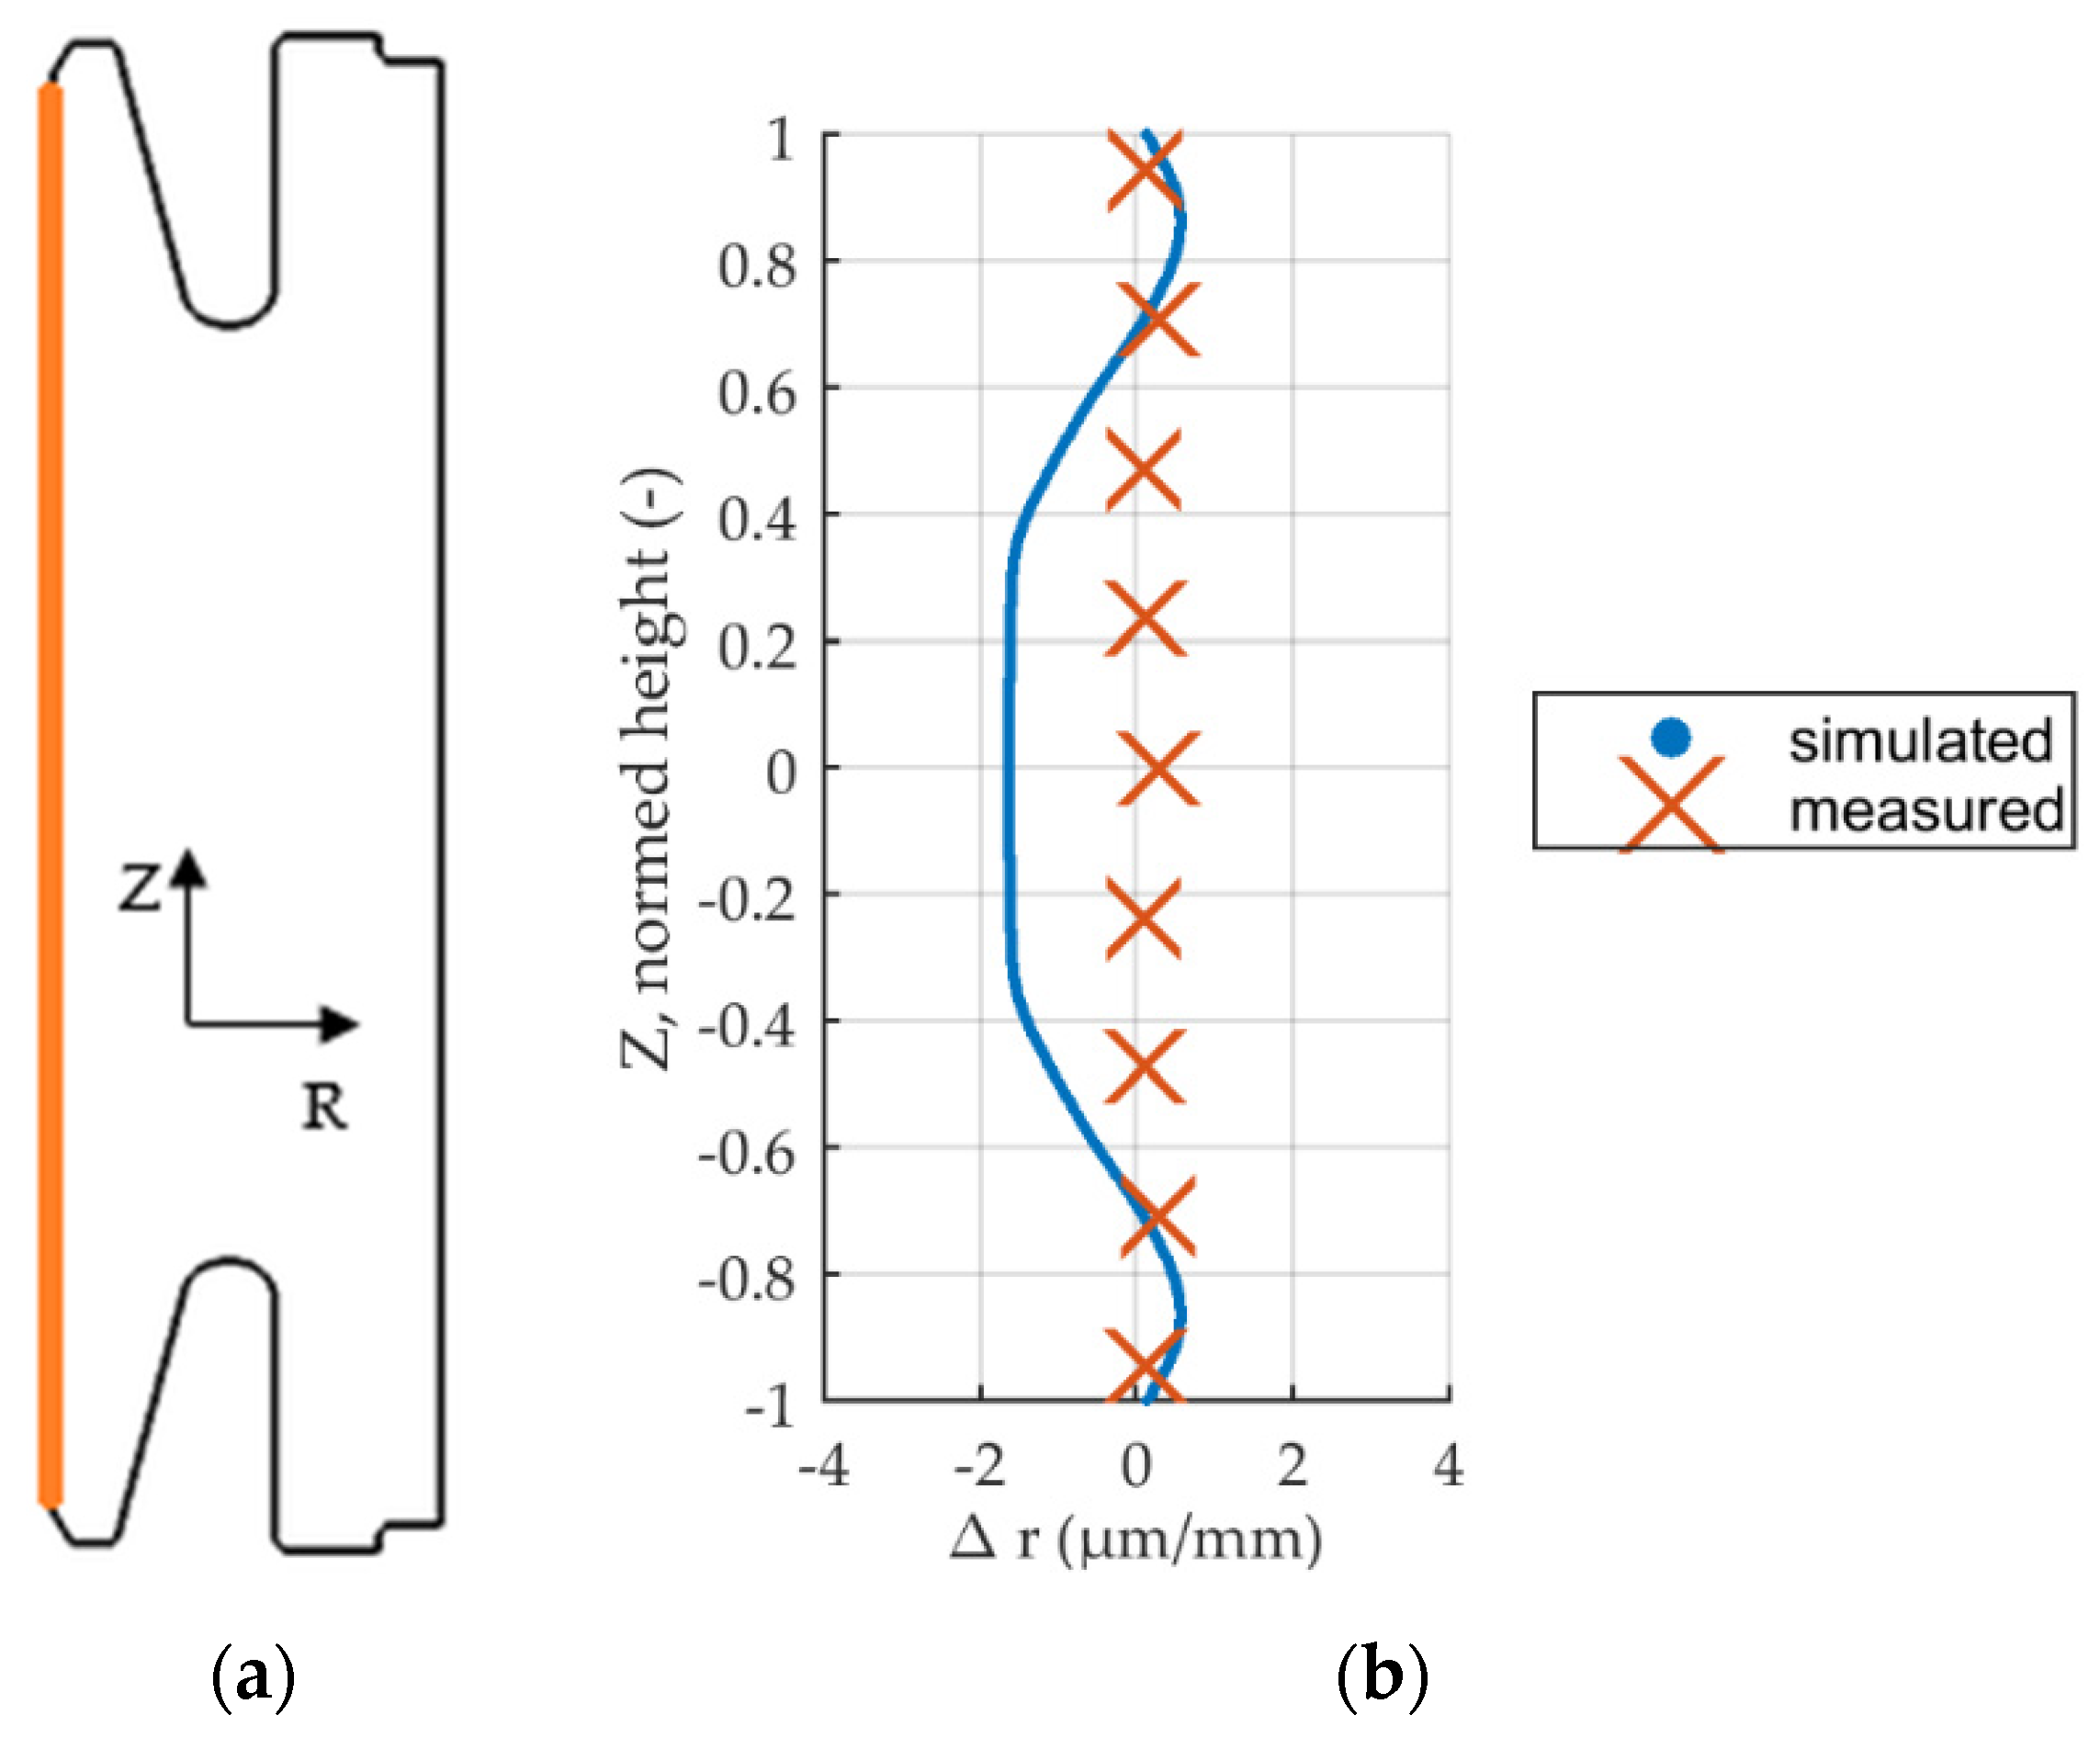
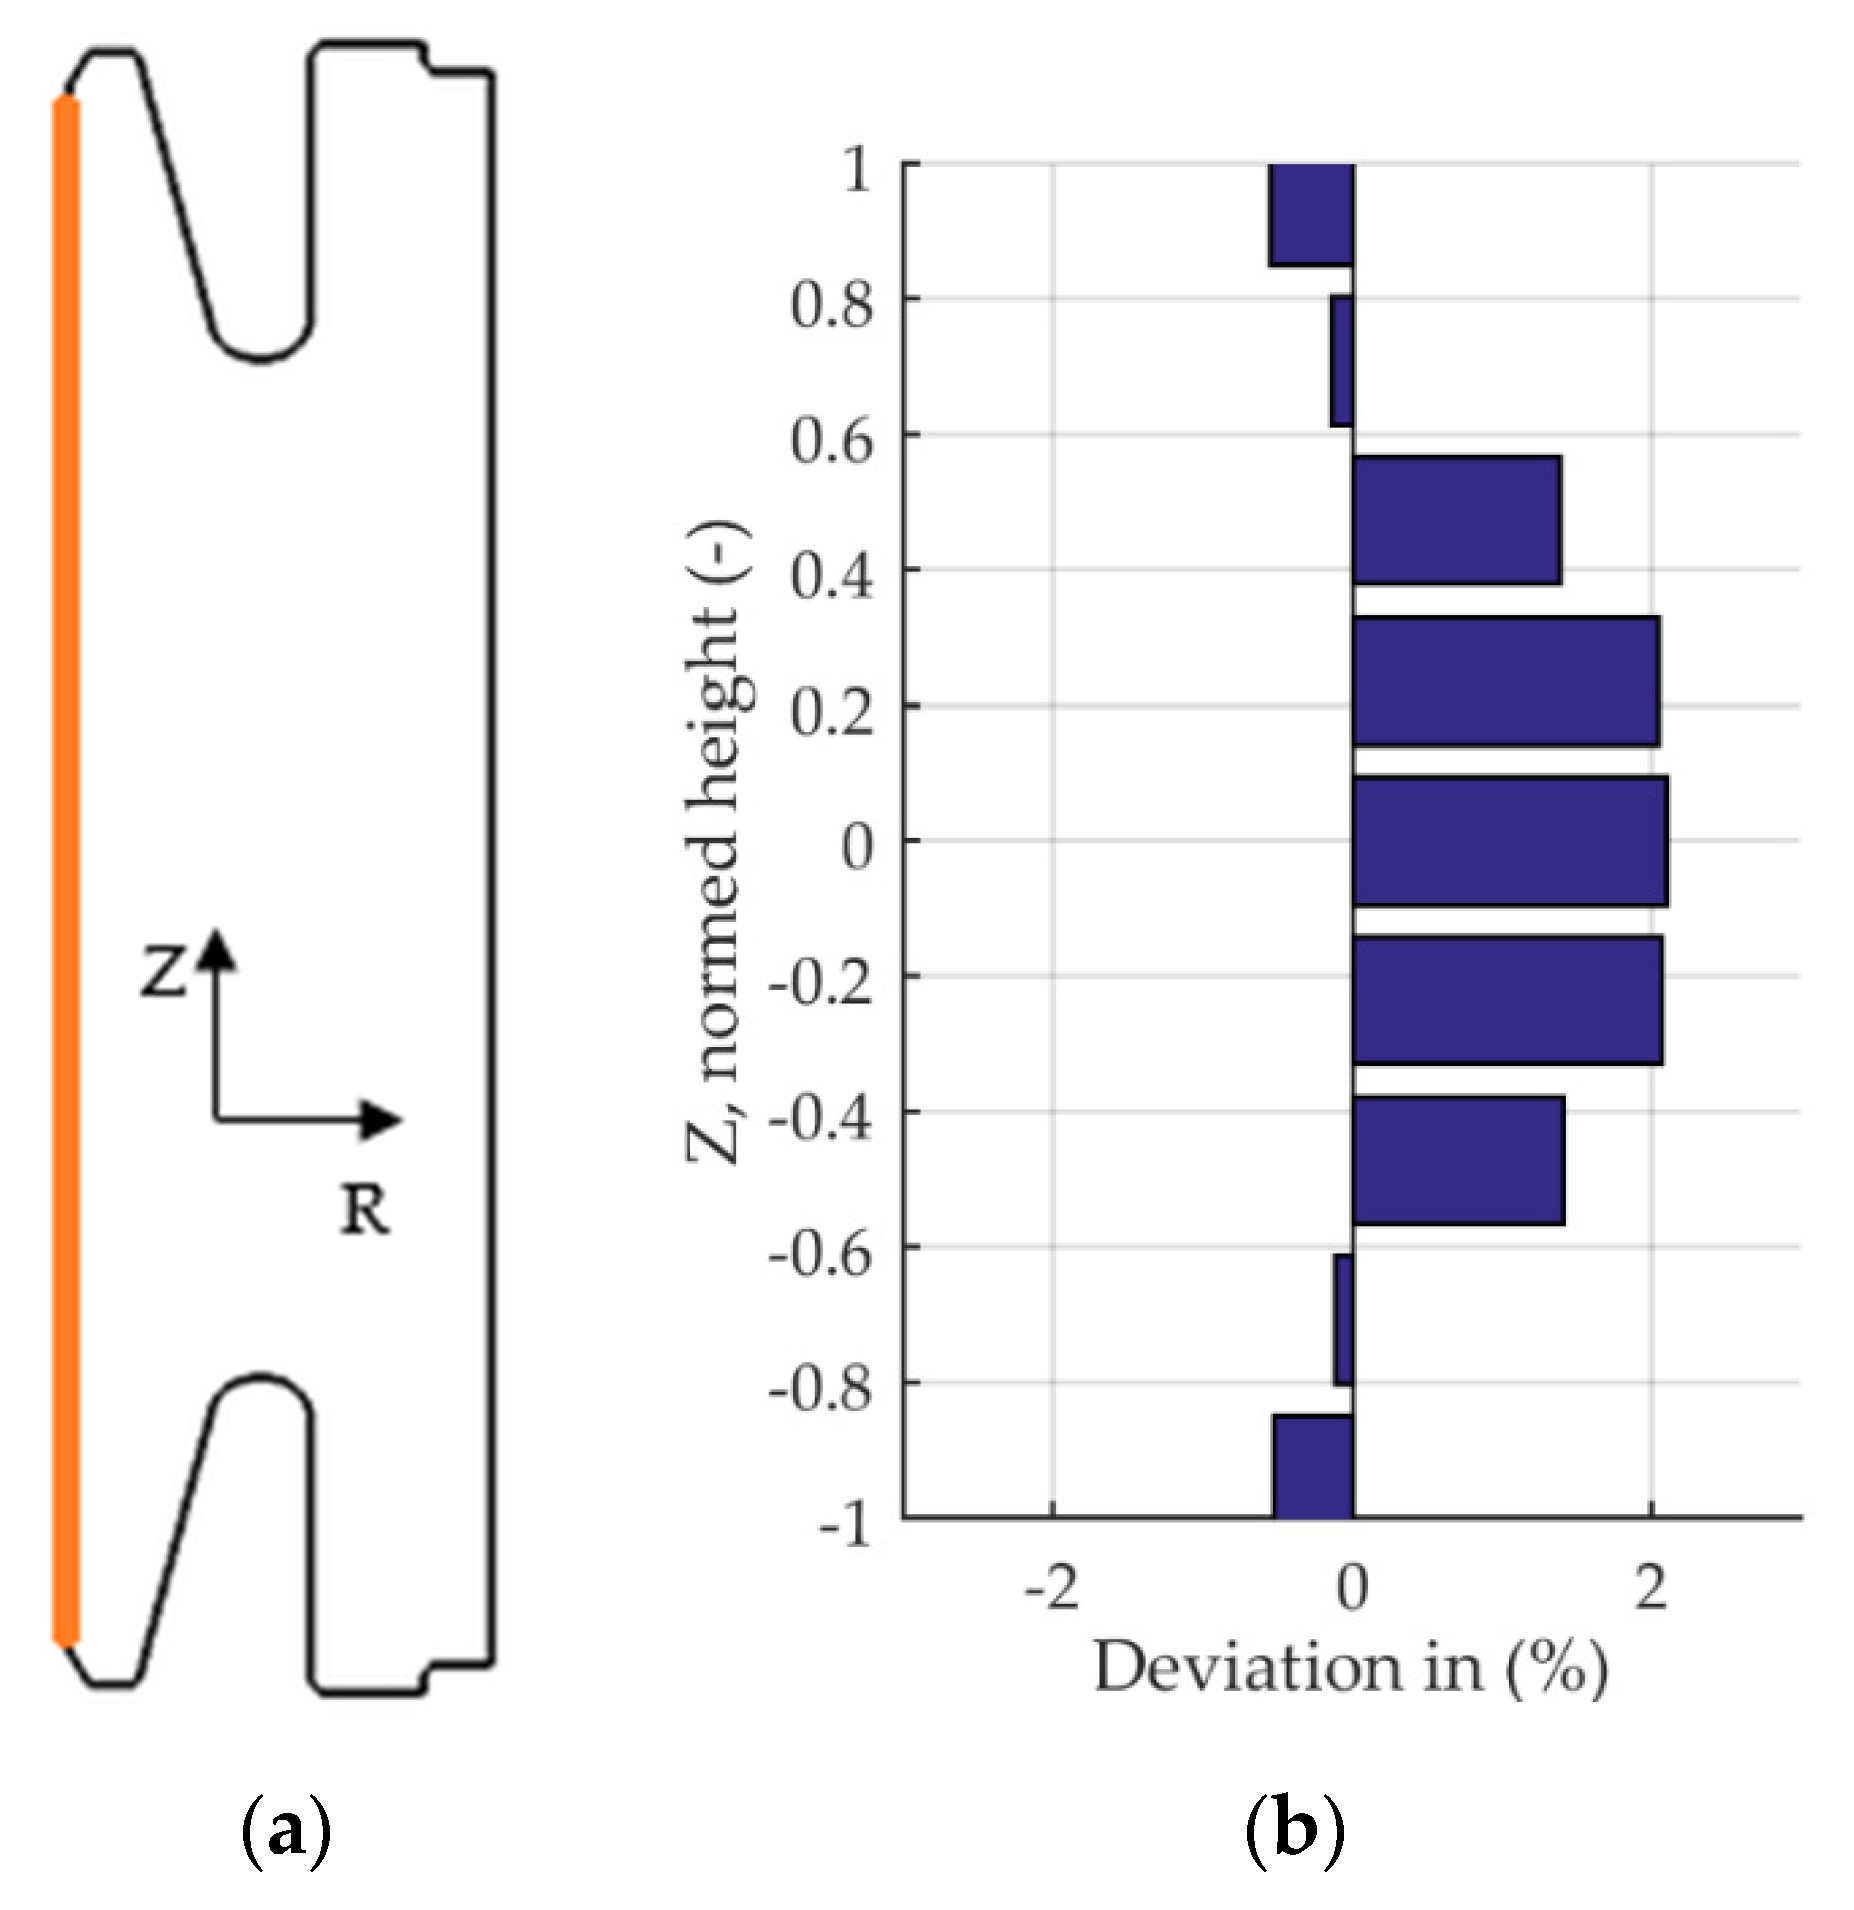
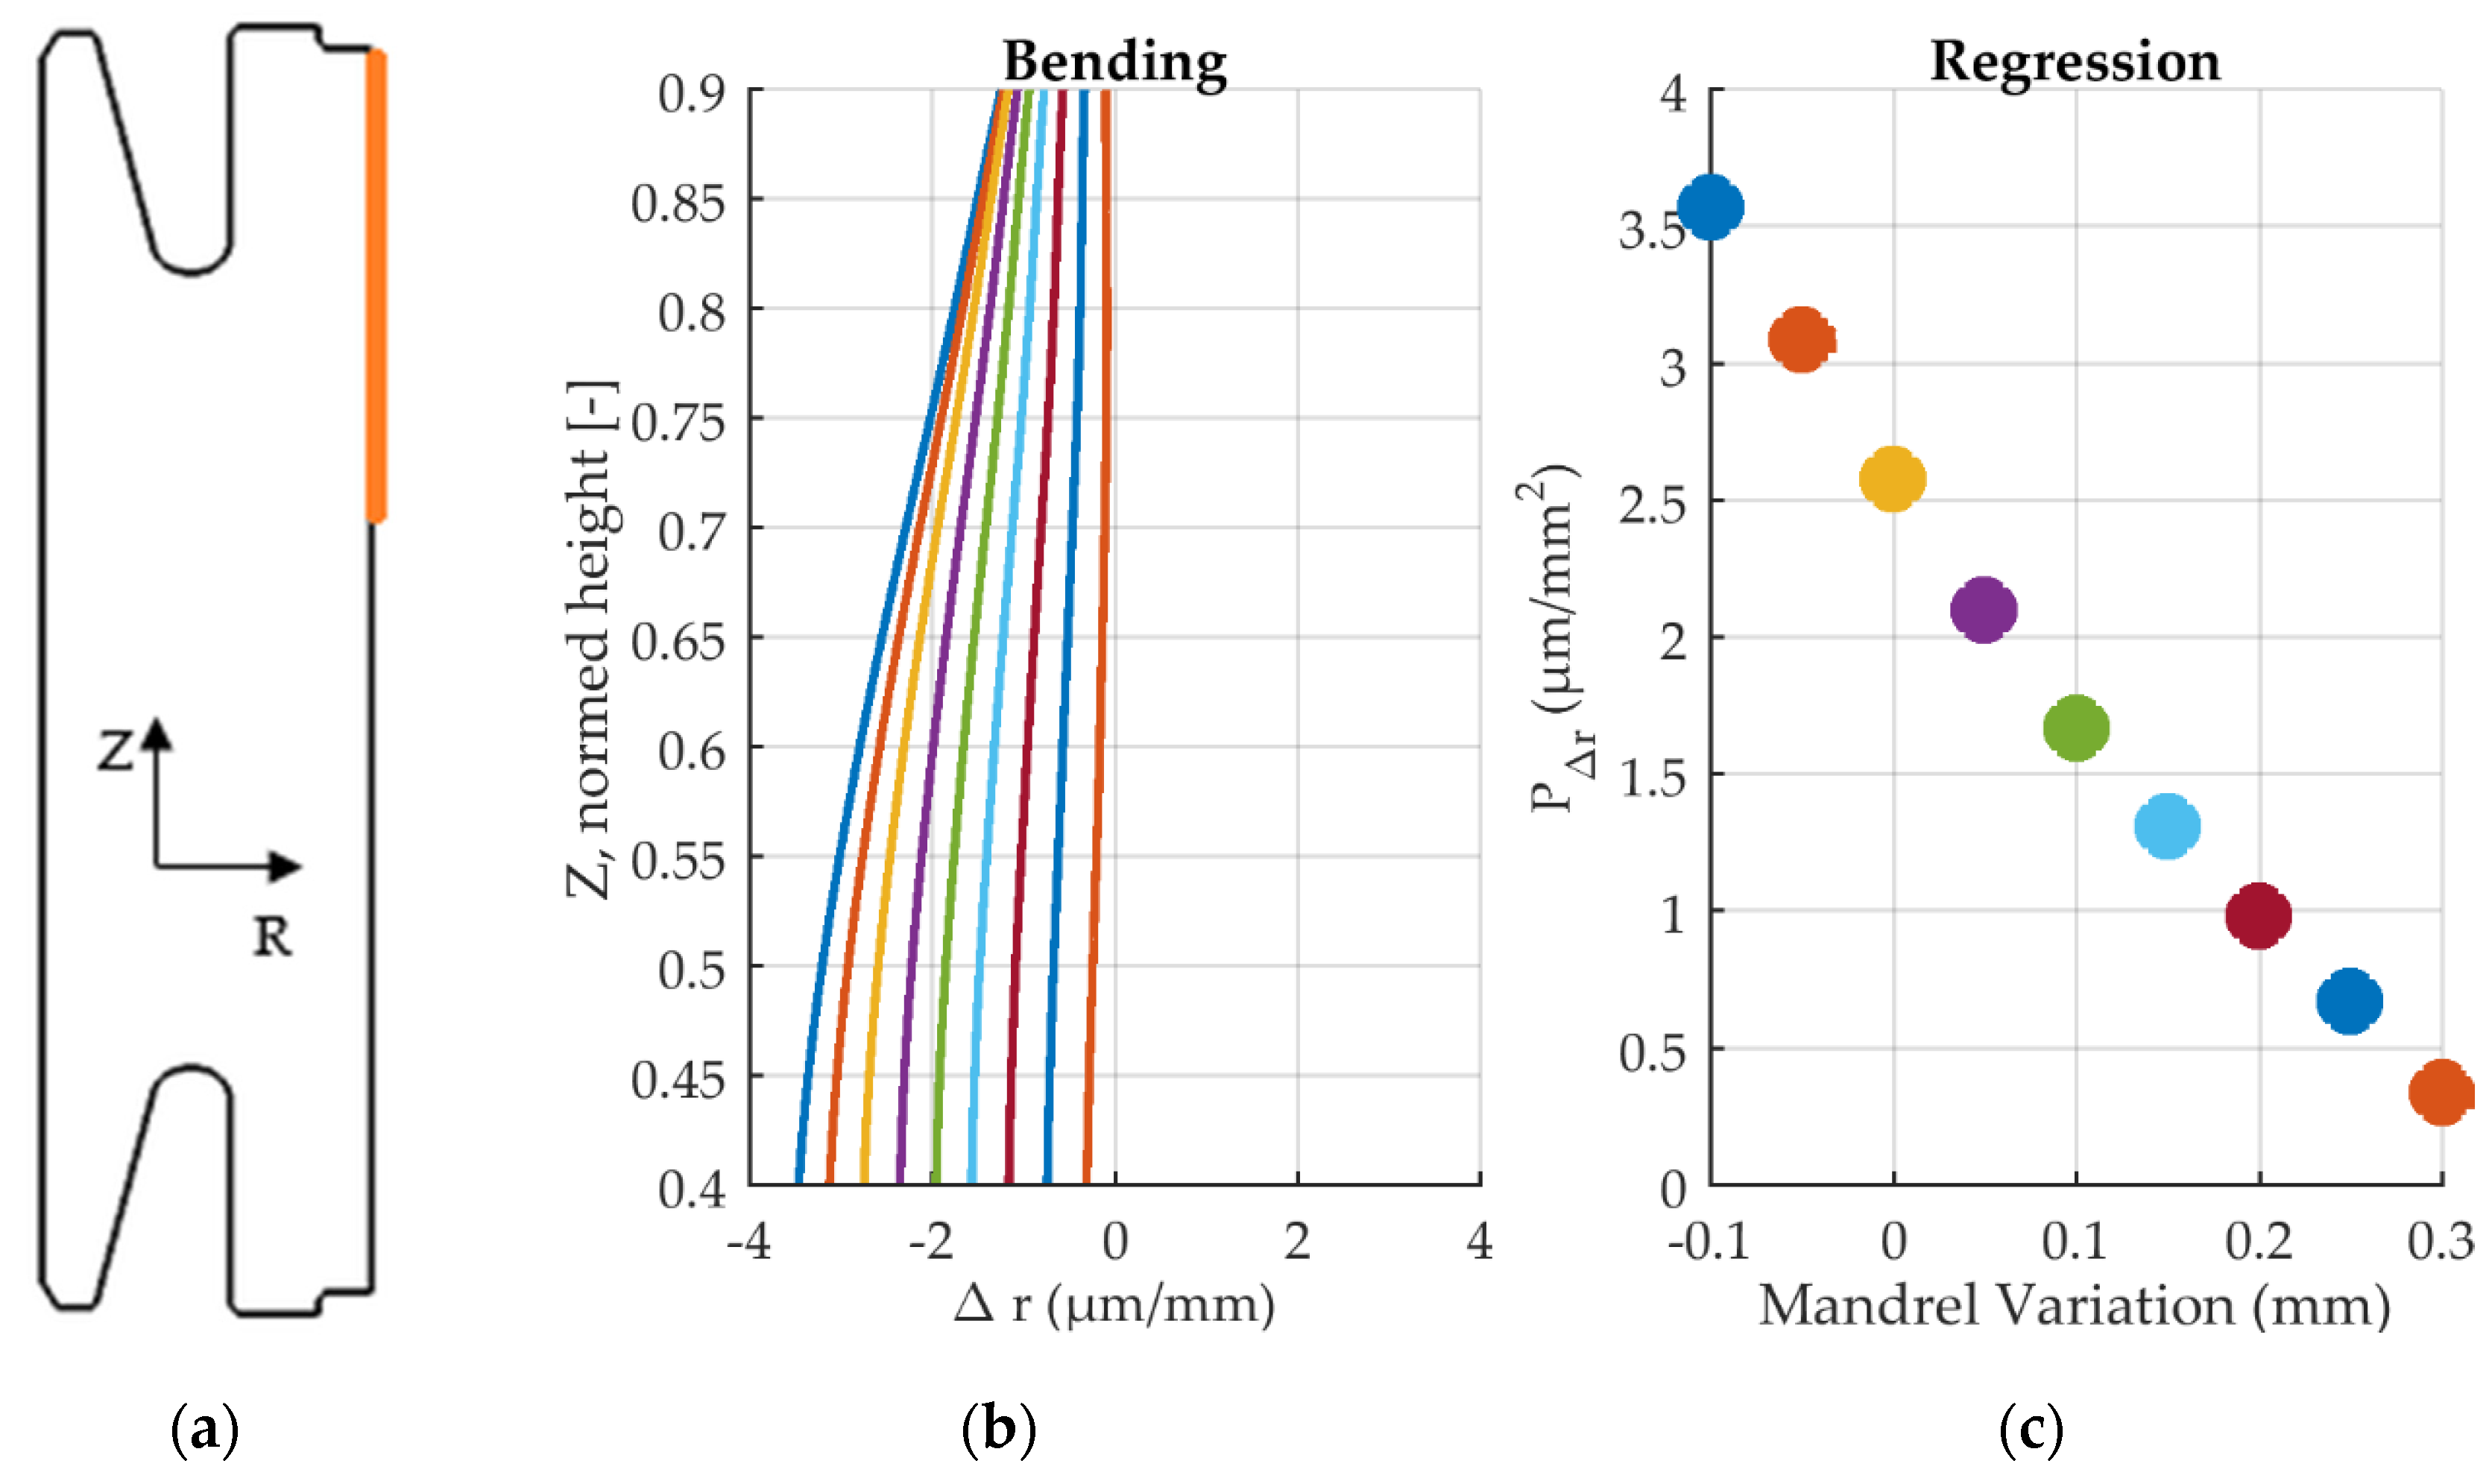
3.2. Comparison of Measured and Simulated Radial Profile
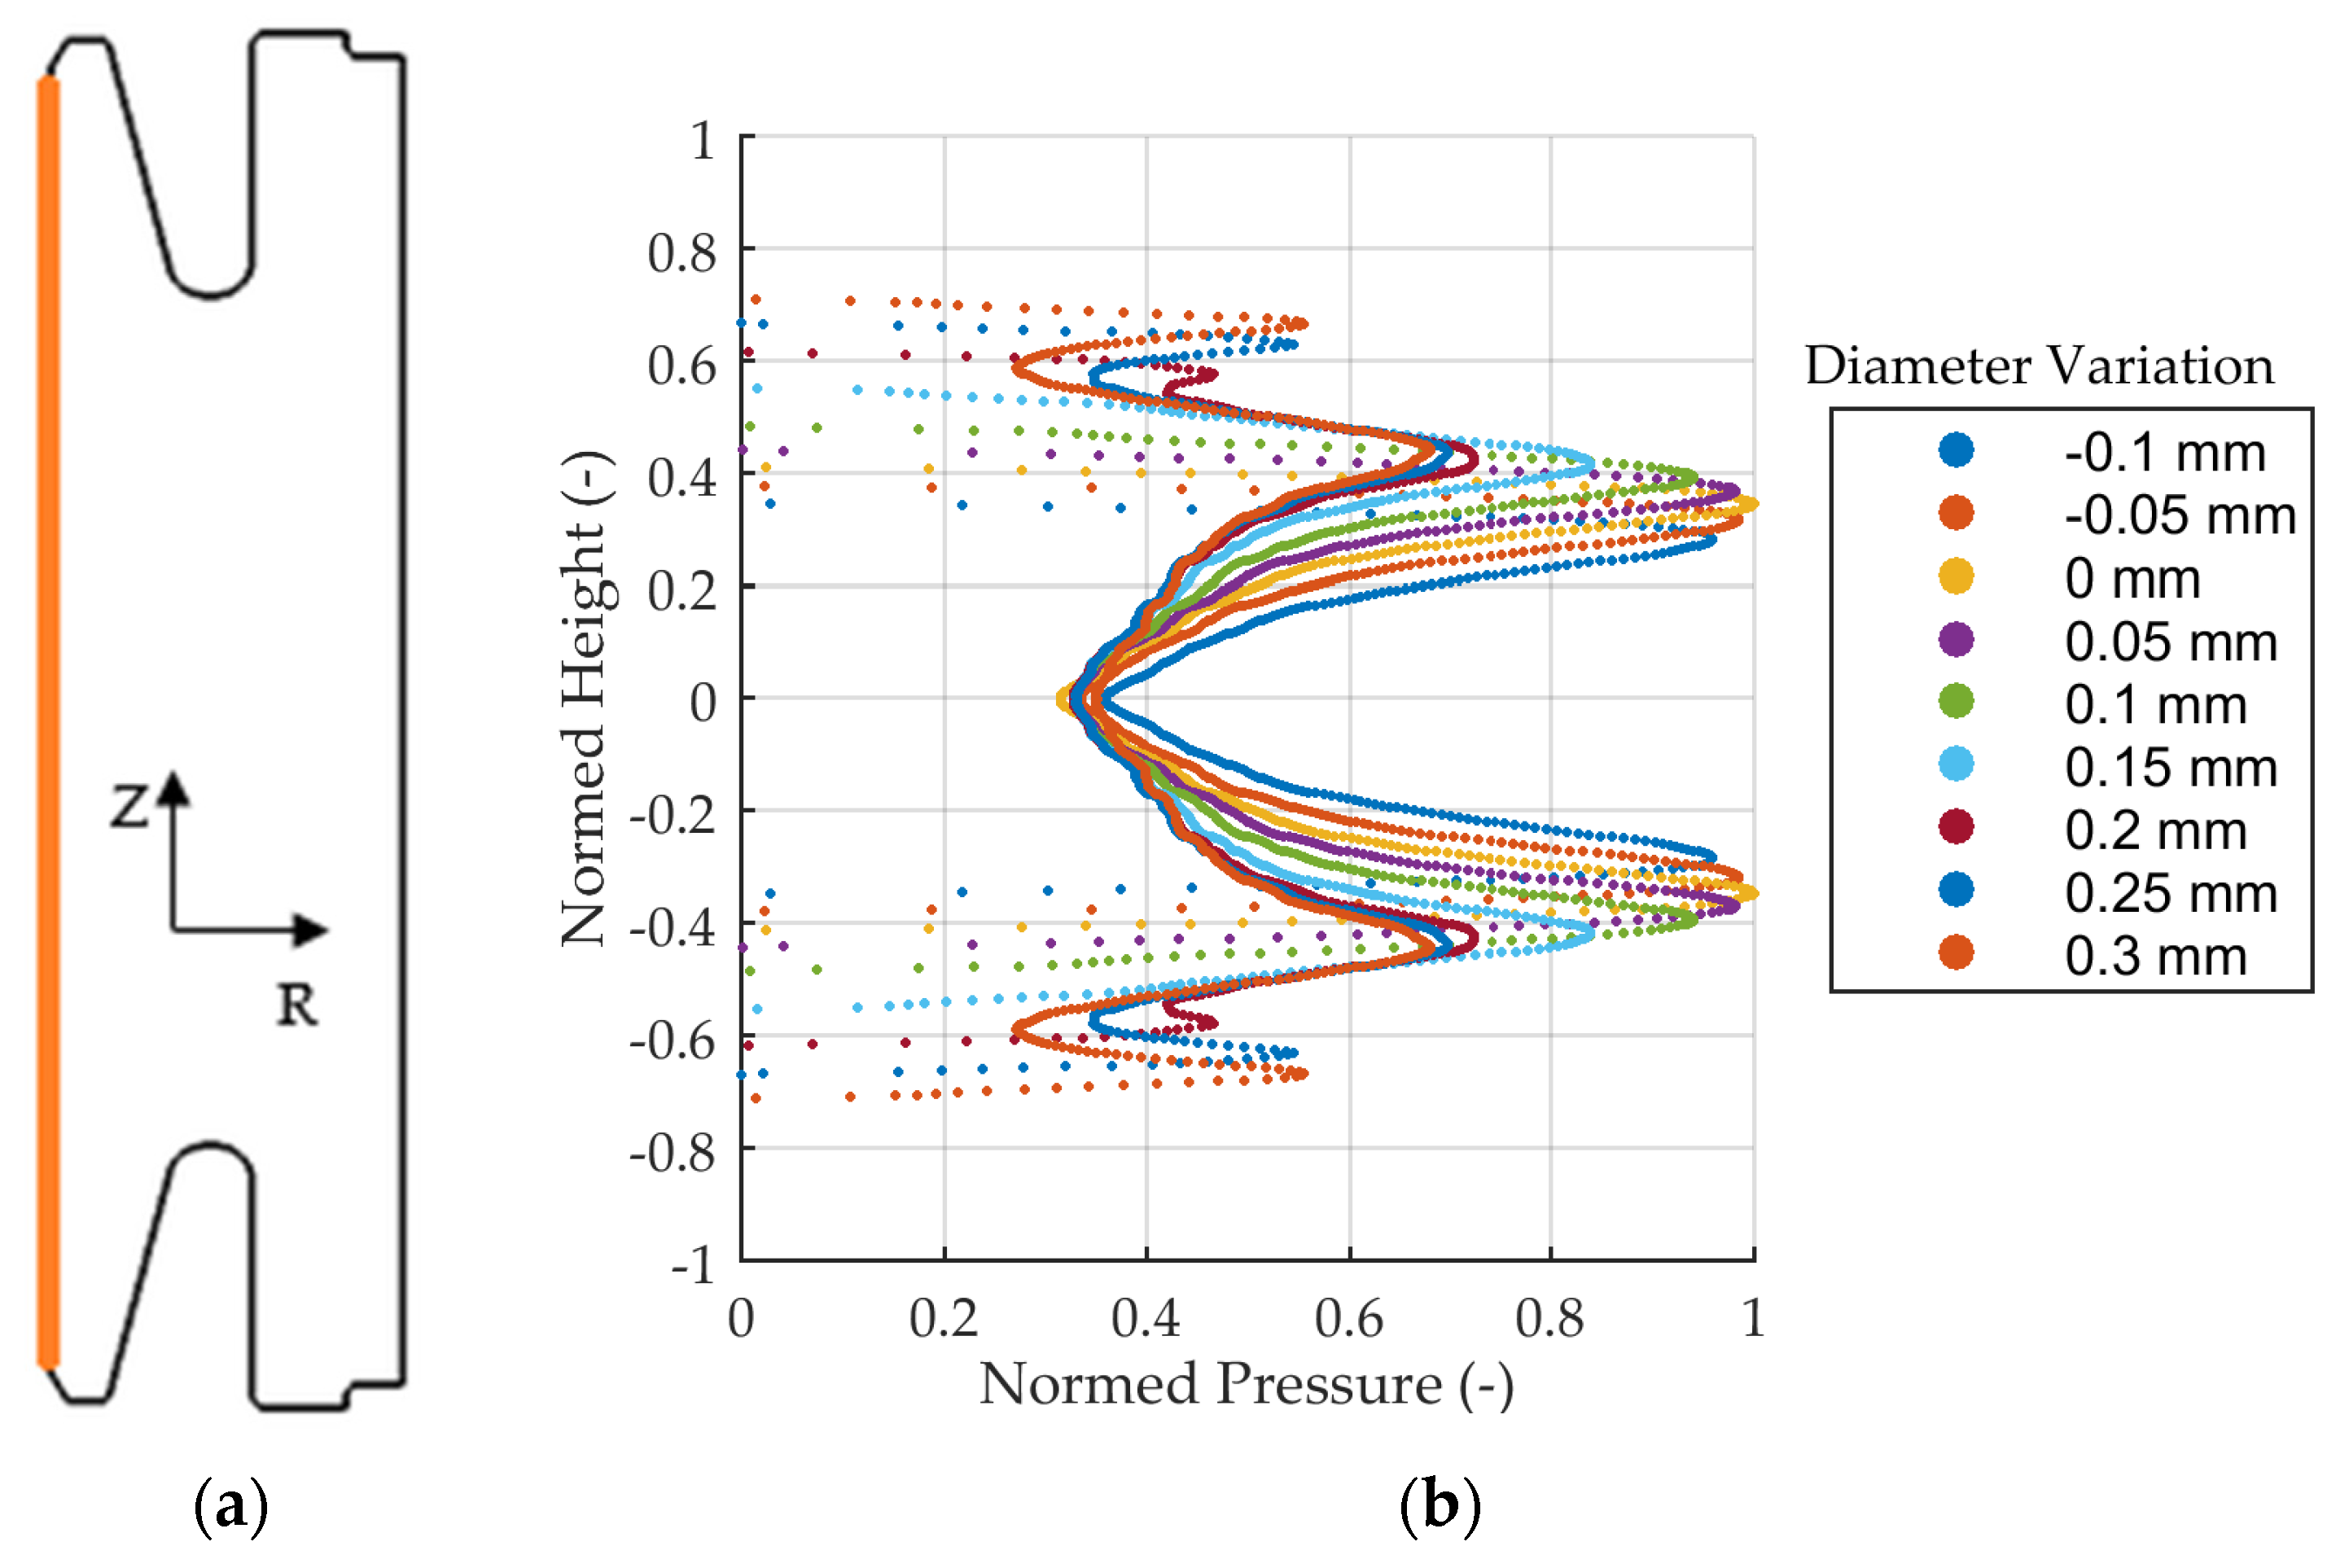
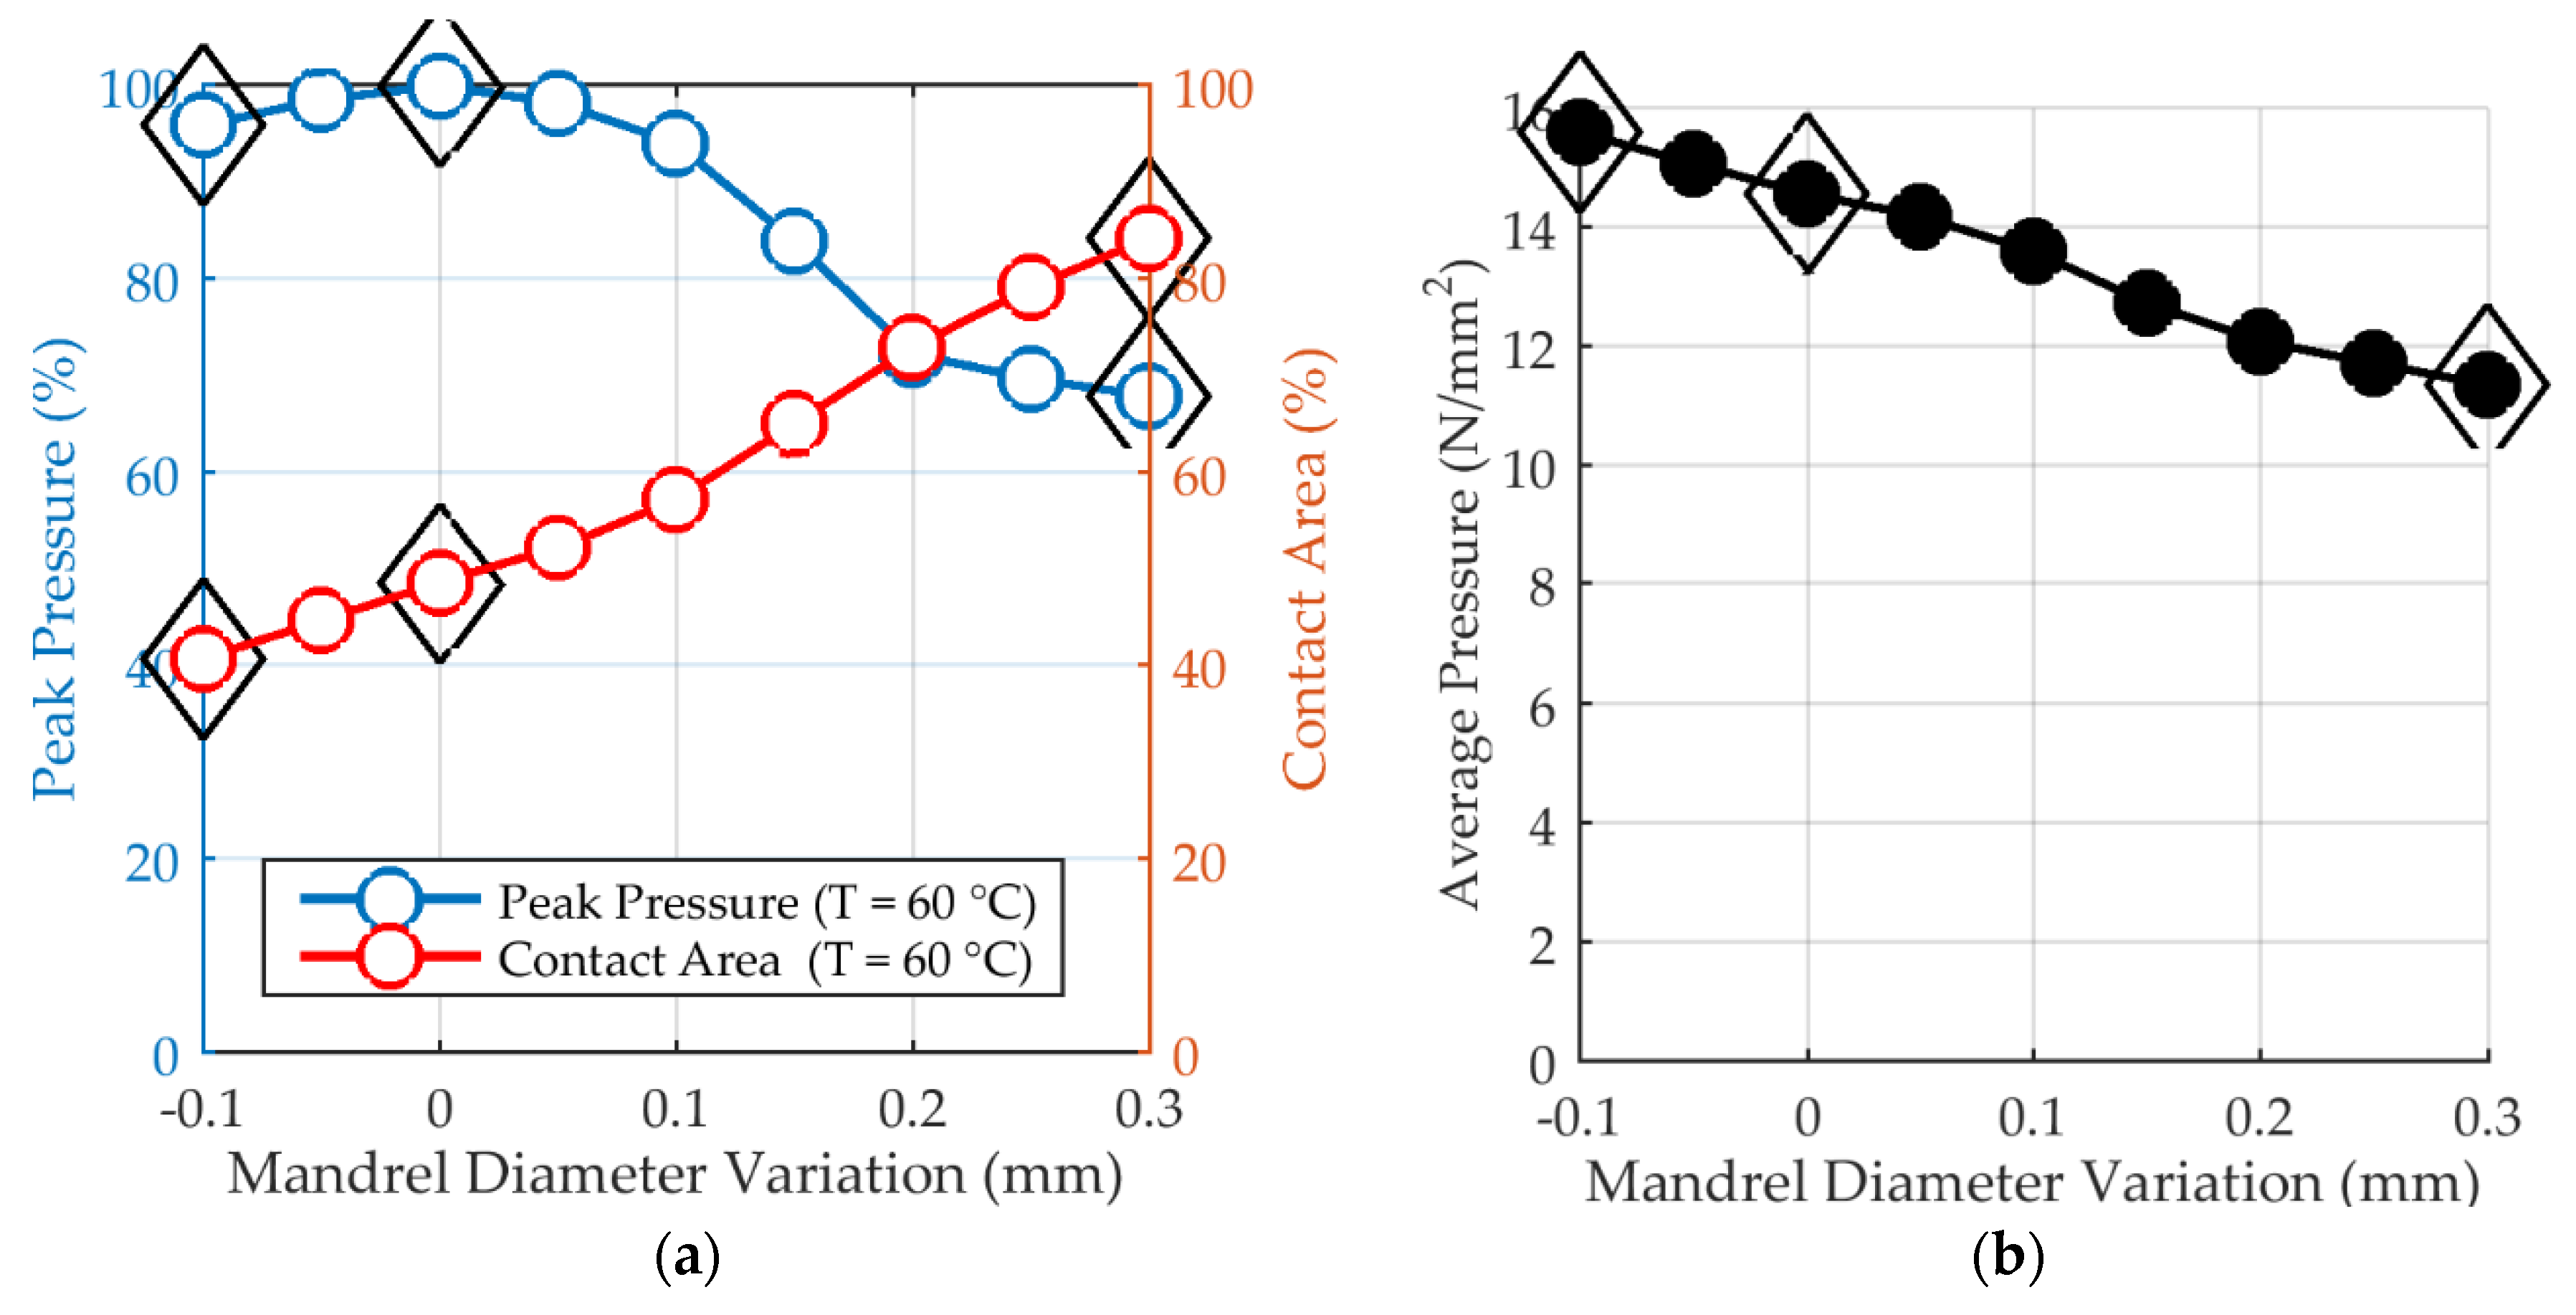
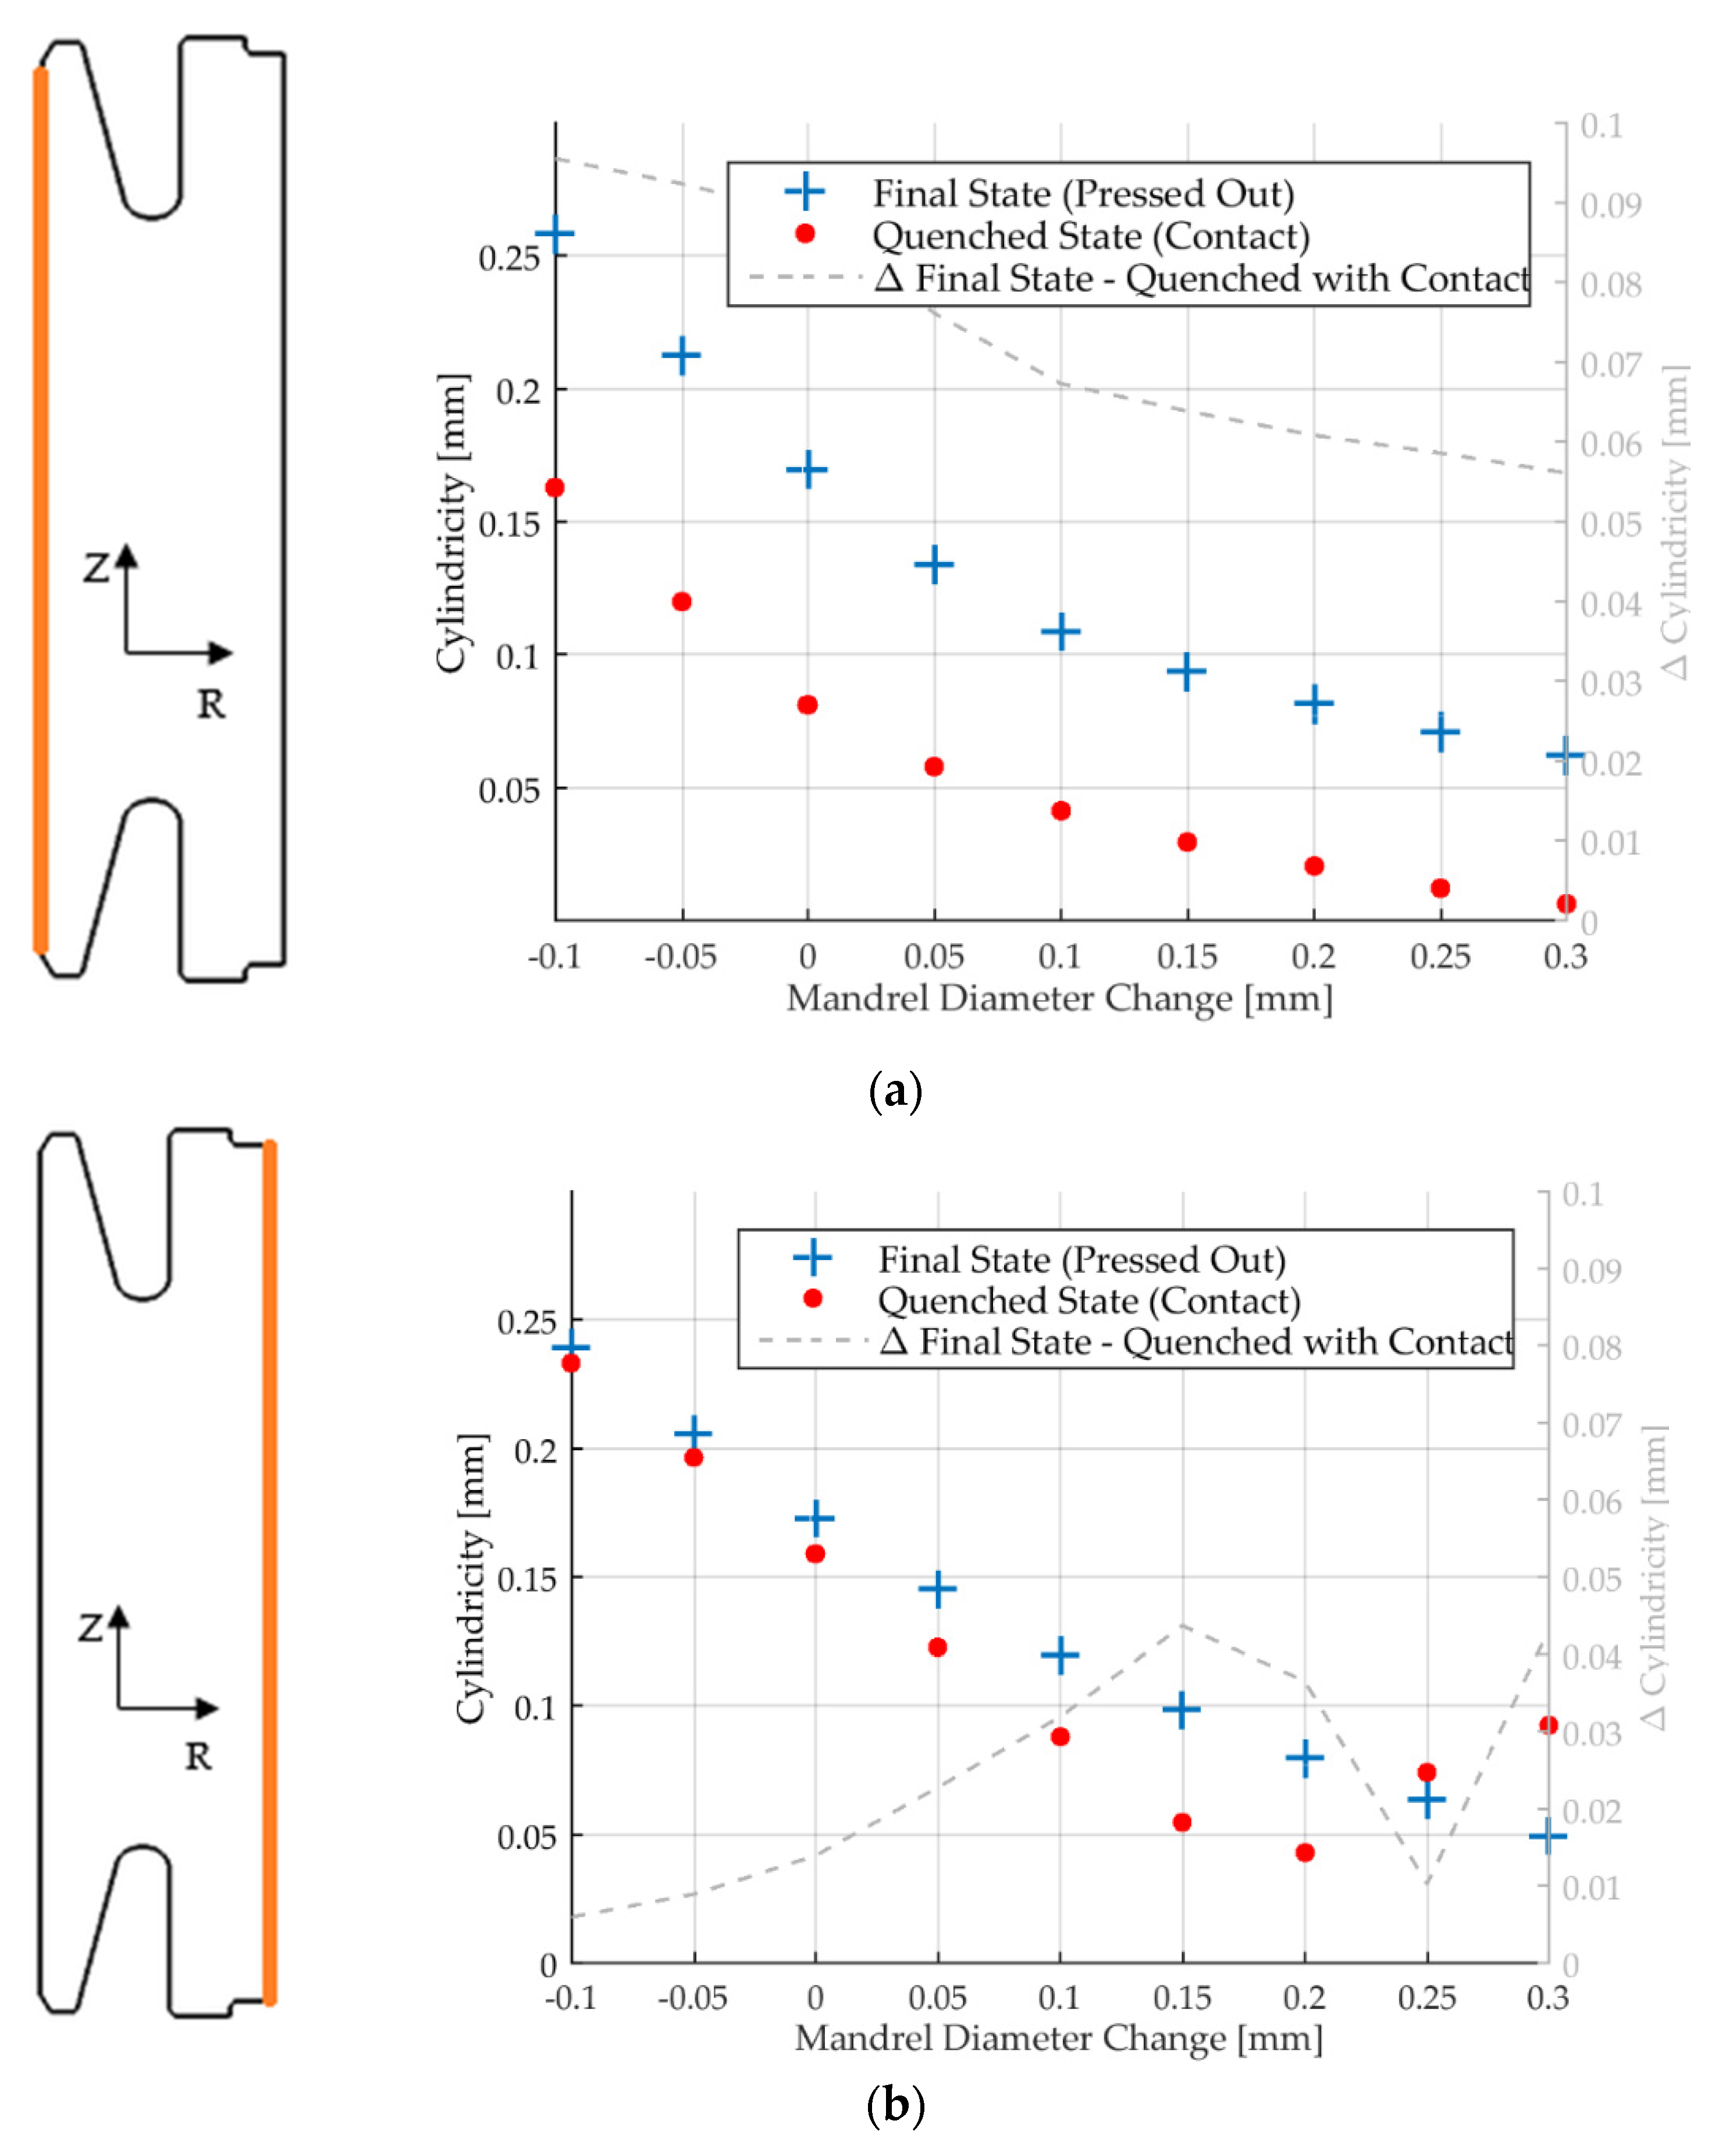
3.3. Influence of Mandrel Diameter
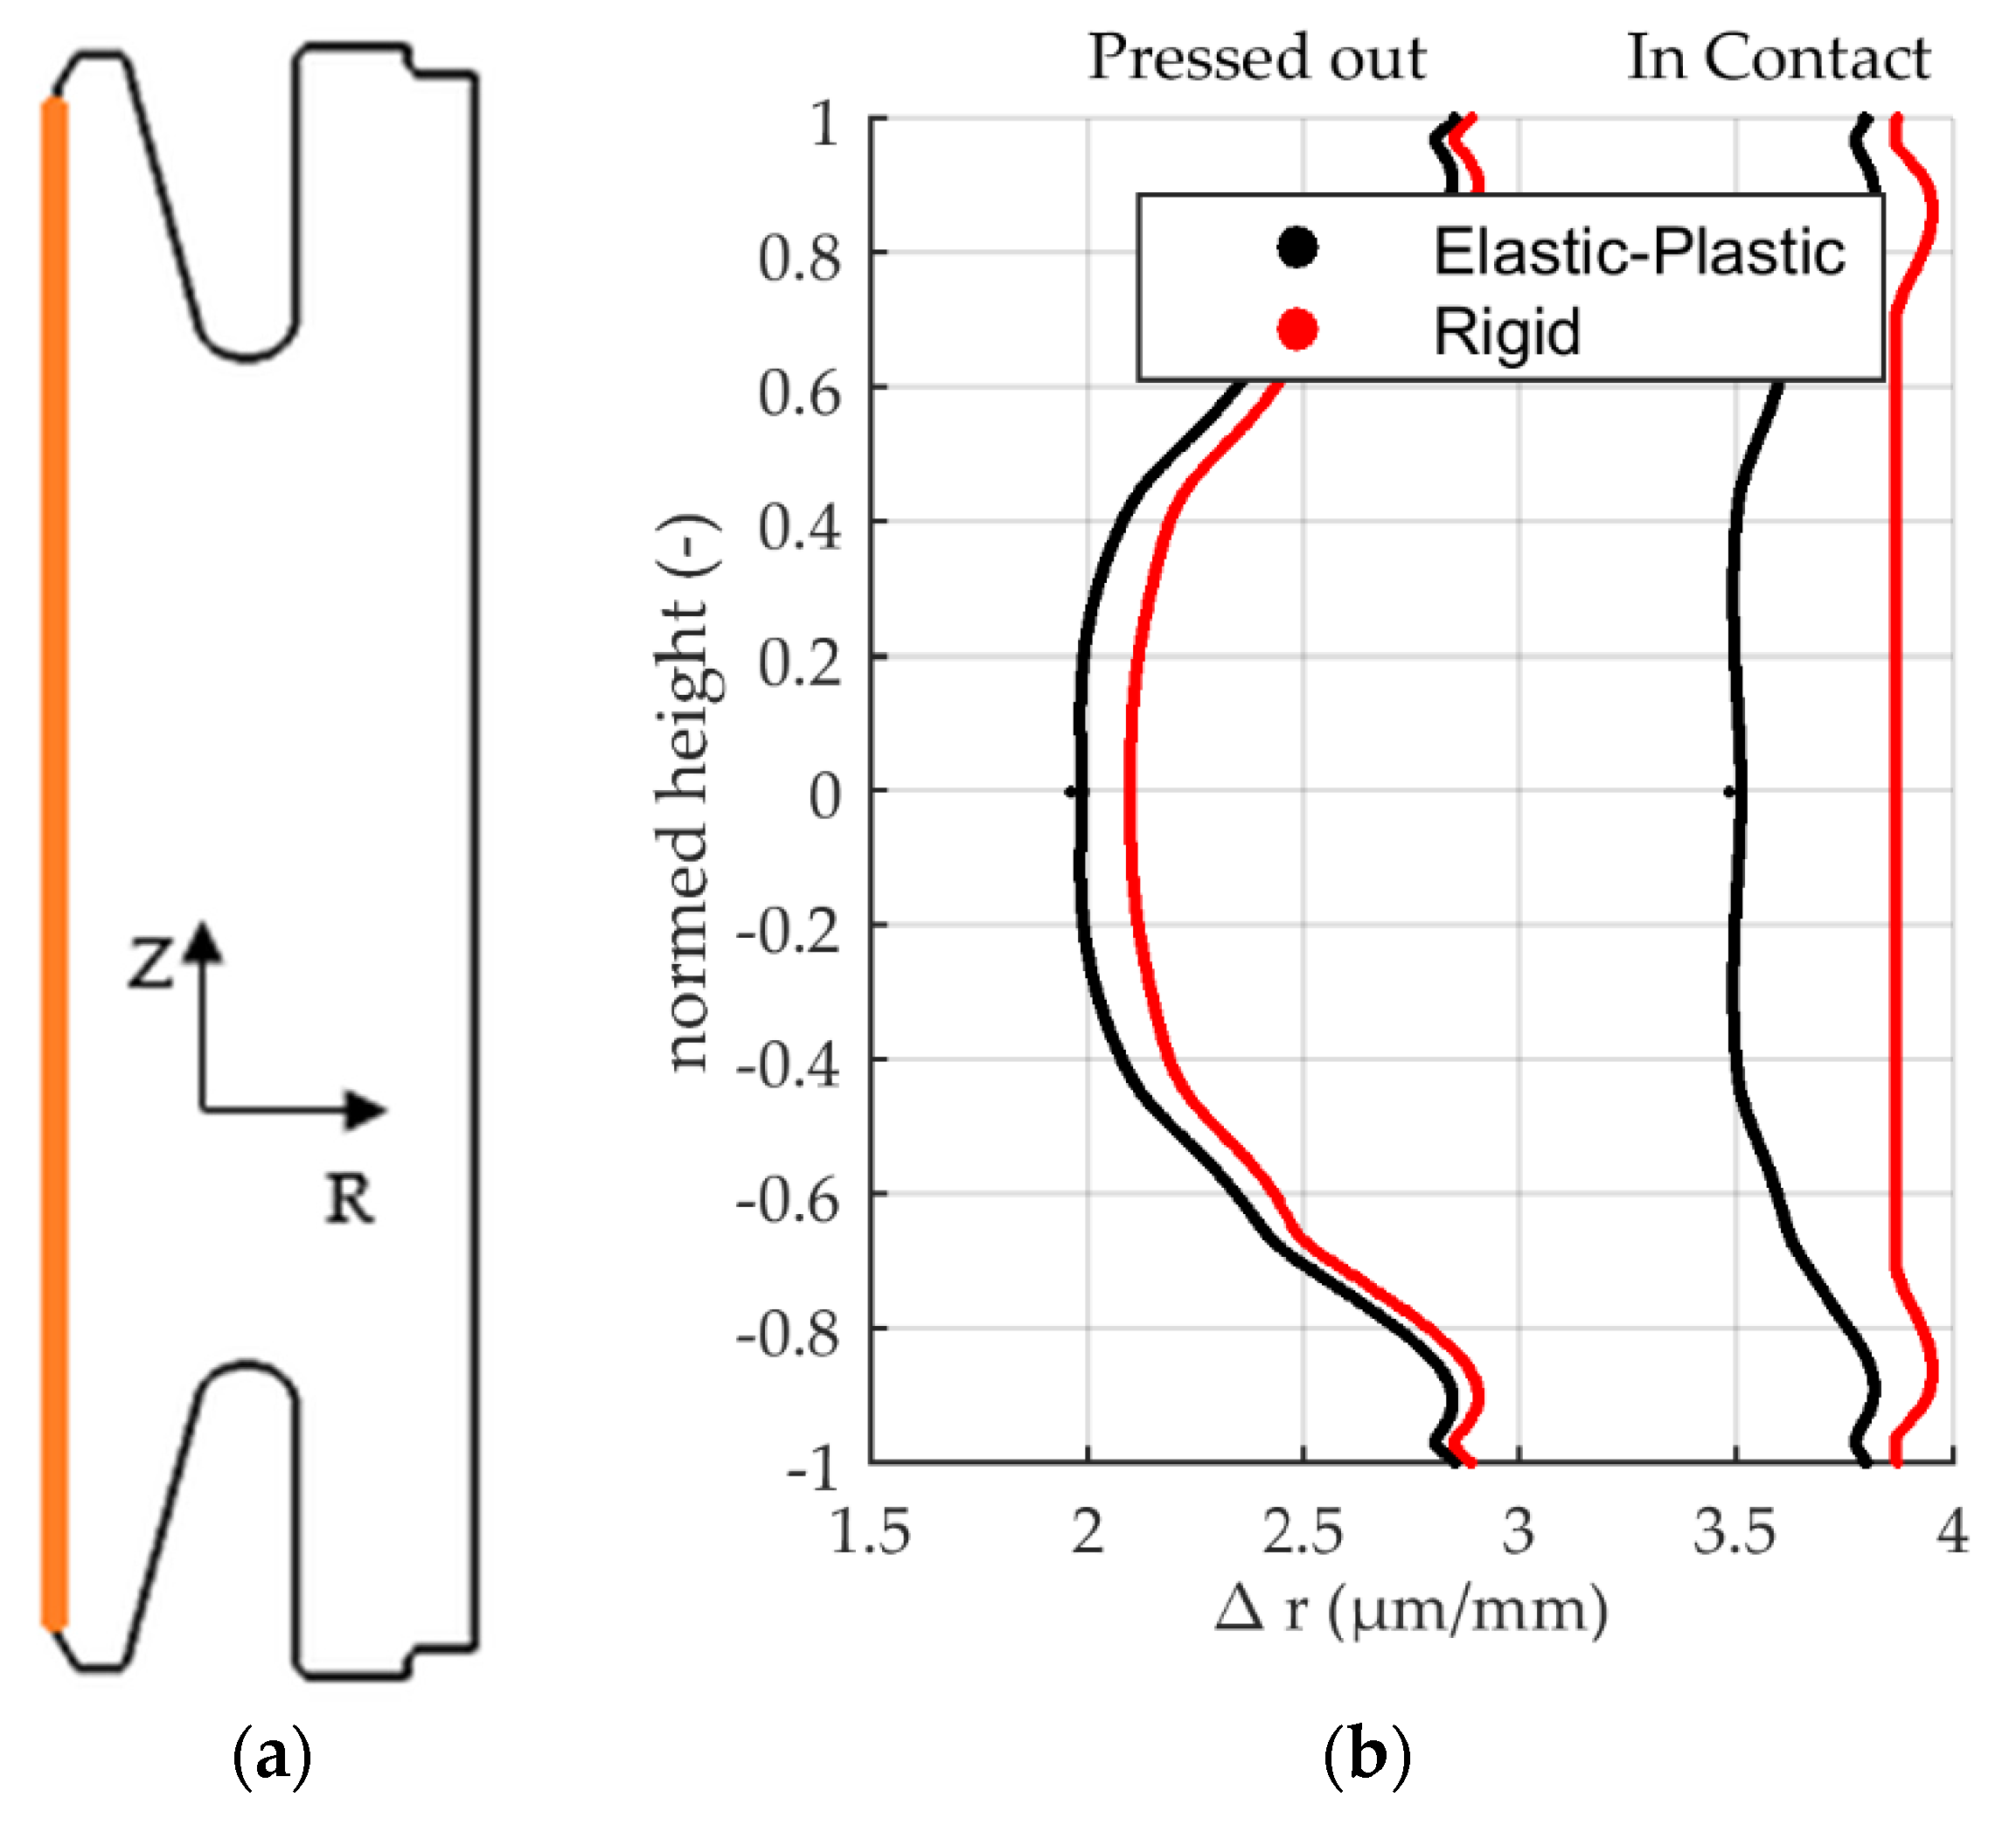
3.4. Influence of Mandrel Properties
4. Summary and Conclusions
5. Concluding Remarks
Author Contributions
Funding
Acknowledgments
Conflicts of Interest
References
- Reardon, A. Press Quenching. In ASM Handbook, Steel Heat Treating Fundamentals and Processes; Dossett, J., Totten, G., Eds.; ASM International: Material park, OH, USA, 2013; Volume 4a. [Google Scholar]
- Boyer, H.E.; Archambault, P.; Moreaux, F. Techniques of Quenching. In Quenching Theory and Technology; Lišcic, B.E.A., Ed.; CRC Press: Boca Raton, FL, USA, 2010; pp. 486–507. [Google Scholar]
- Zhang, Y.; Wang, G.; Shi, W.; Yang, L.; Li, Z. Optimization of Process Parameters for the Axial Distortion and Distortion Range During Die Quenching of a Spiral Bevel Gear. J. Mater. Eng. Perform. 2018, 27, 3803–3811. [Google Scholar] [CrossRef]
- Gur, H.; Pan, J. Handbook of Thermal Process Modeling Steels; CRC Press: Boston, MA, USA, 2001. [Google Scholar]
- Lübben, T. Basics of Distortion and Stress Generation during Heat Treatment. In ASM Handbook Steel Heat Treating Technologies; Dosset, J., Totten, G.E., Eds.; ASM International: Material park, OH, USA, 2014; Volume 48, pp. 339–354. [Google Scholar]
- Streng, T.; Heeß, K.; Lübben, T. Dimensionally and geometrically accurate quenching of ringshaped components in fully-automated hardening presses. In Proceedings of the 19th ASM Heat Treating Society Conference, Cincinatti, OH, USA, 1–4 November 1999. [Google Scholar]
- Birkhofer, H.; Flach, H.; Lübben, T. Optimizing Mandrel Dimensions for a Fixture Hardening Process by Finite-Element-Simulation. In Proceedings of the International Conference on Quenching and Distortion Engineering, Nagoya, Japan, 24–27 November 2018. [Google Scholar]
- Simsir, C. Modeling and Simulation of Steel Heat Treatment—Prediction of Microstructure, Distortion, Residual Stresses, and Cracking. In ASM Handbook, Steal Heat Treating Technologies; Dossett, J., Totten, G.E., Eds.; ASM International: Material park, OH, USA, 2014; Volume 4b, pp. 409–466. [Google Scholar]
- Simsir, C.; Hunkel, M.; Luetjens, J.; Rentsch, R. Process-chain simulation for prediction of the distortion of case-hardened gear blanks. Mater. Werkst. 2012, 43, 163–170. [Google Scholar] [CrossRef]
- Schicchi, D.; Caggiano, A.; Lübben, T.; Hunkel, M.; Hoffmann, F. On the mesoscale fracture initiation criterion of heterogeneous steels during quenching. Mater. Perform. Charact. 2017, 1, 80–104. [Google Scholar] [CrossRef]
- Simsir, C.; Gür, H.C. A FEM based framework for simulation of thermal treatments: Application to steel quenching. Comput. Mater. Sci. 2008, 44, 588–600. [Google Scholar] [CrossRef]
- Avrami, M.A. Kinetics of phase change II, transformation-time relations for random distribution of nuclei. J. Chem. Phys. 1940, 8, 212–224. [Google Scholar] [CrossRef]
- Johnson, W.A.; Mehl, R.F. Reaction kinetics in process of nucleation and growth. Trans. AIME 1939, 135, 416–458. [Google Scholar]
- Leblond, J.B.; Devaux, J.; Devaux, J.C. Mathematical modelling of transformation plasticity in steels I: Case of ideal-plastic phases. Int. J. Plast. 1989, 5, 551–572. [Google Scholar] [CrossRef]
- Koistinen, R.; Marburger, D. A general equation prescribing the extent of the austenite-martensite transformation in pure iron-carbon alloys and plain carbon steels. Acta Metall. 1959, 7, 59. [Google Scholar] [CrossRef]
- Chen, W.F.; Han, D.J. Plasticity for Structural Engineers; Springer: New York, NY, USA, 1988. [Google Scholar]
- Jablonka, A.; Harste, K.; Schwerdtfeger, K. Thermomechanical properties of iron and iron-carbon alloys: Density and thermal contraction. Steel Res. Int. 1991, 62, 24–33. [Google Scholar] [CrossRef]
- Wolff, M.; Böhm, M.; Dalgic, M.; Hüßler, I. Evaluation of models for TRIP and stress-dependent transformation behaviour for the martensitic transformation of the steel 100Cr6. Comput. Mater. Sci. 2008, 43, 108–114. [Google Scholar] [CrossRef]
- Ramberg, W.; Osgood, W.R. Description of Stress Strain Curves by Three Parameters; Technical Note No. 902; National Advisory Committee For Aeronautics: Washington, DC, USA, 1943. [Google Scholar]
- Van Bohemen, S.M. Bainite and martensite start temperature calculated with exponential carbon dependence. Mater. Sci. Technol. 2012, 28, 487–495. [Google Scholar] [CrossRef]
- Franc, R. Numerische Untersuchung des Einflusses von Faserverlauf und Abschreckbedingungen auf das Verzugsverhalten von Scheiben. Diploma Thesis, Universität Bremen, Bremen, Germany, 2012. [Google Scholar]
- Hunkel, M.; Kagathara, J.; Prahl, U. The Influence of Segregations after Forming on the Heat Treatment Result of Bevel Gears. Steel Res. Int. 2019, 90, 1800427. [Google Scholar] [CrossRef]
- Easton, D.; Aylott, C.; Shaw, B.; Rahimi, S. Residual Stresses in Case Hardened Steel Gears. In American Gear Manufacturers Association; Trans Tech Publications Ltd.: Alexandria, VA, USA, 2018. [Google Scholar]
- Kennedy, F.E. Frictional Heating and Contact Temperatures. In Modern Tribology Handbook; Bhushan, B., Ed.; CRC Press: Boca Raton, FL, USA, 2000. [Google Scholar]


| Carbon (wt. %) | ||
|---|---|---|
| 0.17 | 375 | 22.02 |
| 0.3 | 315 | 19.2 |
| 0.5 | 233 | 16 |
| Parameter | Phase | |||
|---|---|---|---|---|
| (MPa) | Austenite | = 825.3 = 2560 | = 0.00255 = 0.002162 | - |
| Martensite | = 3185.6 = 4088.5 | = −3.9725 = −7.96 | - | |
| (-) | Austenite | = 0.116 = 0.409 | = 3.43 × 10−4 = 1.94 × 10⁻³ | = −4.07 × 10−7 = 1.62 × 10⁻⁶ |
| Martensite | = 0.2105 | = −0.2712 × 10⁻³ | - |
| Material Property | Parameter | Phase | |||
|---|---|---|---|---|---|
| Thermal conductivity | () | Austenite | - | ||
| Martensite | −1.343 | ||||
| Specific heat | () | Austenite | - | ||
| Martensite | - | ||||
| Enthalpy | () | Austenite | 7.49 | - | - |
| Martensite | 4.1 | - | - | ||
| Young’s modulus | (MPa) | Austenite | - | ||
| Martensite | - | ||||
| Poisson’s ratio | (-) | Austenite | - | ||
| Martensite | 0 | - | - |
© 2020 by the authors. Licensee MDPI, Basel, Switzerland. This article is an open access article distributed under the terms and conditions of the Creative Commons Attribution (CC BY) license (http://creativecommons.org/licenses/by/4.0/).
Share and Cite
Birkhofer, H.; Lübben, T.; Taylor, B. Optimizing Mandrel Dimensions for a Fixture Hardening Process of High-Strength Steel Aerospace Parts by Finite Element Simulation. Metals 2020, 10, 303. https://doi.org/10.3390/met10030303
Birkhofer H, Lübben T, Taylor B. Optimizing Mandrel Dimensions for a Fixture Hardening Process of High-Strength Steel Aerospace Parts by Finite Element Simulation. Metals. 2020; 10(3):303. https://doi.org/10.3390/met10030303
Chicago/Turabian StyleBirkhofer, Hannes, Thomas Lübben, and Ben Taylor. 2020. "Optimizing Mandrel Dimensions for a Fixture Hardening Process of High-Strength Steel Aerospace Parts by Finite Element Simulation" Metals 10, no. 3: 303. https://doi.org/10.3390/met10030303
APA StyleBirkhofer, H., Lübben, T., & Taylor, B. (2020). Optimizing Mandrel Dimensions for a Fixture Hardening Process of High-Strength Steel Aerospace Parts by Finite Element Simulation. Metals, 10(3), 303. https://doi.org/10.3390/met10030303